ostracism and aggression - uni-trier.de · mood was assessed before and after the cyberball as well...
TRANSCRIPT

Universität Trier Fachbereich I - Psychologie Studiengang Diplompsychologie
Ostracism and Aggression
Influence of increasing provocation by peers
on aggressive behaviour
after acute experience of ostracism
Diplomarbeit von Angelika Dierolf
Matrikelnummer: 830677
Betreuung: Dr. Ewald Naumann em. Prof. Dr. Dieter Bartussek Trier, Februar 2010

ii
Für die (zu vielen) Verluste des vergangenen Jahres
(in chronologischer Reihenfolge)
Don Carlos- der Arme
Flachkatze- die Harfenspielerin
Franziska- die Tapfere
Meine geliebte Mutter (Du bist die Beste, Mama! N.Ö.F.F.mult)
Monika- ein wenig viel DIE Katze
Susanne- die ewig Geduldige
Maurice- der Nerd
Bis wir uns wieder sehen.

iii
Index
Index ...................................................................................................... iii
Index of Figures ....................................................................................... vi
Index of Tables........................................................................................ vii
Index of Tables of the Appendix.............................................................. vii
Abstract .................................................................................................. viii
1. Introduction .................................................................................. 1
2. Theoretical background................................................................. 3
2.1. Exclusion and its different forms ............................................................3
2.2. A model of ostracism ............................................................................5
2.3. Paradigms and manipulations of ostracism, social exclusion, and rejection 6
2.4. Ostracism and needs ............................................................................9
2.5. Ostracism and mood........................................................................... 12
2.6. Experimental studies: consequences of ostracism on needs and mood.... 13
2.6.1. Experimental studies: needs ........................................................ 13
2.6.2. Experimental studies: mood......................................................... 14
2.7. Short-term reaction: coping with ostracism, rejection or social exclusion. 15
2.7.1. Ostracism and aggression ............................................................ 15
2.7.2. Experimental studies: ostracism and aggression ............................ 18
2.7.3. Ostracism and prosocial behaviour ............................................... 20
2.7.4. Experimental studies: how to inhibit aggression after exclusion....... 21
2.8. Mediators between ostracism and its responses .................................... 22
3. Hypotheses .................................................................................. 25
4. Material and Methods .................................................................. 26
4.1. Participants........................................................................................ 26
4.2. Materials............................................................................................ 26

iv
4.2.1. Pre-experimental questionnaires................................................... 26
4.2.2. State questionnaire ..................................................................... 27
4.2.3. The Cyberball ............................................................................. 27
4.2.4. Taylor Aggression Paradigm......................................................... 28
4.2.5. Post-experimental questionnaires ................................................. 31
4.3. Procedure .......................................................................................... 31
4.4. Statistical analysis .............................................................................. 32
5. Results......................................................................................... 34
5.1. Manipulation check............................................................................. 34
5.1.1. Ostracism................................................................................... 34
5.1.2. Provocation ................................................................................ 35
Results concerning the hypotheses......................................................... 36
5.2. Hypothesis I: Threat of needs ............................................................. 37
5.3. Hypothesis II: Ostracism and aggressive behaviour............................... 37
5.3.1. Ostracism and aggressive behaviour in the TAP............................. 38
5.3.2. Additional analysis: further results of TAP money version ............... 42
5.3.3. Ostracism and evaluation of the opponents and self-reported future
settings in the TAP...................................................................... 43
5.4. Hypotheses III: Mood ......................................................................... 45
5.4.1. Mood measured with the PANAS .................................................. 45
5.4.2. Mood measured with the post-experimental questionnaire.............. 47
5.5. Hypothesis IV: Mediation of mood between ostracism and aggressive
behaviour .......................................................................................... 50
5.6. Hypothesis V: Mediation of dispositional factors between ostracism and
aggressive behaviour .......................................................................... 50
5.7. Explorative analyses of the relationship between dispositional factors and
aggressive behaviour in the TAP .......................................................... 50
6. Discussion.................................................................................... 52
6.1. Ostracism threaten four fundamental needs ......................................... 52
6.2. Ostracism leads to enhanced aggressive behaviour ............................... 53

v
6.2.1. TAP ........................................................................................... 53
6.2.2. Evaluation of the team-mate and future settings in the TAP............ 58
Future settings in the TAP............................................................ 58
6.3. Ostracism-induced changes in mood .................................................... 59
6.3.1. Results of self-reported mood measured with the PANAS ............... 59
6.3.2. Results of self-reported mood measured with the post-experimental
questionnaire.............................................................................. 59
6.4. Mediation between ostracism and aggressive behaviour by mood and by
dispositional Factors ........................................................................... 60
6.5. Explorative analyses of the relationship between dispositional factors and
aggressive behaviour in the TAP .......................................................... 60
6.6. Conclusion and outlook ....................................................................... 61
Reference List.......................................................................................... 63
Appendix: ...................................................................................................I

vi
Index of Figures
Figure 1: Cyberball- icons and Arrangement of the Player...............................................28
Figure 2: Setting for an Exemplary Trail of the TAP;.......................................................29
Figure 3: Procedure of the Study ..................................................................................32
Figure 4: Manipulation Check: Provocation in TAP, Left: Noise Version; Right: Money
Version ..........................................................................................................36
Figure 5: Influence of Ostracism on Self- reported Levels of Needs .................................37
Figure 6: TAP Both Versions; Interaction between Inclusionary Status, Provocation and TAP
Block .............................................................................................................38
Figure 7: TAP Noise Version: Influence of Inclusionary Status on Aggressive Behaviour ...40
Figure 8: TAP Money Version: Influence of Inclusionary Status and Provocation on
Aggressive Behaviour .....................................................................................42
Figure 9: TAP Money Version: Influence of Sex on Aggressive behaviour.........................43
Figure 10: Influence of Inclusionary Status and Provocation on Liking the Team-mate .....44
Figure 11: Influence of Inclusionary Status on Self-reported Anger, Anxiety and Enjoyment
(Post-experimental Questionnaire) ..................................................................48

vii
Index of Tables
Table 1: Manipulation Check; the Effect of Ostracism on Feeling of Rejection and Inclusion
and on the Perception of Received Balls .............................................................34
Table 2: Manipulation Check: Influence of Increasing Provocation an Aggressive Behaviour
in Block 1−3 in Both Version..............................................................................35
Table 3: TAP; Relationship between Inclusionary Status and Aggressive Behaviour in the
First Trial, Bock 1, 2 and 3.................................................................................38
Table 4: TAP Money Version; Interaction between Sex and Ostracism.............................41
Table 5: TAP Money Version; Relationship between Inclusionary Status and Aggressive
Behaviour in the First Trial, Block 1, 2 and 3.......................................................41
Table 6: Main Effect of Provocation on Self reported Anger about the TAP, Both Versions;
Post-experiment Questionnaire ..........................................................................45
Table 7: Interaction between Inclusionary Status and Measurement Point 2 and 3 of PANAS
Positive and Negative Affect as well as Anger .....................................................46
Index of Tables of the Appendix
Table 1: Correlation of Inclusionary Status with Trait Variables of Anger, Aggression and
Stress................................................................................................................. I
Table 2: Correlation between Aggressive Behaviour in the TAP and Dispositional Aggression
Bias (Measured with "FAF"); Ostracized Participants.............................................II
Table 3: Correlation between Aggressive Behaviour in the TAP and Dispositional
Aggression Bias (Measured with "FAF"); Included Participants .............................III
Table 4:Correlation between Aggressive Behaviour in the TAP and Dispositional Aggression
Bias (Measured with "STAXI"); Ostracized Pparticipants ...................................... IV
Table 5: Correlation between Aggressive Behaviour in the TAP and Dispositional Aggression
Bias (Measured with "STAXI"); Included Participants............................................ V
Table 6: Correlation between Aggressive Behaviour in the TAP and Dispositional Factors
(Responsibility and Revenge); Ostracized and Included Participants ..................... VI
Table 7: Correlation between Aggressive Behaviour in the TAP and Dispositional Stress
Bias (Measured with "SRS"); Ostracized participants ..........................................VII
Table 8: Correlation between Aggressive Behaviour in the TAP and Dispositional Stress
Bias (Measured with "SRS");Iincluded participants ............................................VIII

viii
Abstract
The desire for positive social relationships is one of the most fundamental and universal of
human needs. Failure to satisfy this need can have devastating consequences for person
concerned. Being excluded, socially rejected or ostracized threaten social connectedness
and feeling of belonging and consequently are a very aversive and painful experience.
Recent research has shown that this experience could lead to negative feelings and
aggressive behaviour.
The present study investigated the effects of ostracism and constantly increasing levels of
provocation on two different types of aggressive behavior and on emotions. Additionally,
the relationship between dispositional factors concerning anger, aggression and stress and
ostracism were explored concerning their influence on aggressive behaviour. Participants
were either ostracized or included in computer game of ball tossing (Cyberball), and then
exposed to either increasing or constantly mildly provocation in a setting of either a series
of blasts of aversive noise or deduction of money (two versions of the Taylor Aggression
Paradigm). Aggression was defined as the mean response to the provocation - either
volume and duration of the noise set for the opponent or the amount of deducted money.
Mood was assessed before and after the Cyberball as well as after the provocation-
aggression paradigm. Participants were mainly student of their first year, which were peers
but not friend with each other.
In line with previous studies increased anger and aggression were found after provocation.
Effects of ostracism on aggression, however, were dependent on (1) the type of aggressive
behaviour, (2) the level of provocation, and (3) the participants' sex. Ostracism tended to
result in more aggressive behaviour, led to increase feelings of anger and to decrease in
needs of belonging, self-esteem, control and meaningful existence. In combination with
high physical provocation by peers, aggressive behaviour declined. Learned helplessness or
the social contact to important candidates of future peer group might explain these results.
Moreover, peer ostracism enhances risk taking behaviour in males causing monetary harm
to the ostracizing peers, but decreases risk taking in females.
Further separate investigations of influence of provocation and important social contacts
with anticipated further connections are necessary. Nevertheless, these results support
recent findings, which showed on the one hand the desire of ostracized individuals to form
new relationships and on the other the possibility to prevent aggressive behaviour by social
contacts, imagined or experienced. The importance of positive social connections should be
considered more carefully in early intervention programs.

1
1. Introduction
Humans are essentially social creatures. We have not only a strong desire for positive and
lasting relationships, but the need to belong is among the most pervasive and fundamental
motives (For a review see Baumeister & Leary, 1995). From an evolutionary point of view
being a member of a group assures the survival of an individual, as only a group could
guarantee that all members have food, shelter and safety. Being rejected and repulsed
from one’s group would have been a death sentence and the life of a social outcast would
have been brutal and brief. Today in our modern world, we are quite able to fend for
ourselves and do not depend on close relationships to survive. Nevertheless, we attach
great importance to family, lovers, friends, colleagues and acquaintances. If we do not
receive an answer on our email, wait hours and days for a recall, are stood up by our lover,
are not invited to a party, do not get the job we’d apply for, or just receive the feedback
that our presents is undesired, we are at least astonished or even hurt.
As these examples show, exclusion can occur in a variety of different forms and everyone
has had experiences with social exclusion. Most of us have been teased, excluded or even
bullied by peers from infancy to adolescence. Moreover, we experienced this treatment as
very aversive and painful. Williams stated, that “few events in life are more painful than
feeling that others, especially those whom we admire and care about, want nothing to do
with us.” (Williams, 2001, p.1). The prevalence of adults indicates that all individuals will
be both a target and a source of some form of social exclusion and rejection within almost
all sorts of relationships and social bonds (Williams, Forgas, von Hippel, & Zadro, 2005).
Indeed, 67% of representative US sample admitted using the silent treatment on a loved
one, and 75% indicated that they had been a target of the silent treatment by a loved one
(Faulkner, Williams, Sherman, & Williams, 1997).
The function of exclusion is to bring individuals, who deviate from other’s expectations
back into fold or expel him or her altogether (Williams, 2001). By the means of anticipated
or actual repulse, a control of contranormative behaviour is achieved and group norms or
individual integrity are maintained. How do targets of exclusion react in response to this
unpleasant and aversive treatment? As mentioned above, in the first instance we are hurt,
but what about our behaviour? Do we try to re-establish the shattered relationship, do we
seek to find new social connections or do we try harm in return those who hurt us by
rejection?
Recent research has shown that being excluded might lead to negative feelings and
aggressive behaviour. Common observation suggests that people often become angry and
even aggressive, when they feel rejected or excluded by others. The Office of Surgeon

2
General stated in their report 2001, which reviewed research on the causes of youth
violence, that social isolation was the most significant risk factor for adolescent violent
behaviour. Moreover, consequences of being the target of exclusion assume alarming
proportions. In a careful case study about perpetrators of school shootings Leary, Kowalski,
Smith, & Phillips (2003) revealed that most of the shooters previously suffered from both
acute and chronic social rejection, such as ostracism, bullying, or social harassments by
peers or relationship partners. Makepeace (1989) found out that rejection accounted for
15% of the violent episodes for dating couples who were dating steadily and 11% for
those who were living together. This may underestimate the role of rejection in violence of
dating couples, as jealousy, clearly a feeling caused in part by rejection, accounted for
further 20% of violent episodes. Leary, Twenge, & Quinlivan (2006) in their review of
rejection as antecedence of aggressive behaviour depicts many other cases in which any
form of rejection lead to aggression, like for example homicides, gang violence, peer
rejection and parental rejection. They conclude that interpersonal rejection affects
aggressive behaviour and mediators of aggression as anger and derogation of others.
Yet, despite the far reaching implications of social exclusion on both the target of exclusion
and on society as a whole, only in the last decade did that social psychology begin to
consider social exclusion as an area worthy of investigation. This resulted in a rise of new
theories concerning the nature of social exclusion, new models on which to base
experimental research, and new paradigms that provide innovative ways to explore the
effects of being a target of social exclusion. Fortunately, this renaissance of this issue of
investigation has entailed a multi-method approach, which has led to a broader
understanding of the complexity of nature, causes and consequences of social exclusion.
Several laboratory studies found a causal connection between various forms of exclusion
and aggressive behaviour (e.g.: Twenge, Baumeister, Tice, & Stucke, 2001; Twenge,
Baumeister, DeWall, Ciarocco, & Bartels, 2007a; Twenge, Zhang, Catanese, Dolan-Pascoe,
Lyche, & Baumeister, 2007; Warburton, Williams, & Cairns, 2006). However, despite the
recent increase of research of this topic, still it is still not clear which dispositional and
situational factors bring the target of exclusion to harm other individuals.
The aim of the present study is to further investigate the connection between ostracism
and aggressive behaviour and possible moderating dispositional factors concerning trait
levels of stress, anger and aggression and a situational factor of increasing provocation.
First the theoretical background and empirical studies of exclusion and aggression are
presented, which lead to the aim of the present study. Chapter 3 contains materials and
methods. Subsequently, the results are presented and discussed in detail.
3
2. Theoretical background
In the following chapter the different forms of exclusion and the various methods for their
realisation in experimental studies are presented. Afterwards, by the means of the model
of ostracism from Williams (1997, 2001) the direct consequences and effects on four needs
and emotions as well as the empirical support of Williams’ assumptions are constituted.
Then, two theoretically contradictory ostracized-induced (respectively rejection- or socially-
excluded-induced) behaviour short-term reactions, namely aggressive and prosocial
behaviour, are presented. A review and overlook of the present research of emotional and
behavioural effects of exclusion are given. Finally, the aim of the present study and the
hypotheses are explained.
2.1. Exclusion and its different forms
As discussed in the introduction, exclusion in social environment functions mainly as a
method to control contranormative behaviour. This sanction of undesired behaviour can be
achieved in different ways. The source of exclusion can either declare the banishment of
the target, possibly reinforced with physical abuse, or just ignore him or her without
further explanations. Duration and reach into the different areas of life can vary, too. Last
but not least the cause for this treatment can be announced or the target is left in the dark
about the reasons of exclusion. Thus, exclusion contains a variety of realisations. In the
following,g the three forms discussed and investigated in research of exclusion in and
through society, are distinguished from one another.
Distinction between ostracism, rejection and social exclusion
Ostracism is usually defined as being ignored and excluded (Williams & Sommer, 1997;
Williams, 2001), but this exclusion is mostly not explained or verbalised and occurs without
explicit negative attention. This leads to its characterisation as a nonverbal behaviour,
which is reflected in the synonym “silent treatment” (Williams, 2001; Williams, 2007). The
ostracized individual is treated by a group or another individual as if he or she is invisible or
does not exist. Not even negative attention is paid to the target. As this treatment usually
is not accompanied with an announcement or an explanation of reasons, it is very
ambiguous. Targets as well as sources can easily deny that ostracism happens at all.
Moreover, the target lacks vital information why he or she is ignored and therefore is
deprived of the possibility to correct his or her behaviour accordingly. This fact may
contribute to the difficulty people have coping with ostracism.

4
In laboratory studies, ostracism is often operationalized by exposing the participants to a
task which involves interaction, from which they are excluded and their presents is ignored.
Examples fore methods are “Ball tossing” or “Cyberball” (for a description, see below).
Rejection is realized by the announcement, that further interactions with the participants
are not (longer) wanted by an individual or a group (Leary, Terdal, & Downs, 1995). Thus
rejection most often implies an explicit derogation and targets therefore know for certain
that they are indeed being outcast. According to this, the rejected individual at least knows
that he or she is important enough to receive negative attention.
Social exclusion is defined as being excluded or isolated, sometimes but not necessarily
with a declaration of dislike. The target is excluded from a given network but not inevitably
ignored (Williams, Forgas, & von Hippel, 2005). The manipulation occurs usually after
interaction and separation, as for example in the paradigm used by Twenge et al. (2007)
which is explained below. Another example is the “future alone”-paradigm (Twenge et al.,
2001), where social exclusion is revealed as a prospective consequence.
These various forms of repulse may suggest it is a question of either being accepted or
not. However, Leary (2001, 2005) pointed out that rejection and acceptance should not be
treated as dichotomous states, but “as points along a continuum of “relational evaluation” ”
(Leary et al., 2006, p. 112). In a relationship, the source of rejection will value the
relationship with the target as not important or even undesirable, whereas acceptance
refers to a relationship which is very valuable and relevant. This evaluation happens in
varying degrees, which lead to grades of acceptance and rejection. Williams (2001) refers
to that aspect by introducing the taxonomic dimension “quantity” in his model of ostracism.
Moreover, Leary (2001; 2005) points out, that the subjective experience of acceptance and
rejection are tied directly to a person’s perception of the relational evaluation of the
source. A person feels rejected, if he or she has the opinion that another person does not
value their relationship. This is important as the research on interpersonal exclusion, which
is presented in the further course, deals with the effects of exclusion on people’s
experience and behaviours.
These presented definitions are not very differentiated from each other and terms are used
interchangeably in research referring to various methods. Nevertheless, I will try to use the
specific terms for specific operations. “Exclusion” or “repulse” will be used as a
superordinate concept to refer to all different forms together.

5
2.2. A model of ostracism
In 1997, Williams developed a model of ostracism, which was revised 2001 and 2005
(Williams, 2001; Williams & Zardo, 2005). It assumes that ostracism threatens four
fundamental needs: the need to belong, self-esteem, need for control, and meaningful
existence. The model outlines the impact of ostracism on individual’s mind and behaviour
over time. Williams & Zardo (2005) argue that reactions to ostracism follow three stages.
The first two stages are reminiscent of the primary and secondary appraisal of the
transactional model of stress and coping (Lazarus 1974).
Stage 1 describes the immediate reaction to ostracism. After an adaptive early
indiscriminate detection system warns the individual of potential threat of being ignored
and excluded, the ostracized individual responses to any form of ostracism with hurt
feelings, pain and aversive impact. This is supposed to be unmitigated by situational or
individual difference factors.
In Stage 2, individuals respond and cope with ostracism according to individual differences
and moderating situational factors. This reflective stage is responsive to cognitive
appraisals of the situation, the sources of ostracism and the reasons for ostracism. This
response is characterized by the attempt to satisfy the most threatened needs. If relational
needs, the need to belonging and self-esteem, are most shattered, ostracized individuals
will seek to satisfy these needs by thinking, feeling, and behaving in a relatively prosocial
way. If, however, need to control and meaningful existence are most threatened,
ostracized individuals lack feelings of efficacy and significance of their existence. Thus
fortifying these needs may result in controlling, provocative, and even antisocial or
aggressive responses.
Stage 3 describes the long-term effects of ostracism. Individuals who encounter multiple
episodes or single long-term episodes of ostracism may loose their ability to cope with their
threatened needs. Feelings of helplessness, alienation, and despair will dominate their
thoughts, feelings, and actions.
Short term effects and consequences of ostracism, rejection, and social exclusion which are
presented and discussed in detail below, are usually studied in laboratory experiments,
whereas its long term effects are so far described in case studies. In field studies as well as
in interviews or diaries, it is possible to examine the consequences of being ignored over
longer periods, whereas laboratory research deals with the effects of ostracism over
several minutes (Williams, 2001; 2007). In the following, the various methods used in
laboratory studies are described. Long-term effects and their measurement will not be
discussed further, as the present diploma thesis deals with the emotional and behavioural

6
short-term effects of ostracism. Afterwards the four needs and the effect of ostracism on
those motives are discussed in detail.
2.3. Paradigms and manipulations of ostracism, social exclusion, and
rejection
Several different paradigms have been used frequently in research to operationalize
ostracism and its related phenomena. In the following section, the most often used
methods are described in detail and their differences are discussed briefly.
Ball tossing
Williams (1997) developed an operationalisation for ostracism which is based on a personal
experience with frisbee players in a park. Williams found himself accidentally in a frisbee
play with two strangers. Suddenly they just stopped tossing the disc at him and he felt bad
about it. He got the idea to carry this situation into the laboratory.
Participants (two confederates and one actual participant) begin tossing a ball around while
they are waiting for the experimenter to return. Half the participants are included and get
the ball one third of the tosses, while half receives the ball only a few times, then never
again for the play duration (about 5 minutes).
Although it successfully induced ostracism and its consequences (Williams & Sommer,
1997; Warburton et al., 2006; Williams, 2001); this modality was tedious and costly. This
leads to the design of Cyberball.
Cyberball
Cyberball is a virtual analogue of the ball tossing, which was designed by Williams & Jarvis
(2006). Primarily designed to displace the extensive and cumbersome face-to-face ball
tossing game, it was first used in online experiments. In its final version, it is installed
locally on the laboratory computers. Participants are told the game is used to exercise their
mental visualisation skills, as the study involves effects of mental visualisation on a
subsequent task. Participants are informed via computer that they are playing with two or
three other players who are connected over Internet or Intranet. Moreover, they are told
that it does not matter who throws and catches the ball, but that they should visualise the
setting, the other players, etc. Ostracized participants receive the ball only one or two
times, whereas included participants receive the ball one third of the tosses. It is not
necessary that the players meet each other before the start.
An advantage of this method is the fact, that one easily can investigate the effect of the
degree an individual is ostracised. The degree of ostracism can be manipulated by the
7
relative amount of balls the target receives. Further information about the game and its
process can be gathered from the section “materials and methods”.
Life alone
Twenge et al. (2001) and Baumeister, Twenge, & Nuss (2002) developed a more future
orientated manipulation to induce rejection. Participants have to fill out a personality
questionnaire and receive an accurate feedback about introversion/ extraversion, followed
by the estimation about their future to which they are randomly assigned. In the accepted/
future belonging condition, they are informed that they are the type who has a rich and
strong network of interpersonal relationships. They will have a good matrimony and will
always have good friends and a large acquaintanceship. The experimental group (rejected/
future alone condition) is told that they are the type who would end up alone in life,
irrespectively how many friends they have at the moment. To control the confounding
factor negative forecast, the third group is told that their personality profile predicts a life
full of accidents, injuries and harmful and unpleasant events, but not being alone. This
procedure was first presented in Twenge et al. (2001) and used several times thereafter
(Baumeister et al., 2002; Baumeister, DeWall, Ciarocco, & Twenge, 2005; DeWall, Maner,
& Rouby, 2009a; Twenge, Catanese, & Baumeister, 2002 (Exp.3, Exp.5, Exp.6); Twenge et
al., 2007; Twenge et al., 2007a).
Accepted/ rejected by a group
Twenge et al. (2001, 2007 (Experiment 2)) used another further method to induce
rejection, which was adapted from Leary et al. (1995). Participants meet each other in
single- sex groups of 4-6 people. They talked with each other about a set of questions as a
guide to get to know each other. Afterwards, they were lead in separated rooms and asked
to name the two people which they met before with whom they would most like to work.
Participants were randomly assigned to either accepted or rejected by the group. The
accepted participants were told that everybody chose them to work with. The rejected
participants were informed that nobody would like to work with them. This procedure was
also used by Nezlek, Kowalski, Leary, Blevins, & Holgate (1997), Twenge et al. (2001) and
Twenge et al. (2007).
A variation on this was used by DeWall et al. (2009a). Two participants exchange
information about themselves, ostensibly in preparation for an interactive task. Participants
are then told that the interactive task has to be cancelled, either because the partner
suddenly remembered another appointment and had to leave (control condition), or

8
because the partner reacted negatively to the participant’s disclosures and chose not to
interact further (rejection condition).
Further paradigms
Several other paradigms have been used less frequently. Williams et al set up a role-
playing paradigm, where they simulated a train-ride in their laboratory (Williams, 2001,
p.142-161). This paradigm has the advantage that the source of ostracism can be
examined, too. Moreover, Williams et al used the Cyberball paradigm either with a ball or
with a disc in the internet and investigated the effects of ostracism in chat-rooms (Gardner,
Pickett, & Brewer, 2000; Williams, Govan, Croker, Tynan, Cruickshank, & Lam, 2002).
Additionally, ostracism, rejection, and /or social exclusion have been manipulated within
the context of for example face-to-face conversations (Geller, Goodstein, Silver, &
Sternberg W.C., 1974), cell phone text messaging (Smith & Williams, 2004), reliving or
imagining rejection experiences (Pickett, Gardner, & Knowles, 2004; Williams & Fitness,
2004) and perceiving disinterest and indifference in what the rejected participant had to
say (Snapp & Leary, 2001).
Although each of these methods realizes an exclusion of the participants, they differ in
some aspects from one another. Whereas the “Cyberball” and the “Living Alone”
paradigms work without a group or a source which exclude the target participant in a face
to face conversation, the other paradigms put the actual rejection by a group on stage.
Therefore, especially during the “Cyberball” game, the target has not the slightest idea
why she or he is excluded. Opposite to this, the realisation of the “Accepted/ Rejected”
paradigm might lead to rumination if the first impression or something during the
conversation caused the exclusion.
Moreover, the prospect and the reach of the exclusion differ. Whereas the “Cyberball” and
the “Accepted/ Rejected” paradigms realise the manipulation in the time frame of the
experimental situation itself and with other participants who have no close relationship to
the target person, the “Living Alone” method works with a future prospect. As the excluded
participant is told that he or she will end up alone in life, the actual exclusion does not
happen in the present situation of the experiment. The participant has therefore to cope
with a future scene, which seems inescapable but not acute. On the other hand, this
proclaimed outlook might be doubted as it is based on mere questionnaire. Furthermore,
the Cyberball constitutes a method, in which participants are ignored over a timeframe of a
few minutes. Participants are exposed to several small rejections, as each toss could

9
potentially again include the excluded player. Other paradigms in contrast work with a
single announcement (Baumeister, Brewer, Tice, & Leary, 2007a).
Because of these reasons, these paradigms themselves might account for the different and
sometimes contradictory outcomes of research, as each of them might refer to a specific
aspect in the field of exclusion.
2.4. Ostracism and needs
Based on previous studies concerning motivation and needs, Williams postulates in his
model of ostracism four needs which are shattered by ostracism: „ The core theory of the
model is that ostracism, in comparison to other aversive interpersonal behaviours, has the
unique potential to threaten up to four fundamental needs. These needs are the need to
belong, the need for self- esteem, the need for control, and the need for meaningful
existence.” (Williams, 2001, p. 59-60).
These four needs or motives are well-known and enjoy considerable support for their
importance in motivating human behaviour. The novel aspect carried out by the model
concerning these motives is the assumption that each of them is unique and important and
that they should not be subsumed into others (Williams & Zardo, 2005). However, the
following definitions and explanations point out that these needs probably have fuzzy
boundaries and are not strictly separable from each other.
Control
The need to perceive control over one’s environment is regarded as important and
essential in social and clinical psychology. In the context of depression Seligman (1975,
1998) offers in his theory of the learned helplessness an explanation for the cause for the
development of clinical depression (Peterson, Maier, & Seligman, 1993). Another example
is the attribution theory for success and failure by B. Weiner (1994). The dimension of
control plays a crucial role in predicting how people will explain and evaluate an event and
their subsequent reaction.
Ostracism is assumed to threat the need to control (Williams, 2001; Williams et al., 2005).
Being a target of the silent treatment, one has no control of the interaction with the source
of ostracism. As there is no communication but being ignored, the target is unable to
influence the situation. A discussion, a verbal argument or even a fight have in common
that these conflicts have a give-and-take structure. Unlike most other forms of aversive
behaviour, ostracism depicts a unilateral nature. No reaction, provocation or verbal attack
will lead to a change as the target person is treated as invisible by the source of ostracism.

10
Furthermore, ostracism deprives the target of the feeling of control over the situation by
low causal clarity. If the ostracized person does not know or guess the reason why she or
he is ignored, the target lacks the so called “interpretive control” (Rothbaum, Weiz, &
Snyder, 1982). To solve the problem, which has caused the treatment becomes even more
impossible and further coping processes are inhibited.
Compared to the need to belong and the need for self-esteem, little research is done on
the topic of Ostracism and control, which could be due to the fact that relatively few social
exclusion researchers have acknowledged the influence of exclusion on this need (Williams
et al., 2005).
Meaningful existence
The terror management theory states that a prime human motive is to buffer the terror
and fear they feel when they are confronted with their mortality and insignificance
(Greenberg, Pyszczynski, & Solomon, 1986). The buffering consists of responses that will
secure cultural and social worth and meaning. This need for meaningful existence can be
shuttered by ostracism, since being completely ignored gives a glimpse of how it would be
if the target of ostracism would not exist. Moreover, other authors refer metaphorically to
the similarity of ostracism and death. James (1890) for example describes the feeling of
being ostracized as “every person we met cut us dead” (p.293). For all these reasons
ostracism or being cut dead, can serve as a cue for mortality salience.
Belonging
Baumeister &Leary (1995) reviewed in detail the importance of the need to belong and
conclude that it is a fundamental human motivation (p.520) and, moreover, is evolutionary
adaptive (Baumeister & Tice, 1990; Buss, 1990). People socialise easily and make friends
or form attachments. Furthermore, they resist braking up social bonds, even under difficult
conditions. Thus, people are motivated to acquire and sustain at least a certain level of
social connectedness. Not only does this need shape behaviour, it also leads to positive
emotions if it is satisfied, which supports a greater subjective mental health (McAdams &
Bryant, 1987).
Lack or deficits in belongingness lead to a variety of negative and harmful consequences.
People who suffer from deficits of social bonding experience negative emotions such as
anxiety, more stress, and more depression (Cohen & Wills, 1985; Leary, 1990; Williams,
Cheung, & Choi, 2000). Moreover, loneliness is associated with a decrease in
immunocompetence and threats to the cardio-vascular system (Kiecolt-Glaser, Garner,
Speicher, Penn, Holliday, & Glaser, 1984; Kiecolt-Glaser, McGuire, Robles, & Glaser, 2002).

11
Additionally mental illnesses as eating-disorder (Armstrong, Roth 1989) and posttraumatic
stress disorder (Solomon, Waysmann, & Mikulincer, 1990) are linked to a lack of social
support and belongingness. Isolated or lonely people seem to commit crimes or suicide
more easily (Baumeister, 1990; Sampson & Laub, 1993) and suffer from a general
decrease in well-being.
It is obvious that any sort of exclusion deprives targets of their sense of belonging. Being
ignored rejected or ostracised cuts or at least threatens the attachment of the target to the
group or the individual who is the source of exclusion. Compared to any other aversive
interaction, exclusion proclaims explicitly or symbolically that the target is not/no longer
wanted, whereas a dispute or argument still constitutes a connectedness.
Most researchers and theorists in the area of ostracism and its related paradigms
acknowledge that these forms of social exclusion threaten this fundamental need to belong
(Baumeister et al., 2007a; Twenge et al., 2001; Twenge et al., 2007a; Williams, 2001;
Williams & Zardo, 2005). Williams argues that ostracism not only threatens this need more
clearly, directly and strongly than other aversive interactions, he and his colleagues also
state that belongingness is probably more important than other needs, as a threatening of
it "evokes a strong immediate warning"(Williams & Zardo, 2005 p. 22).
Self-esteem
Many theorists argue that the need for maintaining high self-esteem is fundamental,
pervasive, and adaptive (Baumeister, 1994; Greenberg, Solomon, Pyszczynski, Rosenblatt,
Burling, Lyon et al., 1992; Steele, 1988). Maslow did not only consider social bonds like
love and belongingness as higher needs, he also added the need for self-esteem to his
hierarchy of needs (Maslow, 1943). How we perceive others evaluation of our own worth is
associated with self-efficacy, mental health (e.g.: Bandura, 1997), and a wide area of
social psychology phenomena for example self-serving attributions, attitude changes, and
in-group/out-group perception (Blaine & Crocker, 1993; Crocker, Thompson, McGraw, &
Ingerman, 1987).
Ostracism is hypothesized to threaten target's self-esteem primarily because it is associated
with punishment. The target person gets the impression that he or she did something
wrong or even worse something is wrong about her. Moreover, the target experiences that
he or she is not worth of an argument or discussion or at least some negative attention but
is just ignored. The rumination about if and why one is ostracized and the generation of
possible failures, wrong-doings or defects threaten the self-esteem beyond the fact that
one is excluded (Williams & Zardo, 2005). However, Leary et al. (1995) constitutes in his
sociometer theory that self-esteem serves as a gauge for belonging and attachment. In

12
contrast to this, Williams & Zardo (2005) are of the opinion that this need of a high self-
esteem is more than a mere function of estimating the present inclusionary status and a
proxy of belonging.
These needs are not considered equally important by all researchers of social exclusion
(Leary, 2005, p40). Therefore the amount of research on the need to control and the need
of meaningful existence is less than that on the other two.
Questionnaires to measure the level of control, belonging, self-esteem and
meaningful existence
Williams et al. (2002) introduced a standard post-experimental questionnaire which is
specific to ostracism which is induced by Cyberball.
The questionnaire consists of 12 items assessing the effect of the Cyberball game on the
four needs: Belonging (e.g.: “I felt like an outsider”), Self-Esteem (e.g.: “I felt good about
myself”), Control (e.g.: “I felt like I had control over the course of the interaction”), and
Meaningful Existence (e.g.: “I felt nonexistent”). Moreover, this questionnaire contains
questions according to how they felt “while playing the game” to answer on a 5-point
scale. There are three manipulation checks to adjust participants’ perception of their
inclusionary status with the actual ostracism (i.e.: “I was ignored,” and “I was excluded,”
both answered on the same 5-point scale described above, and an open question:
“Assuming that 33% of the time you would receive the ball if everyone received it equally,
what percent of the throws did you receive?”.
Twenge, Catanese, & Baumeister (2003) collected data for the needs meaningful existence
and control on a 9-point Likert scale (1= not at all true; 9= very much true). Participants
rated their agreement with one respectively two or three questions for each need as “How
true is the statement: ‘Life is meaningless’?” and “How true is the statement ‘I am in
control of my life’?” (Twenge et al., 2003, p.414; Twenge et al., 2007a, p.62). For self-
esteem, he used the State Self-Esteem Scale (SSES; Heatherton & Polivy, 1991) (Twenge
et al., 2003 (Experiment3); Twenge et al., 2007a).
2.5. Ostracism and mood
Emotions are often attached to motivations and shape therefore indirectly our behaviours
(Baumeister, Vohs, DeWall, & Zhang, 2007). Thus, it seems plausible that the threat of
four fundamental needs will have a high impact on the emotional system of an excluded,
rejected or ostracized person. Hence, Williams (2001) predicts in his model of ostracism
that the dominant reaction to being ostracized would be an immediate wave of emotional

13
distress. In the following, measurements of mood and studies examining consequences
and emotional short-term responses of ostracism and its related paradigms are presented.
Questionnaires to measure mood
Usually the Positive and Negative Affect Scale (PANAS; Watson, Clark, & Tellegen, 1988) is
used to measure influences on mood (Baumeister et al., 2002; DeWall et al., 2009a;
Twenge et al., 2001;Twenge et al., 2003; Twenge et al., 2007).
Twenge et al. (2003) used, besides the PANAS, a questionnaire to rate the current mood
on 41 adjectives using 7-point Likert scales. These included 8 adjectives describing positive
affect (e.g.: happy, calm) and 33 describing negative affect (e.g.: angry, nervous, fearful,
ashamed). Similar scales were used for example by Buckley, Winkel, & Leary (2004), Leary
et al. (1995), and Snapp & Leary (2001).
Moreover, beside a one item scale (Twenge et al., 2001), the Brief Mood Introspection
Scale (BMIS) was used to measure mood, too (e.g.: Kirkpatrick, Waugh, Valencia, &
Webster, 2002; Tice, Bratslavsky, & Baumeister, 2001; Twenge et al., 2002).
2.6. Experimental studies: consequences of ostracism on needs and
mood
2.6.1. Experimental studies: needs
Several studies have measured self-esteem after exclusion (temporally or imagined) and
found it to be reduced (e.g.: Leary et al., 1995; Sommer, Williams, Ciarocco, & Baumeister,
2001). Similarly, beside self-esteem, the sense of belonging, control, and meaningful
existence are reduced by ostracism, too (Abraham, 2003; Twenge et al., 2003; Williams et
al., 2000; Zadro & Williams, 2006).
Williams and his colleagues found lower levels of these four needs, irrespectively of the
paradigm used, Cyber-ostracism, train-role paradigm and Cyberball (Williams, 2001). In
another study, experimenters varied the political attitude. Participants were convinced that
they would play Cyberball either with a group holding similar political attitudes, or rival
political attitudes or with a group representing a political tendency which is socially
despised (Australian Ku Klux Klan). Despite strong reasons to discount ostracism by an out-
group or, especially, a despised out-group, the distress of ostracized participants was not
moderated by the psychological closeness of the ostracizing group (Gonsalkorale &
Williams, 2006). Moreover, if being ostracized implicated an advantage, excluded
participants were still distressed. Although being included led to a deduction of 50 cents, or
even more the ball during the Cyberball was a bomb, potentially killing the catching player,

14
excluded participants still reported lower levels in meaningful existence, belonging, control,
and self-esteem. Whether inclusion came with a cost (50 cents deducted for each throw
received) or not, or whether the object being thrown was a ball or bomb (expected to
explode, “killing off the player with the ball”), participants were still distressed by being
ostracized (van Beest & Williams, 2006b; van Beest & Williams, 2006a).
Zadro, Williams, & Richardson R. (2004) revealed in two experiments that the needs were
threatened even so participants were told that those who rejected them were ordered to
do so or that they were playing against a computer.
In sum, this Ostracism-induced distress seems resilient to moderation by situational factors
and individual differences (Williams & Zardo, 2005; Williams, 2007).
However, some studies failed to reveal a decrease in level of these for needs. Twenge et
al. (2003) found a significant effect for meaningful existence, but not for control
(Experiment 2; “accepted/rejected by a group paradigm”). Similarly, they found less
feelings of belonging after the „living alone“ paradigm, but the need of control was not
influenced by this treatment (Twenge et al., 2007a; Experiment 6).
2.6.2. Experimental studies: mood
Many studies have examined the effects of ostracism and its related forms on self-reported
distress levels. Most of the studies reviewed above, besides finding a decrease in level of
the four needs an increase in self-reported distress, too. These measurements usually
included negative mood, anxiety, and anger.
Williams et al. (2000) found a distress pattern that was linearly associated with the amount
of ostracism to which the participants were exposed. The typical effect size of ostracism on
self-reported distress, including measurement of level of needs and mood, was high,
between d=1.0 and 2.0. Additionally to negative mood, anger as a subsequent emotional
reaction was often collected as well. For example, Buckley et al. (2004) showed that
rejected participants reported significantly more feelings of anger than those, who received
a neutral or accepting feedback.
Williams and colleagues revealed using the “Cyberball” paradigm that ostracized
participants experienced greater anger during the treatment than included ones (Williams
et al., 2000). Moreover, this effect was even greater, when participants were told that they
were playing against a computer and not against another participant (Zadro et al., 2004).
In contrast to the evidence reviewed above, some studies didn’t find emotional distress
following exclusion. Baumeister, Twenge and colleagues found no effects of social
exclusion on mood, regardless of the type of measure employed (Twenge et al., 2003;
Twenge et al., 2007). Based on their results, these researchers propose that one
15
consequence of social exclusion may be a state of numbness, including cognitive
destruction and a shut down of the emotional system, which keeps the excluded person
from further emotional injuries. The absence of emotion may reflect a natural coping
mechanism (e.g.: Baumeister et al., 2007a; Twenge et al., 2003; Twenge et al., 2007;
Williams, 2007). Thus, in contrast to the originally proposed consequence of emotional
distress, the opposite, an emotional numbness and insensibility seems to be more
probable.
Unfortunately, anger, thus measurable with the PANAS, is not mentioned in those studies,
which did not find an impact of exclusion on negative mood. Only Twenge et al. (2003)
mentioned that they found no significant differences in anger beyond the missing increase
in negative mood in general.
2.7. Short-term reaction: coping with ostracism, rejection or social
exclusion
Based on the theory and common observations about ostracism, rejection, and social
exclusion, different behavioural coping reactions of the target - immediate and short-term-
become plausible. Basically, two opposed responses are possible and plausible. The target
could on the one side try to strengthen his or her social bonds with any form of socially
desired behaviour or, on the other side, could react aggressively in the view of his
threatened fundamental needs. These coping responses are presented below, together
with their respective laboratory measurement and empirical research.
2.7.1. Ostracism and aggression
Aggression is commonly defined by social psychologists as behaviour intended to harm the
individuals who are targets of aggression (Baron & Richardson, 1994; Lieberman, Solomon,
& McGregor, 1999). This definition includes physical as well as verbal actions.
There is much evidence for an influence of (social) exclusion on aggressive behaviour.
Common observations lead to the assumption that people become angry or even
aggressive, if they feel rejected. Jilted lovers, rebuffed admirers may react to their repulse
with anger or even aggressive behaviour, as well as children who are ostracized by their
parents, not hired job candidates or just someone who learns that he or she was not
invited to a party as expected. Moreover, single men are more likely to commit crimes
compared to married men of the same age (Sampson & Laub, 1990). Social exclusion may
even assume alarming proportions as Leary and colleagues (2003) found out in their case
studies about school shootings. Almost all of the perpetrators of school shootings during
the late 1990s experienced social rejection.

16
Moreover, people may often have the urge to aggress but consciously control this impulse.
Angry mood is a signal which prepares the body for a harmful action. As a considerable
high amount of research found effects of ostracism, rejection, and social exclusion on
anger, the influence of exclusion on aggression seems probable.
Recently, a causal link between exclusion and aggression has been examined with the help
of several laboratory studies. The frequently used measurements are presented in the
following.
Laboratory measurements of aggression in the context of ostracism and
rejection
Hot Sauce Paradigm
Liebermann et al. (1999) developed a new laboratory measurement of aggression called
the hot sauce paradigm. This paradigm requires a manipulation of a variable that is
hypothesized to influence aggression as in the present case a manipulation of exclusion by
an Ostracism or Rejection paradigm (see above).
The method provides participants with an opportunity to aggress against a target by
setting the amount of extremely spicy hot sauce to be allocated to the target which is a
stranger and had not provoked or excluded the participant. In a common cover story
participants are informed that in a second study, which examines the relation of personality
and taste preference, they will taste and give their impressions of food samples (Lieberman
et al., 1999). This study seems to be independent of the first one, which includes the
manipulation of the variable influencing aggression. First, participants complete a “Taste
Preference Inventory” that consisted of several 21-point rating scales to evaluate their
preference for sweet, crisp, creamy, salty, spicy, and dry (tart) flavours. Afterwards
participants are instructed to place a quantity of hot sauce into a Styrofoam cup and to
seal it with the lid. It is made clear to the participants that the person who receives the hot
sauce will have to consume the entire quantity of it. Participants are told that all quantities
of hot sauce were useful and to “put in as much or as little” hot sauce as they wanted.
Often, participants are informed that the target person has a profound dislike of spicy food,
by presenting a “Taste Preference Inventory”, which constitutes that the target does not
like spicy food at all. To be sure the participants are aware of the intensity of the hot sauce
they are instructed to taste a sample of it. The amount of spicy hot sauce chosen by the
participant is weighed and presents the amount of aggression.
Additional to validity measurements of Lieberman et al. (1999), further convergent validity
for this new measure has been obtained by moderate correlations between hot sauce

17
allocations and the Buss & Perry (1992) “Aggression Questionnaire”. This method was used
several times successfully in the context of exclusion and aggression (e.g.: (Warburton et
al., 2006); (Kirkpatrick et al., 2002)).
Taylor Aggression Paradigm
A popular technique to measure physical aggression is to record the intensity and duration
of electric shocks administered by participants to a target (Berkowitz, 1964; Hammock &
Richardson, 1992a, Hammock & Richardson, 1992b, Taylor, 1967). Participants are usually
informed that the experiment is investigating the effects of punishment on learning.
Although this measurement actually detects the intent and performance to harm another
individual, it is methodically costly and most student participants may be influenced by
their knowledge of the famous Milgram’s obedience studies.
The Taylor Aggression paradigm (TAP), developed by Taylor (1967), is an adaptation and
improvement of this technique as the procedure is changed to a retaliation paradigm.
Participants are informed that they are engaging in a reaction-time task with a team-mate.
The slower person on each trial will receive a punishment, the intensity and duration of
which are set for the opponent before each trail. In fact, wins and losses are
predetermined and the participant receives a series of shocks during the course of the
experiment. The punishment can be a shock or a noxious noise (e.g.: Bushmann, 1995;
Twenge et al., 2007).
The task consists of three blocks of ten trails each. In the first block, participants receive
only mild punishment. Provocation is achieved by a stepwise increase of the punishment
from block one to three: In block two, participants receive an intermediate punishment and
a high punishment in the last block. After each of the thirty trials, the participants received
feedback about whether they won or lost, as well as about the opponent's settings. The
setting of each participant is used as a measurement for aggressive behaviour.
In the present study two versions of the TAP are used, one with noise as a punishment
and the other with loss of money as punishment. Both versions are described in detail in
section “Materials and Methods”.
This method combines the provocation, which should elicit aggression and the
measurement of the aggressive response. The first ten trails offer the possibility to
examine the reactive aggression behaviour without prior provocation. By analyzing just the
very first trial of the task, proactive aggressive behaviour can be measured which reveals
the pure effects of being excluded on behaviour. However, the TAP does not imply the
possibility to separate between aggressor and target of aggression. A problem of this
method is that participants may view their reaction not as aggressive but competitive as

18
the cover story consists of a competition task. Moreover, as the original punishment
method, some versions still raise some ethical concerns as participants are exposed to
uncomfortable shocks or noises.
This paradigm which has shown good construct, external, discriminant, and convergent
validity (Anderson, Lindsay, & Bushman, 1999; Bernstein, Richardson, & Hammock, 1987;
Giancola & Zeichner, 1995; Giancola & Chermack, 1998), is used often in the context of
Ostracism, rejection and social exclusion (e.g.: Bushmann, 1995, Twenge et al., 2001,
Twenge et al., 2003,Twenge et al., 2007, Warburton et al., 2006).
Job candidate evaluation
Twenge et al. use frequently in combination with the “Living alone” paradigm a
measurement of aggression in which participants evaluate the person who provoked them
before (e.g.: Twenge et al., 2001). Participants write an essay expressing their opinion on
the abortion issue. They are asked to choose one side on the issue. Afterwards they
evaluate an essay of another participant, actually a confederate, which states the opposite
opinion of their own. After being either rejected or included, participants receive a positive
or negative feedback of their essay from the other participant. The negative feedback
condition is designed to elicit aggression. Now, participants are informed that the other
participants who had evaluated their essay had applied to be a research assistant in the
department. Participants are asked to evaluate the candidate on a 10-point rating scale,
the scores representing the expression of aggression.
This method permits the possibility to differentiate between the aggressor, the one who
provoked by giving the negative feedback of the participants’ essay, and the person who is
evaluated for the assistant job. One may investigate, if excluded participants show
aggressive behaviour towards an innocent neutral person, too.
2.7.2. Experimental studies: ostracism and aggression
A considerable amount of research has examined the effects of ostracism, rejection and
social exclusion on the aggressive behaviour or on the intent to act aggressively (see Leary
et al., 2006 for a review).
In a series of experiments, Twenge and colleagues (2001) studied and ascertained the
causal connection between social rejection and aggressive behaviour. Following the
“accepted/ rejected by a group” manipulations and writing an essay about abortion,
participants were told that they would play a reaction time game, actually the Taylor
Aggression Paradigm task (TAP), with a new person. Though this person neither accepted
nor rejected the participant, he or she evaluated the participant’s essay negatively. During

19
the reaction time game, participants set length and intensity of an unpleasant noise on
conditions that the opponent lost. Thus, participants were allowed to act aggressively
towards an innocent person, who insulted but not rejected them. Compared to accepted
participants, rejected participants were significantly more aggressive toward the opponent
(Experiment 5). Interestingly, this effect occurred also if the new person was neutral, who
had not insulted them and had had no previous interaction (Experiment 4). Three further
experiments of this series supported the causal connection between rejection and
aggressive behaviour. Participants, who were told that they would end up alone later in life
gave negative ratings to someone who was applying for a job and insulted them before
with a negative evaluation of their essay.
Warburton, Williams, and Cairns (2006) likewise showed a link between ostracism and
aggression. Participants experienced ostracism or inclusion in a ball tossing game with two
actual confederates during the experimenter’s absence. Then, participants had the
opportunity to harm an innocent target. Thus they were allowed to assign the amount of
hot sauce to a stranger knowing that although the target strongly disliked hot and spicy
foods, he or she would have to consume the entire sample. The results showed that
ostracized participants assigned the target significant more hot sauce than included ones.
Similarly, Twenge et al. (2007) revealed that participants, who were rejected by a group,
react significantly more aggressive during the TAP towards a neutral person compared to
included participants.
Buckley et al. (2004) investigated amongst other things the effects various levels of
rejection and acceptance on aggressive behaviour, varying the condition that rejected
participants believed that they would meet the source of rejection later in course of the
experiment or not. Aggressive behaviour was measured in choosing aversive vs. pleasant
tapes to hear for the source of rejection. Participants who received extreme rejection had
the other person listen to the least pleasant tapes of all groups. The tapes chosen by
extremely rejected participants were neutral rather than blatantly aversive, but this was in
contrast to accepted participants, who selected pleasant tapes. This effect was not
influenced by an anticipated interaction with the source of rejection.
Several studies have revealed that excluded participants criticize and devalue those, who
rejected them. For example, Williams et al. (2002) found out, that participants, who were
excluded during a chat room conversation, rated the other individuals less friendly, caring
and sincere and more dishonest, selfish and insensitive. In another experiment excluded
participants also reported to like the other less (Williams et al., 2002, Experiment 2 and 3).
Bourgeois & Leary (2001) and Buckley et al. (2004) found similar results. Participants, who

20
were excluded, rated those who excluded them less positive and reported that they want
to get to know them less. Moreover, Williams et al could show that excluded participants
preferred to work alone or with a new group (Williams, 2001).
In summary, rejected, ostracized or excluded participants appear to be ready to behave in
hostile, aggressive ways toward a broad assortment of others.
However, it seems paradoxical that a person, who experience exclusion reacts
aggressively. A considerably high amount of research of aggression and aggressive
behaviour has revealed that aggression lead to a decrease in social acceptance and
probably to rejection itself. (e.g.: Necomb, Bukowski, & Pattee, 1993; Schuster, 2001) As
mentioned in the introduction, exclusion often functions as a punishment of unaccepted
behaviour in social and cultural groups. Thus, rejected or ostracized individuals, who react
with aggression to this treatment, will be confronted with further social exclusion in return.
The target ends up in a vicious circle.
A logical and adaptive reaction to exclusion would be make efforts to increase one's
acceptability to others by behaving in socially desirable ways. As discussed above, people
have a fundamental need to belong and are therefore strongly motivated to socialize and
maintain relationships. Any behaviour, which promotes acceptance like to please someone,
to do a favour for someone, to conform or any other behaviour which fosters the own
relational value, may be the most common initial response to perceived rejection. In fact,
some studies have shown that rejected or excluded people make efforts to improve their
acceptance.
2.7.3. Ostracism and prosocial behaviour
Williams & Sommer (1997) examined the effects of ostracism on individuals’ subsequent
contributions to a group task. They found out that female participants, who were
ostracized by a group worked harder in a group task. Interestingly, this effect occurred
only, if their individual contributions were not identified. Ostracized male participants
tended to socially loaf. Moreover, ostracized participants conformed to others’ incorrect
judgement than included participants (Williams et al., 2000).
In contrast to these results, which support the idea that ostracism leads to behaviour
which promotes acceptance, Twenge et al. (2007a) found a decrease of prosocial
behaviour after social exclusion. In a series of seven experiments, participants were
rejected using either the “living alone” or the “accepted/rejected by a group” paradigm and
then confronted with a situation which demanded prosocial behaviour. The results revealed
that rejected participants donated four times less money to a student emergency fund than

21
nonexcluded participants (Experiment 1 and 7), volunteered for fewer extra experiments
(Experiment 2), were less willing to help the experimenter after a mishap (Experiment 3)
and cooperated less in a mixed-motive game (prisoner’s dilemma, experiment 4, 5, and 6).
Taken together these finding of interpersonal behaviour suggest that excluded, ignored or
rejected people will rather behave aggressively. Although a prosocial manner seems to be
much more adaptive, it is seldom found in laboratory studies.
2.7.4. Experimental studies: how to inhibit aggression after exclusion
Previous research has shown that any form of social exclusion can lead to aggressive
behaviour. How can this socially undesirable consequence be prevented? It may be
important for two reasons to find possibilities to prevent this exclusion-induced behaviour.
First, as Leary et al. (2003) reviewed, social exclusion can lead to traumatic events as
school shootings. Moreover, factors, which inhibit aggressive reaction as a response to
exclusion, may give information about the mediating factors which lead to this maladaptive
response.
Twenge et al (2007, experiment 5) found out that if the opponent acts in a prosocial and
cooperative manner towards the excluded participant, the latter did not respond
aggressively. In this experiment, during the Taylor Aggression Paradigm, the computer did
not provoke the participant with unpleasant white noises of long duration and high volume
till the fifth trail. Thus, the first 5 turns of the 10-turn game were played amid a spirit of
cooperation and reciprocation. The excluded participants respond to this without
aggression. Not until they were provoked the first time, they were much less cooperative
and aggressive. This suggests that excluded people are not indiscriminately antisocial, but
respond to prosocial behaviour, but which is based on a untrusting and wary attitude.
Similarly, in Experiment 3 of Twenge et al. (2001), participants experienced a social
exclusion manipulation (“living alone” paradigm) and then received feedback apparently
from the source of rejection on an essay they had written. Excluded participants who
received negative feedback behaved aggressively by giving a critical job evaluation to their
interaction partner. In contrast, excluded participants who received praise were not more
aggressive towards the interaction partner who had praised them than the control group.
This experiment demonstrates that excluded participants are not aggressive across
absolutely all situations, and moreover that some friendly treatment can prevent the
aggressive response.
In four further experiments, Twenge and his colleagues further explored this issue
(Twenge et al., 2007). They could show that rejection-induced aggression is considerably
reduced by a friendly social interaction (i.e.: Thanks and candy after the rejection
22
manipulation given by the experimenter, by writing about either family members or a
celebrity).
A traditional mood induction had no effect on aggressive behaviour, showing that an
encounter, real, remembered or imagined, must be social to be effective. These studies
accentuate and verify the central role of feeling disconnected, as they replicate the
rejection-induced aggression, but also show that it can be prevented by positive social
contact.
2.8. Mediators between ostracism and its responses
The review of these studies suggests that ostracized, socially excluded, and rejected
individuals are capable of responding in a variety of ways, many of which appear to be
quite contradictory. One would expect a behaviour which helps to replenishing the
threatened social connectedness (e.g.: Baumeister et al., 2007a), but, as illustrated above,
such behaviours and manners are seldom to find as a response to exclusion. Prosocial
behaviour, for example, which would clear the way for new social attachment and feeling
of connectedness, was hardly found after a treatment of exclusion (Twenge et al., 2007a).
Bases on these findings and assumptions, several studies tried to find mediating factors,
interindividual and situational ones, which may help explain these contradictory results.
First, mood was proposed to mediate between rejection or exclusion and whatever
behaviour would follow. Unfortunately, besides the fact that the hypnotized exclusion-
induced emotional distress (see above, Williams, 2001) could in most cases not be
substantiated, it failed to mediate between exclusion and the behavioural effects (Twenge
et al., 2001; Twenge et al., 2002; Twenge et al., 2003; Twenge et al., 2007). These results
apply also to studies in which the treatment did produce significant main effects on mood
(e.g.: Buckley et al., 2004; Williams et al., 2000).
The needs self-esteem and belongingness failed to mediate between exclusion and
response, too (Twenge et al., 2007a; Twenge et al., 2007). Thus, the levels of needs are in
fact shuttered by ostracism, rejection, and exclusion, but they seem not directly to be
responsible for different behavioural responses. Inconsistent findings were found
concerning the need to control one's social environment; namely Twenge et al. (2007a)
found no mediation of control. In contrast, Warburton et al. (2006) could show that actual
control over an aversive stimulus had an influence on aggressive behaviour. Participants
were ostracized using the ball-tossing paradigm, and were then exposed to an aversive
noise, the onsets over which they had either control or no control. Aggression was
measured with the hot-sauce paradigm. Ostracized participants who had no control over
the noise were the most aggressive, assigning the target person to eat four times as much

23
hot sauce as participants in the other conditions. Thus, when ostracized participants could
not control an aversive situation, they were more aggressive toward an innocent target.
These results support the assumption of Williams model of ostracism that threatened need
to control may lead to aggressive behaviour.
Twenge et al. could prove that empathy and trust serve as a mediator between rejection
and aggressive behaviour (Twenge et al., 2007a; Experiment 7; Twenge et al., 2007,
Experiment 4). Participants who were rejected by the group but then wrote about a valued
best friend not only scored higher on trust, measured with 2 items assessing willingness to
trust "most people", but were correspondingly less aggressive than the rejected
participants who wrote about the neutral topic. The researcher concluded that thinking
about one's best friend seems to restore one's readiness to trust people in general, even
after trust had been shattered by the rejection experience. However, in their studies
concerning the decrease of pro-social behaviour (Twenge et al., 2007a; Experiment 6),
trust did not mediate the relationship between rejection and behaviour.
Buckley et al. (2004) investigated the moderating effects of trait variables agreeableness
and rejection sensitivity, revealing that both traits failed to moderate the reactions to
rejection, including negative emotions as anger, hurt feelings or anxiety, the inclination to
behave antisocially, and actual aggressive behaviour.
Narcissism, examined by Bushmann & Baumeister (1998) and Kirkpatrick et al. (2002), was
proved to be a predictor of aggressive behaviour after a negative feedback. No form of
exclusion was realized in these studies. Similarly, Zadro & Williams (2006) could show that
social anxiety influences the persistence of the detrimental effects of ostracism, but this
trait did not moderate the response itself, either.
More promising was the investigation of social cognition. In a very recent series of
experiments, DeWall et al. (2009a) found increases in hostility-related cognitive processes
in participants who experienced social exclusion compared to socially accepted and control
participants. Excluded participants rated aggressive and ambiguous words as similar,
completed word fragments with aggressive words, and rated the ambiguous actions of
another person as hostile. Interestingly, hostile cognitions substantially mediated the
relationship between social exclusion and aggression.
In sum, the search for moderating situational and dispositional factors goes on. A
considerable amount of possible mediators has been investigated, but still some aspects
are left untouched.
On the side of situational factors, it might be interesting and worthwhile for example to
examine the nature of the insult or the provocation which elicit aggressive behaviour.
24
According to common observations, it requires more than one single insult till the target
acts aggressively. Does exposure to a constantly increasing provocation lead to stronger
aggressive reaction in ostracized individuals?
Furthermore, ostracism, rejection, and social exclusion outside the laboratory happen
within social bonds. If an excluded individual reacts with anger and hostile behaviour
towards the source of this treatment, he or she faces revenge or vengeance. Thus, does
ostracism increase the likelihood of aggressive behaviour even in face of retaliation?
On the side of individual differences and traits, for example aspects of coping with stress
and experience and expression of anger and aggression are not investigated, yet.
There are few more stressful events than the threat of fundamental needs; nevertheless
dispositional factors concerning responses and coping with stress are not considered as
possible mediators, yet. Does a provocation after ostracism (or related paradigms) facilitate
an aggressive response in individuals with high sensibility to stress? Similarly, individual
differences in attitude towards vengeance or low levels of social responsibility may make
aggressive behaviour more likely. Additionally, a dispositional bias towards anger or
aggression as well as their expression (i.e.: controlled, inwards or outwards directed,
reactive, proactive or inhibit anger, respectively aggression) may mediate the relation
between ostracism, rejection or social exclusion and aggressive behaviour. This idea is
supported by the fact that cognitive biases for aggression- or anger-related material have
been previously reported in individuals with high levels of trait anger (van Honk, Tuiten, de
Haan, van den Hout, & Stam, 2001; van Honk, Tuiten, van den Hout, Putman, de Haan, &
Stam, 2001) and hostile cognitions mediate the relationship between social exclusion and
aggression (DeWall et al., 2009a).
The aim of the present study is to address these questions. To investigate the situational
aspects of increasing provocation and anticipated retaliation, a combination of the
Cyberball paradigm (Williams & Jarvis, 2006) to induce ostracism and the Taylor
Aggression Paradigm (TAP, Taylor, 1967) to provoke and measure aggression is used.
In addition, two versions of the TAP are used to investigate if the effects of ostracism and
provocation differ when the aggressive behaviour causes either a physical pain or a
monetary setback for another person.
First, the inclusionary status (ostracism vs. inclusion) of 65 students (male and female) was
manipulated using the Cyberball game. Next all participants performed one of the two
version of the TAP. Half of the participants of each inclusionary status group were exposed
to continuously increasing levels of provocation (high provocation group), while the others
received constantly low levels of provocation (low provocation group). The two versions of

25
the TAP differed in types of provocation and aggressive behaviour. The noise version
corresponded to the Taylor Aggression Paradigm explained above. The punishment was
carried out by the exposure to loud noise. In the money version, punishment was achieved
with deduction of money.
To explore dispositional factors concerning coping with stress and trait bias of anger and
aggression, several trait questionnaires were used, which are specified in Chapter 3.
Based on the status quo of research of ostracism, rejection and social exclusion, the
following hypotheses are taken as a basis for the present study.
3. Hypotheses
I. Threat of Needs:
Ostracism is supposed to lead to a decrease of self-esteem, feeling of belonging,
sense of control, and meaningful existence.
II. Aggressive Behaviour:
Ostracism in combination with high levels of provocation is supposed to lead to
enhanced aggressive behaviour.
III. Mood
Ostracism should lead to an increase in negative mood, especially of anger and a
decrease in positive mood.
IV. Mediation
No mediation of negative mood in general or anger in special is expected.
V. Dispositional factors
Several trait variables are investigated concerning the mediation between ostracism
and aggressive behaviour. No specific hypotheses are assumed, but an explorative
analysis is reported.

26
4. Material and Methods
In the following chapter, participants, material and methods as well as the procedure of
the present study will be presented. The Cyberball paradigm, utilised to manipulate the
inclusionary status, and the TAP, utilised to provoke and to measure aggression, are
described in detail. The chapter concludes with a description of the statistical analyses.
4.1. Participants
Thirty-three female and thirty-two male students of the University of Trier (mean age
21.55 years, SD= 2.23; range= 19−29 years) took part in the study. To make sure that
the participants had no experience with psychological studies, only first-year
undergraduates of psychology and students of other academics were accepted. Participants
volunteered to take part in the experiment in return for course credit. In addition,
participation was compensated with €7. The study was approved by the local ethics
committee. The participants were randomly assigned to a 2 (TAP-version: money vs. noise)
x 2 (Inclusionary Status: inclusion vs. ostracism) x 2 (Provocation: high vs. low
provocation) between-subject design, but sex was balanced across groups (four male and
female participants in each group). Three students of the same sex, who were not friends
with each other, meet each other right before the experiment. They were run in groups of
three, although they were kept in separate rooms as soon as the experiment started.
4.2. Materials
4.2.1. Pre-experimental questionnaires
After signing the informed consent and providing biographical data (e.g.: age, sex, number
of close friends, and how many roommates they had), participants had to fill out four trait
questionnaires in random order: The German “Stress-Reaktivitäts-Skala” (SRS) (Schulz,
Jansen Lars J., & Schlotz Wolff, 2005), the German version of State-Trait-Anxiety-Inventory
(STAI) (Laux, 1981), the German “Fragebogen zur Erfassung von Aggressivitätsfaktoren”
(FAF) (Hampel, 1998), and a German questionnaire dealing with the perception of and the
attitude towards justice, which contains the “Glaube an eine gerechte Welt als Motiv”
(Dalbert, Montada, & Schmitt, 1987, Schmitt, 1997), ”Sensibilität für widerfahrene
Ungerechtigkeit” (Schmitt, 1995, Schmitt, 2005), a German version of the State-Trait Anger
Expression Inventory (STAXI) (Schwenkmezger, 1992), “Relationalitäts-
Kontextabhängigkeits-Skala” (RKS) (Gollwitzer, 2006),”Skala der sozialen Verantwortung”

27
according to Berkowitz and Daniels (Bierhoff, 2000), and German version of the Vengeance
Scale (Stuckless, 1992).
4.2.2. State questionnaire
PANAS state
The German version of the Positive Affect Negative Affect Schedule (PANAS; Krohne,
Egloff, Kohlmann, & Tausch, 1996), a psychometric scale developed to measure the largely
independent constructs of positive and negative affect, was used to assess current self-
reported mood four times during the experiment: at the beginning of the experiment
(PANAS 1), after the Cyberball game (PANAS 2), after the Taylor Aggression Paradigm
(PANAS 3), and after the Emotional Stroop Task (PANAS 4). This scale consists of ten
rather positive (e.g.: interested, inspired, energetic) and ten rather negative adjectives
(e.g.: nervous, irritable, anxious). The participants had to rate how much they currently
felt on a five point rating scale. Besides measuring positive and negative affect, the
questionnaire provides a measurement for specific negative moods, such as anger.
From self-reported mood, three variables were analyzed: positive and negative affect and
anger.
4.2.3. The Cyberball
Cyberball, a virtual ball-tossing game developed by Williams and Jarvis (2006),
operationalizes ostracism in the laboratory. This paradigm has been shown to reliably
induce ostracism as defined as being excluded and ignored ( Williams, 2001) in several
studies (e.g.: Warburton et al., 2006; Williams et al., 2000; Williams et al., 2002; Zadro et
al., 2004; Zadro & Williams, 2006).
We used a cover story, translated in German, which is provided by the developer.
Participants were told that they were playing this game with the other participants, whom
they met prior to the experiment. They were informed that the game was merely a means
for them to engage their mental visualization skills and that therefore performance in the
game was of no importance. They were asked to create a mental picture of the team-
mates, the setting and themselves. The game depicts three ball-tossers, the middle one
representing the participant as shown in Figure 1.
The icons are animated throwing the ball to one of the two team-mates. When the
participant received the ball, she or he was instructed to press “1” on the keyboard to pass
the ball to the player on the left side of the screen and “2” to throw it to the one on the

28
right side of the screen and the ball would move toward that recipient. The names of the
three participants, who took part at the same time, appeared on the screen.
Once the instructions were read, the participant clicked the “Next” link to start the game.
Although we took an effort to make the participants believe that they were playing this
game together, actually they were not. The number of balls passed to the participant was
set in advance by the experimenter taking into account the particular experimental
condition. If randomly assigned to the inclusion condition, participants received the ball for
roughly one-third of the total throws. If assigned to the ostracism condition, participants
received the ball twice at the beginning of the game, and for the remaining time, never
received the ball again.
The game was set for 30 total throws lasting approximately five minutes.
4.2.4. Taylor Aggression Paradigm
The Taylor Aggression Paradigm (TAP, Taylor, 1967) was used in two modified versions to
elicit and assess aggression. The TAP, utilized successfully several times in the context of
social exclusion and aggression studies (e.g.: Bertsch, Böhnke, Kruk, & Naumann, 2009,
Bushmann & Baumeister, 1998 ,Twenge et al., 2001, Twenge et al., 2003, Twenge et al.,
2007, Warburton et al., 2006), has shown good construct, external, discriminant, and
convergent validity (Anderson et al., 1999; Bernstein et al., 1987; Giancola & Zeichner,
1995; Giancola & Chermack, 1998).
Consistent with the cover story, the participants were led to believe that they were playing
a competitive reaction time game with one of the other participants, whom they met prior
to the experiment and with whom they played the Cyberball game. Participants were asked
to react as fast as possible to a green square by pressing a key and they were told that
whoever responded slower would receive a punishment. This punishment was defined
Figure 1: Cyberball- icons and Arrangement of the Player.
participant
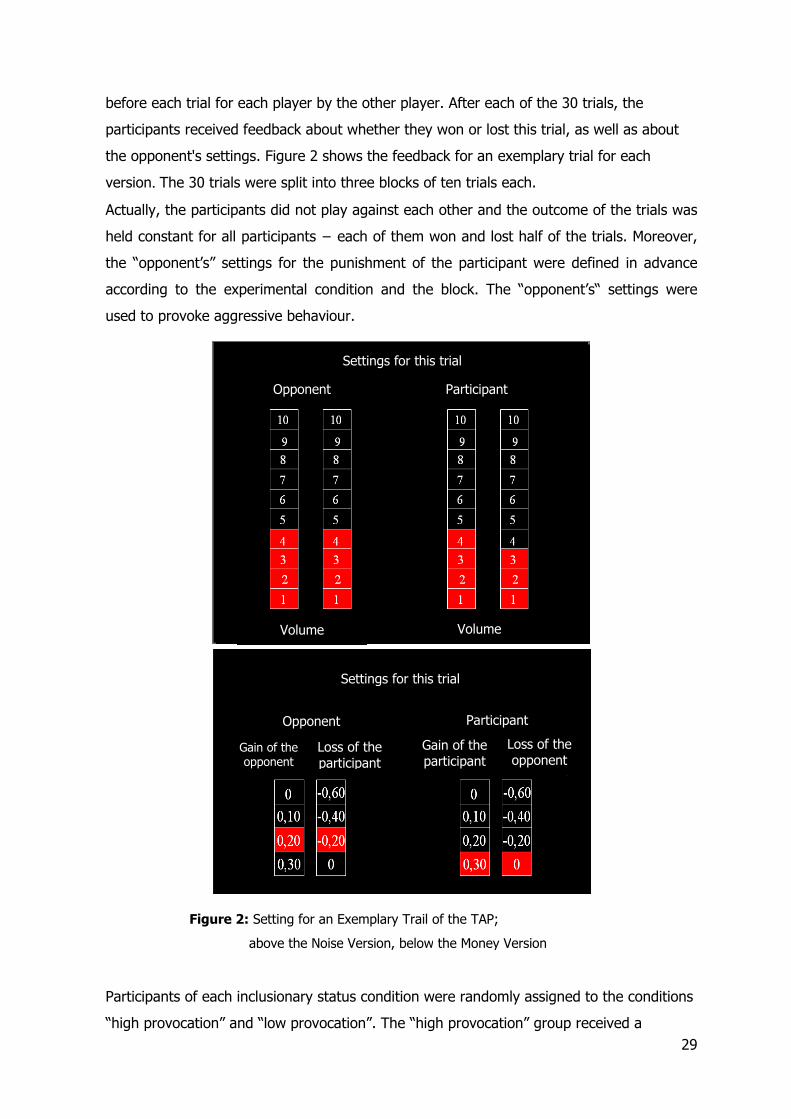
29
before each trial for each player by the other player. After each of the 30 trials, the
participants received feedback about whether they won or lost this trial, as well as about
the opponent's settings. Figure 2 shows the feedback for an exemplary trial for each
version. The 30 trials were split into three blocks of ten trials each.
Actually, the participants did not play against each other and the outcome of the trials was
held constant for all participants − each of them won and lost half of the trials. Moreover,
the “opponent’s” settings for the punishment of the participant were defined in advance
according to the experimental condition and the block. The “opponent’s“ settings were
used to provoke aggressive behaviour.
Loss of participant
Loss of participant
Participants of each inclusionary status condition were randomly assigned to the conditions
“high provocation” and “low provocation”. The “high provocation” group received a
Figure 2: Setting for an Exemplary Trail of the TAP;
above the Noise Version, below the Money Version
Opponent Participant
Settings for this trial
Gain of the opponent
Loss of the participant
Loss of the opponent
Gain of the participant
Volume Duration
Volume
Opponent Participant
Settings for this trial

30
gradually increased provocation achieved by a stepwise increase of the punishment from
block one to three. The “low provocation” group received a light punishment which
remained constant over all three blocks.
Two different versions of the TAP were used, which varied in type of the punishment.
Noise version
In this version, the punishment consisted of a blast of noise applied over headphones.
Volume and duration of this noise were adapted according to the experimental condition.
During the first block, all participants of the noise version received short and gentle noises
when they lost a trial (volume: M = 62.5 dB, range 0−70 dB; duration: M = .075 s, range
0−1.5 s). Participants of the low provocation group received noises of the same volume
and duration during the whole 30 trials, whereas for participants of the high provocation
group conditions changed the second and third block. These participants were exposed to
noises of intermediate volume and duration in the second block (volume: M = 82.5 dB,
range 75−90 dB; duration: M = 2.75 s, range 2−3.5 s) and of high volume and duration in
the third block (volume: M = 99 dB, range 90−105 dB; duration: M = 4.4 s, range 3.5−5
s) when they lost a trial. The volume and duration settings of the participants were
recorded in each trial from 0 to 10. For each participant and each trial, an average of the
volume and duration setting was computed, except for those trials in which one of the
settings was 0. In that case, the total score was set to 0, since no noise would have been
presented to the opponent and this trial would not have constituted an aggressive act.
Finally, the 10 trials which belonged to one block of TAP were averaged for each
participant. These values were then used as the dependent variable of aggressive
behaviour in the statistical analysis.
Money version
In the money version, the participants were told that they could gain up to €7 in the TAP.
All participants started with a deposit of €4. In each trial, they could chose whether they
would like to gain 30 Cents without taking money from their opponent’s account, gain 20
Cents and take 20 Cents from the opponent, gain 10 Cents and take 40 Cents from the
opponent, or gain 0 Cents and take 60 Cents from their opponent’s account (see Figure 2).
During the first block, all participants of the money version lost no or only very small
amounts of money (M = -10 Cents, range 0 to -20 Cents). Participants of the low
provocation group received the same settings during the second and third block as well. As
in the noise version, the conditions changed for the participants of the high provocation
group during block 2 and 3. They were exposed to intermediate losses of money in the

31
second (M = -30 Cents, range 0 to -60 Cents) and greater losses in the third block (M = -
48 Cents, range -20 to -60 Cents). For each participant the deduction of the opponent’s
money of 10 trials which belonged to one block of the TAP were averaged. These values
were used as the dependent variable of aggressive behaviour in the statistical analysis.
4.2.5. Post-experimental questionnaires
At the end of the experiment, participants had to fill out a questionnaire concerning the
virtual ball-tossing game and the TAP. Participants were asked to state on a five point scale
(1= not at all, 5= very much) how they felt during the Cyberball and the TAP, respectively.
Along the lines of previous experiments (Williams et al., 2000; Zadro et al., 2004; Zadro &
Williams, 2006), this questionnaire contains 12 items measuring the effect of the Cyberball
game on the fulfilment of the four needs belonging, control, self-esteem, and meaningful
existence. Moreover, seven items assessed feelings of anger, one item feelings of anxiety,
two items the enjoyment of the task, and two more items feelings of rejection during the
ball-tossing game. The latter can be regarded as a manipulation check to confirm
participants' perception of their inclusionary status during the Cyberball game. As a further
manipulation check participants had to state in percent how often the ball was passed to
them.
Similar to the scales for the Cyberball, we also asked the participants in the post-
experimental questionnaire how they felt during the TAP. Seven items recorded feelings of
anger, two items the enjoyment of the game. One item assessed feelings of anxiety caused
by the team-mates. Another two items measured aggression by asking which setting they
would choose if they would play again with the same team-mate and a new one,
respectively. Additionally the current feelings regarding the team-mates were measured.
4.3. Procedure
The investigation took place from November 2007 to December 2007.
The participants were told that we investigated the mental visualization on a reaction-time
task. The general procedure is shown in Figure 3.
Arriving at the laboratory, the three participants were introduced to each other. They were
told that they would play a ball tossing game with each other during the course of the
experiment. Afterwards they were seated in separated adjoining rooms, doors open until
the start of the Cyberball task. Following the introduction, participants had to fill out
several trait questionnaires (see above). Next, they had o fill out the state version of the
PANAS for the first time. When all participants finished this, the experimenter asked them
to start the Cyberball game. Before and after the Taylor Aggression Paradigm, they had to

32
Introduction Questionnaires PANAS 1
Cyberball PANAS 2
TAP PANAS 3
Stroop Test PANAS 4
Questionnaires Debriefing
fill out the mood questionnaire for the second and third time. Then participants performed
an emotional Stroop task, the results of which won’t be discussed in the present diploma
thesis. After this Emotional Stroop Test, they answered the mood questionnaire the last
time together with the post experiment questionnaires (see above). After an elaborate
debriefing, each participant received 7€. The whole experiment lasted less than 1.5 h.
4.4. Statistical analysis
The test of normal distribution revealed a significant divergence to the normal curve of
distribution, but since the Anova is robust concerning this violation if the df is greater than
40 (Bortz, 2005), we decided to use this method nevertheless. Moreover, similar analysis
with logarithmised data of the TAP revealed the same results as not logarithmised data,
which could count as a support to work with the original data. The Levene- Test and the
test for homogeneity of variance were not significant.
The data collected in the TAP were z- standardized. First 2 x 2 x 2 x 2 x 3 mixed-design
analyses of variance (ANOVAs) were performed including the factors inclusionary status
(inclusion vs. ostracism; between-subject), provocation (high vs. low provocation;
between-subject), sex (male vs. female participants; between-subject), TAP group (money
vs. noise version), and TAP block (Block 1, 2, 3; repeated measures) to analyze effects of
ostracism and provocation on aggressive behaviour in the TAP. Second, separate 2 x 2 x 2
x 3 mixed-design ANOVAs were performed for each of the two versions of the TAP with the
factors inclusionary status, provocation, sex, and TAP block (Block 1, 2, 3; repeated
measures) to analyze effects of ostracism and provocation on aggressive behaviour. Third,
the first trial of the first block of each version was analyzed with separate 2 x 2 x 2
univariate analysis of variance with the factors inclusionary status, provocation, and sex, as
this measure of aggression is often used in studies examining the influence of exclusion on
aggressive behaviour in the original TAP (e.g.: Bushmann, 1995; Twenge et al., 2007).
Fourth, we performed several mixed-design ANOVAs, including the factors inclusionary
status, provocation, TAP version, and sex, to reveal effects of ostracism and provocation
on subjective measures (state anger, positive and negative affect, rejection), need
satisfaction (belongingness, control, self-esteem, and meaningful-existence), and further
mood variables of the post-experimental questionnaire. The data of the PANAS (positive,
Figure 3: Procedure of the Study
33
negative mood and anger, respectively) for measurement point 1, 2 and 3 were z-
standardized and a 2 x 2 x 2x 2 x 2 mixed-design ANOVA for each mood measurement was
performed with the above mentioned factors inclusionary status, provocation, sex, and TAP
version. PANAS 2 and 3 were used as repeated measures and PANAS 1 was used as a
covariate for each mood measurement, respectively. For the self-reported measurements
of the post-experimental questionnaire several mixed design ANOVAs were performed for
each TAP version separately with the factors inclusionary status, provocation, and sex.
Correlations between Inclusionary Status and responses in the TAP were calculated as a
basis for the mediator analysis.
In the figures, non-standardized variables are depicted to facilitate the interpretation. 95%
confidence intervals (CI) are depicted as well.
For all ANOVAs, the degrees of freedom were Huynh-Feldt corrected if the assumption of
sphericity was violated (Huynh & Feldt, 1976). All statistical analyses employed a two-tailed
alpha of .05. Effect sizes of significant results are reported as proportion of explained
variance (partial eta squared [η²]). In case of significant effects, we used Dunn's Multiple
Comparison Tests as well as Pearson product moment correlations as post hoc tests. All
statistical analyses were conducted with SPSS for Windows (Version 17.1, SPSS Inc.).
Degrees of freedom vary slightly in the analyses of occasional missing data in subjective
measures and post-experimental questionnaires.

34
5. Results
In this chapter, the results of the present work will be outlined starting with the
manipulation check. Afterwards the results concerning the hypotheses are presented
consecutively. In each case, the descriptive statistic will be presented first, followed by the
inferential statistics.
5.1. Manipulation check
5.1.1. Ostracism
Table 1 depicts means and standard error of different variables testing whether the
manipulation of the Inclusionary status was successful. The structure of the means
suggests a successful manipulation of the inclusionary status. Ostracized participants
declared to feel more rejected (ostracism: M = 2.800, SE = 0.196; inclusion: M = 1.406,
SE = 0.199) and less included than included participants (ostracism: M = 4.781; SE =
0.141; inclusion: M = 2.219, SE= 0.143). Moreover, they perceived correctly that they
received the ball less often than their virtual team-mates (ostracism: M = 1.213, SE =
0.137; inclusion: M = 2.479, SE = 0.141). The variance of all three items was rather low.
Table 1: Manipulation Check; the Effect of Ostracism on the Feeling of Rejection and Inclusion and on the Perception of Received Balls
Ostracised Included Dependent Variable M SE M SE
Feeling of Rejection
(1= not at all, 5= very much) 2.800 0.196 1.406 0.199
Feeling of not Being Included
(1= not at all, 5= very much) 4.781 0.141 2.219 0.143
Received Balls
(1 = 0%, 2= 25%, 3= 50%, 4= 75%, 5= 100%) 1.213 0.137 2.479 0.141
The inferential statistical analyses supported the descriptive results. The manipulation of
being ostracised in the Cyberball game caused significant greater feelings of rejection
(Feeling of rejection: F(1,49) = 24.90, p < .000, η2 = .77; Feeling of not being included:
F(1,49) = 162.91, p < .000, η2 = .34). The amount of received balls reached significance, too
(F(1,46) = 65.39, p < .000, η2 = .59).

35
5.1.2. Provocation
Participants in the high provocation group should show an increase in aggressive behaviour
to increasing levels of provocation compared to their peers in the low provocation group.
In Table 2, means and standard errors of aggressive behaviour in block 1 to 3 for both
versions combined are depicted. As expected, participants descriptively showed more
aggressive behaviour in block 2 and 3 than their peers in the low provocation group. As
Figure 4 shows, this applies for each individual version, too.
Table 2: Manipulation Check: Influence of Increasing Provocation an Aggressive Behaviour in Block 1−3 in Both Version
Low provocation High provocation Depended Variable Aggressive Behaviour M SE M SE
Block 1 -0.149 0.137 -0.093 0.135
Block 2 -0.294 0.159 0.144 0.157
Block 3 -0.315 0.208 0.669 0.205
Note: z- standardised variables are presented
The results of the inferential statistical analyses revealed a main effect of provocation for
both versions together (F(1,98) = 5.22, p < .050, η2 = .10). Participants who received high
levels of provocation showed higher values in aggression behaviour over all three blocks
compared to the control group. Additionally, a main effect of TAP block (repeated
measure) was found, as well (F(2,98) = 6.22, p < .010, η2 = .11). Post-hoc tests showed that
participants reacted significantly more aggressive in block 3 than in block 2 (p < .050) and
block 1 (p < .010). This effect was found in Tap money version as well (money version:
F(2,48) = 5.65, p < .010, η2 = .19) but not in TAP noise version (F(2,50) < 2.0; p < .100).
Moreover, the analyses confirmed the descriptive tendencies (see Table 2 and Figure 4),
revealing a successfully experimental provocation of aggression in both versions together,
and each version of its own (Interaction: provocation x TAP block (repeated measures):
both version: F(2,98) = 13.21, p < .000, η2 = .21; noise version: F(2,50) = 10.48, p < .000, η²
= .30; money version: F(2,48) = 4.39, p < .050. η² = .16), even though the effect was
slightly smaller in the money version.
Post-hoc tests for both versions together revealed that highly provoked participants acted
significantly more aggressive in block 2 and 3 compared to those of the low provocation
group. Moreover, participants of the high provocation group reacted significantly more
aggressive in block 3 compared to block 2 (p < .050) and block 1 (p < .050) (see Figure 4,
left histogram). Post-hoc tests for the noise version revealed that participants, who

36
received intermediate (block 2: p < .050) and high (block 3; p < .010) provocation, acted
significantly more aggressively than those, who received a constantly mild provocation
during all trials. As expected, both groups did not differ in the first block, in which all
participants were exposed to low levels of provocation. However, highly provoked
participants reacted with increasing aggressive behaviour to the stepwise intensified
provocation from block 1 to 3 (p < .010). Concerning the money version (see Figure 4,
right histogram) the results were very similar to the ones of the noise version, except that
under intermediate provocation, the participants were not significantly more aggressive
than the control group in block 2, but under high provocation in block 3 they were (p <
.010). Provoked participants showed an increase of aggressive behaviour from block 1 to 3
(p < .010) and from block 2 to 3 (p < .050). Please note that average of aggressive
behaviour in this version is measured in mean monetary deduction (0.60€ at most)
Results concerning the hypotheses
In this paragraph the results of the four hypotheses are presented. First, the results
concerning the influence of ostracism on the four needs are described. Next, the results
concerning the relationship between ostracism and aggressive behaviour in the Taylor
Aggression Paradigm (TAP) task as well as the evaluation of the team-mate and self-
reported future setting in the TAP are presented. Third, the results of the effect of
ostracism on mood are outlined. The paragraph concludes with the results of the
Figure 4: Manipulation Check: Provocation in TAP, Left: Noise Version; Right: Money Version
p < .01; p < .050 High Provocation Low Provocation

37
mediation-hypothesis and the outcome of an explorative analysis of the correlation
between dispositional factors and aggression considering the inclusionary status.
5.2. Hypothesis I: Threat of needs
Figure 5 depicts the means of self-reported levels of the four needs belonging, self-esteem,
control and meaningful existence. Ostracized participants reported lower levels in all four
needs compared to included participants. Interestingly, the need to control and the need to
belong are threatened the most followed by meaningful existence. Self-esteem is shattered
the least.
The ANOVA for each need revealed a main effect of inclusionary status, respectively
(belonging: F(1,49) = 66.14, p < .000; η² = .57; self- esteem: F(1,49) = 13.21, p < .001; η² =
.21; control: F(1,49) = 88.13, p < .001; η² = .64; meaningful existence: F(1,49) = 4.83, p <
0.000; η² = .48) as shown in Figure 5.
These analyses revealed no further significant effects (all Fs < 2.88, ps > .100).
5.3. Hypothesis II: Ostracism and aggressive behaviour
In the following section the relationship between ostracism and aggressive behaviour will
be presented. First, the results concerning influences of inclusionary status on aggressive
behaviour in the Taylor Aggression Paradigm will be outlined. Next, the results of the effect
of inclusionary status on liking and getting to know the team-mates as well as on the
specification on future settings while playing the TAP with the same or new team-mate will
be presented. These forms of aggressive behaviour will be taken into account as they were
Figure 5: Influence of Ostracism on Self- reported Levels of Needs
Ostracised Included
p <.001

38
frequently cited in research of ostracism and aggression (e.g.: Twenge et al., 2001;
Williams et al., 2002).
5.3.1. Ostracism and aggressive behaviour in the TAP
Table 3 depicts the aggressive behaviour in the first trial and block 1 to 3 in the TAP for
ostracized and included participants. Ostracized participants reacted more aggressively
than those, who were included in the first trial as well as in the entire block 1 and block 2.
However, in block 3 included participants were more aggressive than ostracized ones.
Table 3: TAP; Relationship between Inclusionary Status and Aggressive Behaviour in the First Trial, Bock 1, 2 and 3
Ostracised Included Dependent Variable Aggressive behaviour in the TAP (both versions) M SE M SE
First trial of Block 1 0.10 0.18 -0.12 0.18
Block1 -0.04 0.145 -0.20 0.14
Block 2 -0.06 0.16 -0.09 0.16
Block 3 0.08 0.21 0.28 0.21
Which effect does the level of provocation have on this pattern?
Figure 6 presents the reactions of ostracized as well as included participants who were
either exposed to high or mild provocation in the TAP.
Figure 6: TAP Both Versions; Interaction between Inclusionary Status, Provocation and TAP Block
High Provocation Low Provocation

39
Highly provoked ostracized participants (Figure 6: left histogram, bright bars) react with
increasing aggressive behaviour from block 1 to 3. In contrast to this, mildly provoked
ostracized participants (Figure 6: left histogram, dark bars) reacted with strongly
decreasing aggressive behaviour towards the constant mild provocation from block 1 to 3.
However, mildly provoked included participants (Figure 6: right histogram, dark bars)
reacted with constant non-aggressive behaviour towards the constant mild provocation
from block 1 to 3. Similarly, highly provoked included participants (Figure 6: right
histogram, bright bars) reacted with non-aggressive behaviour towards the mildly as well
as intermediate provocation in block 1 and 2 and with suddenly strong aggressive
behaviour concurrently to high provocation in block 3.
The analysis did not confirm this pattern, revealing no main effect of inclusionary status
(F(2,98) < 1.00, p >.100, n.s.) and no significant interaction between inclusionary status and
TAP block (F(2,98) < 2.00, p > .100, n.s.). This might be caused by the unanticipated
declining aggressive behaviour of ostracized but mildly provoked participants, which abated
the mean reaction of ostracized participants (see Figure 6). Additionally, the minor
differences in the means of the first trial, as well as of block 1 and block 2 between
ostracized and included participants is not sufficient for a significant difference (see Table
3). However, the analysis disclosed a marginally significant interaction between
inclusionary status, sex, and TAP version (F(1,49) = 3.68, p < .100; η² = .07). Posthoc tests
revealed that included females reacted in the TAP money version more aggressively than
included males.
To investigate this unexpected missing effect of inclusionary status both versions of the
TAP were analysed separately.
Noise version
Figure 7 depicts the influence of inclusionary status on aggressive behaviour in the TAP
noise version. Ostracized participants behave more aggressively in block 1, but less
aggressively in block 2 and 3 than included ones. However, in sum ostracized participants
seemed to be less aggressive than their included peers, irrespectively of the amount of
provocation in the TAP. This was confirmed by the inferential statistical analysis, which
revealed a significant interaction of inclusionary status and TAP block (F(2,50) = 3.84, p <
.050, η² = 0.13).
Post-hoc tests revealed that ostracised participants reacted significantly less aggressively
than the included ones in the third block of the TAP (p< 0.05) (see Figure 7). The
relationship between inclusionary status and provocation disclosed the following pattern:
Ostracized participants reacted more aggressively under high provocation than under mild
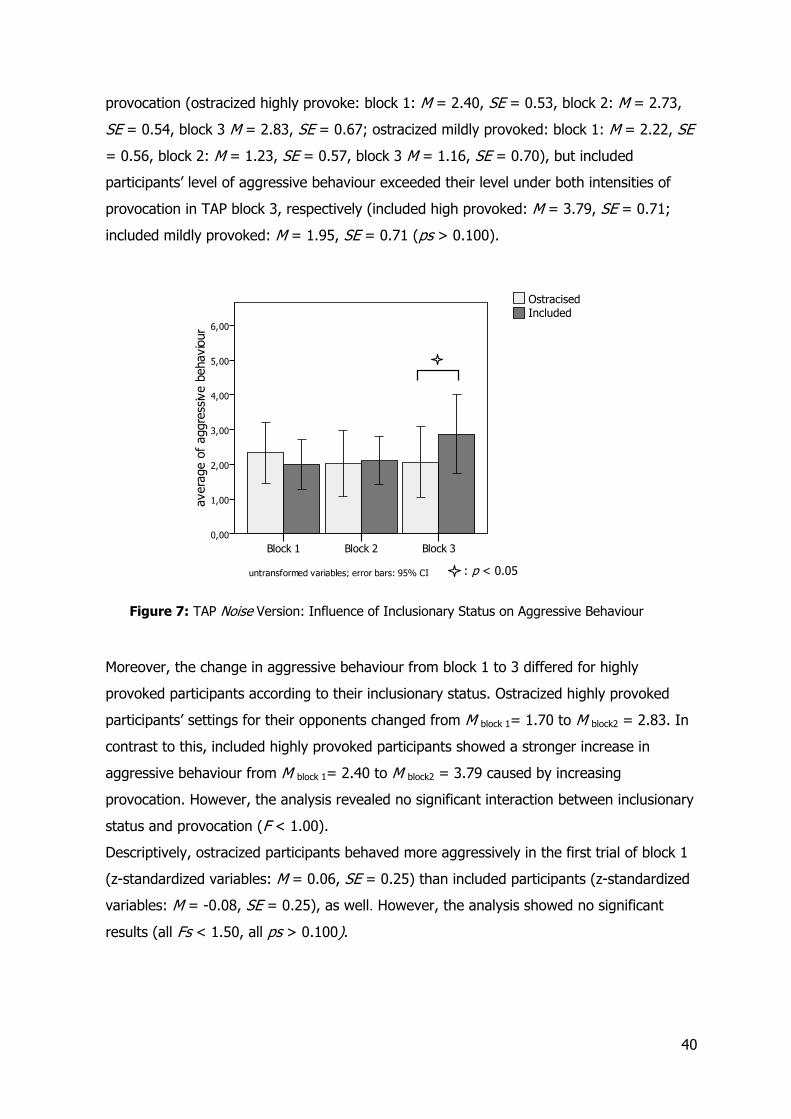
40
provocation (ostracized highly provoke: block 1: M = 2.40, SE = 0.53, block 2: M = 2.73,
SE = 0.54, block 3 M = 2.83, SE = 0.67; ostracized mildly provoked: block 1: M = 2.22, SE
= 0.56, block 2: M = 1.23, SE = 0.57, block 3 M = 1.16, SE = 0.70), but included
participants’ level of aggressive behaviour exceeded their level under both intensities of
provocation in TAP block 3, respectively (included high provoked: M = 3.79, SE = 0.71;
included mildly provoked: M = 1.95, SE = 0.71 (ps > 0.100).
Moreover, the change in aggressive behaviour from block 1 to 3 differed for highly
provoked participants according to their inclusionary status. Ostracized highly provoked
participants’ settings for their opponents changed from M block 1= 1.70 to M block2 = 2.83. In
contrast to this, included highly provoked participants showed a stronger increase in
aggressive behaviour from M block 1= 2.40 to M block2 = 3.79 caused by increasing
provocation. However, the analysis revealed no significant interaction between inclusionary
status and provocation (F < 1.00).
Descriptively, ostracized participants behaved more aggressively in the first trial of block 1
(z-standardized variables: M = 0.06, SE = 0.25) than included participants (z-standardized
variables: M = -0.08, SE = 0.25), as well. However, the analysis showed no significant
results (all Fs < 1.50, all ps > 0.100).
Figure 7: TAP Noise Version: Influence of Inclusionary Status on Aggressive Behaviour
Ostracised Included
: p < 0.05

41
Money version
In the Money Version, the participants' sex seemed to have an important influence on
aggressive behavior in the TAP. Table 4 depicts the influence of sex and inclusionary
status on aggressive behaviour in general in the TAP. If ostracised, females reacted less
aggressive than when included. However, being ostracised had the opposite influence on
men: they deducted more money from their opponents compared to included males.
Interestingly, included females constituted the group, which punished their opponents
worst; included male punished their opponents the least.
Table 4: TAP Money Version; Interaction between Sex and Ostracism
Ostracised Included Dependent Variable Aggressive behaviour over all three blocks M SD M SD F
Female -,060
(,052)
,286
(,023)
,419 a
(,090)
,286
(,023)
Male ,190
(,072)
,286
(,023)
-,549 b
(,013)
,286
(,023)
F(1,24) = 4.52;
p < .050;
η² = 0.16
Note: z- standardised variables; in brackets the untransformed data. a, b: significant difference, p < .050.
This pattern was partially confirmed by the statistical analysis, revealing a significant
interaction between sex and inclusionary status (F(1,24) = 4.52, p < .050; η² = 0.16). Post-
hoc tests showed that included females behave significantly more aggressive than included
males (p < .050).
Table 5 outlines the aggressive behaviour of ostracized as well as included participants in
the TAP money version.
Table 5: TAP Money Version; Relationship between Inclusionary Status and Aggressive Behaviour in the First Trial, Block 1, 2 and 3
Ostracised Included Dependent Variable Aggressive behaviour in the TAP money versions M SE M SE
First trial of Block 1 0.09 0.04 0.05 0.04
Block1 0.05 0.01 0.04 0.01
Block 2 0.06 0.02 0.05 0.02
Block 3 0.08 0.02 0.07 0.02
Ostracized participants behaved slightly more aggressively in the first trial than included
ones. Moreover, although not depicted, highly provoked ostracized participants constituted
the most aggressive group compared to included participants. However, the aggressive
behaviour in block 1, 2 and 3 does not seem to be influenced by inclusionary status or an

42
interaction of this variable. Statistical analysis revealed no significant influence of
inclusionary status on aggressive behaviour in the three blocks of the TAP money version
(F < 2.50, p > 0.100).
The pattern of the relationship between inclusionary status and provocation differed from
the one found in the TAP noise version (see Figure 8). Ostracised and highly provoked
participants behaved most aggressively in all three blocks of the TAP compared to all other
participants. Moreover, increasing provocation resulted in increasing aggressive behaviour.
Interestingly, ostracized and mildly provoked participants showed the least aggressive
behaviour in block 2 and 3. In general the deduced money was not much, participants’
mean deduction did not exceed 0,15€.
However, the analysis revealed no significant interaction between inclusionary status and
provocation (F < 2.30, p > 0.100).
The analysis of the first trial of the TAP showed no significant results (all Fs < 2.00, all ps
> 0.100), either.
5.3.2. Additional analysis: further results of TAP money version
Figure 9 presents the effects of sex on aggressive behaviour in block 1 to 3. Female
participants reacted more strongly to the provocation than their male peers. The analysis
revealed an interaction between gender and TAP block (F(2,48) = 3.29; p < .050; η² =
0.12). Females substracted significantly more money from their opponents from block 1 to
Figure 8: TAP Money Version: Influence of Inclusionary Status and Provocation on Aggressive Behaviour
Note: average of aggressive behaviour � mean deduction to the amount of 0,60€ at most.
Block 1 Block 2 Block 3
high low

43
Note: average of aggressive behaviour � mean deduction to the amount of 0,60€ at most.
Male
Female
: p<0.001
3 (p < .001) and more in block 3 compared to the male participants (p < .001). Note that
this was irrespective of the amount of provocation.
5.3.3. Ostracism and evaluation of the opponents and self-reported future
settings in the TAP
Evaluation of the team-mates
Figure 10 depicts the interaction between inclusionary status and provocation on the liking
of the team-mate in the TAP. Descriptively, participants who were highly provoked liked
their team-mate slightly less than those participants who were mildly provoked.
Interestingly, ostracized participants who were highly provoked liked their team-mate more
than included and highly provoked as well as ostracized and mildly provoked participants.
The analysis confirmed this pattern, revealing a significant interaction between Inclusionary
status and provocation (F(1,48) = 4.08. p < .050; η² = .08). The post-hoc test showed that
included participants liked their team-mate significantly more under low than under high
provocation conditions (p < .050).
Moreover an interaction between TAP version and provocation also reached significance
(F(1,48) = 4.08; p < .050; η² = .08). Highly provoked participants in the TAP money version
(M = 2.88, SE = 0.22) evaluated their team-mate as less friendly than mildly provoked
ones (M = 3.58, SE = 0.22). In the TAP noise version, participants did not differ in their
Figure 9: TAP Money Version: Influence of Sex on Aggressive behaviour
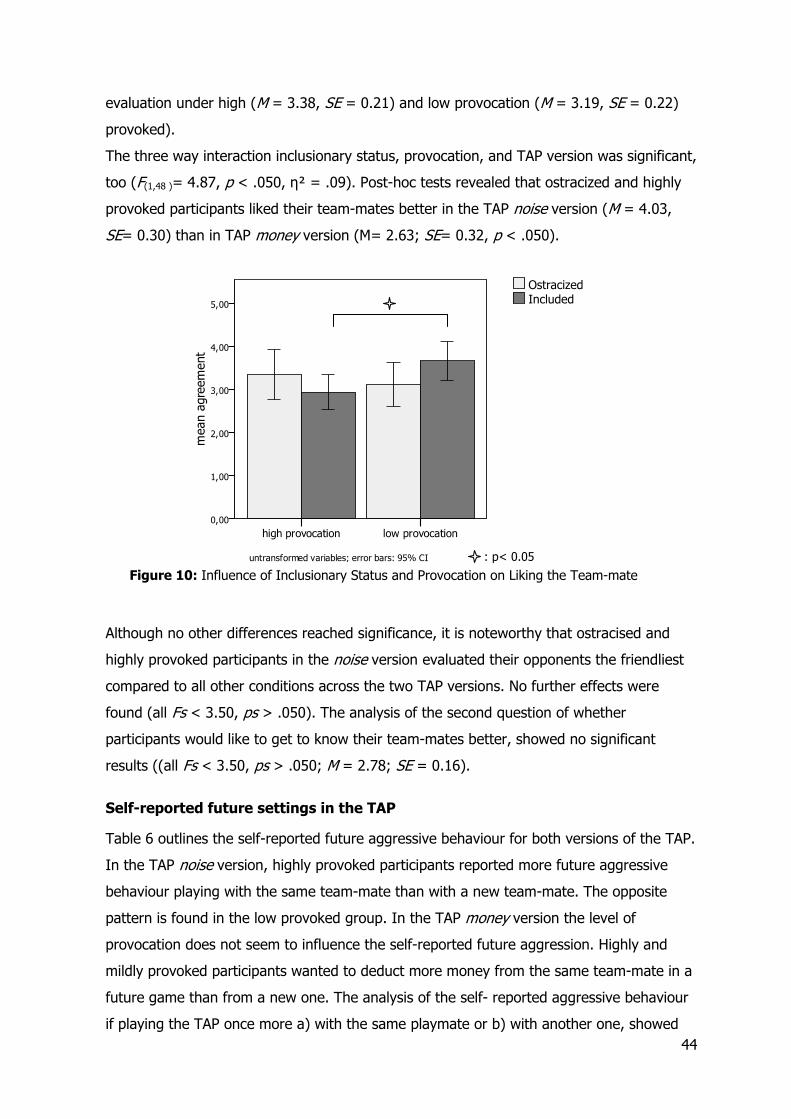
44
evaluation under high (M = 3.38, SE = 0.21) and low provocation (M = 3.19, SE = 0.22)
provoked).
The three way interaction inclusionary status, provocation, and TAP version was significant,
too (F(1,48 )= 4.87, p < .050, η² = .09). Post-hoc tests revealed that ostracized and highly
provoked participants liked their team-mates better in the TAP noise version (M = 4.03,
SE= 0.30) than in TAP money version (M= 2.63; SE= 0.32, p < .050).
Although no other differences reached significance, it is noteworthy that ostracised and
highly provoked participants in the noise version evaluated their opponents the friendliest
compared to all other conditions across the two TAP versions. No further effects were
found (all Fs < 3.50, ps > .050). The analysis of the second question of whether
participants would like to get to know their team-mates better, showed no significant
results ((all Fs < 3.50, ps > .050; M = 2.78; SE = 0.16).
Self-reported future settings in the TAP
Table 6 outlines the self-reported future aggressive behaviour for both versions of the TAP.
In the TAP noise version, highly provoked participants reported more future aggressive
behaviour playing with the same team-mate than with a new team-mate. The opposite
pattern is found in the low provoked group. In the TAP money version the level of
provocation does not seem to influence the self-reported future aggression. Highly and
mildly provoked participants wanted to deduct more money from the same team-mate in a
future game than from a new one. The analysis of the self- reported aggressive behaviour
if playing the TAP once more a) with the same playmate or b) with another one, showed
Figure 10: Influence of Inclusionary Status and Provocation on Liking the Team-mate
Ostracized Included
: p< 0.05

45
somewhat contradictory results for the main effect for level of provocation (see Table 6;
noise version: a: F(1,25) = 4.46, p < .050; η² = .15; b: F(1,25)=0.02; p > .010; n.s.; money
version: a: F(1,21) = 3.05, p < .100; η² = 0.13; b: F(1,23) = 3.15, p < .100; η² = 0.12).
Table 6: Main Effect of Provocation on Self reported Anger concerning the TAP, Both Versions; Post-experiment Questionnaire
TAP noise version TAP money version High
provocation Low
provocation High
provocation Low
provocation Dependent Variable M SE M SE M SE M SE
Self reported aggressive
behaviour in future TAP
a) with the same playmate 3.98 0.68 1.94 0.69 0.10 0.3 0.03 0.03
b) with another playmate 1.98 0.42 2.06 0.43 0.06 0.02 0.01 0.02
Note: self reported aggressive behaviour unit is identical to the unit of the data of each TAP Version
Participants who were highly provoked chose significantly higher levels for a future TAP
turn than mildly provoked only when playing with the same team-mate, but not when
playing with another one. The reported settings for the same team-mate were about as
high as those of the TAP block 3. This effect was highly significant for the TAP version
noise, however less strong for the money version.
5.4. Hypotheses III: Mood
The following section outlines the results concerning the influence of inclusionary status on
self-reported mood. First, the results of the PANAS at measurement point two, after the
Cyberball and measurement point three, after the TAP, are presented. Then the results of
the mood measurement of the post-experimental questionnaire are shown. The section
concludes with the results of the analyses referring to the mediating role of mood between
inclusionary Status and aggressive behaviour
5.4.1. Mood measured with the PANAS
Means and standard errors of self-reported levels of positive and negative affect as well as
anger at measurement point two and three are depicted in Table 7. Descriptively,
ostracized participants reported lower levels in positive affect at both measurement points.
Yet, they experienced more negative affect and anger after the Cyberball game than
included participants. However, after the TAP, ostracized participants reported lower levels
of negative affect and anger compared to their included peers.

46
It is interesting to note that the change in negative mood and anger from the second to
the third mood measurement differed descriptively between included and ostracized
participants. Whereas included subjects reported more negative affect and anger after the
TAP than after the Cyberball, ostracised subjects’ negative mood and anger decreased.
Table 7: Interaction between Inclusionary Status and Measurement Point 2 and 3 of PANAS Positive and Negative Affect as well as Anger
Dependent Variables Ostracised Included
PANAS Measurement point M SE M SE
2 -.397 a .120 .340 b .122 positive affect 3 -.053 .142 .071 .144
2 .067 .148 -.227 b .147 negative affect
3 -.103 .170 .070 a .169
2 .160 a .158 -.305 b .159 anger 3 -.059 .181 .042 .182
Note: z- standardised variables; significant difference for each measured affect: a, b: p < .050
The results of the inferential statistical analyses revealed a main effect of inclusionary
status (F (1,44) =7.52, p < .050, η² = .15) with ostracized participants experiencing less
positive affect compared to included participants. Negative affect and anger showed no
main effect either (both Fs < 1.5, both ps > .100).
Ostracised participants reported significantly lower levels of positive affect (PANAS positive:
Interaction inclusionary status X measurement time: F(1,44) =8.66, p < 0.010, η² = .164) as
well as higher levels in negative affect and anger (PANAS negative: Interaction inclusionary
status X measurement time: F(1,45) = 4.36, p < 0.050, η² = .09; PANAS anger: (marginal)
Interaction inclusionary status X measurement time : F(1,46) = 3.85, p < 0.100, η² = .08) in
comparison to included participants.
As Table 7 depicts, post-hoc tests revealed that ostracised participants experienced lower
positive affect and more anger than the included ones only right after the Cyberball
(PANAS positive: p < .010; PANAS anger: p < .050) but not after the TAP. Included
participants, however, reported more negative affect after the TAP than after the Cyberball
(PANAS negative: p < .050). The increase in anger of included participants from the
second (after Cyberball) to the third (after TAP) measurement time just failed to reach
significance as did the difference between ostracized and included participants in negative
affect after the Cyberball.

47
The manipulation of provocation influenced self-reported mood, too. High provocation also
resulted in lower positive affect (Interaction Provocation X measurement time: F (1,44) =
7.68, p < .050, η² = .15). Contrary to this, negative mood and anger were not significantly
influenced by provocation (Interaction Provocation X measurement time: both Fs < 2.03,
both p s>.100).
The two TAP versions had a different influenced on self-reported positive mood
(Interaction TAP version X measurement time: F (1,44) = 9,71, p < .010, η² = .18). The
post-hoc tests revealed that participants of the noise version reported significantly less
positive mood after the TAP than those of the money version (p < .010). Negative mood
and anger were not significantly influenced by the TAP versions (Interaction TAP version X
measurement time: both Fs < 1.00, both p s>.100).The three-way interaction between
inclusionary status, provocation, and measurement time was significant for PANAS anger (F
(1,46) = 4.97, p < .050, η² = .10). Post-hoc tests revealed that included, but highly
provoked participants reported higher levels of anger after the TAP than before the TAP (p
< .050) and than the low provocation group after the TAP (p < .050). Ostracized
participants did not differ significantly in their anger after low or high provocation (p >
.100).
5.4.2. Mood measured with the post-experimental questionnaire
Figure 11 presents the influence of inclusionary status on self-reported anger about the
Cyberball and the TAP, enjoyment playing the Cyberball game or the TAP, and experienced
anxiety during these tasks. Descriptively, ostracized participants reported more anger and
anxiety concerning the Cyberball game as well as less enjoyment playing this game
compared to their included team-mates. Interestingly, this pattern changed when
ostracized participants reported about their feelings during the TAP. During this task,
ostracized participants experienced less anger and anxiety as well as more enjoyment than
those who were included. In contrast to this decrease in negative feelings and increase in
positive feelings from one task to the next, included participants reported more anger and
anxiety as well as less enjoyment concerning the TAP compared to the Cyberball game. But
considering the absolute values of agreement with statements about experienced anger
and anxiety during both tasks, it is overall more a disagreement than accordance. The
analysis of self-reported anger revealed a main effect of inclusionary status (F(1,48) = 4.64,
p < .050, η² = .09), provocation (F(1,48) = 11.643, p < .010, η² = .20) and TAP version
(marginal, F(1,48) = 3.33, p < .100, η² = .07). Post-hoc tests revealed higher levels of anger
for ostracized participants compared to included ones, for highly provoked participants
compared to mildly provoked ones and for participants of the TAP money version
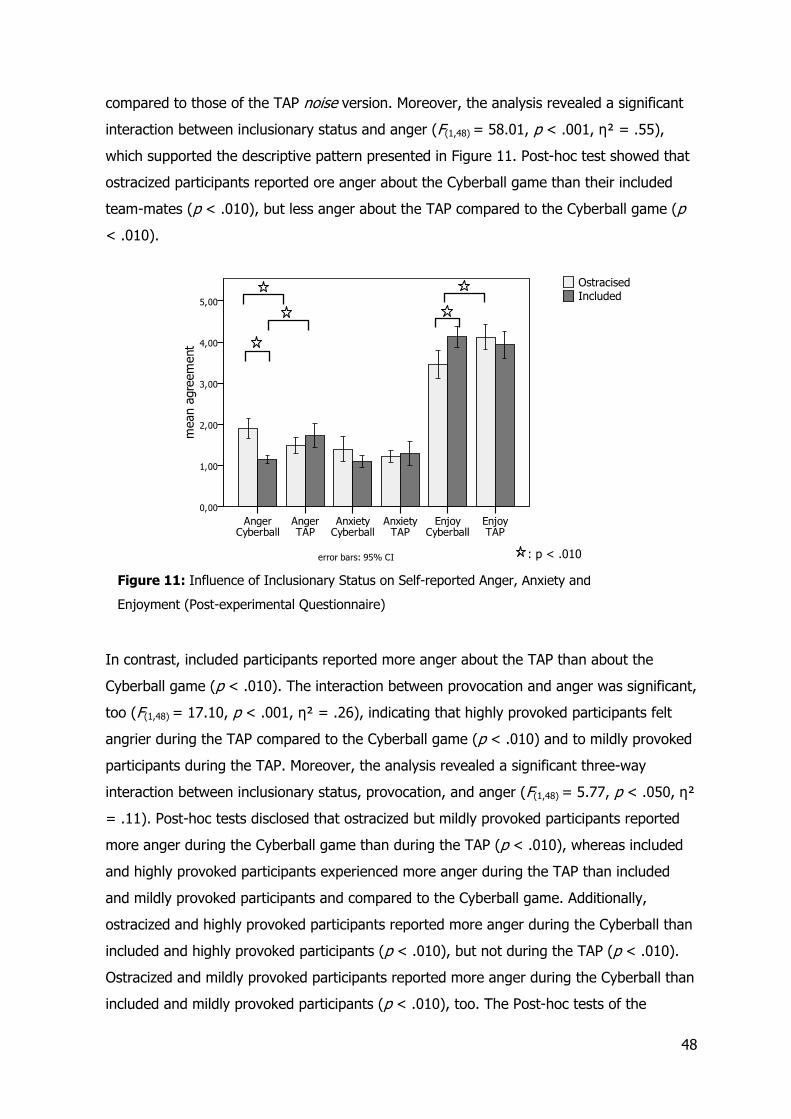
48
compared to those of the TAP noise version. Moreover, the analysis revealed a significant
interaction between inclusionary status and anger (F(1,48) = 58.01, p < .001, η² = .55),
which supported the descriptive pattern presented in Figure 11. Post-hoc test showed that
ostracized participants reported ore anger about the Cyberball game than their included
team-mates (p < .010), but less anger about the TAP compared to the Cyberball game (p
< .010).
In contrast, included participants reported more anger about the TAP than about the
Cyberball game (p < .010). The interaction between provocation and anger was significant,
too (F(1,48) = 17.10, p < .001, η² = .26), indicating that highly provoked participants felt
angrier during the TAP compared to the Cyberball game (p < .010) and to mildly provoked
participants during the TAP. Moreover, the analysis revealed a significant three-way
interaction between inclusionary status, provocation, and anger (F(1,48) = 5.77, p < .050, η²
= .11). Post-hoc tests disclosed that ostracized but mildly provoked participants reported
more anger during the Cyberball game than during the TAP (p < .010), whereas included
and highly provoked participants experienced more anger during the TAP than included
and mildly provoked participants and compared to the Cyberball game. Additionally,
ostracized and highly provoked participants reported more anger during the Cyberball than
included and highly provoked participants (p < .010), but not during the TAP (p < .010).
Ostracized and mildly provoked participants reported more anger during the Cyberball than
included and mildly provoked participants (p < .010), too. The Post-hoc tests of the
Figure 11: Influence of Inclusionary Status on Self-reported Anger, Anxiety and
Enjoyment (Post-experimental Questionnaire)
Ostracised Included
: p < .010

49
significant three-way interaction between TAP version, sex, and anger (F(1,48) = 6.28, p <
.050, η² = .12) depicted that male participants reported less anger during the TAP noise
version than during the TAP money version. No further effects were found (all Fs < 2.50,
ps > .100).
The results of the inferential statistical analysis of reported anxiety revealed an interaction
between the factors inclusionary status, provocation, and sex each with TAP Version
(Interaction: inclusionary status X TAP version: F(1,48) = 6.36, p < .050, η² = .12,
Interaction: provocation X TAP version: F(1,48) = 7.76, p < .010, η² = .14, Interaction: sex X
TAP version :F(1,48) = 5.09, p < .050, η² = .10). Post-hoc tests disposed that ostracized
participants reported significantly more anxiety in general than included ones only in the
TAP money version, not in the noise version. In contrast to this, highly provoked
participants reported more anxiety than mildly provoked ones only in the TAP noise
version. Female participants experienced more anxiety than their male peers in the TAP
noise version, not in the money version. Further main effects or interactions failed to reach
significance (all Fs < 4.00, all ps > .050).
The analysis of enjoyment of the task, either the Cyberball game or the TAP, revealed a
main effect of the repeated measurement, indicating that participants enjoyed the TAP
more than the Cyberball game (F(1,48) = 4,76, p < .050, η² = .09). Moreover, the
enjoyment was influenced by the inclusionary status (Interaction: inclusionary status X
enjoyment of the task (repeated measure): F(1,48) = 13.68, p < .001, η² = .22) and the TAP
version. (Interaction: TAP version X enjoyment of the task (repeated measure): F(1,48) =
4.40, p < 0.050, η² = .08). Post-hoc tests could show that ostracized participants
experienced less enjoyment during the Cyberball game than included ones and compared
to playing the TAP (p < .010). Additionally, participants enjoyed more playing the TAP
money version than the noise version and more than playing the Cyberball game (p <
.050). The Post hoc test of the three-way interaction between inclusionary status, sex, and
enjoyment of the task (F(1,48) = 7.47, p < .010, η² = .14) revealed that female participants
who were ostracized enjoyed the TAP more than the Cyberball game (p < .010) and
reported less enjoyment during this ball-tossing game than their included female team-
mates (p < .050) and than ostracized male participants. This was supported by the
significant interaction between inclusionary status and sex (F(1,48) = 4,15, p < .050, η² =
.08). Ostracized males reported more enjoyment in both tasks than their ostracized female
peers (p < .010), who reported less enjoyment than their included female team-mates, too
(p < .010). Further main effects or interactions were not significant (all Fs < 3.50, all ps >
.050).
50
5.5. Hypothesis IV: Mediation of mood between ostracism and
aggressive behaviour
As inclusionary status and aggressive behaviour in the TAP block 1 to 3 were not correlated
(rBlock1 = -.11, p>.050; rBlock2 = -.03, p> .050; rBlock3 = .07, p>.050), an analysis of a
mediation was not sensible.
5.6. Hypothesis V: Mediation of dispositional factors between
ostracism and aggressive behaviour
As inclusionary status and aggressive behaviour in the TAP block 1 to 3 were not correlated
(r²Block1 = .01, p >.050; r²Block2 = .00, p > .050; r²Block3 = .00, p >.050), an analysis of a
mediation was not in order.
5.7. Explorative analyses of the relationship between dispositional
factors and aggressive behaviour in the TAP
Unfortunately the planed mediator analyses were not possible. Nevertheless, the data
should not have been collected in vain.
Zardo et al (2004) investigated the influence of social anxiety on ostracism and aggressive
behaviour. They found out that social anxiety did not moderate the impact of ostracism on
the primary needs, but it did affect the persistence of aversive effects of ostracism. In fact,
highly anxious participants recovered from effects of the ostracism experience more slowly
than did the non-anxious participants. Thus, it might be possible that other dispositional
factors are affected by ostracism and hence influence the exclusion-induced aggressive
response. What is the role of personality traits concerning anger and aggression? Does the
experience of exclusion enhance or delete the influence of traits?
To address these questions, ostracism was tested for its moderating qualities of the
relationship of dispositional factors and aggressive behaviour in the TAP. As noted above,
inclusionary status and aggressive behaviour in the TAP were not correlated. Additionally,
no correlation between inclusionary status and measured dispositional factors of anger,
aggression, or stress were found (see appendix, table 1), except “openness” (measured
with the ”FAF”). Consequently, this variable was excluded of the analyses.
Correlations between the trait variables and aggressive behaviour in the TAP in
consideration of the inclusionary status were calculated and are depicted in the tables 1 - 8
in the appendix. The results revealed a different pattern for ostracized in comparison to
included participants (see tables 2 - 5 of the appendix). Whereas most variables measuring
dispositional bias concerning anger and aggression correlated with aggressive behaviour in

51
the TAP of included individuals (e.g.: Block1 X agitation: TAP noise version r² < .27, p
<.050; TAP money version r² < .13, p <.050; TAP money version: Block 1 X aggression
inhibition: r² < .32, p <.050; Block 2 X aggression inhibition: r² < .26, p <.050; Block 3 X
aggression inhibition: r² < .35, p <.050; TAP noise version: Block 1 X self-aggression: r² <
.32, p <.050; Block 2 X self-aggression: r² < .21, p <.100; Block 3 X self-aggression: r² <
.33, p <.050), nearly no correlations were found for ostracized participants (all r² s both
versions= .09, p >.100; all r²s each version = .20, p >.100; ). In contrast to these finding,
correlations with individual differences in reactivity to stress depicted another pattern.
Whereas in the group of included participants only dispositional reactivity to stress caused
by social evaluation were positive related to each other, more variables were related in the
group of ostracized individuals. In this group reactivity in the pre-stress phase, to stress
caused by overwork and failure at work were positively related to the aggressive behaviour
in the TAP money version. High reactivity in the post-stress phase came along with less
aggressive behaviour in this version.
In sum, these results indicate that the response to the aversive experience of being
ostracized is influenced by dispositional stress characteristics and not by various anger or
aggression biases.

52
6. Discussion
In the present chapter the results, outlined in the previous chapter, will be discussed along
the order of the hypotheses.
Ostracism was successfully induced with the help of the Cyberball game. Ostracized
participants perceived correctly that they received fewer balls than their team-mates and
consequently felt rejected. Thus, the reliable induction of ostracism with the help of this
method demonstrated in several studies (e.g.:Warburton et al., 2006; Williams et al., 2000;
Williams et al., 2002; Zadro et al., 2004; Zadro & Williams, 2006) could be replicated.
Additionally, the induction of provocation was successful, as well. In both versions of the
TAP, we found an increase in aggression with increasing levels of provocation replicating
previous studies (e.g.: Bertsch et al., 2009; Chermack, Berman, & Taylor, 1997; Taylor,
1967).
However, compared to literature, the effects for these results of provocation (noise
version: η² = .30; ω² = 0.16; money version: η² = .16; ω² = 0.07) were not as high as
expected (Chermack et al., 1997: ω² = .38). Usually, mean settings around 7 till 8 are
found for the provoked participants in block 3. Figure 4 depicts in fact a tendency towards
small settings for the punishment in both versions. Nevertheless, mean settings of
participants who were exposed to low provocation were even lower.
Based on this satisfactory manipulation check, the outcomes of the hypotheses are
presented in the following.
6.1. Ostracism threaten four fundamental needs
Ostracism is supposed to threaten four fundamental human needs: the need to belong,
self-esteem, the need to control, and meaningful existence. In the line with previous
studies, (e.g.: Sommer et al., 2001; Twenge et al., 2003; Williams et al., 2000; Williams,
2001; Zadro & Williams, 2006), a low level of all these four needs was reported by
ostracized participants. Interestingly, the need to control and the need to belong wee most
threatened by the exclusion during the Cyberball game. According to the model of
ostracism, developed by Williams (1997, 2005), a threat of relational needs, as the need to
belonging, will lead to a relatively prosocial behaviour to fortify these needs. Yet, if the
need to control is most threatened, Williams and colleagues (2005) propose a proactive
and even aggressive behaviour to re-establish the feelings of efficacy. Consequently two
opposite behaviours are possible for ostracized participants.

53
6.2. Ostracism leads to enhanced aggressive behaviour
6.2.1. TAP
Recently, ostracism was supposed to constitute a possible reason and elicitor of aggressive
behaviour. Several studies consistently confirmed this assumption (for a review see Leary
et al., 2006). However, the present results do not fully support the hypothesis. Primarily,
the version of the Taylor aggression paradigm (TAP) led to different pattern in aggressive
behaviour of ostracized individuals. Thus, the type and mode of provocation and
aggressive behaviour influenced the reaction of those who were not previously included.
Hence, the results of the two different TAP versions are discussed separately.
Noise version
This version corresponded the task used by others as a measurement of aggressive
behaviour in the research of ostracism and aggression (e.g.: DeWall, Twenge, Gitter, &
Baumeister, 2009; Twenge et al., 2003; Warburton et al., 2006). These studies
concentrated on the noise blast settings in the first trial or block of this task as these
reactions were regarded as a measure of rejection-induced unprovoked aggression.
The present results show that descriptively ostracized participants exposed their game
partners to more painful noises than included participants directly after experiencing
ostracism (TAP first trial and block 1). Although this difference did not reach significance,
the behavioural pattern supports the results of many studies, which found out that
exclusion lead to aggressive behaviour (e.g.: Buckley et al., 2004; DeWall et al., 2009;
Twenge et al., 2001; Twenge et al., 2007; Warburton et al., 2006).
However, most real-life interpersonal aggressive encounters are characterized by a
reciprocal escalatory interchange of provocations (Taylor & Chermack, 1993) and exclusion
and possible reaction happen in a social context, which makes culmination of verbal abuses
and retaliation possible. Thus, one aim of the present study was to examine the effects of
ostracism in combination with increasing provocation and possible retaliation on aggressive
behaviour. The results of TAP block 2 and 3 showed that ostracized participants behaved
less aggressively than included participants, irrespective of the provocation they received
from their opponents. Considering the amount of provocation to which the participants
were exposed, the results revealed that provocation did not influence the behaviour of
those who were ostracized in the expected way. Ostracized participants did not respond to
their partner's increasing provocation by showing strong retaliations observed in the highly
provoked included participants (TAP block 2 and 3). When exposed to very high levels of
provocations (TAP block 3), ostracized participants were even less aggressive than included

54
participants. Thus, the present results indicate that ostracized highly provoked participants
do not retaliate against the punishment under likewise increasing provocation.
This could be explained in different ways. According to the model of Williams, this non-
aggressive behaviour suggests that ostracized participants tried to fortify their need to
belong in the course of the task. However, the low levels of sense of control caused by
ostracism would imply likewise a try to regain control. Thus, the assumptions of the model
do not clarify which responses were to be expected in this setting.
On one side, participants’ behaviour to increasing provocation may reflect learned
helplessness. When individuals experience that they could not change the situation and
that their action does not matter, they will feel and become helpless, and consequently fail
to initiate any action and therefore show reduced aggressive behaviour (Peterson et al.,
1993). As reasoned in section two, the experience of ostracism itself might have lead to a
form of helplessness. In the present study, ostracized participants’ sense of control was
first shattered during the Cyberball. At the beginning of the reaction time task (TAP), these
participants behaved in the first trial and the following of block 1 aggressively taking the
opportunity to retaliate for being ostracized and mildly provoked. They exposed those who
ostracized them to more painful noises. This could be interpreted as a try to regain control.
However, during the course of the TAP, these ostracized and highly provoked participants
might have realized that they were again in an uncontrollably aversive situation, in which
their partners exposed them to more and more painful noises no matter how they
behaved. This might have resulted in a state of learned helplessness and they may have
just awaited the game's ending.
One the other side, non-aggressive behaviour in the TAP can be due to the fact that
participants were students in their first year who were playing with their peers. Participants
had just began their studies and lived in Trier for approximate two months. Their circle of
friends in the new town was most probably not established, yet. We made sure that the
participants taking part at the same time were not friends, but most participants explained
that they knew each other by sight. Thus, each fellow student whom participants met right
before the experiment constituted a probable new friend, promising candidates for friendly
social connection, or at least someone who will accompany them during their time at the
university. Consequently, participants showed reduced aggressive behaviour not to ruin
their chance of a new friendship and an amicable first contact. Several studies found out
that socially excluded participants were eager to replenishing connectedness. Gardner et
al. (2000) found that people who were excluded subsequently paid more attention to the
social aspects of a diary, presumably because exclusion made interpersonal information

55
more salient to a current need. A recent investigation by DeWall et al. (2009a) found that
excluded people typically desire to form new social bonds, as indicated by greater interest
in interacting with potential partners, optimistic assessments of others as friendly, and the
assignment of positive evaluations to people they expect to meet, although they did not
assign positive evaluations to other people with whom no interactions were anticipated.
Being torn between on the one side fortifying their need to control by retaliating against
the painful provocation and on the other side re-establishing their need to belong by non-
aggressive behaviour, ostracized highly provoked participants end up undecided. Their
reaction was neither resolutely aggressive nor truly socially desirably. Therefore their
response in the first trial and the first block was not aggressive enough to reach statistical
significance and they were less aggressive in block 2 and 3 than included participants.
In the low provocation condition, ostracized participants were nearly as aggressive as
ostracized highly provoked participants directly after being socially excluded (TAP block 1).
The first block of the TAP was identical for all participants, thus, they were exposed to mild
provocation. As those participants who were ostracized and in the later course of the TAP
(block 2 and 3) gradually highly provoked, these participants (ostracized and later low
provoked) took the opportunity to retaliate for being ostracized and mildly provoked in TAP
block 1, too. They exposed those who ostracized them to more painful noises, probably to
regain control.
However, when the game went on (TAP block 2 and 3) and these participants were only
exposed to low provocation, they showed the least aggressive behaviour of all groups. The
constantly little provocative behaviour of their partners, which even did not change during
the first block when participants behaved aggressively towards their partners, may have
been a positive surprise to the ostracized participants. This “nice” and cooperative
behaviour might have been seen as an opportunity to re-establish the thwarted need of
belonging and prevent these individuals from feeling helpless. The best way to fortify the
need of belonging was in showing nice and socially desirable, less aggressive behaviour
themselves. Similar to this, previous studies found that socially excluded participants were
not aggressive toward individuals who praised them (Twenge et al., 2001) or towards a
partner, who initiated and maintained a cooperative stance (Twenge et al., 2007a;
Experiment 5).
Additionally, these ostracized and low provoked participants were playing with their peers.
Therefore future interactions with the team-mate after the experiment were to be
expected. Twenge et al. (2003) found out that rejected individuals were less aggressive
towards someone with whom they expected to interact later on in the experiment (for

56
review see, Twenge, 2005). Consequently, the very low levels of aggressive behaviour
could also be caused by the socially important opponents.
Interestingly, the effort to re-establish the need for belonging caused this group of
participants to behave even less aggressively than accepted participants. However, the
included and low provoked participants had no reason to behave especially friendly and
cooperatively, as their social connectedness were not shattered in the course of the
experiment.
Money version:
Descriptively, in contrast to the noise version, ostracized participants retaliated against the
punishment under likewise increasing provocation in this version. Moreover, their
aggressive behaviour exceeded the level of the response of included participants. However,
the mean level of deduction was very low for all groups. Ostracized and mildly provoked
participants showed decreasing aggressive behaviour in block 2 and 3. Thus, it seems, as if
the contact with their peers and the low levels of the need to belong and the need to
control did not have the same influence on participants’ behaviour in this version of the
TAP.
Moreover, participants’ sex has to be taken into account, as it played a major role with
regard to aggressive behavior. Ostracized males subtracted more money from their
ostracizing peers' account then included males and ostracized females. However, included
females showed more aggressive behavior then included males and female participants
were in general more responsive to increasing levels of provocation than male participants.
Taken together, ostracism increased aggression in male but not in female participants,
which reacted strongly to the increasing levels of provocation.
Williams & Sommer (1997) found sex differences in social behavior after ostracism, too.
After a ball-tossing game with two other individuals, participants had to work on an idea-
generation task either coactively, in which the individual effort would be evaluated or
collectively, in which the group's effort would be assessed. Males socially loafed, i.e., they
worked less hard collectively than coactively, whether they had been ostracized or included
in the ball-tossing game. However, ostracized females socially compensated, i.e., they
worked harder in the collective than in the coactive condition. In line with this, diminished
aggression in ostracized women in the present study may be interpreted as an enhanced
effort toward a pro-social goal, namely being accepted by the group by showing socially
desirable behavior. This finding is parallel to those, found in the noise version. To fortify
the need to belong, ostracized female did not behave aggressively towards their peers.
Thus, in the money version, the present results replicated previously reported exclusion-

57
induced aggression effects (e.g.: DeWall et al., 2009a; Twenge et al., 2001), however, only
for male participants.
Sex differences in regard to the effects of ostracism on aggression have not been reported
so far. A plausible reason for this can be seen at least partly in task-related differences.
Although the TAP money version successfully induced aggression in highly provoked
participants, this task may have resembled a gambling task. The received as well as the
retaliated punishment was probably not experienced as harmful and injuring as the blast of
noises of the noise version. In fact, the money subtractions did not cause direct physical
harm but a delayed monetary setback. Subtracting some money from the partner's account
resulted in gaining less money, but may have made the game more interesting and
exciting. Taking into account the structure of this version, a deduction of money, even little
amount of money, was harmful for the participants, as well. This finding of increases in
aggressive behaviour in ostracized male participants, concurrently harming themselves, is
consistent with the results of a series of experiments, accomplished by Twenge et al.
(2002). They could show that social exclusion lead to unintentionally self-defeating
behaviour. Exclusion was manipulated by telling some people that they were likely to end
up alone later in life. Excluded people had a greater preference for choosing the risky long
shot in a lottery choice (Experiments 1, 2), a pattern which has been linked to irrational,
self-defeating behaviour. Moreover the results for ostracized male participants confirmed
the results of Twenge et al. (2007a), although they did not find sex differences, either.
Participants played the prisoner’s dilemma game (Rapoport, Chammah, & Orwant, 1965), a
task in which only prosocial, cooperative behaviour leads to a gain of both players. Socially
excluded participants showed antisocial behaviour although it actually cost them money.
Based on these explanations, it seems as if in this task version ostracized males showed
self-defeating, risky, antisocial behaviour, which was not necessarily intended to really
harm their opponent, as the deduced amount of money was low. However, on average,
females have been found to be more risk aversive than males in financial decision-making
(Byrnes, Miller, & Schafer, 1999). The present results indicate that these sex differences
could be modulated by interpersonal devaluation. Thus, being excluded and provoked by
peers lead to an effort to fortify the need to belong only in female participants. Thwarted
feelings of belonging rather seem to increase risk aversion in females while they may have
increased risk taking in males.
58
6.2.2. Evaluation of the team-mate and future settings in the TAP
Evaluation of the team-mate
Included highly provoked participants liked their team-mates less than included but low
provoked participants. Several studies have revealed that excluded participants criticize and
devalue those, who rejected them (e.g.: Buckley et al., 2004; Bourgeois & Leary, 2001;
Williams et al., 2002; Zadro & Williams, 2006). In contrast to these findings, the present
study showed that descriptively ostracized highly provoked participants liked their
opponent more than included highly provoked participants. Moreover, ostracized highly
provoked participants significantly liked their partners more in the TAP noise version
compared to the money version. This statement is consistent with the decreasing
aggressive behaviour in the noise version. A sex difference was not found for this
statement in the money version, which could count as a support for the assumption that
this task was played as gambling. Although ostracized males showed risky antisocial
behaviour, they did not devaluate their opponents. As mentioned above, DeWall et al.
(2009a) found out that excluded people evaluate those people more positively, if they
expected to meet them. This pattern confirms the assumption concerning the TAP noise
version and females of the money version that especially ostracized participants tried to re-
establish their social connectedness and belonging. Thus, sources of exclusion and
provocation are not derogated if these people constitute promising candidates for future
important interactions.
Future settings in the TAP
High provocation resulted in higher levels in a future TAP turn playing with the same team-
mate again. The reported future settings of participants who were exposed to low
provocation were very low in both versions for both scenarios. Warburton et al. (2006),
similar to Twenge et al. (2001), found participants aggressing even towards an innocent
person, who neither rejected nor insulted the participants, and Buckley et al. (2004)
revealed that this aggressive behaviour was not influenced by an anticipated interaction
with the source of rejection. The present findings suggest that further interactions with the
source of ostracism during the TAP lead to a focus of aggressive behaviour towards the
source of ostracism and provocation and away from neutral other persons.
Moreover, the cooperative behaviour experienced by low provoked participants in the TAP
reduced uncontrolled aggression against innocent neutral persons as well as against the
source of ostracism.
59
6.3. Ostracism-induced changes in mood
6.3.1. Results of self-reported mood measured with the PANAS
Ostracized participants reported less positive affect as well as more anger and slightly more
negative affect following the exclusion. These results confirm the assumption in the model
of Williams (1997, revised 2001, 2005), which indicates that ostracized individuals respond
to any form of ostracism with hurt feelings and pain. Thus, these results of the present
study is in line with several other studies, using the Cyberball game as a manipulation for
ostracism, which find emotional distress after ostracism (e.g.: Williams et al., 2000;
Williams, 2001; Zadro et al., 2004). However, other studies found that social exclusion lead
to feelings of inner numbness, which may reflect a natural coping mechanism which keeps
the excluded person from further emotional injuries (Baumeister et al., 2002; Twenge et
al., 2001; Twenge et al., 2002; Twenge et al., 2003). Different researchers suggest that
these contradicting results could be caused by different exclusion-inducing methods
(Baumeister et al., 2007a, Williams, 2007).
Interestingly, ostracized participants’ mood recovered in the course of the TAP and did not
differ at measurement point 3 from that of included participants, which reported more
negative affect after the TAP than before. Additionally, ostracized participants who were
highly provoked did not report more impaired mood than low provoked included and
ostracized participants. Twenge, Koole, DeWall, Marquez, & Baumeister (2006) measuring
non-consciously emotional responses found that excluded people exhibited not distress
but, instead enhanced positive emotionality. Thus, these results suggest that ostracized
participants tried successfully to cope by reconstituting their emotional status.
6.3.2. Results of self-reported mood measured with the post-experimental
questionnaire
At the end of the experiment, all participants reported low levels of anger and anxiety for
the Cyberball as well as the TAP and high levels of enjoyment of both tasks. Nevertheless,
ostracized and highly provoked participants reported more anger than included and mildly
provoked participants, respectively. Supporting the results of the PANAS, ostracized
individuals reported more anger about the Cyberball than about the TAP. High provocation
did not change this pattern for these participants. Moreover, ostracized participants
retrospectively stated that they enjoyed the TAP very much. The difference of the two TAP
versions was found in mood as well. Participants of the noise version reported less positive
mood compared to those of the money version. This finding and the fact that participants
experienced more enjoyment playing the money version, indicates that the deduction of

60
money was not as distressful as highly unpleasant noises. At the same time, participants,
especially males, of the money version reported more anger, which could be evoked by
risky behaviour and losses involved in the gambling task.
In sum these retrospective statements about anger and enjoyment confirmed the results of
the state mood questionnaire. Ostracized individuals use the opportunity to reduce
negative and increase positive feelings.
Taking together the results concerning mood indicate that the contact with potential
socially important peers, the prospect of re-established need of belonging, and passing of
time seem to enable ostracized to reduce negative feelings. Not only did these individuals
try to protect themselves from further emotional distress and injuries, but also sought for
positive feelings, such as enjoyment.
6.4. Mediation between ostracism and aggressive behaviour by mood
and by dispositional Factors
Several studies tried to find mediating factors, interindividual and situational ones, which
help explain the variety in responses to social exclusion, rejection, and ostracism, which
include aggressive behaviour, prosocial behaviour as well as devaluating team-mates and
efforts on collective tasks. However, until now, no dispositional mediators were found,
except empathy, control, and trust (both inconsistent results). The needs self-esteem and
belongingness, narcissism, mood, and social anxiety did not yield significant results.
Unfortunately, our data did not allow for addressing this question. However, the data of
the trait questionnaires should not have been collected in vain. Correlations between the
behaviour in the TAP and dispositional factors of anger, aggression and stress were
calculated considering the inclusionary status, in order to examine if it moderates between
this trait and the behaviour in the task. The results are discussed in the following.
6.5. Explorative analyses of the relationship between dispositional
factors and aggressive behaviour in the TAP
The results revealed that, as expected, dispositional anger and aggression correlated
positively with aggressive behaviour in the TAP under normal conditions, i.e.: within the
group of included participants. In contrast, there were nearly no correlations found for
ostracized individuals. Only aggression inhibition was negatively correlated with aggressive
behaviour in block 2 of both versions. It seems as if an aversive experience like the threat
of social connectedness clears individual differences of anger and aggression. However,
concerning individual differences in reactivity to stress showed another pattern. Whereas in
the group of included participants only dispositional reactivity to stress caused by social

61
evaluation were positively related to each other, more variables were related in the group
of ostracized individuals. In this group reactivity in the pre-stress phase, to stress caused
by overwork and failure at work were positively related to the aggressive behaviour in the
TAP money version. High reactivity in the post-stress phase came along with less deduction
of money.
These findings are in the line with recent research, which have dealt with cortisol, a
corticosteroid hormone, which is referred to as the "stress hormone", and social exclusion,
respectively rejection. For example, Gunnar, Sebanc, Tout, Donzella, & van Dulmen (2003)
found higher cortisol levels in children who were rejected by classmates compared to other
children. Zwolinski & Jennifer (2008) assessed psychosocial and neuroendocrine stress
responses to social exclusion in females Stroud, Salovey, & Epel (2002) found out that
women were more physiologically reactive to social rejection challenges, but men reacted
more to achievement challenges. However, the actual acute aggressively behaviour, the
retaliated punishment with aversive noises, correlated negatively with aggression inhibition
within the group of included participants and positively with self-aggression.
In sum these results indicate that the response to the aversive experience of being
ostracized is influenced by dispositional stress characteristics and not by various anger or
aggression traits concerning unreasonable self-defeating and risky behaviour in gambling.
However, the collected trait variables did not explain the aggressive behaviour in the TAP
noise version under normal or excluded conditions.
Nevertheless, it is important to keep in mind that the sample on which the correlations are
based is very small. Thus the results have to be considered with caution and undeniably
need further replication.
6.6. Conclusion and outlook
Taken together, the present results indicate that being ostracized by socially significant
peers threatens the needs to belong, to control, of meaningful existence, and of self-
esteem and leads to a decrease of positive affect and an increase of negative affect. This
aversive experience enhances physical aggression directly after the experience of social
exclusion. But if ostracized participants were additionally exposed to ongoing and
increasing physical provocation, this led to decreasing aggressive behaviour towards peers.
Thus, ostracism of socially important connections combined with further contact, even
physically aversive one as provocation, increases efforts to replenishing connectedness and
seek for more positive affect. The peers, the source of ostracism and provocation, were not
devaluated and aggressive attitude diminished towards the source and neutral persons.
Moreover, peer ostracism enhanced risk taking behaviour in males causing monetary harm

62
to the ostracizing peers, but decreased risk taking in females. The present results confirm
the importance of an anticipation of future interactions with regard to the effects of
ostracism and aggression (Twenge, 2005). They showed the desire of ostracized
individuals to form new relationships and the possibility to prevent aggressive behaviour by
social contacts. The importance of positive social connections should be considered more
carefully in early intervention programs. However, learned helplessness as a further reason
for the decrease in aggressive behaviour can not be ruled out. Moreover, as ostracism led
to an increase in aggression first, its capacity to elicit aggression should not be
underestimated.
Further research on this topic is definitely needed. The confounded variable provocation
and the uncontrolled effect of peers as source of ostracism and opponents of the TAP have
to be investigated under controlled conditions, as it is important to clarify if peers or
learned helplessness is responsible for the less antisocial behaviour. Moreover, the
differences of the two TAP versions require further investigation. It should be examined,
why participants actually experienced the money version as a gambling situation and as
less harmful and less aversive than the noise version. Additionally, the sex difference in
this case needs further clarification.
Nevertheless, the present study revealed interesting results and is fruitful in terms of
suggestions for future studies and research.

63
Reference List
Abraham, M. (2003). Can a boost to belonging buffer the immediate painful effects of ostrascism? More evidence for no moderation. Unpublished honors thesis. Macquarie University, Sydney, Australia.
Anderson, C. A., Lindsay, J. J., & Bushman, B. J. (1999). Research in the psychological laboratory: truth or triviality? Current Directions in Psychological Science, 8, 3–9.
Annual review of psychology (2002).
Bandura, A. (1997). Self-efficacy: The exercise of control. New York: Freemann.
Baron, R. A., & Richardson, D. R. (1994). Human aggression (2. ed.). Perspectives in social psychology. New York, NY: Plenum Press.
Baumeister, R. F. (1994). Self-esteem. San Diego: CA: Academic Press.
Baumeister, R. F., Brewer, L. E., Tice, D. M., & Leary, M. R. (2007a). Thwarting the Need to Belong: Understanding the Interpersonal and Inner Effects of Social Exclusion. Social and Personality Psychology Compass, 1(1), 506–520.
Baumeister, R. F., DeWall, C. N., Ciarocco, N. J., & Twenge, J. M. (2005). Social Exclusion Impairs Self-Regulation. Journal of Personality and Social Psychology, 88(4), 589–604.
Baumeister, R. F., & Leary, M. R. (1995). The need to belong: desire for interpersonal attachments as a fundamental human motivation. Psychological Bulletin, 117(3), 497–529.
Baumeister, R. F., & Tice, D. M. (1990). Anxiety and social exclusion. Journal of Social and Clinical Psychology, 9, 165–195.
Baumeister, R. F., Twenge, J. M., & Nuss, C. K. (2002). Effects of Social Exclusio on Cognitive Processes: Anticipated Aloneness Reduces Intelligent Thought. Journal of Personality and Social Psychology, 83(4), 817–827.
Baumeister, R. F. (Ed.) (1986). Public self and private self. Springer series in social psychology. New York: Springer.
Baumeister, R. F. (1990). Suicide as escape from the self. Psychological Review, 97, 90–113.
Baumeister, R. F., Vohs, K. D., DeWall, C. N., & Zhang, L. (2007). How emotion shapes behavior: Feedback, anticipation, and refelction, rather than direct causation. Personality and social Psychology Review, 11, 167–203.
Berkowitz, L. (1964). Aggressive cues in aggressive behavior and hostility catharsis. Psychological Review, 71, 104–122.
Bernstein, S., Richardson, D., & Hammock, G. (1987). Convergent and discriminant validity of the Taylor and Buss measures of physical aggression. Aggressive Behavior, 13, 15–24.
Bertsch, K., Böhnke, R., Kruk, M. R., & Naumann, E. (2009). Influence of aggression on information processing in the emotional Stroop task – an event-related potential study. Frontiers in Behavioral Neuroscience, 3(28). Retrieved November 22, 2009, from doi: 10.3389/neuro.08.028.2009.
Bierhoff, H. W. (2000). Skala der sozialen Verantwortung nach Berkowitz und Daniels: Entwicklung und Validierung. Diagnostica, 46(1), 18–28, from doi:10.1026//0012-1924.46.1.18.
Blaine, B., & Crocker, J. (1993). Self-esteem and self-serving biases in reactions to positive and negative events: A integrative review. (Self-esteem: The puzzle of low self-regard). New York: Plenum, pp. 55–85.

64
Bourgeois, K. S., & Leary, M. R. (2001). Coping with rejection: Derogating those who choose us last. Motivation and Emotion, 25, 101–111.
Buckley, K. E., Winkel, R. E., & Leary, M. R. (2004). Reactions to acceptance and rejection: Effects of level and sequence of relational evaluation. Journal of Experimental Social Psychology, 40(1), 14–28. Retrieved January 10, 2010, from doi:10.1016/S0022-1031(03)00064-7.
Bushmann, B. J. (1995). Moderating role of trait aggressiveness in the effects of violent media on aggression. Journal of Personality and Social Psychology, 69, 950–960.
Bushmann, B. J., & Baumeister, R. F. (1998). Threatened Egotism, Narcissism, Self-Esteem, and Direct and Displaced Aggression: Does Self-Love or Self-Hate Lead to Violence? Journal of Personality and Social Psychology, 75(1), 219–229. Retrieved November 21, 2009.
Buss, D. M. (1990). The evolution of anxiety and social exclusion. Journal of Social and Clinical Psychology, 9, 196–201.
Byrnes, J. P., Miller, D. C., & Schafer, W. D. (1999). Gender differences in risk taking: A meta-analysis. Psychological Bulletin, 125(3), 367–383.
Chermack, S. T., Berman, M., & Taylor, S. P. (1997). Effects of provocation on emotions and aggression in males. Aggressive Behavior, 23, 1–10.
Cohen, S., & Wills, T. A. (1985). Stress, social support, and the buffering hypothesis. Psychological Bulletin, 98, 310–357.
Crocker, J., Thompson, L., McGraw, K., & Ingerman, C. (1987). Downward comparison, prejudice, and evaluations of others: Effects of self-esteem and threat. Journal of Personality and Social Psychology, 52, 907–916.
Dalbert, C., Montada, L., & Schmitt, M. (1987). Glaube an eine gerechte Welt als Motiv: Validierungskorrelate zweier Skalen. Psychologische Beiträge, 29, 596–615.
DeWall, C. N., Baumeister, R. F., & Vohs, K. D. (2004). Recovering from rejection: Undoing the self-regulation deficits stemming from social exclusion.: Unpublished manuscript. Florida State Universit.
DeWall, C. N., Maner, J. K., & Rouby, D. A. (2009a). Social Exclusion and Early-Stage Interpersonal Perception: Selective Attention to Signs of Acceptance. Journal of Personality and Social Psychology, 96(4), 729–741.
DeWall, C. N., Twenge, J. M., Gitter, S. A., & Baumeister, R. F. (2009). It's the thought that counts: the role of hostile cognition in shaping aggressive responses to social exclusion. Journal of Personality and Social Psychology, 96, 45–59.
Faulkner, S. J., Williams, K. D., Sherman, B., & Williams, E. (1997). The “silent treatment”: Its incidence and impact. Presented at 69th Annu. Meet. Midwest. Psychol. Assoc.,. Chicago.
Gardner, W. L., Pickett, C. L., & Brewer, M. B. (2000). Social exclusion and selective memory: how the need to belong influences memory for social events. Personality and Social Psychology Bulletin, 26, 486–496.
Geller, D. M., Goodstein, L., Silver, M., & Sternberg W.C. (1974). On being ignored: the effects of violation of implicit rules of social interaction. Sociometry, 37, 541–556.
Giancola, P. R., & Chermack, S. T. (1998). Construct validity of laboratory aggression paradigms: a response to Tedeschi and Quigley. Aggression and Violent Behavior, 3, 237–253.
Giancola, P. R., & Zeichner, A. (1995). Construct validity of a competitive reaction-time aggression paradigm. Aggressive Behavior, 21, 199–204.

65
Gollwitzer, M. S. K. &. P. C. (2006). Relationalitäts-Kontextabhängigkeits-Skala (RKS): Entwicklung und erste Ansätze zur Validierung. Berichte aus der Arbeitsgruppe „Verantwortung, Gerechtigkeit, Moral“ Nr. 161, from Trier: Universität Trier, Fachbereich I − Psychologie.: .
Gonsalkorale, K., & Williams, K. D. (2006). The KKK won’t let me play: ostracism even by a despised outgroup hurts. European Journal of Social Psychology, 37(6), 1176–1186.
Greenberg, J., Pyszczynski, T., & Solomon, S. (1986). The causes and consequences of a need for self-esteem: a terror management theory. In R. F. Baumeister (Ed.), Public self and private self. (pp. 189–212).
Greenberg, J., Solomon, S., Pyszczynski, T., Rosenblatt, A., Burling, J., Lyon, D., et al. (1992). Why do people need self-esteem? Converging evidence that self-esteem serves an anxiety-buffering function. Journal of Personality and Social Psychology, 63(6), 913–922.
Gunnar, M. R., Sebanc, A. M., Tout, K., Donzella, B., & van Dulmen, M. M. H. (2003). Peer rejection, temperament, and cortisol activity in preschoolers. Developmental Psychobiology, 43(4), 346–368.
Hammock, G., & Richardson, D. R. (1992). Aggression as one response to conflict. Journal of Applied Social Psychology, 22, 298–311.
Hammock, G., & Richardson, D. R. (1992). Predictors of aggressive behavior. Aggressive Behavior, 18, 219–229.
Hampel, R. &. S. H. (1998). FAF - Fragebogen zur Erfassung von Aggressivitätsfaktoren. Handanweisung. Göttingen: Hogrefe.
Huynh, H., & Feldt, L. S. (1976). Estimation of the box correction for degrees of freedom from sample data in randomized block and split-plot designs. Journal of Educational and Behavioral Statistics, 1(1), 69–82, from DOI: 10.3102/107699860010010.
James, W. (1890). The principles of psychology. New York: Cosimo Classics.
Kiecolt-Glaser, J. K., Garner, W., Speicher, C., Penn, G. M., Holliday, J., & Glaser, R. (1984). Psychosocial modifiers of immunocompetence in medical students. Psychosomatic Medicine, 46(1), 7–14.
Kiecolt-Glaser, J. K., McGuire, L., Robles, T. F., & Glaser, R. (2002). Emotions, morbidity, and mortality: New perspectives from psychoneuroimmunology. In Annual review of psychology (pp. 83–107).
Kirkpatrick, L. A., Waugh, C. E., Valencia, A., & Webster, G. D. (2002). The Functional Domain Specificity of Self-Esteem and the Differential Prediction of Aggression. Journal of Personality and Social Psychology, 82(5), 756–767. Retrieved December 31, 2009.
Kowalski, R. M. (Ed.) (1997). Aversive interpersonal behaviors. The Plenum series in social/clinical psychology. New York, NY: Plenum Press.
Krohne, H. W., Egloff, B., Kohlmann, C.-W., & Tausch, A. (1996). Investigations with a German version of the Positive and Negative Affect Schedule (PANAS). Diagnostica, Vol 42(2), 139–156, from http://psycnet.apa.org/?fa=main.doiLanding&uid=1996-05083-003.
Laux, L. G. P. S. P. S. C. D. (1981). Das State-Trait-Angstinventar, STAI-T. Göttingen: Beltz Test GmbH.
Leary, M. R. (1990). Responses to social exclusion: Social anxiety, jealousy, loneliness, depression, and low self-esteem. Journal of Social and Clinical Psychology, 9, 221–229.
Leary, M. R. (2001). Toward a conecptualization of interpersonal rejection. In M. R. Leary (Ed.), Interpersonal rejection. (pp. 3–20). Oxford: Oxford Univ. Press.
66
Leary, M. R. (2005). Varieties of interpersonal rejection. In K. D. Williams, J. P. Forgas, & W. von Hippel (Eds.), The social outcast Ostracism, social exclusion, rejection, and bullying. [The Sydney Symposium of Social Psychology, Volume 7] (pp. 35–51). New York: Psychology Press.
Leary, M. R., Kowalski, R. M., Smith, L., & Phillips, S. (2003). Teasing, rejection, and violence: Case studies of the school shootings. Aggressive Behavior, 29, 202–214.
Leary, M. R., Terdal, S. K., & Downs, D. L. (1995). Self-Esteem as an Interpersonal Monitor: The Sociometer Hypothesis. Journal of Personality and Social Psychology, 68(3), 518–530.
Leary, M. R., Twenge, J. M., & Quinlivan, E. (2006). Interpersonal Rejection as a Deterimant of Anger and Aggression. Personality and social Psychology Review, 10(2), 111–132.
Leary, M. R. (Ed.) (2001). Interpersonal rejection. Oxford: Oxford Univ. Press.
Lieberman, J. D., Solomon, S., & McGregor, H. A. (1999). A Hot New Way to Measure Aggression: Hot Sauce Allocation. Aggressive Behavior, 25, 331–348. Retrieved December 31, 2009.
Makepeace, J. (1989). Dating, living together, and courtship violence. In M. A. Pirog-Good (Ed.), Violence in dating relationships. Emerging social issues. (pp. 94–107). New York: Praeger.
Maner, J. K., DeWall, C. N., Baumeister, R. F., & Schaller, M. (2007). Does Social Exclusion Motivate Interpersonal Reconnection? Resolving the “Porcupine Problem”. Journal of Personality and Social Psychology, 92(1), 42–55. Retrieved February 04, 2010.
Maslow, A. H. (1943). A Theory of Human Motivation. Psychological Review, 50, 370–396.
Matsumoto, D., & Ekman, P. (1988). Japanese and Caucasian Facial Expressions of Emotion and Neutral Faces (JACFEE and JACNeuF) Human Interaction, from Laboratory University of California San Francisco 401 Parnassus Avenue San Francisco CA 94143: .
McAdams, D. P., & Bryant, F. B. (1987). Intimacy motivation and subjective mental health in a nationwide sample. Journal of Personality, 55, 395–413.
Necomb, A. F., Bukowski, W. M., & Pattee, L. (1993). Children's peer realtions: A meta-analytic review of popular, rejected, neglected, controversial, and average sociometric status. Psychological Bulletin, 113, 99–128.
Nezlek, J. B., Kowalski, R. M., Leary, M. R., Blevins, T., & Holgate, S. (1997). Personality moderators of reactions to interpersonal rejection: depression and trait self-esteem. Personality and Social Psychology Bulletin, 23, 1235–1244. Retrieved January 05, 2010.
Peterson, C., Maier, S. F., & Seligman, M. E. P. (1993). Learned helplessness: a theory for the age of personal control. (Vol. 1993). New York: Oxford Univ. Press.
Pickett, C. L., Gardner, W. L., & Knowles, M. (2004). Getting a cue: the need to belong and enhanced sensitivity to social cues. Personality and Social Psychology Bulletin, 30, 1095–1107.
Pirog-Good, M. A. (Ed.) (1989). Violence in dating relationships: Emerging social issues. New York: Praeger.
Rapoport, A., Chammah, A. M., & Orwant, C. J. (1965). Prisoner's dilemma: A study in conflict and cooperation (2. print.). Ann Arbor paperbacks: Vol. 165. Ann Arbor, Mich.: Univ. of Michigan Press.
Rothbaum, F., Weiz, J. R., & Snyder, S. (1982). Changing the world and changing the self: A two-process model of perceived control. Journal of Personality and Social Psychology, 42(1), 5–37.
Sampson, R. J., & Laub, J. H. (1990). Crime and deviance over the life course: The salience of adult social bonds. American Sociological Review, 55, 609–627.

67
Sampson, R. J., & Laub, J. H. (1993). Crime in the making: Pathways and turning oints through life. Cambridge: MA: Havard University Press.
Schmitt, M. G. M. M. J. &. A. D. (2005). Justice Sensitivity: Assessment and Location in the Personality Space. European Journal of Psychological Assessment, 21(3), 202–211. Retrieved November 08, 2009, from http://ub-han.uni-trier.de/han/EZB/graphics.tx.ovid.com/ovftpdfs/FPDDNCDCDGLMNA00/fs047/ovft/live/gv024/00012303/00012303-200521030-00008.pdf.
Schmitt, M. M. J. &. S. A. (1995). Gerechtigkeit als innerdeutsches Problem: Einstellungen zu Verteilungsprinzipien, Ungerechtigkeitssensibilität und Glaube an eine gerechte Welt als Kovariate. Berichte aus der Arbeitsgruppe "Verantwortung, Gerechtigkeit, Moral" Nr. 82, from Universität Trier, Fachbereich I - Psychologie: .
Schmitt, M. M. J. &. S. A. (1997). Gerechtigkeit als innerdeutsches Problem: Analyse der Messeigenschaften von Messinstrumenten für Einstellungen zu Verteilungsprinzipien, Ungerechtigkeitssensibilität und Glaube an eine gerechte Welt. Berichte aus der Arbeitsgruppe "Verantwortung, Gerechtigkeit, Moral" Nr. 105, from Universität Trier, Fachbereich I - Psychologie: .
Schulz, P., Jansen Lars J., & Schlotz Wolff (2005). Stressreaktivität: Theoretisches Konzept und Messung. Diagnostica, 51(3), 124–133. Retrieved November 08, 2009.
Schuster, B. (2001). Rejection and victimization by peers: Social perception and social behavior mechanisms. New York: Guilford Press, pp. 290-209, from Peer harassement in school: The plight of the vulnerable and victimized: .
Schwenkmezger, P. H. V. &. S. C. D. (1992). State-Trait Anger Expression Inventory (STAXI). Bern: Huber.
Smith, A., & Williams, K. D. (2004). R U there? Effects of ostracism by cell phone messages. Group Dynamics: Theory, Research, and Practice, 8, 291–301.
Snapp, C. M., & Leary, M. R. (2001). Hurt feelings among new acquaintances: Moderating effects of interpersonal familiarity. Journal of Social and Personal Relationships, 18(3), 315–326. Retrieved January 12, 2010.
Solomon, Z., Waysmann, M., & Mikulincer, M. (1990). Family functioning, percieved social support, and combat-related psychopathology: The moderating role of loneliness. Journal of Social and Clinical Psychology, 9, 56–472.
Sommer, K.L., Williams, K. D., Ciarocco, N. J., & Baumeister, R. F. (2001). When silence speaks louder than words: explorations into interpersonal and intrapsychic consequences of social ostracsim. Basic and Applied Social Psychology, 83, 606–615.
Steele, C. M. (1988). The psychology of self-affirmation: Sustaining the integrity of the self. San Diego: Academic Press.
Stroud, L. R., Salovey, P., & Epel, E. S. (2002). Sex differences in stress responses: social rejection versus achievement stress. Biological Psychiatry, 52(4), 318–327.
Stuckless, N. &. G. R. (1992). The vengeance scale: Development of a measure of attitudes toward revenge. Journal of Social Behavior and Personality, 7, 25–42. Retrieved November 08, 2009, from http://pao.chadwyck.co.uk/PDF/1257703806351.pdf.
Taylor, S., & Chermack, S. T. (1993). Alcohol, drugs, and human physical aggression. Journal of Studies on Alcohol, Suppl. 11, 78–88.

68
Taylor, S. P. (1967). Aggressive behavior and physiological arousal as a function of provocation and the tendency to inhibit aggression. Journal of Personality, 35(2), 297–310. Retrieved November 22, 2009, from doi:10.1111/j.1467-6494.1967.tb01430.x.
Tice, D. M., Bratslavsky, E., & Baumeister, R. F. (2001). Emotional Distress Regulation Takes Precedence Over Impulse Control: If You Feel Bad, Do It! Journal of Personality and Social Psychology, 80(1), 53–67. Retrieved January 12, 2010.
Twenge, J. M. (2005). When does social rejection lead to aggression?: The influence of situations, narcissism, emotion, and replenshing connections. In K. D. Williams, J. P. Forgas, & W. von Hippel (Eds.), The social outcast Ostracism, social exclusion, rejection, and bullying. [The Sydney Symposium of Social Psychology, Volume 7] (pp. 201–212). New York: Psychology Press.
Twenge, J. M., Baumeister, R. F., DeWall, C. N., Ciarocco, N. J., & Bartels, J. M. (2007a). Social Exclusion Decreases Prosocial Behavior. Journal of Personality and Social Psychology, 92(1), 56–66.
Twenge, J. M., Baumeister, R. F., Tice, D. M., & Stucke, T. S. (2001). If You Can't Join them, Beat Them: Effects of Social Exclusion on Aggressive Behavior. Journal of Personality and Social Psychology, 81(6), 1058–1069. Retrieved November 22, 2009, from DOI: 10.1037//M)22-3514.8I .6.1058.
Twenge, J. M., Catanese, K. R., & Baumeister, R. F. (2002). Social Exclusion causes Self Defeating Behavior. Journal of Personality and Social Psychology, 83(3), 606–615.
Twenge, J. M., Catanese, K. R., & Baumeister, R. F. (2003). Social Exclusion and the Deconstructed State: Time Perception, Meaninglessness, Lethargy, Lack of Emotion, and Self-Awareness. Journal of Personality and Social Psychology, 85(3), 409–423, from DOI: 10.1037/0022-3514.85.3.409.
Twenge, J. M., Koole, S. L., DeWall, C. N., Marquez, A., & Baumeister, R. F. (2006). Emotion regulation after social exclusion: Automatic tuning toward positive information.
Twenge, J. M., Zhang, L., Catanese, K. R., Dolan-Pascoe, B., Lyche, L. F., & Baumeister, R. F. (2007). Replenishing connectedness: Reminders of social activity reduce aggression after social exclusion. British Journal of Social Psychology, 46, 205–224. Retrieved November 22, 2009.
van Beest, I., & Williams, K. D. (2006). Cyberbomb: Is it painful to be ostracized from Russian roulette? Work. Pap., Dep. Psychol., Leiden Univ.
van Beest, I., & Williams, K. D. (2006). When inclusion costs and ostracism pays, ostracism still hurts. Journal of Personality and Social Psychology, 91(5), 918–928.
van Honk, J., Tuiten, A., Haan, E. de, van den Hout, M., & Stam, H. (2001). Attentional bias for angry faces: relationships to trait anger and anxiety. Cognition and Emotion, 15, 279–297.
van Honk, J., Tuiten, A., van den Hout, M., Putman, P., Haan, E. de, & Stam, H. (2001). Selective attention to unmasked and masked threatening words: relationships to trait anger and anxiety. Personality and Individual Differences, 30, 711–720.
Warburton, W. A., Williams, K. D., & Cairns, D. R. (2006). When ostracism leads to aggression: The moderating effects of control deprivation. Journal of Experimental Social Psychology, 42, 213–220. Retrieved December 20, 2009.
Watson, D., Clark, L. A., & Tellegen, A. (1988). Development and validation of brief measures of positive and negative affect: The PANAS scale. Journal of Personality and Social Psychology, 54, 1063–1070.
Williams, K. D., Cheung, C. K. T., & Choi, W. (2000). Cyberostracism: Effects of Being Ignored Over the Internet. Journal of Personality and Social Psychology, 79(5), 748–762. Retrieved January 05, 2010.

69
Williams, K. D., & Fitness, J. (2004). Social and physical pain: similarities and differences. Presented at Soc.Exp.Social.Psychology, Ft.Worth, TX.
Williams, K. D., Forgas, J. P., Hippel, W. von, & Zadro, L. (2005). The Social Outcast: An Overview. In K. D. Williams, J. P. Forgas, & W. von Hippel (Eds.), The social outcast Ostracism, social exclusion, rejection, and bullying. [The Sydney Symposium of Social Psychology, Volume 7]. New York: Psychology Press.
Williams, K. D., Govan, C. L., Croker, V., Tynan, D., Cruickshank, M., & Lam, A. (2002). Investigations into differences between social- and Cyberostracism. Group Dynamics: Theory, Research, and Practice, 6, 65–77.
Williams, K. D., & Zardo, L. (2005). Ostracism: The Indiscriminate Early Detection System. In K. D. Williams, J. P. Forgas, & W. von Hippel (Eds.), The social outcast Ostracism, social exclusion, rejection, and bullying. [The Sydney Symposium of Social Psychology, Volume 7] (pp. 19–34). New York: Psychology Press.
Williams, K. D. (1997). Social Ostracism. In R. M. Kowalski (Ed.), Aversive Interpersonal Behaviour (pp. 133–170).
Williams, K. D. (2001). Ostracism: The power of silence. Emotions and social behavior. New York, London: Guilford.
Williams, K. D. (2007). Ostracism. Annual Review of Psychology, 58, 425–452. Retrieved December 23, 2009.
Williams, K. D., Forgas, J. P., & Hippel, W. von (Eds.) (2005). The social outcast Ostracism, social exclusion, rejection, and bullying. [The Sydney Symposium of Social Psychology, Volume 7]. New York: Psychology Press.
Williams, K. D., & Jarvis, B. (2006). Cyberball: A program for use in research on interpersonal ostracism and acceptance. Behavior Research Methods, 38(1), 174–180. Retrieved November 08, 2009.
Williams, K. D., & Sommer, K. L. (1997). Social Ostracism by Coworkers: Does Rejection Lead to Loafing or Compensation? Personality and Social Psychology Bulletin, 23, 693–706. Retrieved December 20, 2009.
Zadro, L., & Williams, K. D. (2006). How long does it last? The persistence of the effects of ostracism in the socially anxious. Journal of Experimental Social Psychology, 42, 692–697.
Zadro, L., Williams, K. D., & Richardson R. (2004). How low can you go? Ostracism by a computer lowers mood, belonging, control, self-esteem, and meaningful existence. Journal of Experimental Social Psychology, 40, 560–567.
Zwolinski, & Jennifer (2008). Biopsychosocial responses to social rejection in targets of relational aggression. Biological Psychology, 79, 260–267. Retrieved February 13, 2010, from doi:10.1016/j.biopsycho.2008.06.006.

I
Appendix:
Table 1: Correlation of Inclusionary Status with Trait Variables of Anger, Aggression and Stress
Z- faf 1 spontaneous
Aggressio
Z-faf_2 reactive Aggression
Z-faf_2 reactive Aggression
Z-faf_3 agitation
Z-faf_4 Self- aggression
Z-faf_5 Aggression- inhibition
-faf_ Summe Aggr1_2_3
Correlation after Pearson ,011 ,018 ,027 ,147 ,032 ,274* ,023
Significance (2-sided) ,933 ,886 ,829 ,241 ,798 ,027 ,854
Inclusionary status
N 65 65 65 65 65 65 65
Anger in general
staxi1_ Anger In
Staxi2_ Anger out
staxi3_ Anger Contro
staxi_ mean
Correlation after Pearson -,150 -,044 -,096 -,015 -,096
Significance (2-sided) ,240 ,728 ,449 ,904 ,446
Inclusionary status
N 63 65 65 65 65
Note: yellow: p < .050; blue: p< .100
Mean responsibility
Mean revenge
Correlation after Pearson -,144 -,092
Significance (2-sided) ,252 ,465
Inclusionary status
N 65 65
reactivity to stress caused by/ in
overwork Social conflicts
Social evaluation
Failure at work
Pre-Stress-Phase
Post-Stress-Phase
Correlation after Pearson
,083 -,027 -,037 -,097 -,041 ,034
Significance (2-sided)
,511 ,829 ,772 ,440 ,746 ,788
Inclusionary status
N 65 65 65 65 65 65

II
Table 2: Correlation between Aggressive Behaviour in the TAP and Dispositional Aggression Traits (Measured with "FAF"); Ostracized Participants
Ostracized Z- TAP noise Block 1
Z- TAP noise Block 2
Z- TAP noise Block 3
Z- TAP money Block 1
Z- TAP money Block 2
Z- TAP money Block 3
Z_both versions block 1
Z_both versions block 2
Z both versions block 3
Z-TAP_ money block 1 trial 1
Z-TAP_ noise block 1 trial 1
Z-TAP_ both versions block 1 trial 1l
Correlation after Pearson -,115 -,095 ,004 -,378 -,264 -,017 -,210 -,189 -,031 ,043 -,002 ,021
Significance (2-sided) ,660 ,717 ,988 ,149 ,322 ,949 ,240 ,292 ,863 ,874 ,993 ,909
Z-faf_1 spontaneous Aggression
N 17 17 17 16 16 16 33 33 33 16 17 33 Correlation after Pearson
,016 -,100 ,032 -,342 -,430 -,280 -,092 -,248 -,156 -,120 ,094 -,015
Significance (2-sided) ,951 ,703 ,903 ,195 ,096 ,294 ,610 ,164 ,385 ,659 ,721 ,935
Z-faf_2 reactive Aggression
N 17 17 17 16 16 16 33 33 33 16 17 33 Correlation after Pearson -,003 -,009 ,083 -,304 -,440 -,280 -,121 -,210 -,129 ,033 ,006 ,019
Significance (2-sided) ,989 ,972 ,751 ,252 ,088 ,294 ,504 ,241 ,473 ,904 ,982 ,917
Z-faf_3 agitation
N 17 17 17 16 16 16 33 33 33 16 17 33 Correlation after Pearson ,109 -,063 -,091 -,174 ,163 ,223 ,012 ,028 ,052 -,012 ,006 -,015
Significance (2-sided) ,678 ,809 ,727 ,518 ,545 ,406 ,948 ,879 ,773 ,965 ,983 ,935
Z-faf_4 Self- aggression
N 17 17 17 16 16 16 33 33 33 16 17 33 Correlation after Pearson -,453 -,320 -,387 ,047 -,391 -,204 -,177 -,356* -,304 -,101 -,315 -,194
Significance (2-sided) ,068 ,211 ,125 ,862 ,135 ,449 ,325 ,042 ,086 ,710 ,219 ,279
Z-faf_5 Aggression- inhibition
N 17 17 17 16 16 16 33 33 33 16 17 33 Correlation after Pearson -,037 -,076 ,047 -,390 -,415 -,196 -,166 -,244 -,115 -,003 ,037 ,011
Significance (2-sided) ,886 ,772 ,859 ,135 ,110 ,468 ,356 ,172 ,523 ,991 ,889 ,952
Z-faf_ Summe Aggr1_2_3
N 17 17 17 16 16 16 33 33 33 16 17 33
Note: yellow: p < .050; blue: p< .100

III
Table 3: Correlation between Aggressive Behaviour in the TAP and Dispositional Aggression Traits (Measured with "FAF"); Included Participants
Included Z- TAP noise Block 1
Z- TAP noise Block 2
Z- TAP noise Block 3
Z- TAP money Block 1
Z- TAP money Block 2
Z- TAP money Block 3
Z_both versions block 1
Z_both versions block 2
Z both versions block 3
Z-TAP_ money block 1 trial 1
Z-TAP_ noise block 1 trial 1
Z-TAP_ both versions block 1 trial 1l
Correlation after Pearson
-,118 -,214 ,151 ,019 -,099 -,166 -,035 -,142 ,028 ,032 -,091 -,030
Significance (2-sided) ,663 ,425 ,576 ,945 ,716 ,540 ,848 ,437 ,879 ,908 ,738 ,871
Z-faf_1 spontaneous Aggression
N 16 16 16 16 16 16 32 32 32 16 16 32
Correlation after Pearson
,053 ,144 ,231 ,112 ,114 ,008 ,047 ,117 ,111 -,131 ,016 -,049
Significance (2-sided) ,845 ,596 ,390 ,680 ,673 ,977 ,798 ,524 ,545 ,629 ,952 ,792
Z-faf_2 reactive Aggression
N 16 16 16 16 16 16 32 32 32 16 16 32
Correlation after Pearson
,523* ,281 ,015 ,021 ,168 ,001 ,365* ,224 ,012 -,246 ,517* ,270
Significance (2-sided) ,038 ,292 ,957 ,939 ,534 ,997 ,040 ,219 ,946 ,359 ,040 ,135
Z-faf_3 agitation
N 16 16 16 16 16 16 32 32 32 16 16 32
Correlation after Pearson
,561* ,456 ,574* ,235 ,159 ,260 ,423* ,300 ,431* ,216 ,326 ,279
Significance (2-sided) ,024 ,076 ,020 ,381 ,557 ,330 ,016 ,096 ,014 ,421 ,218 ,123
Z-faf_4 Self- aggression
N 16 16 16 16 16 16 32 32 32 16 16 32
Correlation after Pearson
,251 ,406 ,363 -,568* -,512* -,595* -,134 -,111 -,125 -,439 ,099 -,147
Significance (2-sided) ,349 ,119 ,167 ,022 ,043 ,015 ,464 ,544 ,495 ,089 ,716 ,421
Z-faf_5 Aggression- inhibition
N 16 16 16 16 16 16 32 32 32 16 16 32
Correlation after Pearson
,296 ,131 ,171 ,061 ,069 -,082 ,207 ,100 ,065 -,146 ,291 ,119
Significance (2-sided) ,265 ,628 ,526 ,823 ,799 ,763 ,255 ,586 ,724 ,590 ,274 ,517
Z-faf_ Summe Aggr1_2_3
N 16 16 16 16 16 16 32 32 32 16 16 32
Note: yellow: p < .050; blue: p< .100
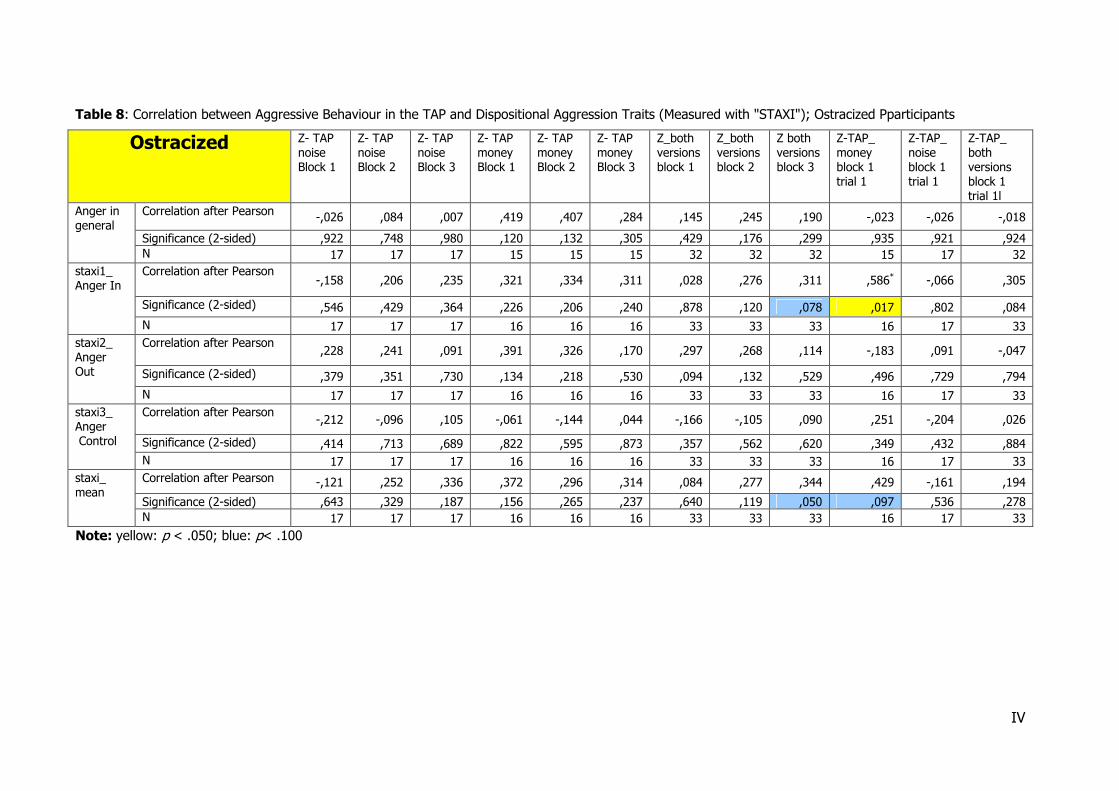
IV
Table 8: Correlation between Aggressive Behaviour in the TAP and Dispositional Aggression Traits (Measured with "STAXI"); Ostracized Pparticipants
Ostracized Z- TAP noise Block 1
Z- TAP noise Block 2
Z- TAP noise Block 3
Z- TAP money Block 1
Z- TAP money Block 2
Z- TAP money Block 3
Z_both versions block 1
Z_both versions block 2
Z both versions block 3
Z-TAP_ money block 1 trial 1
Z-TAP_ noise block 1 trial 1
Z-TAP_ both versions block 1 trial 1l
Correlation after Pearson -,026 ,084 ,007 ,419 ,407 ,284 ,145 ,245 ,190 -,023 -,026 -,018
Significance (2-sided) ,922 ,748 ,980 ,120 ,132 ,305 ,429 ,176 ,299 ,935 ,921 ,924
Anger in general
N 17 17 17 15 15 15 32 32 32 15 17 32 Correlation after Pearson
-,158 ,206 ,235 ,321 ,334 ,311 ,028 ,276 ,311 ,586* -,066 ,305
Significance (2-sided) ,546 ,429 ,364 ,226 ,206 ,240 ,878 ,120 ,078 ,017 ,802 ,084
staxi1_ Anger In
N 17 17 17 16 16 16 33 33 33 16 17 33 Correlation after Pearson
,228 ,241 ,091 ,391 ,326 ,170 ,297 ,268 ,114 -,183 ,091 -,047
Significance (2-sided) ,379 ,351 ,730 ,134 ,218 ,530 ,094 ,132 ,529 ,496 ,729 ,794
staxi2_ Anger Out
N 17 17 17 16 16 16 33 33 33 16 17 33 Correlation after Pearson
-,212 -,096 ,105 -,061 -,144 ,044 -,166 -,105 ,090 ,251 -,204 ,026
Significance (2-sided) ,414 ,713 ,689 ,822 ,595 ,873 ,357 ,562 ,620 ,349 ,432 ,884
staxi3_ Anger Control
N 17 17 17 16 16 16 33 33 33 16 17 33 Correlation after Pearson -,121 ,252 ,336 ,372 ,296 ,314 ,084 ,277 ,344 ,429 -,161 ,194
Significance (2-sided) ,643 ,329 ,187 ,156 ,265 ,237 ,640 ,119 ,050 ,097 ,536 ,278
staxi_ mean
N 17 17 17 16 16 16 33 33 33 16 17 33
Note: yellow: p < .050; blue: p< .100
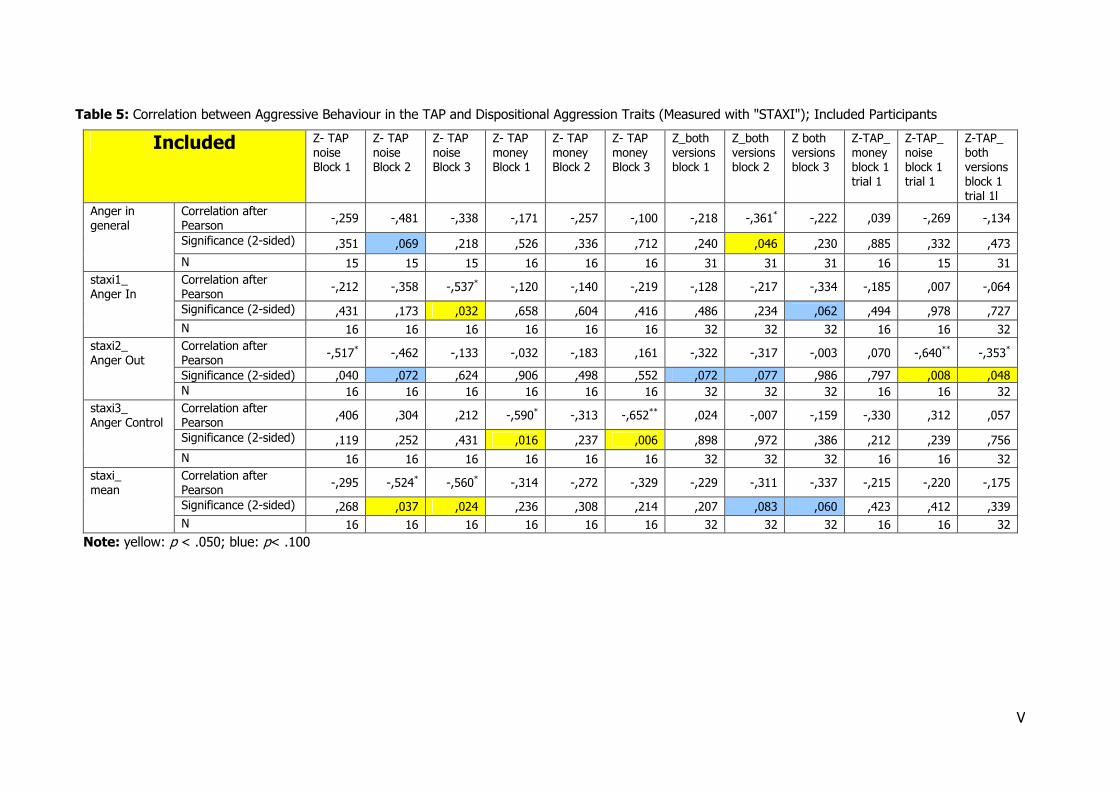
V
Table 5: Correlation between Aggressive Behaviour in the TAP and Dispositional Aggression Traits (Measured with "STAXI"); Included Participants
Included Z- TAP noise Block 1
Z- TAP noise Block 2
Z- TAP noise Block 3
Z- TAP money Block 1
Z- TAP money Block 2
Z- TAP money Block 3
Z_both versions block 1
Z_both versions block 2
Z both versions block 3
Z-TAP_ money block 1 trial 1
Z-TAP_ noise block 1 trial 1
Z-TAP_ both versions block 1 trial 1l
Correlation after Pearson
-,259 -,481 -,338 -,171 -,257 -,100 -,218 -,361* -,222 ,039 -,269 -,134
Significance (2-sided) ,351 ,069 ,218 ,526 ,336 ,712 ,240 ,046 ,230 ,885 ,332 ,473
Anger in general
N 15 15 15 16 16 16 31 31 31 16 15 31 Correlation after Pearson
-,212 -,358 -,537* -,120 -,140 -,219 -,128 -,217 -,334 -,185 ,007 -,064
Significance (2-sided) ,431 ,173 ,032 ,658 ,604 ,416 ,486 ,234 ,062 ,494 ,978 ,727
staxi1_ Anger In
N 16 16 16 16 16 16 32 32 32 16 16 32 Correlation after Pearson
-,517* -,462 -,133 -,032 -,183 ,161 -,322 -,317 -,003 ,070 -,640** -,353*
Significance (2-sided) ,040 ,072 ,624 ,906 ,498 ,552 ,072 ,077 ,986 ,797 ,008 ,048
staxi2_ Anger Out
N 16 16 16 16 16 16 32 32 32 16 16 32 Correlation after Pearson
,406 ,304 ,212 -,590* -,313 -,652** ,024 -,007 -,159 -,330 ,312 ,057
Significance (2-sided) ,119 ,252 ,431 ,016 ,237 ,006 ,898 ,972 ,386 ,212 ,239 ,756
staxi3_ Anger Control
N 16 16 16 16 16 16 32 32 32 16 16 32 Correlation after Pearson
-,295 -,524* -,560* -,314 -,272 -,329 -,229 -,311 -,337 -,215 -,220 -,175
Significance (2-sided) ,268 ,037 ,024 ,236 ,308 ,214 ,207 ,083 ,060 ,423 ,412 ,339
staxi_ mean
N 16 16 16 16 16 16 32 32 32 16 16 32
Note: yellow: p < .050; blue: p< .100

VI
Table 6: Correlation between Aggressive Behaviour in the TAP and Dispositional Factors (Responsibility and Revenge); Ostracized and Included Participants
Ostracized Z- TAP noise Block 1
Z- TAP noise Block 2
Z- TAP noise Block 3
Z- TAP money Block 1
Z- TAP money Block 2
Z- TAP money Block 3
Z_both versions block 1
Z_both versions block 2
Z both versions block 3
Z-TAP_ money block 1 trial 1
Z-TAP_ noise block 1 trial 1
Z-TAP_ both versions block 1 trial 1l
Correlation after Pearson
-,729** -,300 -,260 ,054 ,149 -,078 -,304 -,001 -,055 ,102 -,749** -,167
Significance (2-sided) ,001 ,243 ,313 ,841 ,581 ,773 ,085 ,996 ,761 ,706 ,001 ,352
Mean responsibility
N 17 17 17 16 16 16 33 33 33 16 17 33
Correlation after Pearson
,355 ,427 ,360 ,123 ,200 ,155 ,202 ,319 ,264 ,110 ,340 ,211
Significance (2-sided) ,162 ,087 ,156 ,649 ,457 ,568 ,261 ,070 ,137 ,684 ,182 ,238
mean Revenge
N 17 17 17 16 16 16 33 33 33 16 17 33
Included Z- TAP noise Block 1
Z- TAP noise Block 2
Z- TAP noise Block 3
Z- TAP money Block 1
Z- TAP money Block 2
Z- TAP money Block 3
Z_both versions block 1
Z_both versions block 2
Z both versions block 3
Z-TAP_ money block 1 trial 1
Z-TAP_ noise block 1 trial 1
Z-TAP_ both versions block 1 trial 1l
Correlation after Pearson
-,140 -,299 -,051 ,015 -,002 ,040 -,072 -,142 -,006 -,137 -,074 -,097
Significance (2-sided) ,604 ,261 ,852 ,957 ,994 ,883 ,697 ,437 ,976 ,613 ,787 ,597
Mean responsibility
N 16 16 16 16 16 16 32 32 32 16 16 32
Correlation after Pearson
-,081 -,350 -,487 -,080 -,110 -,216 -,087 -,216 -,355* -,190 -,107 -,145
Significance (2-sided) ,765 ,184 ,056 ,768 ,685 ,422 ,635 ,235 ,046 ,480 ,692 ,428
mean Revenge
N 16 16 16 16 16 16 32 32 32 16 16 32
Note: yellow: p < .050; blue: p< .100

VII
Table 7: Correlation between Aggressive Behaviour in the TAP and Dispositional Stress Traits (Measured with "SRS"); Ostracized participants
reactivity to stress caused by/ in
Ostracized Z- TAP noise Block 1
Z- TAP noise Block 2
Z- TAP noise Block 3
Z- TAP money Block 1
Z- TAP money Block 2
Z- TAP money Block 3
Z_both versions block 1
Z_both versions block 2
Z both versions block 3
Z-TAP_ money block 1 trial 1
Z-TAP_ noise block 1 trial 1
Z-TAP_ both versions block 1 trial 1l
Correlation after Pearson
-,273 -,133 -,183 ,441 ,013 -,178 ,131 -,054 -,199 ,435 -,253 ,190
Significance (2-sided) ,289 ,610 ,481 ,087 ,961 ,510 ,468 ,765 ,267 ,092 ,327 ,289
Overwork
N 17 17 17 16 16 16 33 33 33 16 17 33 Correlation after Pearson -,083 -,042 -,001 ,000 ,102 -,035 -,040 ,027 -,027 ,117 ,101 ,109
Significance (2-sided) ,751 ,873 ,996 1,000 ,708 ,896 ,826 ,880 ,883 ,666 ,699 ,545
Social conflicts
N 17 17 17 16 16 16 33 33 33 16 17 33 Correlation after Pearson -,410 -,316 -,253 ,241 ,382 ,274 -,107 ,024 ,056 ,319 -,343 ,026
Significance (2-sided) ,102 ,216 ,327 ,368 ,144 ,305 ,554 ,894 ,756 ,228 ,178 ,888
Social evaluation
N 17 17 17 16 16 16 33 33 33 16 17 33 Correlation after Pearson -,275 -,318 -,422 -,048 ,045 ,146 -,158 -,151 -,103 ,292 -,149 ,085
Significance (2-sided) ,286 ,214 ,091 ,861 ,868 ,590 ,379 ,402 ,570 ,273 ,567 ,637
Failure at work
N 17 17 17 16 16 16 33 33 33 16 17 33 Correlation after Pearson ,171 ,225 ,245 ,463 ,644**** ,446 ,297 ,401** ,330 ,389 ,156 ,271
Significance (2-sided) ,511 ,385 ,344 ,071 ,007 ,084 ,093 ,021 ,061 ,136 ,550 ,126
Pre-Stress-Phase
N 17 17 17 16 16 16 33 33 33 16 17 33 Correlation after Pearson ,056 ,116 -,009 -,849**** -,580** -,589** -,304 -,198 -,330 -,520** -,110 -,321
Significance (2-sided) ,831 ,658 ,973 ,000 ,019 ,016 ,085 ,271 ,061 ,039 ,674 ,069
Post-Stress-Phase
N 17 17 17 16 16 16 33 33 33 16 17 33
Note: yellow: p < .050; blue: p< .100

VIII
Table 8: Correlation between Aggressive Behaviour in the TAP and Dispositional Stress Traits (Measured with "SRS");Iincluded participants
reactivity to stress caused by/ in
Included Z- TAP noise Block 1
Z- TAP noise Block 2
Z- TAP noise Block 3
Z- TAP money Block 1
Z- TAP money Block 2
Z- TAP money Block 3
Z_both versions block 1
Z_both versions block 2
Z both versions block 3
Z-TAP_ money block 1 trial 1
Z-TAP_ noise block 1 trial 1
Z-TAP_ both versions block 1 trial 1l
Correlation after Pearson
,066 -,126 -,248 ,261 ,069 ,156 ,105 -,022 -,068 -,125 ,257 ,057
Significance (2-sided) ,809 ,641 ,354 ,329 ,801 ,565 ,566 ,906 ,713 ,645 ,337 ,756
overwork
N 16 16 16 16 16 16 32 32 32 16 16 32 Correlation after Pearson ,267 ,062 -,187 ,173 ,212 ,284 ,216 ,128 -,001 ,125 ,384 ,279
Significance (2-sided) ,318 ,820 ,487 ,522 ,430 ,287 ,234 ,484 ,994 ,644 ,143 ,123
Social conflicts
N 16 16 16 16 16 16 32 32 32 16 16 32 Correlation after Pearson ,389 -,058 -,092 -,036 ,136 ,098 ,144 ,036 -,031 ,127 ,501* ,289
Significance (2-sided) ,136 ,831 ,735 ,894 ,617 ,718 ,433 ,847 ,865 ,641 ,048* ,109
Social evaluation
N 16 16 16 16 16 16 32 32 32 16 16 32 Correlation after Pearson ,321 ,279 ,053 -,007 -,181 -,003 ,124 -,001 ,000 -,105 ,285 ,079
Significance (2-sided) ,225 ,296 ,846 ,980 ,501 ,992 ,498 ,995 1,000 ,698 ,284 ,668
Failure at work
N 16 16 16 16 16 16 32 32 32 16 16 32 Correlation after Pearson -,011 ,059 ,159 ,277 ,226 ,286 ,113 ,152 ,218 ,190 -,004 ,082
Significance (2-sided) ,969 ,827 ,557 ,298 ,401 ,283 ,537 ,406 ,230 ,481 ,987 ,655
Pre-Stress-Phase
N 16 16 16 16 16 16 32 32 32 16 16 32 Correlation after Pearson -,051 -,216 -,289 -,037 -,070 -,109 -,003 -,099 -,130 -,190 ,083 -,053
Significance (2-sided) ,851 ,421 ,277 ,890 ,796 ,687 ,987 ,589 ,478 ,481 ,759 ,772
Post-Stress-Phase
N 16 16 16 16 16 16 32 32 32 16 16 32
Note: yellow: p < .050; blue: p< .100

Erklärung zur Diplomarbeit
Hiermit erkläre ich, dass ich die Diplomarbeit selbständig verfasst und keine anderen als
die angegebenen Quellen und Hilfsmittel benutzt und die aus fremden Quellen direkt oder
indirekt übernommenen Gedanken als solche kenntlich gemacht habe. Die Diplomarbeit
habe ich bisher keinem anderen Prüfungsamt in gleicher oder vergleichbarer Form
vorgelegt. Sie wurde bisher auch nicht veröffentlicht.
Pluwig, den _____________ _____________________________________
(Angelika Dierolf)