osas rat with neuroinammation exploration of learning and
TRANSCRIPT
Page 1/26
Exploration of Learning and Memorizing Ability ofOSAS rat with Neuroin�ammationMin Luo
The second a�liated hospital of KunMing medical universityYuQing Li
Yan'an hospital a�liated hospital to KunMing medical universityChunHua Bao
Yunnan Normal UniversityXin Ai
The second a�liated hospital of KunMing medical universityYuRong Zheng
The second a�liated hospital of KunMing medical universityRenShuai Liu
The second a�liated hospital of KunMing medical universityYaFeng Lu
The second a�liated hospital of KunMing medical universityYue Wu
The second a�liated hospital of KunMing medical universityMei Yin ( [email protected] )
The second a�liated hospital of KunMing Medical university https://orcid.org/0000-0003-1625-1376
Research
Keywords: OSAS, Morris water maze, Microglial, Astrocyte, In�ammation
Posted Date: February 18th, 2021
DOI: https://doi.org/10.21203/rs.3.rs-206808/v1
License: This work is licensed under a Creative Commons Attribution 4.0 International License. Read Full License
Page 2/26
Abstract
BackgroundObstructive sleep apnea syndrome (OSAS) is a respiratory disorder during sleep that has become asigni�cant public health problem over time. OSAS patients elicited the frontal cortex neuron injury, leadingto cognitive dysfunction, a signi�cant and extraordinary complication of OSAS patients. Learning andmemory testing is critical when assessing potential therapeutic strategies and the effectiveness oftreatments to manage OSAS. The objective of this article was to explore the relationship betweenin�ammation and cognitive dysfunction in OSAS.
MethodsSelected male rats were 3-months-old and with a similar weight (mean, 200 ± 10 g) were assigned to themodel group (n = 30) and the control group (n = 30). The rats in the OSAS model group were injected with0.1 ml sodium hyaluronate solution into the upper respiratory tract at the junction between the hard andsoft palate. The model and normal rats were compared using tests of Morris Water Maze. The tissuesections were stained by hematoxylin eosin(HE) and immunohistochemically(IHC).
ResultsTests of training test and spatial probe test proved signi�cant differences between 2 4 6 week’s OSASrats over all swims, p < 0.05. Histopathology showed cortical laminar oedema with vacuolation ,irregulararrangement, disorganization, rods of the nerve cells were identi�ed, astrocyte activation and reactivegliosis ,abundant astrocyte. And IHC staining showed Iba1-positive cells increased as compared tocontrol group.
ConclusionWe suggest assessing spatial and related forms of learning and memory in OSAS rat by the newstatistical method. Microglial and astrocyte activation is involved in OSAS-induced changes inin�ammatory molecules, neurogenesis, and spatial memory.
1. IntroductionObstructive sleep apnea syndrome (OSAS) is a respiratory disorder during sleep, characterized byrepeated narrowing and collapse of the pharyngeal airway during sleep, episodes of complete or partialpharyngeal obstruction and plus increases in respiratory effort resulting in intermittent hypoxia (IH)andhypercapnia and sleep fragmentation [6, 30].OSAS recurrent arousals and increase in breath efforts,leading to secondary sympathetic activation, oxidative stress and systemic in�ammation. .Associated

Page 3/26
complications include cardiovascular disease (coronary artery disease, heart failure, atrial �brillation,hypertension, and stroke[26, 22, 16],metabolic dysfunction (dyslipidemia and diabetes mellitus), andneurocognitive impairment[14]. Contribute to an overall increase in mortality from related complications[24, 46, 4].Previous studies have revealed that intermittent hypoxia (IH) conditions in OSAS patientselicited brain neuron injury (especially in the hippocampus and frontal cortex) [29, 5, 47],leading tocognitive de�cit, a signi�cant and extraordinary complication of OSAS patients. The metabolic andvascular consequences, in turn, increase the severity of OSAS and the risk of both cognitive impairmentand dementia and potentially bring forward the age of onset of mild cognitive impairment andAlzheimer's disease (AD), form a vicious circle[9]. The prevalence rate of OSAS in adults is increasing[38,41],and the number of road tra�c and workplace accidents caused by OSAS combined with cognitivedysfunction ,has an adverse impact on patients’ quality of life, learning and work e�ciency, and healthcare utilization[15, 23].In children with OSAS, cognitive dysfunction is still an important manifestation,but its underlying pathological mechanism remains unclear[7]. Cognitive functions encompass the broaddomains of attention, memory, executive function, visuospatial/constructional abilities, processingspeed(cognitive speed) and language (both expressive and receptive). As a whole, negative cognitiveeffects of OSAS are most likely in the domains of attention/vigilance, verbal and visual delayed long-termmemory, visuospatial/constructional abilities, and executive dysfunction[10, 34, 43]. Intermittent hypoxia,as often accompanies obstructive events during sleep, could also be an important contributor to cognitivedysfunction in OSAS[3, 13]. Experimental research and neuroimaging studies show effects of intermittenthypoxia on sleepiness, memory and executive dysfunction. In individuals with OSAS, such changes havebeen attributed to reduced cell neurogenesis and density of the hippocampus[17, 50, 29], the frontalcortex and generalized grey matter [35, 2, 39, 11].The abnormal changes of gray matter (GM) and whitematter may be the important pathological basis of OSAS leading to neurocognitive dysfunction.Numerous studies have shown that GM changes in the frontal cortex are one of the causes of impairedmemory and executive function [42, 45, 28]. Therefore the presence of OSAS could be seen as a factorwhich expedites the process of brain aging by increasing the susceptibility of speci�c cerebral structuresto clinical and pathological occurrences. Increased oxidative stress is associated with chronic intermittenthypoxia-mediated brain cortical neuronal cell apoptosis in a mouse model of sleep apnea. This, in turn,leads to dysfunction of prefrontal regions of the brain cortex[48, 5].
Based on the above studies, a hypothesis is proposed that the changes in frontal cortex and thesubcortical structures could be interpreted as enlargement or hypertrophy involving reactive ormaladaptive mechanisms, such as cerebral edema, neuronal branching, in�ammation, glial activation, oreven accumulative Aβ deposition, while atrophy indicates chronic neuronal stimulation Therefore, thepurpose of this study was to evaluate spatial learning and memory in OSAS rats using morris watermaze(MWM) after the establishment of an OSAS rat model[27] [40, 8] and to observe whethermorphological changes in the frontal cortex were involved in reactivity or adaptation-related pathologicalchanges.
2. Materials And Methods

Page 4/26
2.1 AnimalsSprague-Dawley rats were purchased from the Animal Experimental Center of Kunming MedicalUniversity. The selected male rats were 3-months-old and with a similar weight (mean, 200 ± 10 g), Therats were fed with standard fodder and with food and water freely available in a controlled environmentwith a constant temperature of 20 ~ 25°C and a 12/12-hr light/dark cycle and were randomly assigned tothe model group (n = 30) and the control group (n = 30). Sodium hyaluronate and other chemical reagentswere purchased from xiao lai ke mao in China, if not otherwise stated. The independent Ethics Committeeof Kunming Medical University approved the study before it began. all experiments were performed inaccordance with National Institute of Health Guidelines for the Care and Use of Laboratory Animals
2.2 Surgical MethodRats in the control group were not treated. Rats in the OSAS model group were given an intraperitonealinjection of 3.6%chloralic hydras(7ml/kg). Following anesthesia, 0.1 ml of sodium hyaluronate gel (15mg/mL) was injected into the junction between the soft and hard palate[27]. Surgical rats were randomlyassigned to the OSAS group, n = 10 for all the groups. The two groups of rats were reared separately withthe same feeding conditions, to avoid the in�uence of other factors on the experimental results.
2.3 Morris Water MazeMorris water maze was used to assess the spatial learning and memory of rats. consisted of a 1.6-mdiameter pool, which was divided into four quadrants (AQ1,OQ TQ and AQ2)The pool was surrounded bylight blue curtains with attached different shapes (such as triangle, square, circle, and pentagon) theseremained in the same position throughout the training and testing periods.. The tank was suffused withthe 27‐cm‐deep water level, which was mixed with 30 ml of ink to obscure visual cues. The temperatureof the water was maintained at 23°C–24°C. A platform 12 cm in diameter was hidden 1–2 cm below thesurface of the water. The experimental room was soundproof and without direct light. The test consistedof acquisition training test and spatial probe test.
2.3.1 Training testBrie�y, rats were �rst trained to �nd a hidden platform in the target quadrant that was submerged in 1–2cm of water by using a stationary array of cues outside the pool. All testing was conducted at roughly thesame time each day in order to minimize variability in performance due to time of day. Acquisitiontraining in the hidden platform was conducted for 5 d consecutively including 20 trials. A trial began byplacing the mouse on the platform for 15 s to allow orientation to extra-maze cues. In each trial, the ratwas placed into the pool at one of the four possible locations (randomly ordered). After orientation, micewere gently lowered tail-�rst into the pool facing the wall at one of three positions, each at the center ofthe wall of a different quadrant not housing the platform. All rats were given 90 s free time to �nd thehidden platform, and the time spent to reach the escape platform was de�ned as escape latency. If the ratdid not �nd the platform within 90s, it was gently guided by the observer to the platform for 15s. After

Page 5/26
removal from the pool, mice were manually dried with a terrycloth towel and placed in a warming cage(consisting of a heating pad underneath the cage) for at least 5 min before returning to the home cage.Mice were visually inspected to ensure thorough dryness.
2.3.2 Spatial Probe TestAfter rest for 1 d, a 90-s probe test was conducted in which the platform was removed. Both during thetraining and test period, the swimming pathways, percentage of time spent in the target quadrant,platform area crossings, and swimming speed were recorded and calculated using a computer software(XR-XM101,X-maze). The resultant behavioral data were statistically analyzed as described below.
3. Histopathological EvalutionTen percent of neutral formalin-�xed tissues were embedded in para�n. Coronal sections were then cut,and stained with hematoxylin-eosin. Random histological images were recorded at magni�cations underan Leica DM400B light microscope (Leica ,Germany).
4. Immunohistochemically AnalysisBrain tissue in the hippocampus was �xed in 10% formalin solution and embedded in para�n. Toevaluate histopathological changes in the frontal cortex, 5µm sections were stained with Iba1. Randomhistological images were recorded at magni�cations under an Leica DM400B light microscope (Leica,Germany). Mean of IOD analysis for the Iba1-positive microglia was performed using Image-Pro Plus 6.0software.
5. Statistical AnalyseWe encoded the accelerated failure time(AFT) survival model to analyze the latency data of morris watermaze evasion based on the recommendations of Clark R. Andersen and his paper [1]. We performed theAFT modeling using R’s survreg function and RStudio(RStudio Inc.,Boston USA)statistical analysis,otherwise as described in the paper (Survival/Graph). This approach is commonly referred to as “survivalmodeling” although in the context of MWM the event of interest is reaching the submerged platform,rather than mortality. Datasets used are included in Supplemental Materials. We adopt Marianne et al [32]propose here a new way to analyze MWM probe test data from the standard reference memory task ofthe MWM that accurately and simultaneously describes the four variables of time spent in the quadrantsand allows to extract more information from the same experiments than the currently usedmethod. Application of the likelihood-ratio test based on the Dirichlet distribution and Perspectives usingBayesian inference .Marianne et al provide a package https://github.com/xuod/dirichlet contains apython module called dirichlet which can be used with python online or locally, or with R to show how touse the dirichlet module to perform the uniformity test and produce plots with test data and/or your data.Data for Iba1-positive microglial cells comparison was performed with one-way analysis of variance(ANOVA), followed by the LSD and S-N-K multiple comparisons test Which were analyzed by GraphPad

Page 6/26
Prism 5.0(GraphPad Software San Diego CA USA). The level of statistical signi�cance was set at p < 0.05.
6. Results
6.1 The results of training testIn the MWM task, the animal is required to �nd a hidden platform to escape from swimming in a pool ofwater. To accomplish this task, the animal forms a “spatial orientation map” in the brain using visualstimuli from extra-maze cues in the testing room. During training, learning is assessed by the amount oftime elapsed before the animal climbs onto the platform to escape the water (escape latency) and by thepercentage of time or path length spent in the quadrant housing the platform (target quadrant).A time-to-event AFT model was used to relate the swim duration (latency 90 s) to �nd the submerged platform(event) to swim day (days 1, 2, 3, 4, 5), swim per day (swims 1, 2, 3, 4), group (control vs OSAS).
The time-to-event AFT model showed signi�cant differences between 2 4 6 week’s OSAS rats over allswims on the everyday, p < 0.001, as summarized in Table 1, Table 2, Table 3and Fig. 2. The Fig. 2 showsa consistent trend of lower probability of reaching the platform over time for the OSAS group incomparison with the control group. It also shows the expected trend in increased probability of �nding theplatform over time both over multiple swims per day and between days. And showed signi�cantdifferences between OSAS and control group on the same week, p 0.001.In addition, the mean escapelatency of 6 week’s OSAS group was signi�cantly increased compared with that of the control group.
6.2 The result of spatial probe testAfter the training test, 90-s probe test was conducted in which the platform was removed. In the Fig. 3,each column represents a sample and each color represents a quadrant. Mean values for the fraction oftime spent in each quadrant is represented by a dotted line and the error bars on the means areapproximated with the inverse Fisher information. For OSAS rat the fraction of time spent in eachquadrant is approximately similar leading to a uniform distribution whereas for control rat the
time spent in the target quadrant is signi�cantly higher leading to a non-uniform distribution. And showedsigni�cant differences between OSAS and control group on the same week, p 0.05. Corner plotrepresenting constraints on the mean fractions of time m’s for the two data sets control rat (blue) andOSAS rat (green). The diagonal plots show the marginal distributions of m’s (with shaded 68% con�denceinterval) and off-diagonal plots show the two-dimensional distributions of pairs of these variables (innerand outer contours represent the 68% and 95% con�dence levels). The black dashed lines represent thecase of uniformity (25%) and the red lines correspond to equal time spent in both consideredquadrant[32]. Constraints on m1 (leftmost column) indicate that control rats favor the target quadrant.
7. Effects On Histopathology

Page 7/26
Hematoxylin–eosin (HE) staining revealed that rats in control group had clear layers of brain tissuestructures, stained evenly and with a regular cell shape, compared with rats in OSAS group. Astrocyteswere considered to be of the pale glial nuclei showing a vesicular nucleus with at least one basophilicnucleolus were visible. In 2w’s OSAS group, the right cortical pyramidal layer astrocytes is mildvacuolation of internal capsule and major rami. And the left frontal cortex showed cortical laminaroedema with vacuolation ,irregular arrangement, disorganization, rods of the nerve cells were identi�ed,astrocyte activation and reactive gliosis ,abundant astrocyte(Fig. 5). These evidence shows that thehistopathological change of frontal cortex is astrocyte hyperplastic in�ammatory response.
8. Expression Of The Iba1-positive MicrogliaExcept the right frontal cortex in 6w’s group(Fig. 7B). .Mean of IOD analysis for the Iba1-positive microgliawas signi�cant differences between OSAS and control group on the same week, p 0.05(Fig. 7A).whichcon�rmed the promoted effect of OSAS on microglia activation.
9. DiscussionOSAS is a disorder associated with neurocognitive impairment. However, the mechanisms leading tocognitive de�cits in OSAS remain controversial. In this study, a rat model of partial pharyngeal occlusionwas used to simulate chronic intermittent hypoxia in OSAS[49].The highly-interconnected andneurochemically-rich frontal cortex plays a crucial role in the regulation of mood and cognition, domainsdisrupted in depression and other central nervous system disorders, and it is an important site of actionfor their therapeutic control [33]. For improving our understanding of the function and dysfunction of thefrontal cortex, we found that OSAS resulted in signi�cantly reduced learning and spatial explorationability in rats by Morris water maze test. HE showed chronic hypoxia changes in the frontal cortex, withrod cells and micro-vacuolar cell formation in the 2-week group, neuronal cell reduction with astrocyteproliferation in the 4-week group, and homogenized changes in the 6-week group. IHC microglia cells wereincreased and some of them were hyperchromatic. Compared with the control group, the difference ofpositive cells in the frontal cortex of each OSAS rat was statistically signi�cant. Our research showed thatthe activation of microglia and astrocyte in the frontal cortex, involving increased cell number or celldensity, and morphological alterations.
9.1 OSAS contributed neurocognitive de�cit in ratsOSAS can lead to a series of cardiovascular and cerebrovascular problems and associated with a numberof adverse health consequences. A growing literature focuses on its neurocognitive correlates. Althoughresearch in this �eld is mixed, multiple studies indicate that OSAS patients show impairment in attention,memory, and executive function.[20] Some researchers argue that intermittent hypoxemia leads toprefrontal cortical degeneration, which could explain the impairment in executive function observed inpatients with OSAS[5]. The frontal cortex is an important brain region for central executive function and isthe core subcomponent of execution and memory, thirty-nine task-based functional magnetic resonance

Page 8/26
imaging (fMRI) studies (697 mild cognitive impairment (MCI) patients and 628 healthy controls) wereincluded in MCI-related meta-analysis while 36 task-based fMRI studies (421 AD patients and 512 healthycontrols) were included in AD-related meta-analysis. The meta-analytic results revealed that both MCI-related and AD-related hyperactivation the frontal lobe relative to healthy controls [19, 25].Damage to thefrontal cortex results in impaired executive function, learning and memory performance.
9.2 Changed in HistopathologyOxidative stress-induced glial cells activation, neuroin�ammation and mitochondrial dysfunction lead tovarious molecular events in brain neurons causing neuronal cell death in the frontal cortex of OSASrats[12].Key to this immune to brain communication is that glia, microglia, and astrocytes, interpret andpropagate in�ammatory signals in the brain that in�uence physiological and behavioral responses[36].Activated microglia proliferate and accumulate in areas presenting high densities of apoptotic neurons tofacilitate neuronal turnover during developmental cell death[44].As microglia are the brain’s innateimmune effector cells, dysregulation of microglial behavior appears to be a critical component of thisprogression, brain microglia become dysregulated with age and cause chronic neuroin�ammation[31].There is key differential expression and timing of cytokine expression of microglia and astrocytesthat are interpreted to indicate sequential activation and evidence of dynamic communication betweentwo cell types. Activated astrocytes produce many regulatory factors that may in�uence CNS immunityand provide negative feedback to activated microglia[36]. Immunocytochemically positive for Iba1protein were the microglia,a study indicated that localisation of Iba1 protein is restricted to microglia bothin vitro and in vivo, and that Iba1 protein plays a role in regulating the function of microglia, especially inthe activated microglia[18].
OSAS intermittent hypoxia in oxidative stress activated microglia and astrocytes, chronic hypoxic cerebralcortex damage early have cortical laminar oedema with vacuolation ,irregular arrangement,disorganization, rods of the nerve cells were identi�ed, astrocyte activation and reactive gliosis ,abundantastrocyte[37].Our study showed the microglia ,astrocyte activation and reactive gliosis. The increasedevidence collected supports that OSAS should be viewed as low-grade chronic in�ammatory diseasesand the existence of in�ammation can be considered a potential contributing factor to OSASpathophysiology and comorbidity.[21]. The important role played by in�ammation in OSAS relatedcognitive dysfunction. CIH characterized in OSAS leads to peripheral in�ammation which access the CNSthrough BBB or via the stimulation of vagal afferents. The high level of in�ammation in the CNS furtherupregulates glial cells (microglia and astrocyte) activity, inducing and aggravating the neuroin�ammatoryreaction. Meanwhile, CIH could directly activate microglia and astrocyte, prompting the release ofin�ammatory cytokines in the CNS. The frontal cortex is the most sensitive to hypoxia, so this area isinvolved in most neurocognitive dysfunction. IH may affect microglia directly or indirectly throughperipheral or other CNS cells, require an understanding of how intermittent hypoxia promotesneuroin�ammation, neuronal death and cognitive de�cits.
10. Conclusion

Page 9/26
We encode a new statistical method of survival model to analyze Morris Water Maze spatial probe testdata and suggest assessing spatial and related forms of learning and memory in OSAS rat by the newstatistical method. A better understanding of the role of microglia and astrocytes in the regulation ofOSAS pathology is needed as this could pave the way for new therapeutic strategies.
11. R Code(Survival/graph)

Page 10/26
library(ggpubr) #package for combining plots in a single image
library(ggplot) #package for plotting
library(survival) # package for modeling
library(hommel) # for the hommel p values
test = read.csv("~/�nal.csv") #This is my version of the excel �le
# This is the main Idea, we will run a survival regression then make a prediction of what is
# the mean given our model for each level of probability plus the con�dence intervals.
# Then we are going to make a table for the difference in means with it's respective calculations
#### See the AIC to test what distribution is better ####
# �rst we list all the possible distributions and then make a loop printing the AIC
dist = c("weibull", "exponential", "gaussian", "logistic","lognormal", "loglogistic")
for (i in 1:length(dist)){
m= survreg(Surv(Result)~ factor(round)+factor(control)+factor(day), dist=dist[i], data = test)
print(paste0("AIC ", dist[i], ": ", extractAIC(m)[2]))
}
#this indicates that we should use logistic, but in the next lines we use loglogistic following the paper
#### WRITING THE MODEL ####
# we have to make the outcome (latency time, a survival variable, but we assume that all of
# the rat survived because we don't have other data), and we explain the difference in the
# latency by the model, the day, and the round of swiming if you have wich rats did
# reach the platform in (it should be a dichotomous variable) change the model like this:
# model1 = survreg(Surv(Result, NEW_VARIABLE)~factor(control)+factor(round)+factor(day),
# dist="loglogistic", data = test)
model1 = survreg(Surv(Result)~factor(control)+factor(round)+factor(day),
dist="loglogistic", data = test)
# we are going to make 20 plots by hand because it's literally 7 minutes (I measured it)
# we could autumate it eval on the line plotPart54 I don't like evals but it's the only
# way of dinamucally generatte the plots inside of a loop using the function eval
Page 11/26
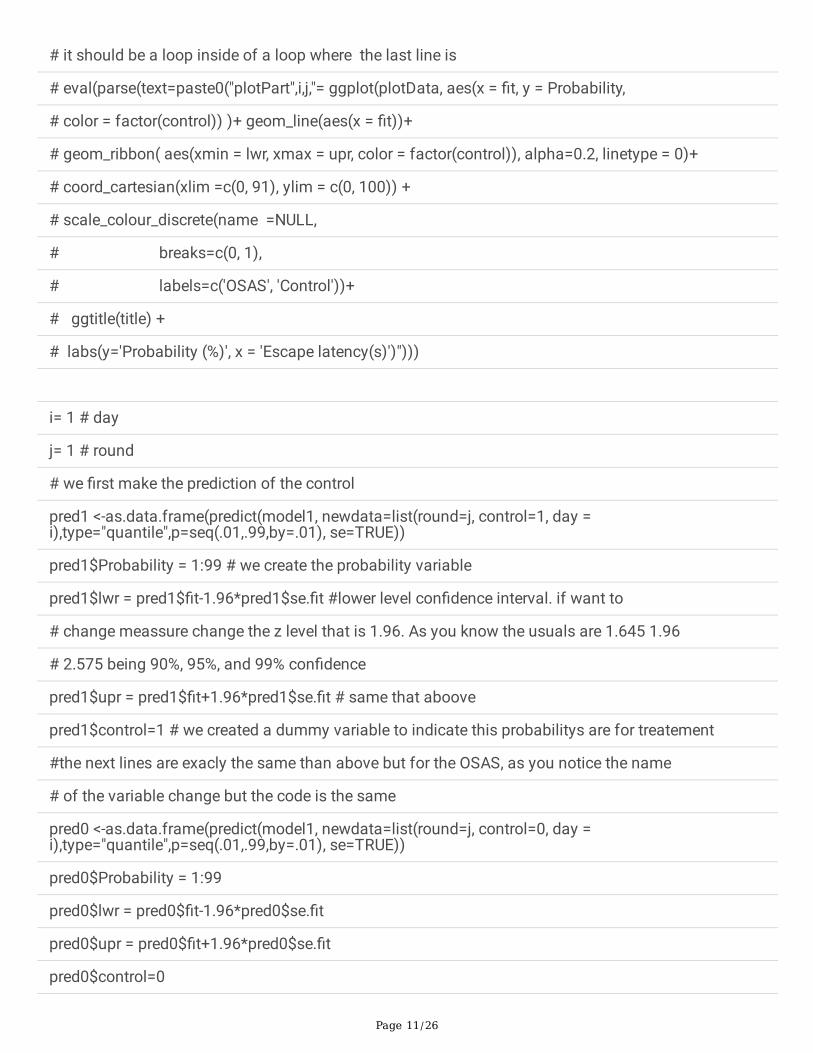
# it should be a loop inside of a loop where the last line is
# eval(parse(text=paste0("plotPart",i,j,"= ggplot(plotData, aes(x = �t, y = Probability,
# color = factor(control)) )+ geom_line(aes(x = �t))+
# geom_ribbon( aes(xmin = lwr, xmax = upr, color = factor(control)), alpha=0.2, linetype = 0)+
# coord_cartesian(xlim =c(0, 91), ylim = c(0, 100)) +
# scale_colour_discrete(name =NULL,
# breaks=c(0, 1),
# labels=c('OSAS', 'Control'))+
# ggtitle(title) +
# labs(y='Probability (%)', x = 'Escape latency(s)')")))
i= 1 # day
j= 1 # round
# we �rst make the prediction of the control
pred1 <-as.data.frame(predict(model1, newdata=list(round=j, control=1, day =i),type="quantile",p=seq(.01,.99,by=.01), se=TRUE))
pred1$Probability = 1:99 # we create the probability variable
pred1$lwr = pred1$�t-1.96*pred1$se.�t #lower level con�dence interval. if want to
# change meassure change the z level that is 1.96. As you know the usuals are 1.645 1.96
# 2.575 being 90%, 95%, and 99% con�dence
pred1$upr = pred1$�t+1.96*pred1$se.�t # same that aboove
pred1$control=1 # we created a dummy variable to indicate this probabilitys are for treatement
#the next lines are exacly the same than above but for the OSAS, as you notice the name
# of the variable change but the code is the same
pred0 <-as.data.frame(predict(model1, newdata=list(round=j, control=0, day =i),type="quantile",p=seq(.01,.99,by=.01), se=TRUE))
pred0$Probability = 1:99
pred0$lwr = pred0$�t-1.96*pred0$se.�t
pred0$upr = pred0$�t+1.96*pred0$se.�t
pred0$control=0

Page 12/26
# we create a single dataframe with both predictions
plotData = rbind(pred0, pred1)
title = paste0("Day ",i,", Swim ", j) # this is the title of each individual plot
plotPart54 = ggplot(plotData, aes(x = �t, y = Probability, color = factor(control)) )+
geom_line(aes(x = �t))+ # we plot the central line
# the next line geom_ribon creates the con�dence interval shadow
geom_ribbon( aes(xmin = lwr, xmax = upr, color = factor(control)), alpha=0.2, linetype = 0)+
# we want to show the plot only to 90 seconds, and here it is
coord_cartesian(xlim =c(0, 90), ylim = c(0, 100)) +
# we want the labels be OSAS and Control instead of 0 and 1 and no title
scale_colour_discrete(name =NULL,
breaks=c(0, 1),
labels=c("OSAS", "Control"))+
# add the title to the plot
ggtitle(title) +
# change the axis labels
labs(y="Probability (%)", x = "Escape latency(s)")
# if you make it in a loop this is wehre it should end
# the next line just add all the plots into a single one with a common legend
�gure <- ggarrange(plotPart11, plotPart12, plotPart13, plotPart14,
plotPart21, plotPart22, plotPart23, plotPart24,
plotPart31, plotPart32, plotPart33, plotPart34,
plotPart41, plotPart42, plotPart43, plotPart44,
plotPart51, plotPart52, plotPart53, plotPart54,
ncol = 4, nrow = 5,
common.legend = TRUE, legend = "bottom")
�gure
#### CREATE THE TABLE ####

Page 13/26
# We �rst create a matrix of the size we want
result = matrix(data = NA, nrow = 20, ncol = 9)
result[,1] <- rep(1:5, each=4) # populate the days column repeating 1 to 5 each number 4 times
result[,2] <- rep(1:4) # populate the round column repeating the sequence 1 to 4
#loop to though the matrix
for (i in 1:NROW(result)){
# predict the expected mean for the given swim day and round for control
pred1 <-as.data.frame(predict(model1, newdata=list(round=result[i,2], control=1,
day = result[i,1]),
type="quantile",p=.5, se=TRUE))
# predict the expected mean for the given swim day and round for test
pred0 <-as.data.frame(predict(model1, newdata=list(round=result[i,2], control=0,
day = result[i,1]),
type="quantile",p=.5, se=TRUE))
result[i,3] = pred0$�t-pred1$�t # calculate the difference in means
result[i,4] = sqrt((pred0$se.�t^2)/10+(pred1$se.�t^2)/10) #calculate the standard error of thedifference
result[i,5] = pred0$�t/pred1$�t # ratio of the expected mean
result[i,6] = result[i,3]-1.96*result[i,4] # Lower bound con�dence interval of the difference
result[i,7] = result[i,3]+1.96*result[i,4] # Upper bound con�dence interval of the difference
result[i,8] = pnorm((0-result[i,3])/result[i,4]) # pvalue
result[i,9] = hommel(result[i,8], simes=TRUE)@adjusted # hommel p value
}
result = as.data.frame(result) # we transform it into a dataframe so we can name the columns
#with the array names
names = c("Day","Swim","estimate","SE","exp(estimate)","CI95Min","CI95Max","p-value","Hommel")
colnames(result) = names # we just set the columns names as we want
write.csv(result, "Results.csv") # export it to csv
Declarations

Page 14/26
ETHICS APPROVAL AND CONSENT TO PARTICIPATE
The independent Ethics Committee of Kunming Medical University approved the study before it began. Allexperiments were performed in accordance with National Institute of Health Guidelines for the Care andUse of Laboratory Animals.
CONSENT FOR PUBLICATION
All authors have read and approved this version of the article for publication.
AVAILABILITY OF DATA AND MATERIALS
The datasets used and/or analyzed in this study are available from the corresponding author onreasonable request.
COMPETING INTERESTS
The authors declare that they have no competing interests.
ACKONWLEDGEMENTS
We are grateful to Clark R. Andersen for his generosity suggestions in our encoding an earlier R code.
AUTHOR CONTRIBUTIONS
We thank our research staff (YuQing Li, Xin Ai ChunHua Bao, RenShuai Liu, YaFeng Lu) who conductedthe experiments used in this article. And YuRong Zheng and YueWu involved in data curation. All authorsread and approved the �nal manuscript. Min Luo and YuQing Li contributed equally to this study.
FUNDING
1. Postgraduate Innovation Fund of Kunming Medical University 2020S043.
References1. Andersen CR, Wolf J, Jennings K, Prough DS, Hawkins BE (2020) An Accelerated Failure Time
Survival Model to Analyze Morris Water Maze Latency Data. Journal of neurotrauma.doi:10.1089/neu.2020.7089
2. Baril AA, Gagnon K, Brayet P, Montplaisir J, Carrier J, Soucy JP, Lafond C, Blais H, d'Aragon C, GagnonJF, Gosselin N (2020) Obstructive sleep apnea during REM sleep and daytime cerebral functioning: Aregional cerebral blood �ow study using high-resolution SPECT. Journal of cerebral blood �ow andmetabolism : o�cial journal of the International Society of Cerebral Blood Flow and Metabolism40:1230-1241. doi:10.1177/0271678x18814106

Page 15/26
3. Bédard MA, Montplaisir J, Richer F, Rouleau I, Malo J (1991) Obstructive sleep apnea syndrome:pathogenesis of neuropsychological de�cits. Journal of clinical and experimental neuropsychology13:950-964. doi:10.1080/01688639108405110
4. Beebe DW (2005) Neurobehavioral effects of obstructive sleep apnea: an overview and heuristicmodel. Current opinion in pulmonary medicine 11:494-500.doi:10.1097/01.mcp.0000183059.52924.39
5. Beebe DW, Gozal D (2002) Obstructive sleep apnea and the prefrontal cortex: towards acomprehensive model linking nocturnal upper airway obstruction to daytime cognitive andbehavioral de�cits. Journal of sleep research 11:1-16. doi:10.1046/j.1365-2869.2002.00289.x
�. Bucks RS, Olaithe M, Rosenzweig I, Morrell MJ (2017) Reviewing the relationship between OSA andcognition: Where do we go from here? Respirology (Carlton, Vic) 22:1253-1261.doi:10.1111/resp.13140
7. Cha J, Zea-Hernandez JA, Sin S, Graw-Panzer K, Shifteh K, Isasi CR, Wagshul ME, Moran EE, PosnerJ, Zimmerman ME, Arens R (2017) The Effects of Obstructive Sleep Apnea Syndrome on the DentateGyrus and Learning and Memory in Children. The Journal of neuroscience : the o�cial journal of theSociety for Neuroscience 37:4280-4288. doi:10.1523/jneurosci.3583-16.2017
�. D'Hooge R, De Deyn PP (2001) Applications of the Morris water maze in the study of learning andmemory. Brain research Brain research reviews 36:60-90. doi:10.1016/s0165-0173(01)00067-4
9. Daulatzai MA (2015) Evidence of neurodegeneration in obstructive sleep apnea: Relationshipbetween obstructive sleep apnea and cognitive dysfunction in the elderly. Journal of neuroscienceresearch 93:1778-1794. doi:10.1002/jnr.23634
10. Daurat A, Foret J, Bret-Dibat JL, Fureix C, Tiberge M (2008) Spatial and temporal memories areaffected by sleep fragmentation in obstructive sleep apnea syndrome. Journal of clinical andexperimental neuropsychology 30:91-101. doi:10.1080/13803390701236116
11. de Bruin JP, Swinkels WA, de Brabander JM (1997) Response learning of rats in a Morris water maze:involvement of the medical prefrontal cortex. Behavioural brain research 85:47-55.doi:10.1016/s0166-4328(96)00163-5
12. Dinda B, Dinda M, Kulsi G, Chakraborty A, Dinda S (2019) Therapeutic potentials of plant iridoids inAlzheimer's and Parkinson's diseases: A review. European journal of medicinal chemistry 169:185-199. doi:10.1016/j.ejmech.2019.03.009
13. Findley LJ, Barth JT, Powers DC, Wilhoit SC, Boyd DG, Suratt PM (1986) Cognitive impairment inpatients with obstructive sleep apnea and associated hypoxemia. Chest 90:686-690.doi:10.1378/chest.90.5.686
14. Gaines J, Vgontzas AN, Fernandez-Mendoza J, Bixler EO (2018) Obstructive sleep apnea and themetabolic syndrome: The road to clinically-meaningful phenotyping, improved prognosis, andpersonalized treatment. Sleep medicine reviews 42:211-219. doi:10.1016/j.smrv.2018.08.009
15. George CF (2007) Sleep apnea, alertness, and motor vehicle crashes. American journal of respiratoryand critical care medicine 176:954-956. doi:10.1164/rccm.200605-629PP

Page 16/26
1�. Goudis CA, Ketikoglou DG (2017) Obstructive sleep and atrial �brillation: Pathophysiologicalmechanisms and therapeutic implications. International journal of cardiology 230:293-300.doi:10.1016/j.ijcard.2016.12.120
17. Hopkins RO, Kesner RP, Goldstein M (1995) Memory for novel and familiar spatial and linguistictemporal distance information in hypoxic subjects. Journal of the International NeuropsychologicalSociety : JINS 1:454-468. doi:10.1017/s1355617700000552
1�. Ito D, Imai Y, Ohsawa K, Nakajima K, Fukuuchi Y, Kohsaka S (1998) Microglia-speci�c localisation ofa novel calcium binding protein, Iba1. Brain research Molecular brain research 57:1-9.doi:10.1016/s0169-328x(98)00040-0
19. Jones K, Harrison Y (2001) Frontal lobe function, sleep loss and fragmented sleep. Sleep medicinereviews 5:463-475. doi:10.1053/smrv.2001.0203
20. Kielb SA, Ancoli-Israel S, Rebok GW, Spira AP (2012) Cognition in obstructive sleep apnea-hypopneasyndrome (OSAS): current clinical knowledge and the impact of treatment. Neuromolecular medicine14:180-193. doi:10.1007/s12017-012-8182-1
21. Kiernan EA, Smith SM, Mitchell GS, Watters JJ (2016) Mechanisms of microglial activation inmodels of in�ammation and hypoxia: Implications for chronic intermittent hypoxia. The Journal ofphysiology 594:1563-1577. doi:10.1113/jp271502
22. Kim T, Lee CS, Lee SD, Kang SH, Han JW, Malhotra A, Kim KW, Yoon IY (2015) Impacts ofcomorbidities on the association between arterial stiffness and obstructive sleep apnea in the elderly.Respiration; international review of thoracic diseases 89:304-311. doi:10.1159/000371768
23. Léger D, Stepnowsky C (2020) The economic and societal burden of excessive daytime sleepiness inpatients with obstructive sleep apnea. Sleep medicine reviews 51:101275.doi:10.1016/j.smrv.2020.101275
24. Lévy P, Kohler M, McNicholas WT, Barbé F, McEvoy RD, Somers VK, Lavie L, Pépin JL (2015)Obstructive sleep apnoea syndrome. Nature reviews Disease primers 1:15015.doi:10.1038/nrdp.2015.15
25. Li HJ, Hou XH, Liu HH, Yue CL, He Y, Zuo XN (2015) Toward systems neuroscience in mild cognitiveimpairment and Alzheimer's disease: a meta-analysis of 75 fMRI studies. Human brain mapping36:1217-1232. doi:10.1002/hbm.22689
2�. Li T, Chen Y, Gua C, Wu B (2018) Elevated Oxidative Stress and In�ammation in HypothalamicParaventricular Nucleus Are Associated With Sympathetic Excitation and Hypertension in RatsExposed to Chronic Intermittent Hypoxia. Frontiers in physiology 9:840.doi:10.3389/fphys.2018.00840
27. Liu Y, Gao L, Lv W, Lin L, Wang Y, He H, Jiang F, Feng F (2019) Histological, Ultrastructural, andPhysiological Evaluation of a Rat Model of Obstructive Sleep Apnea Syndrome. Medical sciencemonitor : international medical journal of experimental and clinical research 25:1806-1813.doi:10.12659/msm.913056

Page 17/26
2�. Macey PM, Henderson LA, Macey KE, Alger JR, Frysinger RC, Woo MA, Harper RK, Yan-Go FL, HarperRM (2002) Brain morphology associated with obstructive sleep apnea. American journal ofrespiratory and critical care medicine 166:1382-1387. doi:10.1164/rccm.200201-050OC
29. Macey PM, Prasad JP, Ogren JA, Moiyadi AS, Aysola RS, Kumar R, Yan-Go FL, Woo MA, AlbertThomas M, Harper RM (2018) Sex-speci�c hippocampus volume changes in obstructive sleepapnea. NeuroImage Clinical 20:305-317. doi:10.1016/j.nicl.2018.07.027
30. Malhotra A, White DP (2002) Obstructive sleep apnoea. Lancet (London, England) 360:237-245.doi:10.1016/s0140-6736(02)09464-3
31. Matt SM, Johnson RW (2016) Neuro-immune dysfunction during brain aging: new insights inmicroglial cell regulation. Current opinion in pharmacology 26:96-101.doi:10.1016/j.coph.2015.10.009
32. Maugard M, Doux C, Bonvento G (2019) A new statistical method to analyze Morris Water Maze datausing Dirichlet distribution. F1000Research 8:1601. doi:10.12688/f1000research.20072.2
33. Millan MJ, Rivet JM, Gobert A (2016) The frontal cortex as a network hub controlling mood andcognition: Probing its neurochemical substrates for improved therapy of psychiatric and neurologicaldisorders. Journal of psychopharmacology (Oxford, England) 30:1099-1128.doi:10.1177/0269881116672342
34. Mu L, Peng L, Zhang Z, Jie J, Jia S, Yuan H (2017) Memory and Executive Screening for theDetection of Cognitive Impairment in Obstructive Sleep Apnea. The American journal of the medicalsciences 354:399-407. doi:10.1016/j.amjms.2017.04.020
35. Musso MF, Lindsey HM, Wilde EA, Hunter JV, Glaze DG, Goodrich-Hunsaker NJ, Wu TC, Black G,Biekman B, Zhang W, Zhu H, Anand GS, Friedman EM (2020) Volumetric brain magnetic resonanceimaging analysis in children with obstructive sleep apnea. International journal of pediatricotorhinolaryngology 138:110369. doi:10.1016/j.ijporl.2020.110369
3�. Norden DM, Trojanowski PJ, Villanueva E, Navarro E, Godbout JP (2016) Sequential activation ofmicroglia and astrocyte cytokine expression precedes increased Iba-1 or GFAP immunoreactivityfollowing systemic immune challenge. Glia 64:300-316. doi:10.1002/glia.22930
37. Pei H, Jiang T, Liu G, Li Z, Luo K, An J, Li G, Guo Y (2016) The Effect of Minimally InvasiveHematoma Aspiration on the JNK Signal Transduction Pathway after Experimental IntracerebralHemorrhage in Rats. International journal of molecular sciences 17. doi:10.3390/ijms17050710
3�. Peppard PE, Young T, Barnet JH, Palta M, Hagen EW, Hla KM (2013) Increased prevalence of sleep-disordered breathing in adults. American journal of epidemiology 177:1006-1014.doi:10.1093/aje/kws342
39. Rogić Vidaković M, Šoda J, Jerković A, Benzon B, Bakrač K, Dužević S, Vujović I, Mihalj M, Pecotić R,Valić M, Mastelić A, Hagelien MV, Zmajević Schőnwald M, Đogaš Z (2020) Obstructive Sleep ApneaSyndrome: A Preliminary Navigated Transcranial Magnetic Stimulation Study. Nature and science ofsleep 12:563-574. doi:10.2147/nss.S253281

Page 18/26
40. Rudy JW, Stadler-Morris S, Albert P (1987) Ontogeny of spatial navigation behaviors in the rat:dissociation of "proximal"- and "distal"-cue-based behaviors. Behavioral neuroscience 101:62-73.doi:10.1037//0735-7044.101.1.62
41. Senaratna CV, Perret JL, Lodge CJ, Lowe AJ, Campbell BE, Matheson MC, Hamilton GS, DharmageSC (2017) Prevalence of obstructive sleep apnea in the general population: A systematic review.Sleep medicine reviews 34:70-81. doi:10.1016/j.smrv.2016.07.002
42. Shi Y, Chen L, Chen T, Li L, Dai J, Lui S, Huang X, Sweeney JA, Gong Q (2017) A Meta-analysis ofVoxel-based Brain Morphometry Studies in Obstructive Sleep Apnea. Scienti�c reports 7:10095.doi:10.1038/s41598-017-09319-6
43. Slim M, Westmacott R, Toutounji S, Singh J, Narang I, Weiss S, Krishnan P, Grbac E, Surmava AM,Andres K, MacGregor D, deVeber G, Moharir M, Dlamini N (2020) Obstructive sleep apnea syndromeand neuropsychological function in pediatric stroke. European journal of paediatric neurology : EJPN: o�cial journal of the European Paediatric Neurology Society 25:82-89.doi:10.1016/j.ejpn.2019.11.006
44. Tay TL, Savage JC, Hui CW, Bisht K, Tremblay M (2017) Microglia across the lifespan: from origin tofunction in brain development, plasticity and cognition. The Journal of physiology 595:1929-1945.doi:10.1113/jp272134
45. Torelli F, Moscufo N, Garreffa G, Placidi F, Romigi A, Zannino S, Bozzali M, Fasano F, Giulietti G,Djonlagic I, Malhotra A, Marciani MG, Guttmann CR (2011) Cognitive pro�le and brain morphologicalchanges in obstructive sleep apnea. NeuroImage 54:787-793. doi:10.1016/j.neuroimage.2010.09.065
4�. Wallace A, Bucks RS (2013) Memory and obstructive sleep apnea: a meta-analysis. Sleep 36:203-220. doi:10.5665/sleep.2374
47. Wu Y, Zhao W, Chen X, Wan X, Lei X (2020) Aberrant Awake Spontaneous Brain Activity in ObstructiveSleep Apnea: A Review Focused on Resting-State EEG and Resting-State fMRI. Frontiers in neurology11:768. doi:10.3389/fneur.2020.00768
4�. Xu W, Chi L, Row BW, Xu R, Ke Y, Xu B, Luo C, Kheirandish L, Gozal D, Liu R (2004) Increased oxidativestress is associated with chronic intermittent hypoxia-mediated brain cortical neuronal cell apoptosisin a mouse model of sleep apnea. Neuroscience 126:313-323.doi:10.1016/j.neuroscience.2004.03.055
49. Zhang Y, Cao H, Qiu X, Xu D, Chen Y, Barnes GN, Tu Y, Gyabaah AT, Gharbal A, Peng C, Cai J, Cai X(2020) Neuroprotective Effects of Adenosine A1 Receptor Signaling on Cognitive Impairment Inducedby Chronic Intermittent Hypoxia in Mice. Frontiers in cellular neuroscience 14:202.doi:10.3389/fncel.2020.00202
50. Zola-Morgan S, Squire LR, Amaral DG (1986) Human amnesia and the medial temporal region:enduring memory impairment following a bilateral lesion limited to �eld CA1 of the hippocampus.The Journal of neuroscience : the o�cial journal of the Society for Neuroscience 6:2950-2967.doi:10.1523/jneurosci.06-10-02950.1986

Page 19/26
TablesTable1. The AFT model-adjusted differences between 2wOSAS and 2wControl, by day and swim per day
Table 2 The AFT model-adjusted differences between 4wOSAS and 4wControl, by day and swim per day
Table 3.The AFT model-adjusted differences between 6wOSAS and 6wControl, by day and swim per day

Page 20/26
Figures

Page 21/26
Figure 1
Schematic diagram of MWM. Adjacent quadrant 1(AQ1);Opposite quadrant(OQ);Target quadrant(TQ);Adjacent quadrant 2(AQ2).

Page 22/26
Figure 2
Probability of reaching the hidden platform over time for each OSAS group, per predictions from the time-to-event AFT model, by day and swim-per-day.

Page 23/26
Figure 3
Time spent in the four quadrants by OSAS rats and control rats. The data were expressed as mean ±SEM. *p < 0.05 and ** P <0.01 vs. Control.

Page 24/26
Figure 4
Fraction of time spent in the four quadrants for OSAS rats and control rats in the case of Bayesianinference. m1 represents the target quadrant (TQ).
Figure 5
The morphological and structural changes of neurons in OSAS and control groups, astrocytes is mildvacuolation or abundant (black arrows), denatured nerve cells(red arrows). Original magni�cation = 4×

Page 25/26
/40× and scale bar = 500μm/50μm.
Figure 6
Iba1-positive microglial cells changes of the frontal cortex in OSAS and control groups. Originalmagni�cation = 4× /40× and scale bar = 500 μm/50μm.B,C The data were expressed as mean ± SEM andcompared using unpaired t-test one-way ANOVA. *p < 0.05 and ** P <0.01 vs. Control.

Page 26/26
Supplementary Files
This is a list of supplementary �les associated with this preprint. Click to download.
�nal.csv