originally published as - gfzpublic
TRANSCRIPT

Originally published as:
Klinkmüller, M., Schreurs, G., Rosenau, M., Kemnitz, H. (2016): Properties of granular analogue model materials: A community wide survey. - Tectonophysics, 684, pp. 23—38.
DOI: http://doi.org/10.1016/j.tecto.2016.01.017

1
Properties of granular analogue model materials: A community 1
wide survey 2
3
Klinkmüller M. a, Schreurs G a, Rosenau M. b, Kemnitz H. b, 4
5
a Institute of Geological Sciences, University of Bern, Baltzerstrasse 1+3, CH-3012 6
Bern. [email protected], tel. +41 31 631 87 60 7
b Helmholtz-Zentrum Potsdam –Deutsches GeoForschungsZentrum GFZ 8
Telegrafenberg, D-14473 Potsdam, Germany. 9
10
11
Abstract 12
13
We report the material properties of 26 granular analogue materials used in 14 ana-14
logue modelling laboratories. We determined physical characteristics such as bulk 15
density, grain size distribution, and grain shape, and performed ring shear tests to 16
determine friction angles and cohesion, and uniaxial compression tests to evaluate 17
the compaction behaviour. Mean grain size of the materials varied between c. 100 18
and 400 µm. Analysis of grain shape factors show that the four different classes of 19
granular materials (14 quartz sands, 5 dyed quartz sands, 4 heavy mineral sands 20
and 3 size fractions of glass beads) can be broadly divided into two groups consist-21
ing of 12 angular and 14 rounded materials. Grain shape has an influence on friction 22
angles, with most angular materials having higher internal friction angles (between 23
c. 35° and 40°) than rounded materials, whereas well-rounded glass beads have the 24
lowest internal friction angles (between c. 25° and 30°). We interpret this as an ef-25

2
fect of intergranular sliding versus rolling. Most angular materials have also higher 26
basal friction angles (tested for a specific foil) than more rounded materials, sug-27
gesting that angular grains scratch and wear the foil., Most materials have an inter-28
nal cohesion in the order of 20-100 Pa except for well-rounded glass beads, which 29
show a trend towards a quasi-cohesionless (C <20 Pa) Coulomb-type material. The 30
uniaxial confined compression tests reveal that rounded grains generally show less 31
compaction than angular grains. We interpret this to be related to the initial packing 32
density after sifting, which is higher for rounded grains than for angular grains. Ring-33
shear test data show that angular grains undergo a longer strain-hardening phase 34
than more rounded materials. This might explain why analogue models consisting of 35
angular grains accommodate deformation in a more distributed manner prior to 36
strain localisation than models consisting of rounded grains. 37
38
39
Introduction 40
41
Experimental simulations of brittle deformation of the earth using scaled analogue 42
models have evolved from a qualitative phenomenological approach towards a more 43
quantitative analysis (Ranalli, 2001). Along with this evolution, the number of differ-44
ent granular materials used in analogue modelling experiments has increased 45
(Mandl et al., 1977; Savage and Sayed, 1984; Krantz, 1991; Cobbold and Castro, 46
1999; Schellart, 2000; Lohrmann et al., 2003; Rossi and Storti, 2003; van Mechelen, 47
2004; Panien et al., 2006; Rosenau et al., 2009; Graveleau et al., 2011; Gomes, 48
2013). Granular materials are commonly used in analogue models for simulating 49
upper crustal deformation. In direct comparisons of scaled analogue experiments to 50
test the reproducibility of model results among different physical modelling laborato-51

3
ries, Schreurs et al. (2006, 2015) showed that differences in model materials induce 52
variations in the geometry and evolution of structures. In order to evaluate to what 53
extent the results of physical modelling in tectonics depend on the properties of the 54
model materials and to allow for meaningful quantitative comparisons of model re-55
sults, it is essential that the physical characteristics and the mechanical behaviour of 56
the materials be determined in a consistent way. 57
Here, we present an analogue material comparison investigating the properties of 58
dry granular materials from physical modelling laboratories worldwide. In this com-59
parison 14 laboratories participated and a total of 26 granular model materials were 60
analysed using standard methods and apparatuses. We determine the physical 61
characteristics (e.g., density, grain size distribution, and grain shape) and perform 62
ring-shear tests and uniaxial confined compression tests to characterise the me-63
chanical behaviour of each of these materials. We then discuss the implications for 64
comparability of the materials among themselves and their suitability for analogue 65
modelling. All ring-shear and uniaxial confined compression tests were performed by 66
the same person to assure as much as possible a repeatable material handling and 67
filling procedure. 68
69
70
2. Materials 71
72
Participating laboratories sent 7 kg of granular material to the Helmholtz Centre 73
Potsdam, German Research Centre for Geosciences (GFZ), where all material tests 74
have been performed. The materials were stored prior to testing for at least one 75
month to acclimatise to the air-conditioned laboratory environment at GFZ. During 76
the measurement periods laboratory temperature and air humidity was 23±2°C and 77

4
45 ± 5%, respectively. Each of the tested materials has been assigned an abbrevia-78
tion with the first three capital letters identifying the laboratory and the last three cap-79
ital letters designating the type of material. 80
The granular materials comprise both natural and artificial materials (Table 1; Fig. 81
1). Natural materials include quartz sands and heavy mineral sands (garnet and zir-82
con sands). Most natural materials are shock heated to eliminate the clay fraction 83
and are sieved to specific grain size distributions by the suppliers. STUSAN and 84
GFZSAN are mixtures of pure quartz sand and a few percent of dyed quartz sand. 85
These "salt'n'pepper" mixtures provide a visual texture that allows monitoring of ana-86
logue model deformation using optical correlation techniques (e.g. Adam et al., 87
2005; 2013). ULISAN is a 1:1 mixture of quartz sand and dyed quartz sand. Artificial 88
materials include corundum sands and glass beads. Brown and white corundum 89
sands consist of aluminium oxides and are produced from reduced melt of high-90
quality bauxite and pure, mineralised clay, respectively. The glass beads are high-91
quality vaporised glass spheres. The 26 tested granular materials comprise 14 92
quartz sands, 5 dyed quartz sands, 4 heavy mineral sands and 3 types of glass 93
beads with different grain size fractions. To distinguish dyed from non-dyed quartz 94
sands, we added “col” (for “coloured”) to the six-letter abbreviation designating the 95
dyed materials. 96
97
98
3. Bulk density, grain size and grain shape 99
100
3.1. Density measurements 101
3.1.1 Measurement method 102

5
The bulk density of each granular material was estimated by measuring the mass of 103
a known volume. Material was sifted from a height of 30 cm at a filling rate of c. 250 104
ml/min into the shear cell of a ring-shear tester (see next section) with known vol-105
ume. Sifting was done using a sieve structure identical to the one described by 106
Schreurs et al. (2016). Excess material was scraped off to achieve a plane surface. 107
108
3.1.2. Results: Density 109
Bulk densities vary between 1.2 and 1.7 for all granular materials, except for the 110
heavy mineral sands, which have densities between 1.8 and 2.8 g/cm3 (Table 2). 111
112
3.2. Grain size and shape 113
3.2.1. Grain size analysis 114
Grain size analysis was performed with a sieve shaker Retsch AS 200 equipped 115
with sieves of 200 mm diameter and six mesh sizes of 63 µm, 125 µm, 224 µm, 355 116
µm, 400 µm, and 630 µm, yielding five constrained and two unconstrained (<63 µm 117
and >630 µm) grain size classes. Shaking time and amplitude was 4 hours and 3 118
mm, respectively. Preliminary tests verified these conditions as being effective in 119
separating the grains in typical sands. From an initial charge of 1 kg the maximum 120
material loss was 5 gram (i.e. 0.5 weight-%). The results of the sieve analysis are 121
presented as grain size distribution curves, in which particle grain size is plotted 122
against cumulative weight percentage (Fig. 2). 123
124
3.2.2. Results: Grain size and sorting 125
The tested granular materials are either fine or medium grained sands, with mean 126
grain size (after Folk and Ward, 1957) ranging between 124 and 410 µm, and grain 127
sorting varying from poorly sorted to very well sorted (Table 2). Most materials show 128

6
a unimodal grain size distribution. The poor sorting of ULISAN col is due to the bi-129
modal size distribution stemming from mixing dyed and non–dyed quartz sand. 130
131
3.2.3 Measurement method: Grain shape 132
We also quantified the shape of grains using SEM images (Fig. 1) and determined 133
aspect ratio (length ratio of long axis versus short axis), PARIS shape factor (Heil-134
bronner and Keulen, 2006) and SH1 shape factor (Panozzo and Hürlimann, 1983), 135
using the public domain software Image SXM (Barrett, 2002). Differences between 136
PARIS and SH1 grain shape factors are related to how they describe the grains. 137
The PARIS shape factor focuses on indentations of the grain circumference with 138
higher values indicating more indented grains, whereas the SH1 shape factor de-139
scribes the deviation from perfect circularity of a grain. The two shape factors are 140
defined as follows: 141
142
PARIS = 2×P −PE( )PE
#
$%
&
'(×100 and SH1= U 2
4πF 143
144
with P = length of original outline, PE = length of outline of convex envelope, U = pe-145
rimeter of grain, and F = area of grain. 146
147
Grain shape and outline were measured and averaged for at least 60 grains of each 148
granular material. 149
150
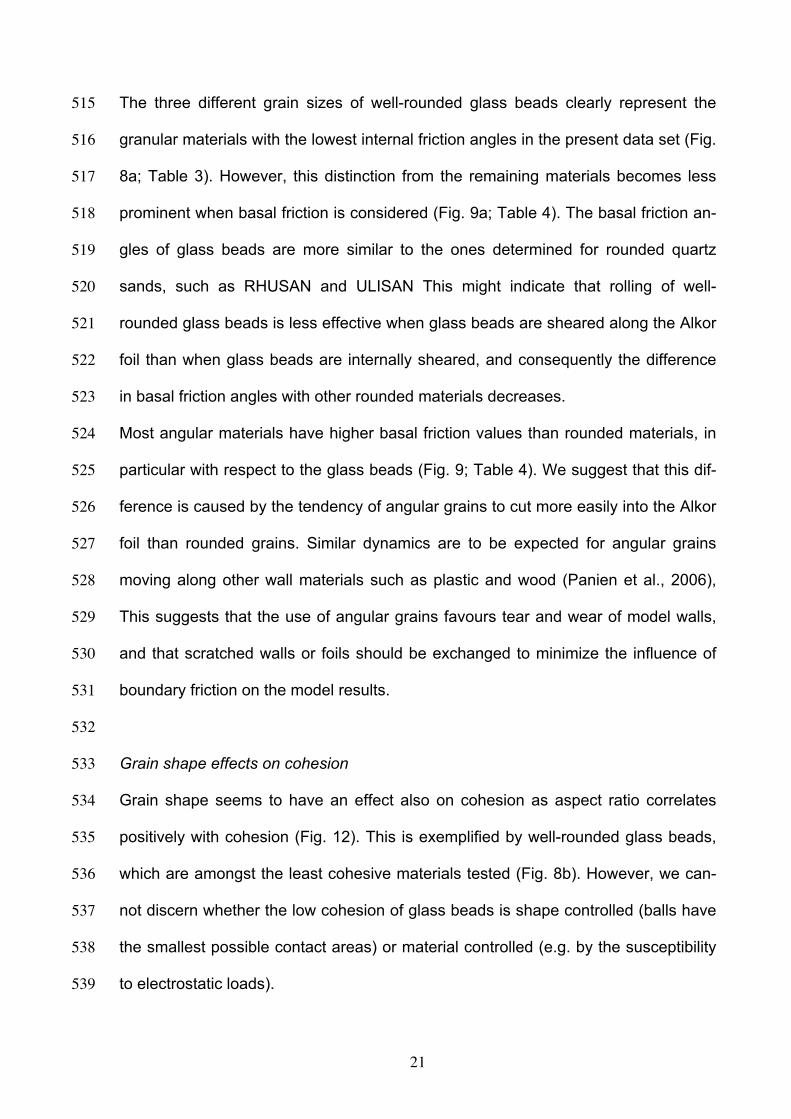
3.2.4 Results: Grain shape 151
The aspect ratio of the tested granular materials varies between 1.1 and 1.8, the 152
SH1 shape factor ranges from 1.09 to 1.53, and the PARIS shape factor lies be-153

7
tween 1.1 and 6.3 (Table 2; Fig. 3). CASSAN, IFPSAN, KYUSAN, TLWSAN, UB-154
ESAN and UPUSAN quartz sands have a PARIS shape factor higher than 2.5, with 155
the heavy mineral sands GFZGRS, IFPCSB and IFPCSW having the highest values 156
of 5.2, 5.4 and 6.3, respectively. Overall highly indented materials with a Paris factor 157
> 2.5 show more angular grain shapes than materials with a Paris factor < 2.5. 158
Based on the classification of Powers (1953), we distinguish two broad groups of 159
granular materials (Table 2), “angular” ones (12 materials with predominantly 160
subangular, angular or very angular grains), and “rounded” ones (14 materials with 161
predominantly subrounded, rounded or well-rounded grains). Except for RHUSAN 162
col, all dyed sands have a larger SH1 and PARIS shape factor than their non-dyed 163
equivalents. Whereas dyeing leads to an increase in aspect ratio for NTSAN col, 164
UOPSAN col and ULISAN col, it results in a decrease in aspect ratio for RHUSAN 165
col and GFZSAN col. The three different types of glass beads (GFZGLB) have the 166
lowest SH1 (1.09-1.1) and aspect ratio values (1.1-1.2), and low PARIS values (1.7 167
or less), and represent the most rounded grains. PARIS values of 2 or less have 168
been determined for GFZSAN, GFZZCS, NTUSAN, RHUSAN, STUSAN, UCPSAN, 169
ULISAN and UPASAN, but these materials have all somewhat higher SH1 and as-170
pect ratio values than glass beads. 171
172
173
4. Mechanical behaviour 174
175
4.1. Ring-shear test analysis and results 176
4.1.1. Ring shear tester setup 177
The mechanical properties of the granular materials were determined using a Schul-178
ze ring-shear tester (Schulze, 1994; Fig. 4), specially designed to measure friction 179

8
coefficients in loose granular materials accurately at low confining pressures (~0.1 -180
10 kPa) and shear velocities (~0.1 – 10 mm/minute) similar to sandbox experiments 181
(Lohrmann et al., 2003). In this tester, the granular material is sheared either against 182
a fixed basal plate (to measure basal friction) or internally (to measure internal fric-183
tion) at constant normal load and velocity while the shear stress and compaction is 184
measured continuously. In our case we determine the basal friction between a spe-185
cific granular material and a base covered with “Alkor” foil (since 2012 called 186
“RENOLIT”), a transparent self-adhesive foil that is used in the community to reduce 187
friction along boundary walls. Alkor foil has also been used in analogue benchmarks 188
to standardize the boundary conditions in order to test model reproducibility 189
(Schreurs et al., 2006; 2016). The ring-shear tester consists of a 4 cm high annular 190
shear-cell made of stainless steel holding approximately 0.1 and 1 litre of the mate-191
rial in case of basal and internal measurements, respectively. A ring-shaped-lid is 192
placed onto the filled cell. The lid is counterbalanced by a weight and subjected to a 193
normal force in order to control normal load on the sample. While the cell is rotated, 194
the lid is prevented from rotation by two tie rods connected to a crossbeam (Fig. 4). 195
The force necessary to shear the material is measured continuously. To ensure 196
shearing inside the material and prevent slip between the lid and the granular mate-197
rial, the lid has 20 vanes protruding 4 mm into the material. 198
Sidewall friction may reduce the normal stress on the actual shear zone and add to 199
the shear stress (silo effect, see Mourgues and Cobbold, 2003), However, these 200
effects are in the order of a few tens of Pa only in the current setup and below the 201
specified testing conditions (>100 Pa). 202
The physical handling technique used to fill the shear cell is the same as the one 203
used to determine the bulk density, i.e. material was sifted from c. 30 cm into the 204
shear-cell at a filling rate of c. 250 ml/min. Excess material was scraped off carefully 205

9
to avoid additional compaction and to achieve a plane surface before assembling 206
the shear-cell together with the shear-lid onto the ring-shear testing machine. During 207
ring-shear testing, a shear velocity of 3 mm/min is applied. Sampling rate for all 208
measured parameters (shear load, normal load, shear velocity, and lid displace-209
ment) was 50 Hz allowing to accurately detect and if necessary correct for stick-slip 210
behavior. 211
212
213
4.1.2 Qualitative assessment of shear curves 214
A typical evolution of the shear stress is shown in Figure 5. Shear stress rises from 215
zero to a peak level (peak friction; B in Fig. 5) within the first few millimetres of shear 216
(strain hardening phase) before it drops (strain softening phase) and stabilises after 217
formation of a shear zone (sliding phase) in the material or at the interface between 218
the material and the Alkor foil (dynamic friction; C in Fig. 5). Subsequently the 219
movement of the shear-cell is reversed for a short duration while the normal load is 220
kept constant. Once the shear stress has dropped to zero, the original shear-cell ro-221
tation is resumed. Renewed shearing results in a second, similar shear curve whose 222
peak (reactivation friction; D in Fig. 5) is somewhat lower than the first peak. From 223
these curves, three values of friction strengths at the first peak, reactivation peak 224
and on the plateaus are picked manually and assigned peak, reactivation and dy-225
namic friction strength for the applied normal load, respectively. For each granular 226
material, the three values of friction strengths are determined for five different nor-227
mal loads varying between c. 430 and 2150 Pa. Each normal load step is repeated 228
three times, resulting in a total of 15 measurements for each material. 229
The strain-hardening phase before the first peak strength (AB in Fig. 5) is followed 230
by a strain-softening phase (BC in Fig. 5) until dynamic strength is reached. 231

10
Lohrmann et al. (2003) show that deformation leading to shear zone formation is as-232
sociated with a sample compaction-decompaction cycle as inferred from volume 233
changes concurrent with the shear stress evolution. The shape of the curve during 234
strain hardening varies for different granular materials and reflects diffuse defor-235
mation before the onset of strain localisation. 236
Fig. 6 shows the shear stress vs. displacement (i.e. the amount of shear strain) 237
curves of an angular granular material (IFPCSW) and well-rounded glass beads 238
(GFZGLB 100-200 µm) for three different normal loads. A comparison of the curves 239
of the two materials at identical normal loads reveals significant differences in the 240
shape of the curves. IFPCSW requires more shear stress to form a shear zone (i.e, 241
it has a higher peak strength) and undergoes more plastic strain prior to failure at 242
peak strength (i.e. has a wider peak) than GFZGLB 100-200 µm. Thus the angular 243
IFPCSW experiences more diffuse deformation prior to shear zone formation than 244
the well-rounded glass beads. The curves after renewed shearing show a similar 245
behaviour, indicating that also prior to shear zone reactivation IFPCSW undergoes 246
more diffuse deformation than the GFZGLB 100-200 µm glass beads. 247
248
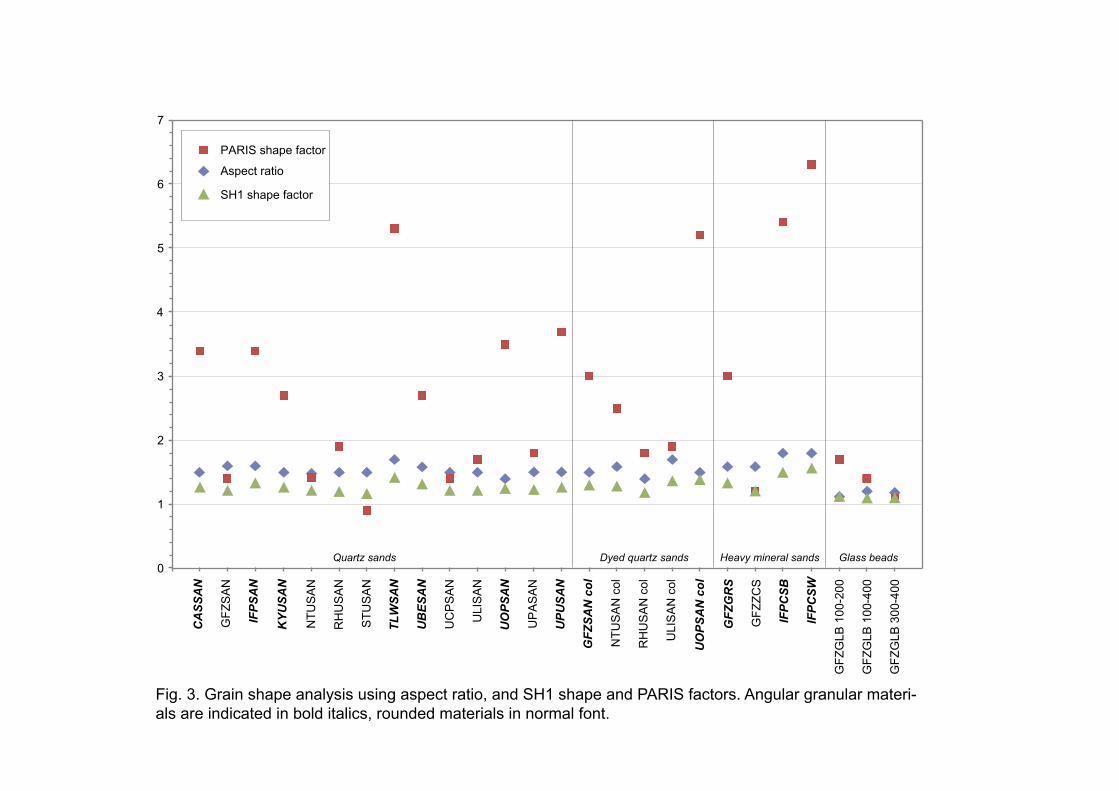
4.1.3 Quantitative analysis of failure envelopes: friction coefficients and cohesion 249
We compare two analysis methods to derive friction coefficients and cohesion, and 250
their variability (Fig. 7). We first applied a linear regression of all the normal load vs. 251
shear strength data pairs together (15 data points). This approximates the ideal lin-252
ear failure envelope in the Mohr stress diagram (Fig. 7a). The slope of the line yields 253
the friction coefficient (µ) and the intercept at zero normal stress gives the cohesion 254
(C). 255
Because the failure envelopes for granular materials might be non-linear at low 256
normal stresses, i.e. convex (e.g. Schellart, 2000), we introduce an alternative 257

11
method for deriving friction coefficients and cohesion, which is more sensitive to po-258
tential non-linear relationships. This method relies on calculating all possible two 259
point slopes and intercepts for mutually combined pairs of a data set (90 data 260
points) These data are then evaluated through univariate statistics by means of cal-261
culating mean and standard deviation and comparing the probability density function 262
to that of a normal distribution (Fig. 7b). Usually the peaks of the experimental prob-263
ability density function are close to or narrower than a normal distribution. This sug-264
gests that the calculated standard deviation is a conservative value for variability 265
compared to the very small, and likely not representative variability resulting from 266
applying a linear regression to the whole data set at once. 267
For the datasets presented here, we found no significant differences between the 268
two analysis methods, indicating linear failure envelopes for all granular materials for 269
normal stresses in the range from 430 to 2150 Pa. The values determined are given 270
in Tables 3 and 4. From the friction coefficients, we derive the friction angles, which 271
correspond to tan-1µ (Fig. 8 and 9; Table 3 and 4). 272
273
Results: Internal friction angles and internal cohesion 274
For all but two granular materials the angle of internal peak friction is systematically 275
higher than the angle of internal reactivation friction by 1-8°, while the angle of inter-276
nal reactivation friction is in turn 3-10° higher than the angle of internal dynamic fric-277
tion (Fig. 8a). The two exceptions are the dyed sands NTUSAN col and UOPSAN 278
col. Internal peak friction angles vary between 33° and 39° for quartz sands, be-279
tween 31° and 40° for dyed quartz sands, and between 35° and 37° for heavy min-280
eral sands. Glass beads have the lowest angles of internal peak friction varying be-281
tween 26° and 30°. 282

12
Internal reactivation friction and internal dynamic friction angles for all materials 283
range from 24° to 36° and from 22 to 35°, respectively, with glass beads having 284
once again the lowest angles, ranging from 24° to 26° and from 22° to 24°, respec-285
tively (Fig. 8a). For the three types of glass beads, the internal friction angle in-286
creases with mean grain size. 287
Extrapolated cohesion values vary considerably, ranging from 1 to 134 Pa at internal 288
peak friction, from 25 to 119 Pa at internal reactivation friction, and from 26 to 107 at 289
internal dynamic friction (Fig. 8b). The standard deviation is in most cases higher 290
than the cohesion value itself, suggesting that the cohesion values should be con-291
sidered as “very approximate”. For 18 out of 26 materials, the internal cohesion is 292
highest at reactivation friction. Also for 18 out of 26 materials, cohesion is lowest at 293
internal peak friction, with all three types of glass beads and four quartz sands, IFP-294
SAN, KYUSAN, NTUSAN and UBESAN having values below 25 Pa. 295
296
Results: Basal friction angles and basal cohesion 297
The basal friction angles of granular materials on Alkor foil show similar systematics 298
as for the internal friction angles, i.e. the basal peak friction angle of a specific mate-299
rial is higher than its basal reactivation friction angle, which in turn is higher than the 300
basal dynamic friction angle (Fig. 9a). Exceptions are RHUSAN, ULISAN, and the 301
dyed NTUSAN col, ULISAN col and UOPSAN col. All but five materials have basal 302
peak friction angles between 18° and 26°, with only RHUSAN, ULISAN, ULISAN col 303
and the three glass beads having basal peak friction angles below 17°. For quartz 304
sands the angles of basal peak friction, basal reactivation friction and basal dynamic 305
friction vary between 15°- 22°, 11° - 20°, and 12° - 19°, respectively; for dyed quartz 306
sands between 16° - 22°, 14° - 25°, and 13° – 19°, respectively; for heavy mineral 307

13
sands between 25° - 26°, 23° - 25°, and 22 - 25°, respectively, and for glass beads 308
between 14° - 17°, 12° - 15°, and 12 – 15°, respectively. 309
Inferred basal cohesion values are overall higher than the internal cohesion values, 310
with nearly all materials having a cohesion higher than 100 Pa (Fig. 9b). Exceptions 311
are the three glass beads and the dyed UOPSAN col, which have cohesion values 312
below 100 Pa. In 11 out of 26 materials cohesion is lowest at basal peak friction, 313
and in 16 out of 26 materials cohesion is largest at basal reactivation friction. 314
315
316
4.2. Uniaxial confined compression test analysis and results 317
318
4.2.1. Uniaxial tester setup 319
We performed uniaxial confined compression tests in order to get proxies for the 320
compaction behaviour and the elasticity of the granular materials. The uniaxial con-321
fined compression tester comprises a steel jar (80 mm in diameter, 85 mm in 322
height), in which sample material is compressed uniaxially via a servo-controlled pis-323
ton in the vertical direction. The filling procedure is identical to the one used for the 324
ring-shear tester. The jar is stiff enough (10 mm thick steel walls) to prevent the 325
sample from deforming laterally and its inner walls are polished in order to minimize 326
sidewall friction. Uniaxial shortening was applied at a rate of 5 x 10⁻⁷ s-1 until maxi-327
mum loading at 2000 kPa is reached, followed by unloading at the same rate. Uniax-328
ial compression in the vertical direction was measured at a frequency of 20 Hz using 329
a stress sensor with a resolution of c. 100 Pa. A complete compression test encom-330
passed 50 loading-unloading cycles. 331
332
333

14
4.2.2 Qualitative assessment of uniaxial stress-strain curves 334
All stress-strain curves derived from the uniaxial tester were non-linear and involved 335
small amounts of initial settling of machine parts, followed by permanent and elastic 336
strains during loading and unloading. The first loading-unloading cycles (Fig. 10) 337
were strongly concave upward and mainly caused compaction of the bulk volume 338
with more than 50% of the total strain in this cycle (typically 0.1 – 1%) not recovered 339
after unloading. Until the last of the 50 loading-unloading cycles, the non-linearity of 340
the stress-strain curves decreases exponentially (not shown here) with compaction 341
of the bulk volume decreasing to less than 10% of the total strain in the last cycle. 342
Thus, the stress-strain curves derived during early cycles reflect mainly the process 343
of compaction, whereas the stress-strain curves derived during late cycles converge 344
towards the elastic behaviour of the bulk sample material. 345
346
4.2.3 Semi-quantitative analysis of compaction behaviour and elasticity 347
As a measure of compaction we report the total compaction after the 50th loading 348
cycle ,Ct, and a compaction index Ci using the following equation: 349
350
Ci = eps1 / eps50 351
352
with eps1 and eps50 indicating the non-recoverable strain after the first and fiftieth 353
loading cycle, respectively. Ct represents the relative amount of compaction gained 354
in the first loading cycle and therefore scales with the ability of the material to com-355
pact. Although the maximum load (2000 kPa) and the number of loading cycles (50) 356
far exceed typical analogue modelling experimental conditions, this method provides 357
a quantitative measure of the compaction behaviour of the material, which should 358
correlate with diffuse deformation observed in sandbox experiments. 359

15
360
As outlined above the sample response to uniaxial strain converges towards elastic 361
behaviour after 50 loading-unloading cycles. To get a quantitative measure of the 362
elastic behaviour, we use the slope of the 50th loading curve fitted by a line (Fig. 10). 363
As the slope of the line relates applied stress to strain and has the unit of stress, it is 364
an elastic modulus. It can be described as the axial stress-strain ratio at zero lateral 365
strain K0. In the further text we refer to this parameter as the elastic modulus K0. 366
367
Based on multiple iterations of compression tests on GFZSAN and UBESAN a pre-368
cision of 0.2% and 7% has been assigned to total compaction and compaction index 369
measurements, respectively, and a precision of 10% to K0 measurements. Since 370
compaction and sidewall friction take up part of the applied stresses in all cycles, 371
however, the inaccuracy of K0 measurements may be as high as 30%. 372
373
Results: Compaction and elasticity 374
Total compaction, Ct, varies from 0.6% to 6.9% in the samples (Fig. 11, Table 5), 375
with angular materials showing a tendency for higher Ct values than rounded mate-376
rials. Glass beads and rounded, non-dyed quartz sands have Ct values between 0.6 377
and 1.4%. Dyed quartz sands compact more than their non-dyed equivalents with 378
total compaction values ranging from 1.4 to 6.9% (Table 5) 379
The relative compaction index, Ci, ranges between 32% and 65%, indicating that in-380
dependent of total compaction, all materials initially compact in a rather similar way 381
with 1/3 to 2/3 of the total compaction occurring in the first cycle. 382
K0 for all materials ranges from 639 to 1829 MPa, which is about 1-2 orders of mag-383
nitude lower than the elastic moduli (e.g. G, K,…) of the respective mineral or rock 384
framework they would constitute (e.g. 10-100 GPa for sandstone). There is an over-385

16
all increase of K0 with increasing bulk density (Table 5; Fig. 11), with heavy mineral 386
sands GFZGRS, GFZZCS and IFPCSB having the highest values. 387
388
389
5. Discussion 390
391
5.1 Comparison of ring-shear test results with previously published data 392
393
5.1.1 Limits of comparability 394
A direct comparison of our ring-shear test results with previously published data is 395
hindered by the fact that past studies partly applied different test procedures and 396
partly used different handling and filling techniques (Mandl et al., 1977; Krantz, 397
1991; Schellart, 2000; Lohrmann et al., 2003; Panien et al., 2006; Gomes, 2013). 398
399
Test procedures used 400
Krantz (1991), Schellart (2000), and Lohrman et al. (2003) used a Hubbert-type 401
shear-box (Hubbert, 1951), but the design of these shear-boxes varied considerably. 402
Krantz (1991) and Schellart (2000) moved a hanging ring above a stationary ring to 403
initiate a shear zone, whereas Lohrmann et al. (2003) used a box on wheels, pro-404
voking additional friction by resistance to rolling of the wheels or by rolling of the 405
wheels over sand grains. 406
407
Handling techniques 408
Krantz (1991) demonstrated that the physical handling technique used to fill the 409
shear cell has a large influence on material density and on the mechanical proper-410
ties, notably on the friction angles. Pouring of dry quartz sand in the shear cell re-411

17
sulted in a lower density (1.53 g/cm3) than sifting of the same quartz sand (1.75 412
g/cm3), and shear tests revealed that internal peak friction angles increased with in-413
creasing density (Krantz, 1991). Lohrmann et al. (2003) arrived at similar conclu-414
sions showing that internal peak friction angles for dry poured sands were between 415
4° and 12° lower than for dry sifted sands, with fine-grained sands showing larger 416
differences than coarse-grained sands. 417
Ring-shear tests by Lohrmann et al. (2003), Panien et al. (2006) and Gomes (2013) 418
confirmed the difference in rheological behaviour between sifted and poured sands. 419
Gomes (2013) suggested that the two filling techniques also produce differences in 420
cohesion, with values of cohesion at internal peak strength for poured quartz sands 421
more than twice as high (c. 110-140 Pa) as those for sifted quartz sands. However, 422
in tests by Krantz (1991) and Lohrmann et al. (2003) the differences in cohesion for 423
sifted and poured sands are less clear and in some cases poured sands have lower 424
cohesion values than sifted sands. Gomes (2013) also tested the influence of filling 425
height and only found minimal differences of 1-2° in internal peak friction angles for 426
quartz sands sifted or poured from either 20 or 10 cm height. 427
428
5.1.2. Effect of grain shape 429
The handling technique used by Panien et al. (2006) to fill the ring-shear tester in-430
volved sifting granular materials from a height of 30 cm at a filling rate of c. 200 431
cm3/min corresponds closely to the handling technique used in this study. Tested 432
materials such as quartz sands, corundum sands and glass fragments showed in-433
ternal friction angles comparable to those determined in this study, with angles of 434
internal peak friction, internal reactivation friction and internal dynamic friction rang-435
ing from 36° to 42°, from 33° to 37°, and from 31 to 35°, respectively (Panien et al., 436
2006). Corresponding inferred cohesion values varied between c. 5 and 100 Pa. As 437

18
in our study, ring-shear testing of well-rounded and highly spherical microbeads 438
yielded much lower friction angles with values of 22°, 22° and 21° at internal peak, 439
internal reactivation and internal dynamic friction, respectively (Panien et al., 2006). 440
Schellart (2000), who used a Hubbert-type shear box and poured sand from 10 cm 441
height, found that internal peak friction angles and cohesion are mainly dependent 442
on grain shape (rounding and sphericity) with, for example, well-rounded, highly 443
spherical glass microspheres with grain sizes between 90 and 180 mm having lower 444
cohesion and internal peak friction angles than (sub-) angular quartz sands with 445
identical grain sizes. 446
447
Shear tests on dense quartz sands by Krantz (1991) using a Hubbert-type shear box 448
indicated that internal friction angles for shear zone reactivation are essentially the 449
same as for shear zone initiation (at peak strength), and that shear zone reactivation 450
is accompanied by a significant drop in cohesion (c. 300 Pa). These observations 451
are not in agreement with our ring-shear tests, which show that internal reactivation 452
friction angles are systematically lower than internal peak friction angles, and that 453
cohesion values are generally somewhat higher for shear zone reactivation. These 454
discrepancies are possibly related to differences in test procedure and handling 455
technique. 456
457
458
5.2 Property dependencies of granular materials 459
460
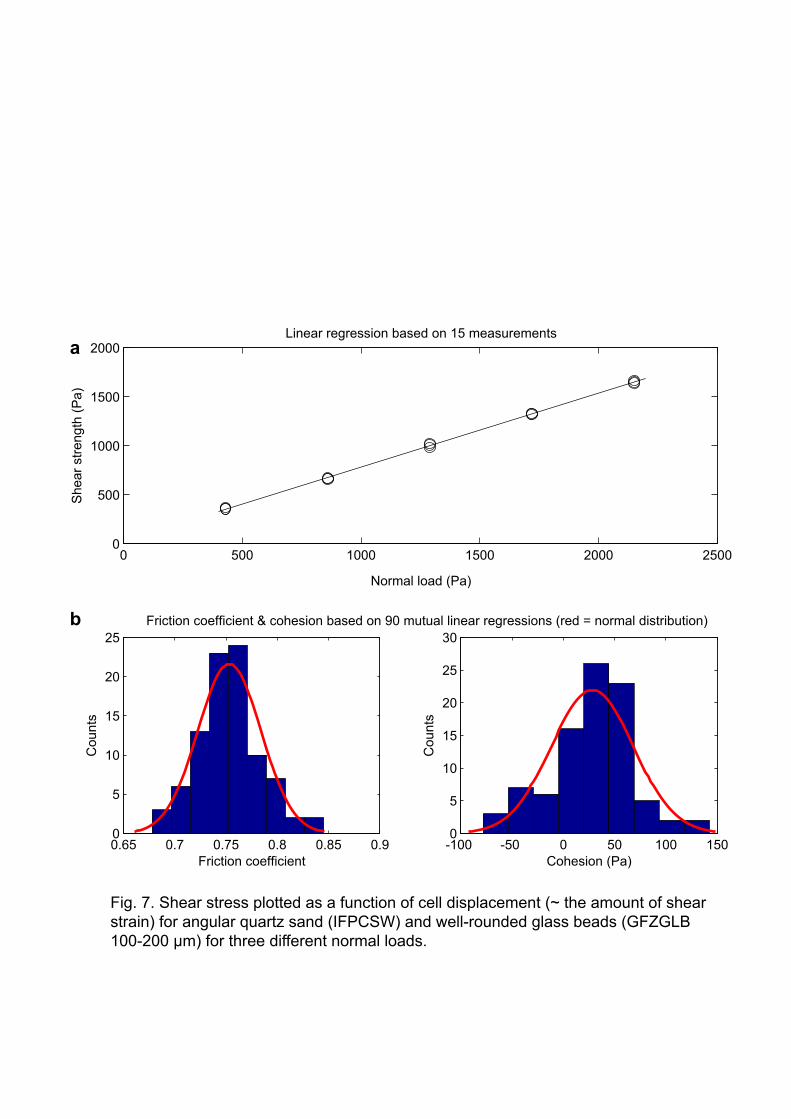
In order to check for interdependencies of granular material properties, we cross-461
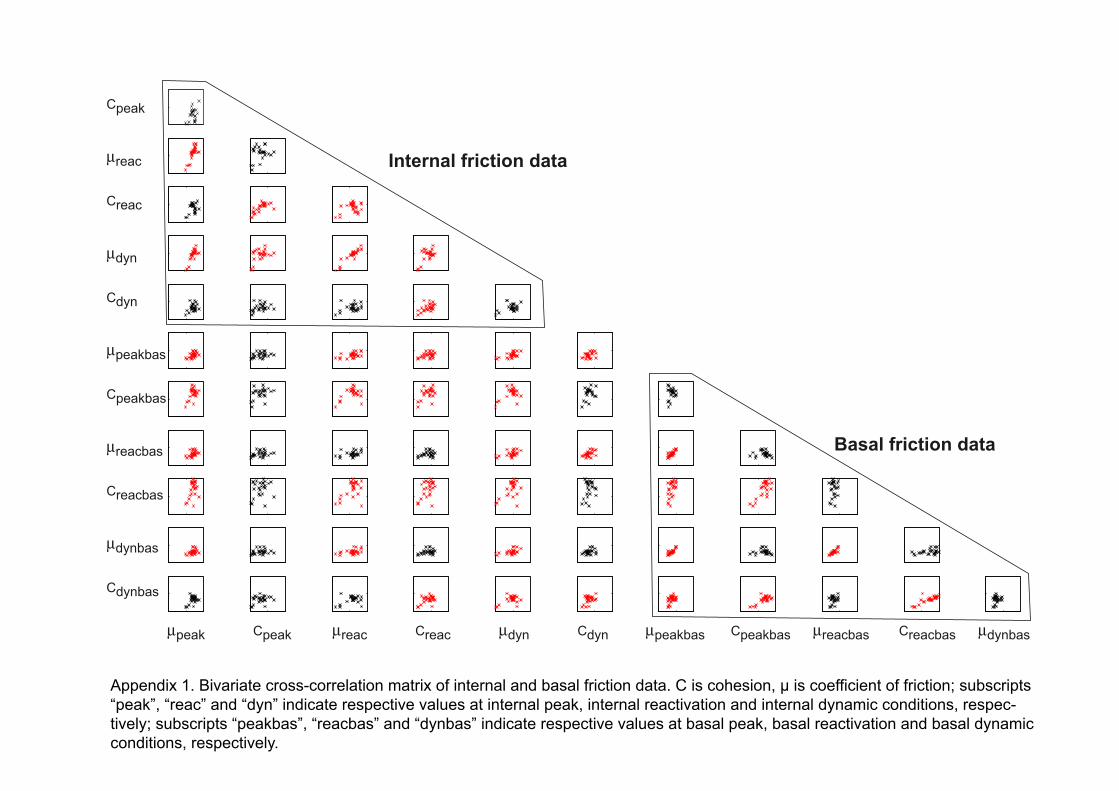
correlated our data. A subset of our data is shown in Fig 12, whereas cross-462
correlation of all ring-shear test data is given in Appendix 1. Points are plotted in red 463

19
if the correlation is significant at the 95% level based on the Pearson correlation co-464
efficient. Apart from correlations within generic groups (i.e. grain shape analysis da-465
ta, uniaxial confined compression test data and ring-shear test data; for the latter 466
see also Appendix 1), relevant and interpretable correlations exist between grain 467
shape parameters and friction coefficients, between total compaction and internal 468
friction coefficients, and between K0 and density. 469
470
5.2.1 Effects of grain shape 471
Grain shape effects on internal friction: rolling vs. sliding 472
Grain shape clearly has an influence on internal friction angles, with angular materi-473
als generally having higher friction angles than rounded materials. Well-rounded 474
glass beads showing the lowest aspect ratios and SH1 shape factors, and rather low 475
PARIS shape factors have the lowest internal friction angles. The lower internal fric-476
tion angle of rounded materials is most likely due to the fact that rounded grains 477
preferentially roll instead of slide against each other (Mair et al., 2003; Desrues and 478
Viggiani, 2004). 479
480
Grain shape effects on compaction behaviour: initial packing density 481
Grain shape also affects the total compaction as observed in the uniaxial confined 482
compression tests with angular grains generally showing more total compaction than 483
rounded grains. The difference in compaction behaviour between the two types of 484
materials is also evident from an analysis of the stress-strain curves derived from 485
the ring-shear tests. Not only do angular materials require more shear stress until 486
failure at peak strength than well-rounded materials, and consequently, angular ma-487
terials will have higher peak friction angles, but they also undergo more plastic strain 488
prior to failure. This indicates that angular materials undergo more diffuse defor-489

20
mation than rounded materials. This diffuse deformation is associated with sample 490
compaction and decompaction (i.e., dilation) during pre-failure deformation. 491
Lohrmann et al. (2003) showed that failure at peak strength corresponds to the max-492
imum decompaction rate. Angular materials will thus initially compact more than 493
rounded grains and hence subsequently need to undergo more decompaction (dila-494
tion) in order for grains to be able to move and slide past each other to form a dila-495
tant shear zone. 496
We speculate that this behaviour is related to the initial packing density of the mate-497
rial after sifting: For identical sifting procedures (i.e. sifting rate and height) rounded 498
grains may arrange more easily into a dense packing while angular grains tend to 499
get stuck in a less preferential configuration. In that way, the effect of grain shape is 500
similar to the effect of handling technique (i.e. sifting vs. pouring). 501
502
Grain shape effects on shear zone reactivation 503
The ease of reactivation of an already existing shear zone also seems to be de-504
pendent on grain shape. Angular granular materials show higher angles of internal 505
reactivation friction than more rounded quartz sands and particularly when com-506
pared to glass beads. Schulze (2008) suggests that decreasing the shear stress to 507
zero after a shear zone has formed, with constant normal load still applied, causes 508
the bulk material to relax enabling slight rearrangements of the grain structure, par-509
ticularly in the shear zone, which has undergone dilation. Thus a reactivation needs 510
to partly re-establish the dilatant zone (i.e. the shear zone), which will require more 511
shear stress for angular grains than for rounded grains. 512
513
Grain shape effects on basal friction: scratching the walls 514
21
The three different grain sizes of well-rounded glass beads clearly represent the 515
granular materials with the lowest internal friction angles in the present data set (Fig. 516
8a; Table 3). However, this distinction from the remaining materials becomes less 517
prominent when basal friction is considered (Fig. 9a; Table 4). The basal friction an-518
gles of glass beads are more similar to the ones determined for rounded quartz 519
sands, such as RHUSAN and ULISAN This might indicate that rolling of well-520
rounded glass beads is less effective when glass beads are sheared along the Alkor 521
foil than when glass beads are internally sheared, and consequently the difference 522
in basal friction angles with other rounded materials decreases. 523
Most angular materials have higher basal friction values than rounded materials, in 524
particular with respect to the glass beads (Fig. 9; Table 4). We suggest that this dif-525
ference is caused by the tendency of angular grains to cut more easily into the Alkor 526
foil than rounded grains. Similar dynamics are to be expected for angular grains 527
moving along other wall materials such as plastic and wood (Panien et al., 2006), 528
This suggests that the use of angular grains favours tear and wear of model walls, 529
and that scratched walls or foils should be exchanged to minimize the influence of 530
boundary friction on the model results. 531
532
Grain shape effects on cohesion 533
Grain shape seems to have an effect also on cohesion as aspect ratio correlates 534
positively with cohesion (Fig. 12). This is exemplified by well-rounded glass beads, 535
which are amongst the least cohesive materials tested (Fig. 8b). However, we can-536
not discern whether the low cohesion of glass beads is shape controlled (balls have 537
the smallest possible contact areas) or material controlled (e.g. by the susceptibility 538
to electrostatic loads). 539

22
For each granular material, except UPOSAN col, basal cohesion values at peak, re-540
activation and dynamic friction are systematically higher than the corresponding in-541
ternal cohesion values, suggesting an influence of the Alkor foil on cohesion. 542
Internal and basal cohesion values are nearly always higher for shear zone reactiva-543
tion than for shear zone initiation at peak strength (Fig. 8b, 9b). The difference can 544
be explained by the ring-shear test procedure. Before renewed shearing is applied 545
to determine reactivation strength, the shear stress is reduced to zero. It can be ex-546
pected that during this relaxation phase, grains move closer together and the grain 547
contact area increases, resulting in an increase in cohesion in the shear zone espe-548
cially if grain size is heterogeneous. As the required shear stress to achieve reacti-549
vation strength is less than for peak strength, comparatively less decompaction will 550
occur resulting in a higher residual cohesion at reactivation strength. 551
552
5.2.2 Effects of dyeing 553
Dyeing a granular material changes its physical properties, generally decreasing its 554
bulk density and sorting, and changing the shape of the grains, resulting in higher 555
aspect ratios, SH1 and PARIS factors. However, the influence of dyeing on the me-556
chanical behaviour is difficult to assess. For some sands dyeing results in higher in-557
ternal friction angles, for other sands in lower internal friction angles. Similarly, some 558
sands show a higher cohesion after dyeing, others a lower cohesion. The non-559
systematic changes in mechanical behaviour might be related to differences in the 560
nature of the dyeing material and the applied dyeing procedure. 561
562
5.2.3 Role of material stiffness 563
The observed dependency of K0 on density relates to a common specific modulus, 564
i.e. a constant ratio of K0 and density, of the materials tested. Since all materials are 565

23
composed of grains of minerals, the existence of such a common specific modulus 566
seems intuitively straightforward. The high stiffness of the bulk materials tested indi-567
cates that elastic strain under typical experimental conditions is generally small (na-568
nometer scale deformation) and below the detection threshold of state-of-the-art 569
monitoring techniques (e.g. particle interference velocimetry measurement sys-570
tems). Any observable (> micrometer scale) distributed deformation in sandbox 571
models therefore can be attributed to diffuse plastic strain and associated compac-572
tion/decompaction. 573
574
575
Conclusions 576
577
We tested 26 granular analogue materials from 14 analogue modelling laboratories. 578
We determined physical characteristics, such as density, grain shape and grain size 579
distribution, as well as mechanical properties including, internal and basal friction 580
angles, cohesion, elasticity and compaction behaviour. It is emphasised that all me-581
chanical tests were done by the same person at constant air conditioned laboratory 582
conditions (23°C and 45% relative humidity). For all mechanical tests we used a 583
specific handling technique (sifting from 20 cm height at a rate of 250 ml/min). From 584
a comparison of the tested granular materials, the following conclusions can be 585
drawn: 586
587
1. Grain shape has an influence on friction angles, with angular materials gen-588
erally having higher internal peak friction angles (between c. 35° and 40°) 589
than more rounded materials, with well-rounded glass beads having the low-590

24
est internal friction angles (between 25° and 30°). This effect can be attribut-591
ed to the ability of rounded grains to roll instead of to slide. 592
2. The effect of mean grain size and grain size distribution on friction angles is 593
difficult to assess. When considering quartz sands and heavy mineral sands, 594
there seems to be no clear relationship between mean grain size and friction 595
angle. The three size fractions of glass beads show an increase in internal 596
friction angles with increasing mean grain size. 597
3. Most angular materials also have higher basal friction angles than more 598
rounded quartz sands and glass beads, suggesting that angular grains 599
scratch and wear the Alkor foil more easily than rounded grains. 600
4. Angular materials mostly show higher angles of internal reactivation friction 601
than rounded materials, particulary when compared to glass beads. 602
5. In the ring-shear tests angular materials show a longer strain hardening 603
phase than more rounded materials indicating that the former ones undergo 604
more diffuse deformation, i.e. more compaction and decompaction prior to 605
shear zone formation. Such a shape effect on compaction is also evident 606
from uniaxial compaction tests and can be related to the less dense packing 607
of sifted angular materials compared to sifted round materials. 608
6. Dyeing granular materials influences the mechanical properties, but affects 609
internal and basal friction angles, as well as cohesion in a non-systematic 610
way. 611
7. Although inferred cohesion values have large uncertainties and scatter wide-612
ly, most non-dyed granular materials have an internal cohesion between 20 613
and 100 Pa. The fact that well-rounded glass beads have lower internal co-614
hesion values and trend towards a near cohesionless Coulomb behaviour at 615
peak friction indicates that grain shape also has an influence on cohesion. 616

25
This effect might be related to smaller contact areas of round grains com-617
pared to angular grains and/or their susceptibility to electrostatic loads. 618
8. Basal cohesion values of the granular materials on Alkor foil are systematical-619
ly higher than internal cohesion values, suggesting an effect of the foil on co-620
hesion. 621
9. Values of internal and basal cohesion at shear zone reactivation are nearly 622
always higher than internal and basal cohesion at shear zone formation (peak 623
friction). 624
10. Elastic deformation of materials tested here is at the nanoscale and is not 625
observable with current monitoring techniques. 626
627
628
629
630
Acknowledgments 631
Funding by Swiss National Foundation (SNF No 200020-122143 and No 200020-632
109320) is gratefully acknowledged. We thank all participating laboratories for send-633
ing samples of their granular materials, Rüdiger Kilian for discussions on grain 634
shape analysis, and Vincent Strak and an anonymous reviewer for helpful com-635
ments and suggestions on an earlier version of this paper. 636
637
References 638
Adam, J., Urai, J., Wienecke, B., Oncken, O., Pfeiffer, K., Kukowski, N., Lohrmann, J., Hoth, 639
S., Van Der Zee, W., Schmatz, J., 2005. Shear zone formation and strain distribution in 640
granular materials – new insights employing high-resolution optical image correlation. Jour-641
nal of Structural Geology 27, 283-301. 642

26
643
Adam, J., Klinkmüller, M., Schreurs, G., Wieneke, B. 2013. Quantitative 3D strain analysis in 644
analogue experiments simulating tectonic deformation: Integration of X-ray computed to-645
mography and digital volume correlation techniques. Journal of Structural Geology 55, 127-646
149. 647
648
Barrett, S.D., 2002. Software for Scanning Microscopy. Proceedings of the Royal Micro-649
scopical Society 37/3, 167-174. 650
651
Cobbold, P.R. and Castro, L. 1999. Fluid pressure and effective stress in sandbox models. 652
Tectonophysics 301, 1-19. 653
654
Desrues, J., Viggiani, G., 2004. Strain localization in sand: an overview of the experimental 655
results obtain in Grenoble using stereophotogrammetry. International Journal for Numerical 656
and Analytical Methods in Geomechanics 28, 279-321. 657
658
Folk, R.L., Ward, W.C., 1957. Brazos river bar: a study in the significance of grain size pa-659
rameters. Journal of Sedimentary Petrology 27 (1), 3-26. 660
661
Forsyth, A.J., Hutton, S., Rhodes, M.J., 2002. Effect of cohesive interparticle force on the 662
flow characteristics of granular material. Powder Technology 126 (2), 150–154. 663
664
Gomes, C.J.S. 2013. Investigating new materials in the context of analog-physical models. 665
Journal of Structural Geology 46, 158-166. 666
667
Graveleau, F., Hurtrez, J.-E., Dominguez, S., and Malavieille, J. 2011. A new experimental 668
material for modelling relief dynamics and interaction between tectonics and surface pro-669
cesses. Tectonophysics 513, 68-87. 670

27
671
Heilbronner, R., Keulen, N., 2006. Grain size and grain shape analysis of fault rocks. Tecto-672
nophysics 427, 199-216. 673
674
Hubbert, M. K., 1951. Mechanical basis for certain familiar geologic structures. Geological 675
Society of America Bulletin 62, 1259-1273. 676
677
Krantz, R.W., 1991. Measurements of friction coefficients and cohesion for faulting and fault 678
reactivation in laboratory models using sand and sand mixtures. Tectonophysics 188, 203-679
207 680
681
Lohrmann, J., Kukowski, N., Adam, J., Oncken, O., 2003. The impact of analogue material 682
properties on the geometry, kinematics and dynamics of convergent sand wedges. Journal 683
of Structural Geology 25, 1961-1711. 684
685
Mair, K., Frye, K.M., Marone, C., 2002. Influence of grain characteristics on the friction of 686
granular shear zones. Journal of Geophysical Research 107 (B10), 4/1-4/9. 687
688
Mandl, G., de Jong, L.N.J., Maltha, A., 1977. Shear zones in granular material. Rock Me-689
chanics 9, 95-144. 690
691
Mechelen, J.L.M. van, 2004. Strength of moist sand controlled by surface tension for tecton-692
ic analogue modelling. Tectonophysics 384, 275-284. 693
694
Mourgues, R., Cobbold, P.R., 2003. Some tectonic consequences of fluid overpressures 695
and seepage forces as demonstrated by sandbox modelling. Tectonophysics, 376, 75-97. 696
697

28
Panien, M., Schreurs, G., Pfiffner, A., 2006. Mechanical behaviour of granular materials 698
used in analogue modelling: insights from grain characterisation, ring-shear tests and ana-699
logue experiments. Journal of Structural Geology 28, 1710-1724. 700
701
Panozzo, R., Hürlimann, H., 1983. A simple method for the quantitative discrimination of 702
convex and convex-concave lines. Microscopica Acta 87 (2), 169-176. 703
704
Powers, M.C. 1953. A new roundness scale for sedimentary particles. Journal of Sedimen-705
tary Petrology 23, 117-119. 706
707
Ranalli, G., 2001. Experimental tectonics: from Sir James Hall to the present. Journal of 708
Geodynamics 32(1-2), 65-76. 709
710
Rosenau, M., Lohrmann, J., and Onno O., 2009. Shocks in a box: An analogue model of 711
subduction earthquake cycles with application to seismotectonic forearc evolution. Journal 712
of Geophysical Research 114, B01409. 713
714
Rossi, D. and Storti, F. 2003. New artificial granular materials for analogue laboratory exper-715
iments: aluminum and siliceous microspheres. Journal of Structural Geology 25, 1893-1899. 716
717
Savage, S.B., Sayed M., 1984. Stresses developed by dry cohesionless granular materials 718
sheared in an annular shear cell. Journal of Fluid Mechanics 142, 391-430. 719
720
Schellart, W.P., 2000. Shear test results for cohesion and friction coefficients for different 721
granular materials: scaling implications for their usage in analogue modelling. Tectonophys-722
ics 324, 1-16. 723
724

29
Schreurs, G., Buiter, S.J.H., Boutelier. J., Burberry, C., Callot, J.-P., Cavozzi, C., Cerca, M., Chen, J.-725
H., Cristallini, E., Cruden, A.R., Cruz, L., Daniel, J.-M., Da Poian, G., Garcia, V.H., Gomes, C.J.S., 726
Grall, C., Guillot, Y., Guzmán, C., Hidayah, T.N., Hilley, G., Klinkmüller, M., Koyi, H.A., Lu, C.-Y., 727
Maillot, B., Meriaux, C., Nilfouroushan, F., Pan, C.-C., Pillot, D., Portillo, R., Rosenau, M., Schellart, 728
W.P., Schlische, R.W., Take, A., Vendeville, B., Vergnaud, M. Vettori, M., Wang, S.-H., Withjack, 729
M.O., Yagupsky, D., Yamada, Y. 2016. Benchmarking analogue models of brittle thrust wedges. 730
Journal of Structural Geology, in revision. 731
732
Schreurs, G., Buiter, S.J.H., Boutelier, D., Corti, G., Costa, E., Cruden, A., Daniel, J.-M., 733
Hoth, S., Koyi, H., Kukowski, N., Lohrmann, J., Ravaglia, A., Schlische, R.W., Withjack, 734
M.O., Yamada, Y., Cavozzi, C., DelVentisette, C., Elder Brady, J., Hoffmann-Rothe, A., 735
Mengus, J.-M., Montanari, D., Nilforoushan, F., 2006. Analogue benchmarks of shortening 736
and extension experiments. In: Buiter, S.J.H., Schreurs, G. (Eds), Analogue and Numerical 737
Modelling of Crustal-Scale Processes. Geological Society, London, Special Publication 253, 738
1-27. 739
740
Schulze, D., 1994. Entwicklung und Anwendung eines neuartigen Ringschergerätes. Auf-741
bereitungstechnik 35 (10), 524-535. 742
743
Schulze, D., 2008. Pulver und Schüttgüter – Fließeigenschaften und Handhabung. Springer 744
Berlin. 745
746
Figures 747
Fig. 1. SEM photographs of tested granular materials. Length of white scale bar in each 748
photograph is 500 µm. 749
750
Fig. 2. Grain size classes plotted against cumulative weight. 751
752

30
Fig. 3. Grain shape analysis using aspect ratio, and SH1 shape and PARIS factors. Angular 753
granular materials are indicated in bold italics, rounded materials in normal font. 754
755
Fig. 4. Ring-shear tester (after Schulze, 1994). 756
757
Fig. 5. Example of shear stress curves at different normal loads, AB = strain hardening part 758
of curve, BC = strain softening part of curve, B = peak strength, C = dynamic strength, and 759
D = reactivation strength. 760
761
Fig. 6. Shear stress plotted as a function of cell displacement (~ the amount of shear strain) 762
for angular quartz sand (IFPCSW) and well-rounded glass beads (GFZGLB 100-200 µm) for 763
three different normal loads. 764
765
Fig. 7. Example of ring-shear test data analysis (UBESAN, internal) (a) Linear regression 766
analysis of shear strength vs normal load data pairs (15 data). (b) Histograms of friction co-767
efficients and cohesion derived from mutual two-point regression analysis (90 data). 768
769
Fig. 8. Internal friction angles and cohesion values (a) Angles of internal peak friction, inter-770
nal reactivation friction and internal dynamic friction. (b) Extrapolated cohesion values at 771
internal peak friction, internal reactivation friction and internal dynamic friction. Angular 772
granular materials are indicated in bold italics, rounded materials in normal font. 773
774
Fig. 9. Basal friction angles and cohesion values (a) Angles of basal peak friction, basal re-775
activation friction and basal dynamic friction. (b) Extrapolated cohesion values at basal peak 776
friction, basal reactivation friction and basal dynamic friction. Angular granular materials are 777
indicated in bold italics, rounded materials in normal font. 778
779

31
Fig. 10. Uniaxial confined compression test after the first and 50th cycle. First loading – un-780
loading cycle is dominated by compaction; later cycles represent more elastic behaviour. 781
The elastic modulus, K0, is determined at the 50th cycle along loading path (dashed line). 782
783
Fig. 11. Values of bulk density, compaction index (left scale), total compaction and elastic 784
modulus, K0, (right scale). Angular granular materials are indicated in bold italics, rounded 785
materials in normal font. 786
787
Fig. 12. Bivariate cross-correlation matrix of selected data. Points are plotted in red if the 788
correlation is significant at the 95% level based on Pearson correlation coefficient. Apart 789
from correlations within generic groups (shape and grain size analysis, uniaxial confined 790
compression tests and ring shear test data), relevant and interpretable correlations exist be-791
tween shape parameters and friction parameters as well as between K0 with density and 792
total compaction with internal friction. C is cohesion, Ci is compaction index, Ct is total com-793
paction, K0 is the elastic modulus, µ is coefficient of friction with subscripts “peak”, “dyn” and 794
dynbas” indicating coefficients of peak internal friction, dynamic internal friction and dynamic 795
basal friction, respectively. 796
797
798
Tables 799
800
Table 1. Overview of tested granular materials with details on origin, composition and suppli-801
er. First three capital letters in third column identify the participating institute: CAS = Czech 802
Academy of Sciences, GFZ = German Research Centre for Geosciences, IFP = IFP Ener-803
gies nouvelles, KYU = Kyoto University, NTU = National Taiwan University, RHU = Royal 804
Holloway University, STU = Stanford University, TLW = TecLab Wroclaw, UBE = University 805
of Bern, UCP = Université de Cergy Pontoise, ULI = Université Lille, UOP = Universidade 806
Federal de Ouro Preto, UPA = Università degli studi di Parma, UPU = Uppsala University, 807

32
UTO = University of Toronto. Last three capital letters in third column identify the type of 808
granular material: CSB = corundum sand brown, CSW = corundum sand white, GLB = Glass 809
beads, GRS = garnet sand, SAN = quartz sand, ZCS = zircon sand. 810
811
Table 2. Physical characteristics of tested granular materials. Note that the mean grain size 812
of GFLGLB 300-400 mm is larger than the maximum grain size indicated by the supplier. P = 813
poorly sorted, M = moderately sorted, MW = moderately to well sorted, W = well sorted, VW 814
= very well sorted. 815
816
Table 3. Internal friction coefficients, internal friction angles and cohesion values. Internal 817
friction angles are rounded to the nearest integer. Angular granular materials are indicated in 818
bold italics, round materials in normal font. 819
820
821
Table 4. Basal friction coefficients, basal friction angles and cohesion values. Basal friction 822
angles are rounded to the nearest integer. Angular granular materials are indicated in bold 823
italics, round materials in normal font. 824
825
Table 5. Bulk density, elastic modulus K0, total compaction (Ct) and compaction index (Ci.) 826
827
828
Appendix 829
830
Appendix 1. Bivariate cross-correlation matrix of internal and basal friction data. C is cohe-831
sion, µ is coefficient of friction; subscripts “peak”, “reac” and “dyn” indicate respective values 832
at internal peak, internal reactivation and internal dynamic conditions, respectively; sub-833
scripts “peakbas”, “reacbas” and “dynbas” indicate respective values at basal peak, basal 834
reactivation and basal dynamic conditions, respectively. 835

33
836

a. Quartz sands
b. Dyed quartz sands
c. Heavy mineral sands
d. Glass beads
CASSAN GFZSAN
NTUSAN RHUSAN
IFPSAN KYUSAN
STUSAN TLWSAN
UBESAN UCPSAN
ULISAN UOPSAN
UPASAN UPUSAN
IFPCSB IFPCSW
GFZGRS GFZZCS
GFZSAN col NTUSAN col
RHUSAN col
UOPSAN col
ULISAN col*
GFZGLB 100-200 µm GFZGLB 100-400 µm
GFZGLB 300-400 µm
Fig. 1. SEM photographs of tested granular materials. Length of white scale bar in each photograph is 500 μm

0
100
200
300
400
500
600
700
800
900
1000
0 100 200 300 400 500 600 700
Grain size (µm)
Cum
ulat
ive
wei
ght (
per m
ille)
GFZGLB 30
0-400
µm
GFZGLB 10
0-200
µm
GFZGLB 100-400 µm NTUSAN col GFZSAN
GFZ
ZSC
ULISAN
RHUSAN
CASSAN
NTUSAN
UPUS
AN
STUSANUBESAN UCPSAN
KYUS
AN
TLW
SAN
UPASA
N
IFPS
ANIF
PCSW
UOPSANGFZGRS
IFPC
SB
ULISAN col
GFZSAN col
RHUS
AN c
ol
UOPSAN col
Fig. 2. Grain size classes plotted against cumulative weight.
0
1
2
3
4
5
6
7
CA
SSA
N
GFZ
SA
N
GFZ
SAN
col
NTU
SA
N c
ol
RH
US
AN
col
ULI
SA
N c
ol
UO
PSA
N c
ol
GFZ
GR
S
GFZ
ZCS
IFPC
SB
IFPC
SW
GFZ
GLB
100
-200
GFZ
GLB
100
-400
GFZ
GLB
300
-400
IFPS
AN
KYU
SAN
NTU
SA
N
RH
US
AN
STU
SA
N
TLW
SAN
UB
ESA
N
UC
PS
AN
ULI
SA
N
UO
PSA
N
UP
AS
AN
UPU
SAN
Quartz sands Dyed quartz sands Heavy mineral sands Glass beads
Aspect ratio
PARIS shape factor
SH1 shape factor
Fig. 3. Grain shape analysis using aspect ratio, and SH1 shape and PARIS factors. Angular granular materi-als are indicated in bold italics, rounded materials in normal font.

Fig. 4. Ring-shear tester (after Schulze, 1994).

σn = 430 Pa
2150 Pa
First interval initial deformation Second interval
0 2 4 6 8 10 12 14 16 18
Displacement (mm)
0
200
400
600
800
1000
She
ar s
tress
(P
a)
A
B
Cstrain - softening
peakstrength
dynamicstrength
stra
in -
hard
enin
g
reactivationstrength
1720 Pa
1290 Pa
890 Pa
D
Fig. 5. Example of shear stress curves at different normal loads, AB = strain hardening part of curve, BC = strain softening part of curve, B = peak strength, C = dynamic strength, and D = reactivation strength.

0 2 4 6 8 10 12 14 16 180
200
400
600
800
1000
1200
1400
1600
1800
Displacement [mm]
She
ar s
tress
[Pa]
GFZGLB100-200 @ 430 Pa
GFZGLB100-200 @ 1290 Pa
GFZGLB100-200 @ 2150 Pa
IFPCSW @ 430 Pa
IFPCSW @ 1290 Pa
IFPCSW @ 2150 Pa
Fig. 6. Example of ring-shear test data analysis (UBESAN, internal) (a) Linear regression analysis of shear strength vs normal load data pairs (15 data). (b) Histo-grams of friction co-efficients and cohesion derived from mutual two-point regression analysis (90 data).
0 500 1000 1500 2000 25000
500
1000
1500
2000
Normal load (Pa)
She
ar s
treng
th (P
a)
Linear regression based on 15 measurements
0.65 0.7 0.75 0.8 0.85 0.90
5
10
15
20
25Friction coefficient & cohesion based on 90 mutual linear regressions (red = normal distribution)
Friction coefficient
Cou
nts
-100 -50 0 50 100 1500
5
10
15
20
25
30
Cohesion (Pa)
Cou
nts
a
b
Fig. 7. Shear stress plotted as a function of cell displacement (~ the amount of shear strain) for angular quartz sand (IFPCSW) and well-rounded glass beads (GFZGLB 100-200 µm) for three different normal loads.

20 21 22 23 24 25 26 27 28 29 30 31 32 33 34 35 36 37 38 39 40 41 42
0
CA
SSA
N
GFZ
SA
N
GFZ
SA
N c
ol
NTU
SA
N c
ol
RH
US
AN
col
ULI
SAN
col
UO
PSA
N c
ol
GFZ
GR
S
GFZ
ZCS
IFPC
SB
IFPC
SW
GFZ
GLB
100
-200
GFZ
GLB
100
-400
GFZ
GLB
300
-400
IFPS
AN
KYU
SAN
NTU
SA
N
RH
US
AN
STU
SA
N
TLW
SAN
UB
ESA
N
UC
PS
AN
ULI
SA
N
UO
PSA
N
UP
AS
AN
UPU
SAN
Inte
rnal
fric
tion
angl
e (°
)
internal peak friction
internal reactivation friction
internal dynamic friction
Quartz sands Dyed quartz sands Heavy mineral sands Glass beads
0
20
40
60
80
100
120
140
160
CA
SSA
N
GFZ
SA
N
GFZ
SAN
col
NTU
SA
N c
ol
RH
US
AN
col
ULI
SA
N c
ol
UO
PSA
N c
ol
GFZ
GR
S
GFZ
ZCS
IFPC
SB
IFPC
SW
GFZ
GLB
100
-200
GFZ
GLB
100
-400
GFZ
GLB
300
-400
IFPS
AN
KYU
SAN
NTU
SA
N
RH
US
AN
STU
SA
N
TLW
SAN
UB
ESA
N
UC
PS
AN
ULI
SA
N
UO
PSA
N
UP
AS
AN
UPU
SAN
Quartz sands Dyed quartz sands Heavy mineral sands Glass beads
cohesion at internal peak friction
cohesion at internal reactivation friction
cohesion at internal dynamic friction
Coh
esio
n (P
a), i
nter
nal
a
b
Fig. 8. Internal friction angles and cohesion values (a) Angles of internal peak friction, internal reactivation friction and internal dynamic friction. (b) Extrapolated cohesion values at internal peak friction, internal reactivation friction and internal dynamic friction. Angular granular materials are indicated in bold italics, rounded materials in normal font.

10 11 12 13 14 15 16 17 18 19 20 21 22 23 24 25 26 27
CA
SSA
N
GFZ
SA
N
GFZ
SAN
col
NTU
SA
N c
ol
RH
US
AN
col
ULI
SA
N c
ol
UO
PSA
N c
ol
GFZ
GR
S
GFZ
ZCS
IFPC
SB
IFPC
SW
GFZ
GLB
100
-200
GFZ
GLB
100
-400
GFZ
GLB
300
-400
IFPS
AN
KYU
SAN
NTU
SA
N
RH
US
AN
STU
SA
N
TLW
SAN
UB
ESA
N
UC
PS
AN
ULI
SA
N
UO
PSA
N
UP
AS
AN
UPU
SAN
Quartz sands
Bas
al fr
ictio
n an
gle(
°)
Dyed quartz sands Heavy mineral sands Glass beads
basal peak friction
basal reactivation friction
basal dynamic friction
CA
SSA
N
GFZ
SA
N
GFZ
SAN
col
NTU
SA
N c
ol
RH
US
AN
col
ULI
SA
N c
ol
UO
PSA
N c
ol
GFZ
GR
S
GFZ
ZCS
IFPC
SB
IFPC
SW
GFZ
GLB
100
-200
GFZ
GLB
100
-400
GFZ
GLB
300
-400
IFPS
AN
KYU
SAN
NTU
SA
N
RH
US
AN
STU
SA
N
TLW
SAN
UB
ESA
N
UC
PS
AN
ULI
SA
N
UO
PSA
N
UP
AS
AN
UPU
SAN
Quartz sands Dyed quartz sands Heavy mineral sands Glass beads0
20
40
60
80
100
120
140
160
180
200
220
cohesion at basal peak friction
cohesion at basal reactivation friction
cohesion at basal dynamic friction
Coh
esio
n (P
a), b
asal
a
b
Fig. 9. Basal friction angles and cohesion values (a) Angles of basal peak friction, basal re-activation friction and basal dynamic friction. (b) Extrapolated cohesion values at basal peak friction, basal reactivation friction and basal dynamic friction. Angular granular materials are indicated in bold italics, rounded materials in normal font.

0
500
1000
1500
2000
0 0.2 0.4 0.6 0.8 1
K0
Unloading path
Unloading path
Loading path
Loading path
Compaction ε1
Stre
ss σ
(kP
a)
Strain ε (%)
Cycle nr. 1Cycle nr. 50
Fig. 10. Uniaxial confined compression test after the first and 50th cycle. First loading – unloading cycle is domi-nated by compaction; later cycles represent more elastic behaviour. The elastic modulus, K0, is determined at the 50th cycle along loading path (dashed line).

Bulk density (g/cm3) - left scale
0
300
600
900
1200
1500
1800
2100
0
1
2
6
7
3
4
5 C
ASS
AN
GFZ
SA
N
GFZ
SAN
col
NTU
SA
N c
ol
RH
US
AN
col
ULI
SA
N c
ol
UO
PSA
N c
ol
GFZ
GR
S
GFZ
ZCS
IFPC
SB
IFPC
SW
GFZ
GLB
100
-200
GFZ
GLB
100
-400
GFZ
GLB
300
-400
IFPS
AN
KYU
SAN
NTU
SA
N
RH
US
AN
STU
SA
N
TLW
SAN
UB
ESA
N
UC
PS
AN
ULI
SA
N
UO
PSA
N
UP
AS
AN
UPU
SAN
Quartz sands Dyed quartz sands Heavy mineral sands Glass beads
10
20
30
40
50
60
Elastic modulus, K0, (MPa) - right scale, bold
Total compaction (Ct) in % - left scale Compaction index (Ci) in % - right scale, italic
Fig. 11. Values of bulk density, compaction index (left scale), total compaction and elastic modulus, K0, (right scale). Angular granular materials are indicated in bold italics, rounded materials
Grain size
Sorting
Aspect
PARIS
SH1
Angularity
Angularity
Ci
Ci
Ct
Ct
K0
K0
C
C
µpeak
µpeak
µdyn
µdyn
µdynbas
Density G‘size Sorting Aspect PARIS SH1
Grain shape& grain size
dataanalysis
Uniaxial confined
test datacompression
Selected ring-
datashear test
Fig. 12. Bivariate cross-correlation matrix of selected data. Points are plotted in red if the correlation is significant at the 95% level based on Pearson correlation coefficient. Apart from correlations within generic groups (shape and grain size analysis, uniaxial confined com-pression tests and ring shear test data), relevant and interpretable correlations exist be-tween shape parameters and friction parameters as well as between K0 with density and total compaction with internal friction. C is cohesion, Ci is compaction index, Ct is total com-paction, K0 is the elastic modulus, μ is coefficient of friction with subscripts “peak”, “dyn” and dynbas” indicating coefficients of peak internal friction, dynamic internal friction and dynamic basal friction, respectively.
Cpeak
µreac
Creac
µdyn
Cdyn
µpeakbas
Cpeakbas
µreacbas
Creacbas
µdynbas
Cdynbas
Internal friction data
µ C µ C µ C µ C µ C µpeak peak reac reac dyn dyn peakbas peakbas reacbas reacbas dynbas
Basal friction data
Appendix 1. Bivariate cross-correlation matrix of internal and basal friction data. C is cohesion, μ is coefficient of friction; subscripts “peak”, “reac” and “dyn” indicate respective values at internal peak, internal reactivation and internal dynamic conditions, respec-tively; subscripts “peakbas”, “reacbas” and “dynbas” indicate respective values at basal peak, basal reactivation and basal dynamic conditions, respectively.