coupling process models and probabilistic approaches - gfzpublic
TRANSCRIPT

Originally published as: Apel, H., Merz, B., Thieken, A. H. (2009): Influence of dike breaches on flood frequency estimation. - Computers and Geosciences, 35, 5, 907-923 DOI: 10.1016/j.cageo.2007.11.003

Manuscript accepted for publication in Computers and Geoscience
Influence of dike breaches on flood frequency estimation
Apel, H.a, Merz, B.a, Thieken, A.H.a
a GeoForschungsZentrum Potsdam (GFZ)
Telegrafenberg
14473 Potsdam
Germany
[email protected], [email protected], [email protected]
corresponding author:
Heiko Apel
Tel.: +49 331 288 1538
Fax: +49 331 288 1570
E-mail: [email protected]
Abstract
Many river floodplains and their assets are protected by dikes. In case of extreme flood
events, dikes may breach and flood water may spill over into the dike hinterland. Depending
on the specific situation, e.g. time and location of breach, and the capacity of the hinterland to
contain the flood water, dike breaches may lead to significant reductions of flood peaks
downstream of breach locations. However, the influence of dike breaches on flood frequency
distributions along rivers has not been systematically analysed. In order to quantify this
1

influence a dynamic-probabilistic model is developed. This model combines simplified flood
process modules in a Monte Carlo framework. The simplifications allows for the simulation
of a large number of different scenarios, taking into account the main physical processes. By
using a Monte Carlo approach, frequency distributions can be derived from the simulations.
In this way, process understanding and the characteristics of the river-dike-floodplain system
are included in the derivation of flood frequency statements. The dynamic-probabilistic model
is applied to the Lower Rhine in Germany and compared to the usually used flood frequency
analysis. For extreme floods the model simulates significant retention effects due to dike
breaches, which lead to significant modifications of the flood frequency curve downstream of
breach locations. The resulting probabilistic statements are much more realistic than those of
the flood frequency approach, since the dynamic-probabilistic model incorporates an
important flood process, i.e. dike breaching, that only occurs when a certain threshold is
reached. Beyond this point the behaviour of the flood frequency curve is dominated by this
process.
Keywords: flood frequency, dike breach, floodplain retention, probabilistic dynamic
modelling
2

1. Introduction
The sound estimation of flood hazards is of particular relevance along large rivers where
usually high damage potential has been accumulated over time, e.g. due to growth of urban
areas or industrial sites. In many cases these areas are protected by river dikes. However,
extraordinary floods may cause dike breaches and consequently high damages. For example,
during the August 2002 floods more than 130 dike breaches occurred in Germany along the
Elbe and its tributaries causing a total damage of approximately 15 billion €.
Depending on the characteristics of the river, the floodplains, the dikes and the characteristics
of the dike breach, such as location and width of the breach, significant volumes of water may
spill over into the dike hinterland, reducing the peak of the flood wave downstream of the
breach location. This effect has been observed in the course of actual flood events (e.g. Engel,
2004), and it has been simulated for synthetic situations (e.g. Kamrath et al., 2006). Also the
attenuation effect of flood plains has been studied in reaches without flood protection
(Jothityangkoon and Sivapalan, 2003; Woltemade and Potter, 1994). However, the influence
of dike breaches on the flood hazard situation along rivers has not been investigated
systematically. This paper investigates particular influence for the Lower Rhine in Germany.
Flood hazard assessment is an essential basis for the development of flood mitigation
schemes. Flood hazard is traditionally defined as the exceedance probability of potentially
damaging flood situations in a given area and within a specified period of time. Flood hazard
assessments for river reaches are usually based on a number of flood scenarios. Each scenario
is associated with a certain exceedance probability or return period EP T . For example, in
many countries, such as United Kingdom, Germany, Italy, Spain, France, USA, Canada and
New Zealand, the area affected by a 100-year flood plays an essential role for flood mitigation
strategies. The proposed directive of the European Union on the assessment and management
of floods requires two flood scenarios with return periods of 10 and 100 years, respectively,
and an extreme scenario with a higher return period (EU, 2006). The same choice was made
3

by the International Commission for the Protection of the Rhine: The Rhine-Atlas with a scale
of 1:100000 provides an overview of the flood situation for the 10-year, the 100-year and an
extreme event (ICPR, 2001).
Such flood hazard assessments consist of two steps: (1) estimating the T -year discharge
along the watercourse, and (2) transferring the discharge values into inundation areas. The
most widespread approach for the estimation of the T -year discharge along rivers is flood
frequency analysis, i.e. the application of extreme value statistics to a record of observed
discharges at the locations of interest (e.g. Stedinger et al., 1993). In many cases, at-site
(local) frequency analysis is complemented by regional flood frequency analysis, using data
from gauging stations that are supposed to have similar flood behaviour (e.g. Hosking and
Wallis, 1997).
Flood frequency analysis suffers from various drawbacks, originating from insufficient data
sets, and possible violation of the underlying assumptions of extreme value statistics.
Discharge data series are hardly longer than 30-50 years. Consequently, an estimation of
floods with return periods above 100 years is a wide extrapolation and hence highly uncertain.
In those rare cases where longer time series exist, earlier periods might not be representative
for today’s situation, and the basic assumptions of extreme value statistics, namely
stationarity and homogeneity, might be violated.
Stationarity requires that the flood runoff randomly fluctuates in time with a constant pattern
around a constant mean value. This implies that flood producing processes, e.g. rainfall
regime or geomorphological characteristics of the catchment, do not change with time.
Several studies have challenged the assumption of stationarity in flood frequency analysis due
to climate variability (e.g. Jain and Lall, 2001; Milly et al., 2002; Pfister et al., 2004, Kingston
et al., 2006) or human impact on hydrological processes (Helms et al., 2002, Lammerson et
al., 2002, Pfister et al., 2004).
4

The assumption of homogeneity is violated if floods in the observation range and in the
extrapolation range are caused or significantly influenced by different processes. Gutknecht
(1994) discusses flood generation in small mountainous catchments and suggests that extreme
flood events are caused by other meteorological, hydrological, hydraulic or geomorphological
processes than frequent floods. The assumption of homogeneity may not hold either for floods
that overtop and breach river dikes. Dike breaches might not have occurred during the
observation period. Therefore, in the extrapolation range an additional process, namely
retention of flood water due to dike breaches, appears that is not contained in the observed
data set. Even if dike breaches had occurred in the observation period, the flood defence
system would have been redesigned, possibly leading to significant changes in the river-flood
system.
The simplest method for the second step of a flood hazard assessment, i.e. the transfer of
discharge values in flooded areas, is based on the rating curves at the gauges and the
floodplain DEM (Digital Elevation Model). The discharges for selected return periods T are
converted to water levels via the rating curve. Further, the water levels between gauging
stations are interpolated, and the T -year flooded area is obtained by intersecting the
interpolated water level with the DTM. This simple method does not consider dike breaches.
In some cases, it is applied to the situation with and without dikes, thus giving a rough idea of
the flood defence effects of dikes. In flat lowland areas the intersection of DEM and water
level at the gauge might produce unrealistic inundation extends, because the inundation area
might be limited by the water volume available for flooding, an effect that is not considered
by the intersection of water level and DEM.
More sophisticated methods use 1D or 2D hydrodynamic models to simulate the flooded area
associated with a certain discharge value. Such approaches can include the effects of dike
breaches. However, since the T -year discharge for certain river sections is taken from the
5

flood frequency analysis, the effects of upstream dike breaches do not propagate, and they do
not affect the flood frequency analysis at downstream gauges.
Besides the approaches that build on flood frequency analysis, deterministic, scenario-based
approaches are used to investigate the effects of dike breaches (e.g. Alkema and Middlekoop,
2005, Kamrath et al., 2006). These approaches are based on simulation models that describe
the processes of flood routing in the river (usually 1D hydrodynamic model), dike breaching
and flooding of the hinterland (usually 2D hydrodynamic model). They are able to consider
the downstream effects of dike breaches. However, since they only consider deterministic
scenarios, it is not clear how this information can be incorporated into flood frequency
statements. Further, they are computationally very demanding, which limits the possibility of
simulating many scenarios.
The aim of this paper is to investigate how flood frequency distributions along river reaches
are influenced by dike breaches. We start from the hypothesis that, under extreme
hydrological loading, river dike breaches might significantly influence the shape of the flood
frequency distribution. To this end, we extend a dynamic-probabilistic model that has been
developed and applied to the Lower Rhine by Apel et al. (2004, 2006). This approach
combines simplified flood process models in a Monte Carlo framework. The simplifications
allow us to simulate a large number of different scenarios, taking into account the main
physical processes. By using a Monte Carlo approach, frequency distributions can be derived
from the simulations. The model results are compared to the usual approach for flood hazard
assessment along rivers.
2. Study area
The investigation area in this study is a reach of the Lower Rhine in Germany between gauge
Cologne (Rhine-km 688) and gauge Rees (Rhine-km 837) near the German-Dutch border
6

(Figure 1). The two major tributaries within the reach are the rivers Ruhr and Lippe. Their
input to the system is considered in the modelling approach.
The stretch of the river represents a typical large lowland river with wide meanders and is
almost completely protected by dikes on both sides. The total length of the embankments at
the Lower Rhine amounts to 330 km and the safety levels vary between a 20-year flood for
small summer dikes and a 500-year flood for the main structures (ICPR, 2001). The
hinterland behind the dikes has a large damage potential due to many densely populated
settlements and industrial areas. Assuming an extreme event (i.e. approximately a 500-year
flood) the ICRP (2001) estimates an area of 1356 km² at risk of inundation along the Lower
Rhine with a direct economic losses of 20333 million Euro. However, according to MURL
(2000) the inundated area is reduced to 420 km² by the embankments.
All the dikes in the reach were rebuilt in the last decades according to the engineering state of
the art. They are zonated dikes with an impermeable surface layer at the water side connected
to an impermeable basement, and a draining permeable layer at the land side often
accompanied with a basement drainage. This construction type minimises the probability of
dike failure due to piping, i.e. internal erosion, seepage or basement failures.
The flow regime of the River Rhine is dominated by snowmelt and precipitation runoff from
the Alps in the summer months, and further downstream by precipitation runoff from the
uplands of central Germany and neighbouring countries in winter (Disse and Engel, 2001).
The mean daily discharge amounts to 2087 m³/s at gauge Cologne (data from 1880 to 2004)
and to 2284 m³/s at gauge Rees (data from 1930 to 2000). Little seasonal variation enables
year-round navigability (Disse and Engel, 2001).
At the Lower Rhine, floods frequently occur during winter and early spring. In the annual
maximum discharge series from 1880 to 2004 only 7 % of the annual maxima (9 events) at
the gauge Cologne occurred in summer (May – September) whereas 85 % took place between
November and March.
7

Severe flood events occurred in December 1993 and January 1995. Both events originated in
the uplands of the Middle and Lower Rhine where heavy precipitation fell on saturated or
frozen soil resulting in high runoff coefficients (see Chbab, 1995, Fink et al., 1996). In
Cologne, the maximum water levels amounted to 10.61 m (~ 10700 m³/s) in 1993 and
10.69 m (~ 10800 m³/s) in 1995. In 1995, a damage of 33.23 million Euro occurred in
Cologne and was only about half of that associated to the 1993 flood (Fink et al., 1996). This
effect was also observed in other municipalities and was mainly attributed to improved
preparedness and disaster management (Wind et al., 1999).
3. Dynamic-probabilistic approach for flood hazard assessment
3.1 Outline of the approach
The dynamic-probabilistic approach is a set of modules, each representing a component in the
flood processes of the study area:
• Hydrological input at Cologne:
At gauge Cologne, the upstream boundary of the system, the input into the system in
terms of flood peak and shape of flood hydrograph is described.
• Superposition of flood waves of Rhine and of major tributaries:
The behaviour of the main tributaries Lippe and Ruhr is of importance for the flood
situation in the Lower Rhine. High flood peaks of Lippe and Ruhr at times of high
discharge values in the Rhine aggravates the flood situation of the Lower Rhine.
Therefore, the interplay of flood peaks and hydrograph shape between the Rhine and the
tributaries is taken into account.
• Hydraulic transformation:
This module calculates water levels in the river reach for given discharges.
• Dike failure due to overtopping and outflow through dike breach:
8

This module tests whether dike segments are overtopped. In this case, a two-dimensional
dike fragility curve is applied which estimates the probability of a dike breach under a
given hydrological load. If a breach occurs, a breach width is selected and the outflow into
the hinterland is determined, which corresponds to a decrease in flood volume
downstream of the breach location.
For each of these processes simple and computationally efficient models were developed.
They are based on several pre-processing works. With the exception of the module ‘Hydraulic
transformation’, all modules contain probabilistic elements. This approach reflects the
inherent variability of flood processes and our inability to deterministically describe such
processes as the superposition of flood peaks of the Rhine and its tributaries. The modules are
linked and embedded in a Monte-Carlo simulation framework. Each Monte-Carlo run
generates a single flood event resulting in an ensemble of flood events from which empirical
probabilities can be derived.
The following sections give a short description of the modules. A more detailed description
can be found in Apel et al. (2004, 2006). The module ‘dike failure due to overtopping and
outflow through dike breach’ is described in detail, since this module was extended to account
for a quasi-continuous mode of dike failure along the complete study area. The model version
of Apel et al. (2004, 2006) was restricted to two dike breach locations only.
3.2 Hydrological input at Cologne
For each flood event that is generated by the modelling system we need the input into the
river system at its upstream boundary, i.e. at the gauge Cologne/Rhine. Since the retention
effects of dike breaches are studied, the complete hydrograph at gauge Cologne has to be
generated for each event. This procedure is divided into two steps. In the first step a flood
peak value is generated, and in the second step a hydrograph is assigned to this peak value.
9

The flood peaks are estimated by means of a flood frequency analysis, based on the
observation data at gauge Cologne. It is well known that the choice of the distribution
function may significantly influence the result of flood frequency analysis. Different types of
distribution functions can be applied, usually leading to very different flood quantiles in the
extrapolation range. From the spectrum of distribution functions used in flood frequency
analysis, the following set of functions representative for the different classes of eytreme
value distribution functions was chosen: Gumbel, LogNormal, Weibull, Pearson III and
Generalized Extreme Value (GEV), (Stedinger et al., 1993). This subjective selection was
performed under the assumption of no a priori knowledge of the most appropriate function
type for the region and with the intention to cover the functions frequently used as well as all
classes of distribution function types.
The functions are fitted to the data sets by the method of moments, except for the GEV where
L-moments are used. The goodness of fit of the different functions is assessed by a maximum
likelihood method (Wood and Rodriguez-Iturbe, 1975). Based on this fitting criterion, a
composite distribution function is derived by weighing the different distribution functions
according to Wood and Rodriguez-Iturbe (1975). Figure 2 shows the fitted distribution
functions to the data set of Cologne along with the maximum likelihood weights.
The annual maximum discharge series of the gauge Cologne for the period 1961-1995 is used,
although much longer series exist. Extensive river training works and retention measures, the
construction of weirs along the Upper Rhine, and effects of climate variability suggest
significant changes in the flood behaviour during the first half of the 20th century (Lammersen
et al., 2002, Pfister et al., 2004). Therefore, former observations might not be representative
for the current state of the river system.
To obtain hydrographs, typical normalised hydrographs are extracted from the discharge data
series: For every year the maximum flood event was extracted from the hourly discharge
series and normalised to flood peak discharge and time to peak discharge. The resulting 35
10

normalised flood hydrographs were subjected to a cluster analysis yielding seven
characteristic flood waves (i.e. seven clusters). The clusters can be grouped into short single
peaked, short waves with small peaks preceding maximum and long multiple peaked flood
events (Apel et al., 2004). The normalised hydrographs are assumed to be independent from
the return periods. However, each normalised flood waves is assigned with an occurrence
probability, which is equal to the proportion of the number of flood events in the respective
cluster to the total 35 flood events, thus indicating the probability of the annual maximum
flood to belong to a single cluster. These occurrence probabilities are not to be confused with
return periods of flood peak discharge.
3.3 Superposition of flood waves of Rhine and tributaries
The interplay between floods in the main river and floods in the tributaries is considered by a
correlation analysis of the annual maximum discharges of the main river and the
corresponding events in the tributaries. The analysis shows that a rather tight linear
correlation between the discharge peaks of the Rhine and the peaks of Lippe and Ruhr exist.
This correlation in combination with the confidence intervals of the linear regression is used
to randomly generate a peak value for the tributaries, given the peak value of the Rhine (Apel
et al., 2004).
For each hydrograph cluster of the Rhine, the corresponding mean shapes of the hydrographs
of the tributaries are derived, based on the annual maximum data of gauges Hattingen/Ruhr
and Schermbeck I/Lippe for the period 1961-1995. In the Monte-Carlo simulation for each
generated flood event the mean hydrograph of the same cluster as the main river is chosen at
the tributaries, thus retaining the dependency of the flood events in main river and tributaries.
This dependency is caused by similar flood generating processes, i.e. high precipitation events
in the uplands of the Middle and Lower Rhine (cf. section study area). Figure 3 shows the
superposition of the synthetic main and tributary flood events for all seven flood types. It can
11

be seen that the flood waves of main river and tributaries show similar characteristics in all
clusters thus indicating the identical generating processes mentioned above. However, the
peaks do not overlay. In some cases the tributaries precede the peak in the main river, in
others they follow. This can be interpreted as a result of different cyclone pathways causing
the different precipitation fields in the uplands.
3.4 Flood routing and hydraulic transformation
1D-hydrodynamic simulations of flows in the investigated reach have shown that the flood
peak attenuation and the stretching of the flood wave in the reach are negligible. Figure 4
shows the flood wave of the flood of December 1993, which is hardly modified within the
160 km under study. The increase in the flood peak flow can be attributed to the tributary
inputs, even for the subreach between Cologne and Düsseldorf, where minor tributaries join
the Rhine. This results in an increase in flood peak flow of 72 m3/s in the subreach, which is
equivalent to an increase in stage of 3 cm at gauge Düsseldorf. This minor flood peak
deformation, which is below the accuracy of the digital elevation model and the surveyed dike
elevations, can be assumed for the complete reach, because no major changes in the river
morphology occur further downstream. Therefore the routing effect is neglected in this study,
which reduces the computational effort considerably.
However, in order to obtain discharge-stage curves for every breach location (cf. section 3.5)
the 1D-hydrodynamic model HEC-RAS (Brunner, 2002) with cross sections every 500 m was
adapted to the Lower Rhine. Using a simulation of the flood event of 1995, the discharge-
stage curves were extracted from the simulation results at the appropriate cross sections.
3.5 Dike failure due to overtopping and outflow through dike breach
Breach locations
12

This module tests whether dikes are overtopped and possibly breach for a given flood wave.
In case of breaching, it calculates the outflow in the hinterland and the reduction of the flood
wave in the main river.
Almost the complete river reach in the study area is accompanied by dikes, i.e. there are
almost 330 km of dikes. In principle, a dike breach could occur at each point along the dike
lines. A continuous test for dike breaching would require an enormous amount of CPU-time,
especially in a Monte-Carlo framework. Therefore, a quasi-continuous scheme was developed
which is supposed to reduce the potential dike breaching locations to a manageable number.
The scheme is comprised of the following steps:
1. 2D-inundation simulations are performed every kilometre on both sides of the river for
a fixed breach width of 100 m and a breach depth reaching the basement of the dike. A
constant breach outflow is assumed approximating the outflow in case of river water
levels at dike crest height. The breach outflow is calculated with a standard formula
for broad crested weirs.
2. The inundated areas of the breaches at different locations are compared and grouped
according to the similarity of the inundation areas. Each of these groups represents a
model breach location, where the model breach is located in the midpoint of the dike
section of the group.
By this procedure 41 model breach locations were identified on both sides of the river along
the complete reach (Figure 1). For the 2D-inundation simulations, a raster model based on the
diffusion wave analogy, an approximation of the full St.-Venant equations, was used. The
approach is identically to the floodplain inundation part of LISFLOOD-FP developed by
Bates and De Roo (2000). The simulations were performed on the basis of a Digital Elevation
Model with grid size of 50 m using the adaptive time-stepping given by Hunter et al. (2005).
The roughness parameterisation was derived on the basis of the CORINE land use data with
13

parameters assigned to each land use class according to published values (Werner et al., 2005;
Chow, 1973).
Dike failure mechanism and probability
Dikes may breach due to different failure mechanisms, such as erosion of the dike surface due
to overtopping, instability due to seepage or piping of the dike itself or of its underground,
and sliding of the dike. The analysis in this paper is restricted to the mechanism ‘breach as
consequence of overtopping’. The dikes in the study area are modern 3-zone-dikes and well
maintained. According to the authorities responsible for dike safety, the only probable
mechanism of dike breaching is due to overtopping. This assumption is supported by the fact
that there has been no dike failure at this reach during the last decades, although there have
been severe floods with water levels close to the dike crest.
For each model breach location, a fragility surface (or 2D fragility curve) was derived. This
surface represents the probability of a breach occurring at certain dike locations as a
consequence of overtopping. The failure probability is conditioned on the duration and height
of the flood wave overtopping the dike crest. This methodology is an extension of the 1D-
fragility curve method described in USACE (1999) and Dawson et al. (2005), which take only
one dimension, i.e. the height of the flood wave into account.
The fragility surface results from the comparison of the erosional stress inflicted on the dike
surface by the overtopping flood wave and the resistance of the dike. The stress is described
by the actual discharge qa overtopping the dike. The calculation of qa is performed with a
broad crested weir formula especially modified for dike overflow (Kortenhaus and Oumeraci,
2002). The calculation of the resistance qcrit follows the approach of Vrijling (2000) and is
based on data published in Hewlett et al. (1987). Following these considerations the dike
breaches, if with crita qq >
2/3dhAqa ⋅= (Kortenhaus and Oumeraci, 2002) (1)
14

4/3
4/12/5
tan125 i
ccrit
kvq
α⋅
= (Vrijling, 2000) (2)
and
)(log))1(45.08575.0(1))1(5.19117.3(
10 e
gc tfg
fv
⋅−⋅−+
−⋅+= (3)
where A [m2/s] is a summary parameter representing the geometric features of the dike (see
Kortenhaus and Oumeraci, 2002 for details), dh [m] is the difference between the water level
and the levee crest, vc [m/s] is the critical flow velocity, αi [deg] the angle of the inner talus, k
[m] the roughness of the inner talus, fg [ ] a parameter describing the quality of the turf
covering the dike, and te the overflow duration [h]. Formula (3) is parameterised on the basis
of experimental data given in Hewlett et al. (1987), with fg = 1 representing average turf
conditions, fg = 0.5 poor and fg = 1.5 good turf conditions. Figure 5 shows the fit of (3) to the
data.
If we had perfect knowledge of the parameters that influence the erosional stress and the
dike’s resistance, the comparison of qa with qcrit would decide whether the dike breaches or
not. Since dike parameters are time- and space-variable and not perfectly known, they are
described by probability distribution functions, based on data given by Vrijling (2000) for
Dutch river dikes. For a certain dike breach location, the probability of breaching
for a given couple of overtopping height dh and overtopping duration te is
calculated by randomly generating dike parameters from the respective distributions (104
samples in this study) and evaluating the quantity .
(( etdhBP ,| ))
crita qq − ( )( )etdhBP ,| equals to the
relative frequency of failures. This procedure is repeated for the complete domain of dh and
te, and for three distinct values of fg (0.5, 1, and 1.5). In this way fragility surfaces for each
dike breach location were constructed as exemplarily shown in Figure 6.
15

During each run of the dynamic-probabilistic model each breach location is tested for failure
in downstream order. Given the current combination of dh and te, the fragility surface yields
the probability of failure. In our calculation we assumed an average quality of the turf surface,
i.e. fg = 1, for all breach locations.
Breach width
The width of dike breaches strongly influences the spill-over of water into the hinterland. The
breach width depends on the actual flow situation during the breach, and on the construction
material and geometric properties of the dike. Since there is not enough information to
quantify the relation between breach width, dike properties and flow situation, the breach
width is assumed as a random variable. Its distribution is based on an evaluation of historical
dike breaches at the Rhine in 1882-1883 (Merz et al., 2004). This data set comprises 14
breaches, with a mean breach width of 70.3 m and a standard deviation of 31.5 m. We further
assumed a normal distribution of the breach widths. However, we constrained the randomised
breach widths to a lower bound equalling the smallest observed breach width of 34 m and an
upper bound of 200 m in order to keep the randomised breach widths within a reasonable
range.
3.6 Monte Carlo simulation
The four modules are linked in a Monte Carlo simulation. Figure 7 shows the outline of this
procedure. Each Monte Carlo run is equally likely and comprises the:
generation of a flood wave at Cologne,
generation of tributary flood waves, conditioned on the flood wave in the main river,
transformation of discharges into stages at each model breach location,
test for overtopping at each model breach location,
in case of overtopping: calculation of the breach probability conditioned on the actual
overtopping height and duration using the fragility surfaces, and random
16

determination of breaching (based on the calculated breach probability and a
randomly drawn number),
in case of breaching: generation of breach width,
in case of breaching: calculation of flow into the hinterland and reduction of the flood
wave in the main river,
superposition of the tributary flood waves at the appropriate routing nodes.
This procedure is repeated 105 times, yielding 105 synthetic flood events. In empirical tests
this number of Monte Carlo runs proved to yield stable results up to return intervals of 104
years. Since the event generation is based on annual maximum discharge data, the resulting
discharge and damage series are considered as annual maximum series. Thus annual
exceedance probabilities and return periods can be derived from the generated data sets.
4. Results
In 150 of 105 model runs dike breaches occurred. All breaches were concentrated at the first
six model breach locations, i.e. at the upstream end of the river system. The hinterland of
these dike segments can contain large flood volumes. Therefore, these breaches reduce the
flood waves even in an extreme event such that further downstream the dikes are not
overtopped and hence the considered breach mechanism is not triggered. The retention effect
due to dike breaching is thus well reproduced by the model system.
Figure 8 shows the effect of the dike breaches on the discharges associated to events with
selected return intervals along the river reach. For the gauging stations downstream of
Cologne (Düsseldorf, Ruhrort, Rees) the dynamic-probabilistic model yields lower discharges
for rare events in comparison to the flood frequency analysis. described in section 3. The
reduction is particularly dramatic for the 5000-year flood. The lower discharge values for
large events is a consequence of the dike breaches and the flood attenuating effect of the
17

inundation of the hinterland. For lower return intervals (100, 200, 500 years) the dynamic-
probabilistic model yields slightly larger discharges than the flood frequency analysis, which
results from the different shapes of the distribution function of the downstream gauging
stations in comparison to Cologne.
These effects are also illustrated in Figure 9 showing the flood frequency curves for
Düsseldorf, Ruhrort and Rees. For each station the frequency analysis calculated with
different distribution functions and the composite function are plotted along with the results
obtained with the dynamic-probabilistic model. It can be seen that with the exception of the
Weibull function none of the frequency curves obtained by flood frequency analysis reflect
the retention effect caused by dike breaches in contrast to the result of the dynamic-
probabilistic model. For large and rare events the dynamic-probabilistic model predicts
discharges asymptotically approaching maximum discharge. This discharge can be regarded
as the probable maximum flood (PMF).
The Weibull function shows a similar characteristic as the derived flood frequency curve.
However, the discharges predicted for extreme events are very low: Even for return intervals
larger than 10000 years the discharge stays below the dike crests, i.e. no floodplain inundation
will occur in this case. This means that the asymptotical behaviour of the frequency curve
does not describe the actual peak attenuating process. On the contrary, in this case it rather
shows the inappropriateness of the function despite the comparatively high likelihood weights
(cf. Figure 9).
In order to test the plausibility of the model results, the model estimates for the 1000-year
flood at the gauges Düsseldorf and Rees (downstream of Cologne) as well as the
corresponding estimates on the basis of a flood frequency analysis with a log-normal
distribution were compared with observed outstanding flood events in Germany and other
European countries. The comparison is based on specific peak specific discharges (Figure 10-
A). For this purpose the data base of Stanescu (2002) was extended by data from Herschy
18

(2003) and by various discharge data from the flood events that occurred recently, i.e. in
1997, 1999, 2002 and 2005, in Germany.
Figure 10-A illustrates that there is an upper bound of the specific discharge that declines with
increasing catchment area. Both the model estimates and the estimates of the log-normal
distribution exceed the specific flood discharges observed in Germany at comparable gauges.
However, Figure 10-B illustrates that higher specific discharges occurred in other European
catchments of a similar size (e.g. Danube, Don, Wisla, Odra). While the estimates of the
dynamic-probabilistic model for the 1000-year flood at the gauges Düsseldorf and Rees are in
the range of the observed specific discharges, the estimates of the log-normal distribution are
the utmost margin of the data. This indicates that the dynamic-probabilistic model yields more
realistic estimates of extreme flood discharges in comparison to a standard extreme value
statistics approach.
5. Conclusion
The influence of dike breaches on the flood hazard situation along rivers with dikes that
protect large former flood plains has not been systematically examined. Flood frequency
analysis is usually not suited for such an analysis, since extreme events are not sufficiently
represented in the data sample, or since the assumption of flood frequency analysis are
violated. Therefore, a dynamic-probabilistic model has been developed that links simplified
modules describing the processes of the river-dike-flood plain system within a Monte Carlo
framework. In this way, it is possible to derive “process-oriented” flood frequency
distributions.
The model is applied to the Lower Rhine in Germany. The results agree well with the usually
used approach, i.e. the flood frequency approach, for flood events where no dike breaches
occur. However, for extreme floods (e.g. 1000-year flood) dike breaches lead to large
retention effects altering the flood frequency curve. The resulting probabilistic statements are
19

much more realistic than those of the flood frequency approach, since the dynamic-
probabilistic model incorporates an important flood process that only occurs when a certain
threshold is reached. Above this threshold the behaviour of the flood frequency curve is
dominated by dike failures and floodplain inundation. The dynamic-probabilistic model
acknowledges the fact that large floods are not large versions of small floods – an assumption
that is implicitly built into flood frequency analysis.
The proposed method is principally transferable to any other diked river reach. However, the
necessary preprocessing works are quite intensive in terms of data demand and computation
time, while the actual model is very computational efficient. Therefore we recommend to use
the model in another area for multiple purposes, e.g. the derivation of derived flood
frequencies and risk assessments for different development scenarios, in order to optimise the
benefits gained by the model.
References
Alkema, D. and Middelkoop, H., 2005. The influence of floodplain compartmentalization on
flood risk within the Rhine-Meuse delta. Natural Hazards, 36(1-2)j 125-145.
Apel, H., Thieken, A.H., Merz, B. and Blöschl, G., 2004. Flood risk assessment and
associated uncertainty. Natural Hazards and Earth System Science, 4(2): 295-308.
Apel, H., Thieken, A.H., Merz, B. and Blöschl, G., 2006. A Probabilistic Modelling System
for Assessing Flood Risks. Natural Hazards, 38(1 - 2): 79-100.
Bates, P.D. and De Roo, A.P.J., 2000. A simple raster-based model for flood inundation
simulation. Journal of Hydrology, 236(1-2): 54-77.
Brunner, G. W., 2002. HEC-RAS River Analysis System - Hydraulic Reference Manual.
Davis. US Army Corps of Engineers - Hydrologic Engineering Center (HEC): 350 pp.
(http://www.hec.usace.army.mil/software/hec-ras/documents/hydref/index.html)
20

Chbab, E.H., 1995. How extreme were the 1995 flood waves on the rivers Rhine and Meuse?
Physics and Chemistry of the Earth, 20(5-6): 455-458.
Chow, V.T., 1973. Open-Channel Hydraulics, McGraw-Hill, 680 pp.
Disse, M. and Engel H., 2001. Flood events in the Rhine Basin: Genesis, Influences and
Mitigation. Natural Hazards, 23: 271-290.
Engel, H., 2004. The flood event 2002 in the Elbe river basin: causes of the flood, its course,
statistical assessment and flood damages. Houille-Blanche, (6): 33-36.
EU, 2006. http://ec.europa.eu/environment/water/flood_risk/index.htm
Fink, A., Ulbrich, U. and Engel, H., 1996. Aspects of the January 1995 flood in Germany.
Weather 51(2): 34-39.
Gutknecht, D., 1994. Extremhochwässer in kleinen Einzugsgebieten. Österreichische Wasser-
und Abfallwirtschaft, 46(3/4), 50-57.
Helms, M., Büchele, B., Merkel, U. and Ihringer, J., 2002. Statistical analysis of the flood
situation and assessment of the impact of diking measures along the Elbe (Labe) river. Journal
of Hydrology, 267(1-2), 94-114.
Herschy, R., 2003: World catalogue of maximum observed floods. IAHS Publication 284:
285 pp.
Hewlett, H. W. Boorman, M., L. A. and Bramley, M. E., 1987. Design of reinforced grass
waterways (CIRIA Report 116). London, Construction Industry Research and Information
Association (CIRIA), 118 pp.
Hosking, J.R.M. and Wallis, J.R., 1997. Regional Frequency Analysis, An Approach Based
on L-Moments. Cambridge University Press, Cambridge, 240 pp.
Hunter, N.M., Horritt, M., Bates, P.D., Wilson, M.D. and Werner, M.G.F., 2005. An adaptive
time step solution for raster-based storage cell modelling of floodplain inundation. Advances
in Water Resources, 28(9): 975-991.
21

ICPR (International Commission for the Protection of the Rhine), 2001. Rhine-Atlas. ICPR,
Koblenz, retrieved from http://www.rheinatlas.de (11 October 2006).
Jain, S. and Lall, U., 2001. Floods in a changing climate; does the past represent the future?
Water Resources Research, 37(12), 3193-3205.
Jothityangkoon, C. and Sivapalan, M., 2003. Towards estimation of extreme floods;
examination of the roles of runoff process changes and floodplain flows. Journal of
Hydrology, 281(3): 206-229.
Kamrath, P., Disse, M., Hammer, M. and Köngeter, J., 2006. Assessment of discharge
through a dike breach and simulation of flood wave propagation. Natural Hazards, 38(1-2),
63-78.
Kortenhaus, A. and Oumeraci, H., 2002. Probabilistische Bemessungsmethoden für Seedeiche
(ProDeich). Bericht No. 877, Leichtweiss-Institut, Braunschweig, pp. 205.
Lammersen, R., Engel, H., Van de Langemheen, W. and Buiteveld, H., 2002. Impact of river
training and retention measures on flood peaks along the Rhine. Journal of Hydrology, 267(1-
2), 115-124.
Merz, B., Apel, H., Gocht, M., 2004. Entwicklung eines probabilistischen Ansatzes zur
Bestimmung des Deichversagens durch Überströmen. In: Merz, B., Apel, H. (eds.), Risiken
durch Naturgefahren, Scientific Technical Report STR04/01, GeoForschungsZentrum
Potsdam, 77-84.
Milly, P.C.D., Wetherald, R.T., Dunne, K.A. and Delworth, T.L., 2002. Increasing risk of
great floods in a changing climate. Nature, 415(6871), 514-517.
MURL, 2000. Potentielle Hochwasserschäden am Rhein in NRW. Ministry of Environment.
Spatial Planning and Agriculture of North Rhine-Westphalia. Düsseldorf. retrieved from
http://www.proaqua-gmbh.de/hws/hwsnrw/hws/index.htm (11 October 2006)
Stanescu, V.A., 2002. Outstanding floods in Europe: A regionalization and comparison. In:
International Conference on Flood Estimation, Berne, Switzerland CHR-Report II-17,
22

Stedinger, J.R., Vogel, R.M. and Foufoula-Georgiou, E., 1993. Frequency analysis of extreme
events. In: D.R. Maidment (Editor), Handbook of Hydrology. McGraw-Hill, New York, pp.
18.1 - 18.66.
USACE, 1999. Risk-based analysis in geotechnical engineering for support of planning
studies. Engineer Technical Letter (ETL) 1110-2-556, U.S. Army Corps of Engineers,
Washington D.C.
Vrijling, J.K., 2000. Probabilistic Design. Lecture Notes, pp. 145, Delft.
Werner, M.G.F., Hunter, N.M. and Bates, P.D., 2005. Identifiability of distributed floodplain
roughness values in flood extent estimation. Journal of Hydrology, 314(1-4): 139-157.
Wind, H.G, Nierop, T.M., de Blois, C.J. and de Kok, J.L., 1999. Analysis of flood damages
from the 1993 and 1995 Meuse flood. Water Resources Research, 35(11): 3459-3465.
Woltemade, C.J. and Potter, K.W., 1994. A watershed modeling analysis of fluvial
geomorphologic influences on flood peak attenuation. Water Resources Research, 30(6):
1933-1942.
Wood, E.F. and Rodriguez-Iturbe, I., 1975. A bayesian approach to analyzing uncertainty
among flood frequency analysis. Water Resources Research, 11(6): 839-843.
23

Figure captions:
Figure 1: The investigation area Lower Rhine between Cologne and Rees.
Figure 2: Fit of five different extreme value distributions to the annual maximum discharge
series of Cologne from 1961-1995 and the composite distribution function constructed by the
likelihood weights given for each function in the legend.
Figure 3: Superposition of the synthetic flood waves of the Rhine and the tributaries Ruhr and
Lippe for each flood type identified in the cluster analysis. The flood waves are scaled in
time, but normalised in flood peaks to show the delay of flood peaks. P indicates the
probability of a flood to belong to the respective clusters.
Figure 4: Flood wave attenuation and translation for the flood event of 1993 in the study
reach.
Figure 5: Fit of the empirical formula for the critical dike overflow velocity (3) to
experimental data published by Hewlett et al. (1987), Goodness if fit: RMSE = 0.06844 m/s,
coefficient of determination R2 = 0.954.
Figure 6: Conditional failure probabilities (fragility surface) for breach location 1 depending
on overflowing duration and overtopping height.
Figure 7: Scheme of the dynamic-probabilistic model for a single Monte-Carlo run.
Figure 8: Plot of discharges for selected return intervals along the river reach. The solid lines
represent the results of the dynamic-probabilistic model, the markers the results of extreme
value analysis (composite function) for the gauging stations.
Figure 9: Comparison of extreme value statistics for the gauging stations Düsseldorf, Ruhrort
and Rees with the result of the dynamic-probabilistic model. The numbers in the legend give
the likelihood weights associated to the five basic distributions, which were use for the
construction of the composite function.
24

Figure 10: Comparison of estimates for the 1000-year flood at the gauges Düsseldorf and
Rees with observed outstanding flood events in Germany and other European countries (data
from Stanescu, 2002, Herschy, 2003 and various gauging stations in Germany).
25

Figure 1
ReesRhine-km 837.4
CologneRhine-km 688
Ruhr
Lippe
Rhine
SettlementsDutch-German border
0 6 12 18 243Kilometers
DüsseldorfRhine-km 744.2
Duisburg (Ruhrort)Rhine-km 780.8
Gauging stations
__
__ _
__ _
___
_
_
_
__
____
_
_____ _
____
_ _
__
__
_
_ __
Model breach locations_
26
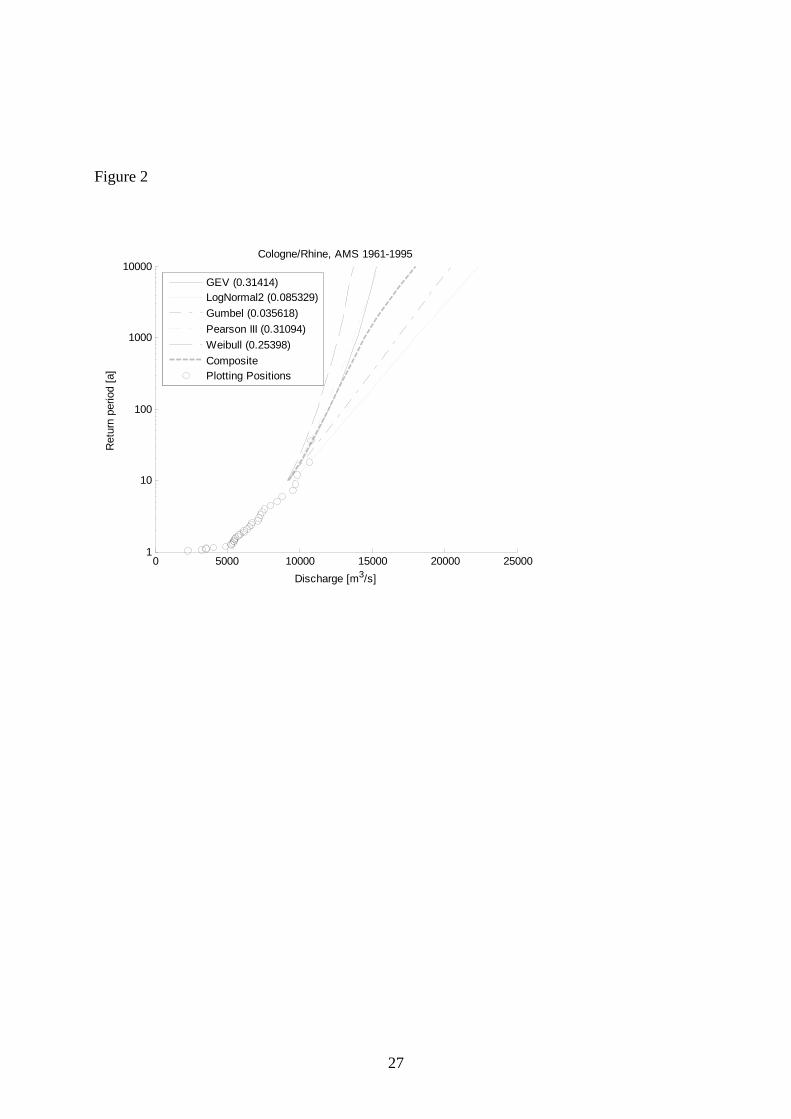
Figure 2
0 5000 10000 15000 20000 250001
10
100
1000
10000
Discharge [m3/s]
Ret
urn
perio
d [a
]
Cologne/Rhine, AMS 1961-1995
GEV (0.31414)LogNormal2 (0.085329)Gumbel (0.035618)Pearson III (0.31094)Weibull (0.25398)CompositePlotting Positions
27

Figure 3
0 200 400 600 800 10000
0.5
1
t [h]
Qno
rm
stand. hydrograph Nr. 1 (P = 0.085714)
0 200 400 600 800 10000
0.5
1
t [h]
Qno
rm
stand. hydrograph Nr. 2 (P = 0.057143)
0 200 400 600 800 10000
0.5
1
t [h]
Qno
rm
stand. hydrograph Nr. 3 (P = 0.028571)
0 200 400 600 800 10000
0.5
1
t [h]
Qno
rm
stand. hydrograph Nr. 4 (P = 0.028571)
0 200 400 600 800 10000
0.5
1
t [h]
Qno
rm
stand. hydrograph Nr. 5 (P = 0.2)
0 200 400 600 800 10000
0.5
1
t [h]
Qno
rm
stand. hydrograph Nr. 6 (P = 0.085714)
0 200 400 600 800 10000
0.5
1
t [h]
Qno
rm
stand. hydrograph Nr. 7 (P = 0.51429)
Rhine at CologneRuhrLippe
28

Figure 4
4000
5000
6000
7000
8000
9000
10000
11000
12000
13000
14000
17/12/199300:00
22/12/199300:00
27/12/199300:00
01/01/199400:00
06/01/199400:00
11/01/199400:00
16/01/199400:00
time [h]
Dis
char
ge[m
3 /s]
CologneDüsseldorfRuhrortRees
tributary input Ruhrtributary input Lippe
29

Figure 5
5 10 15 20 25 30 35 40 45 500.5
1
1.5
2
2.5
3
3.5
4
4.5
5
overtopping duration t [h]e
criti
cal v
eloc
ity v
c[m
/s]
vc (fg = 0.5)
vc (fg = 1)
vc (fg = 1.5)
CIRIA data (poor)CIRIA data (average)CIRIA data (good)
30

Figure 6
2 4 6 8 10 12 14 16 18 200
0.05
0.1
0.15
0.2
0.25
0.3
0.35
0.4
0.45
0.5
0.9
0.80. 7
0.60.5
0.40.3 0.2
0.1
overtopping duration t [h]e
over
topp
ing
heig
ht d
h [m
]
31

Figure 7
Start of Monte Carlo run
End of Monte Carlo run
Flood wave at Cologne
Flood waves of tributaries
Dike failure at each breach location
flood peak standardhydrograph
correlated randomflood peak
correspondinghydrograph
superposition offlood waves
dike overtopping ?
dike breaching ?breach width
outflow in hinterland
reduction of flood wave
breach probability
no
no
yes
yes
water levels ateach breach location
probabilisticmodule
deterministicmodule
32

Figure 8
680 700 720 740 760 780 800 820 84011000
12000
13000
14000
15000
16000
17000
18000
19000
Rhine-km
Dis
char
ge [m
3 /s]
T = 100 a T = 200 a T = 500 a T = 1000 a T = 5000 adynamic-prob.FFA (compo.) T = 100 a T = 200 a T = 500 a T = 1000 a T = 5000 a
33

Figure 9
0 5000 10000 15000 20000 250001
10
100
1000
10000
Discharge [m3/s]
Ret
urn
perio
d [a
]
Duesseldorf/Rhine, AMS 1961-1995
GEV (0.34762)LogNormal2 (0.061808)Gumbel (0.019302)Pearson III (0.33625)Weibull (0.23502)CompositeDynamicPlotting Positions
0 5000 10000 15000 20000 250001
10
100
1000
10000
Discharge [m3/s]
Ret
urn
perio
d [a
]
Ruhrort/Rhine, AMS 1961-1995
GEV (0.20147)LogNormal2 (0.048244)Gumbel (0.022233)Pearson III (0.20767)Weibull (0.52039)CompositeDynamicPlotting Positions
0 5000 10000 15000 20000 250001
10
100
1000
10000
Discharge [m3/s]
Ret
urn
perio
d [a
]
Rees/Rhine, AMS 1961-1995
GEV (0.24032)LogNormal2 (0.094278)Gumbel (0.052979)Pearson III (0.24593)Weibull (0.36649)CompositeDynamicPlotting Positions
34

Figure 10
10
100
1000
10000 100000 1000000Catchment Area [km²]
Rees
Duesseldorf
10
100
1000
10000
100 1000 10000 100000 1000000
Catchment Area [km²]
g(
)Sp
ecifi
cDi
scha
re
[L/s
*km
²]
Extreme observed floods in EuropeExtreme observed floods in GermanyEstimated 1000-year flood at Duesseldorf (prob. model)Estimated 1000-year flood at Duesseldorf (FFA-LN)Estimated 1000-year flood at Rees (prob. model)Estimated 1000-year flood at Rees (FFA-LN)
A
B
g(
)Sp
ecifi
cDi
scha
re
[L/s
*km
²]
35