original research article - innovative publication and the mass balance is found close to 98.2%. ......
TRANSCRIPT

Original Research Article
International Journal of Pharmaceutical Chemistry and Analysis, 3(3):150-161 150
A validated reverse phase stability-indicating HPLC method for bortezomib in the
presence of degradation products and its process-related impurities
Jagadeswara Rao K1, Mohan B2, Venugopal NVS3, Murali Mohan SV4, Rama Rao Malla5,*
1,5Dept. of Biochemistry, Cancer Biology Labs, 3Dept. of Chemistry, GIS, GITAM University, Visakhapatnam, 2,4Analytical
Research & Development, Shilpa Medicare Limited
*Corresponding Author: Email: [email protected]
Abstract Degradation pathway of bortezomib was established as per ICH recommendations in terms of validated and stability
indicating reverse phase liquid chromatographic method. Bortezomib was subjected to stress using conditions of acid, base,
oxidation, thermal and photolysis. Significant degradation was observed in acid and base stress conditions. Ten impurities were
studied and the major degradant was hydroxyamide impurity. The stress samples were assayed against a qualified reference
standard and the mass balance is found close to 98.2%. Efficient chromatographic separation was achieved on a Zorbax Extend
C18(100 x 4.6 mm, 1.8 μm) stationary phase with simple mobile phase combination In the developed LC method, the resolution
between bortezomib and ten potential impurities such as Imp-A, Imp-B, Imp-C, Imp-D, Imp-E, Imp-F, Imp-G, bortezomib
isomer, hydroxyamide and bortezomib ester) was found to be greater than 2.0. Regression analysis showed r value (correlation
coefficient) of greater than 0.999 for bortezomib and ten potential impurities. This method was capable of detecting the
impurities of bortezomib at a level of 0.02% with respect to test concentration of 2.0 mg/mL. The developed rapid LC method
was validated with respect to specificity, linearity, range, accuracy, precision and robustness for impurities.
Keywords: Bortezomib, Analytical Method development, Analytical Method validation and High Performance Liquid
Chromatography.
Access this article online
Website:
www.innovativepublication.com
DOI:
10.5958/2394-2797.2016.00021.6
Introduction Bortezomib, is chemically (R)-3-methyl-1-((S)-3-
phenyl-2- (pyrazine-2-carboxamido) propanamido butyl
boronic acid, belongs to new class of drugs, contains a
boronic acid moiety. It is effective against different
types of tumours, but mainly used for the treatment of
multiple myeloma[1], which accounts for 10% of all
blood system malignancies[1]. Bortezomib is one of the
first therapeutic proteasome inhibitor evaluated in
humans by administering into intravenous bolus[4-5]. It
is a peptidomimetic compound consist of modified
leucine-phenylalanine dipeptide with boronic acid at the
C-terminal region. It is able to interact with proteasome,
an intracellular apparatus, which breaks down damaged
or unfolded proteins and inhibiting[2]. The photolytic
action a few chromatographic methods bortezomib is
reported to quantified by including SPE–LC-MS/MS,
human urine and a LC–tandem mass spectrometric
assay in human plasma,[8] RP-HPLC method for
analysis of bortezomib in a pharmaceutical dosage
forms and Ultra-Fast LC[6-7], method in Pharmaceutical
dosage form samples in the presence of degradation
products and potential impurities. The present study is
aim to develop a single stability-indicating LC
method[3], for the determination of bortezomib and its
related impurities. The developed LC method is
validated with respect to specificity, LOD, LOQ,
linearity, precision, accuracy and robustness.The
present study also aimed to establish degradation
pathway of bortezomib through stress studies under a
variety of ICH recommended test conditions.
Experimental Chemicals: The bortezomib and its related impurities
such as Imp-A, B, C, D, E, F and G, bortezomib isomer,
hydroxyamide and bortezomib ester used in the present
study were of > 99% purity and obtained from Terra
Scientific Pvt. Ltd, Hyderabad and India (Fig. 1).
Acetonitrile (ACN), tetrahydrofuran, formic acid,
dimethyldichlorsilane and Ammonium formate were
HPLC grade and purchased from Merck (Darmstadt,
Germany). All other chemicals used in the present were
analytical grade and obtained from commercial source.
Equipment’s: The LC system was used for the method
development, forced degradation studies and method
validation. The system consists of HPLC 2695 model
binary pump equipped with an auto sampler and a
photo Diode array detector (Waters, USA). The output
signal was monitored and processed using Empower
software (Pro version 2) view sonic computer. Photo
stability studies were carried out using photostability
chamber (New tronic life care, India). Thermal stability
studies were carried out using dry hot air oven
(Newtronic life care, India.
Jagadeswara Rao K et al. A validated reverse phase stability-indicating HPLC method for….
International Journal of Pharmaceutical Chemistry and Analysis, 3(3):150-161 151
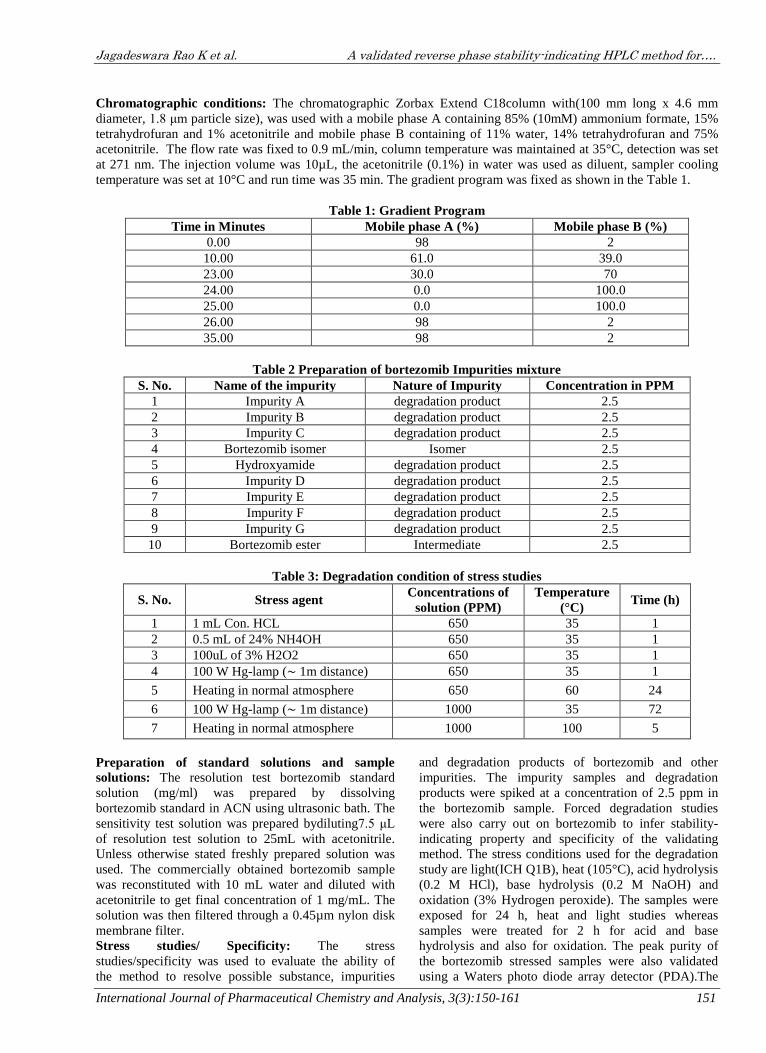
Chromatographic conditions: The chromatographic Zorbax Extend C18column with(100 mm long x 4.6 mm
diameter, 1.8 μm particle size), was used with a mobile phase A containing 85% (10mM) ammonium formate, 15%
tetrahydrofuran and 1% acetonitrile and mobile phase B containing of 11% water, 14% tetrahydrofuran and 75%
acetonitrile. The flow rate was fixed to 0.9 mL/min, column temperature was maintained at 35°C, detection was set
at 271 nm. The injection volume was 10µL, the acetonitrile (0.1%) in water was used as diluent, sampler cooling
temperature was set at 10°C and run time was 35 min. The gradient program was fixed as shown in the Table 1.
Table 1: Gradient Program
Time in Minutes Mobile phase A (%) Mobile phase B (%)
0.00 98 2
10.00 61.0 39.0
23.00 30.0 70
24.00 0.0 100.0
25.00 0.0 100.0
26.00 98 2
35.00 98 2
Table 2 Preparation of bortezomib Impurities mixture
S. No. Name of the impurity Nature of Impurity Concentration in PPM
1 Impurity A degradation product 2.5
2 Impurity B degradation product 2.5
3 Impurity C degradation product 2.5
4 Bortezomib isomer Isomer 2.5
5 Hydroxyamide degradation product 2.5
6 Impurity D degradation product 2.5
7 Impurity E degradation product 2.5
8 Impurity F degradation product 2.5
9 Impurity G degradation product 2.5
10 Bortezomib ester Intermediate 2.5
Table 3: Degradation condition of stress studies
S. No. Stress agent Concentrations of
solution (PPM)
Temperature
(°C) Time (h)
1 1 mL Con. HCL 650 35 1
2 0.5 mL of 24% NH4OH 650 35 1
3 100uL of 3% H2O2 650 35 1
4 100 W Hg-lamp (∼ 1m distance) 650 35 1
5 Heating in normal atmosphere 650 60 24
6 100 W Hg-lamp (∼ 1m distance) 1000 35 72
7 Heating in normal atmosphere 1000 100 5
Preparation of standard solutions and sample
solutions: The resolution test bortezomib standard
solution (mg/ml) was prepared by dissolving
bortezomib standard in ACN using ultrasonic bath. The
sensitivity test solution was prepared bydiluting7.5 μL
of resolution test solution to 25mL with acetonitrile.
Unless otherwise stated freshly prepared solution was
used. The commercially obtained bortezomib sample
was reconstituted with 10 mL water and diluted with
acetonitrile to get final concentration of 1 mg/mL. The
solution was then filtered through a 0.45µm nylon disk
membrane filter.
Stress studies/ Specificity: The stress
studies/specificity was used to evaluate the ability of
the method to resolve possible substance, impurities
and degradation products of bortezomib and other
impurities. The impurity samples and degradation
products were spiked at a concentration of 2.5 ppm in
the bortezomib sample. Forced degradation studies
were also carry out on bortezomib to infer stability-
indicating property and specificity of the validating
method. The stress conditions used for the degradation
study are light(ICH Q1B), heat (105°C), acid hydrolysis
(0.2 M HCl), base hydrolysis (0.2 M NaOH) and
oxidation (3% Hydrogen peroxide). The samples were
exposed for 24 h, heat and light studies whereas
samples were treated for 2 h for acid and base
hydrolysis and also for oxidation. The peak purity of
the bortezomib stressed samples were also validated
using a Waters photo diode array detector (PDA).The
Jagadeswara Rao K et al. A validated reverse phase stability-indicating HPLC method for….
International Journal of Pharmaceutical Chemistry and Analysis, 3(3):150-161 152
purity angle was set within the purity threshold limit for
all of the stressed samples and contents of impurities
were calculated for the stress samples against a
qualified reference standard. The mass balance[9-11], (%
assay + % of impurities + % of degradation products)
was calculated for all of the samples.
Method validation Precision: The method was validated as per ICH
recommendations. The system precision was
investigated by injecting six individual preparations
(2.5µg/ml) of bortezomib spiked with 0.03% each of
impurity A, B, C, D, E, F and G, bortezomib isomer,
hydroxyamide and bortezomib ester. Then, % RSD of
the areas of impurity C, bortezomib isomer and
hydroxyamide was calculated. The intermediate
precision of the method was confirmed by different
analysts and instruments. The precision of the method
was evaluated by the analysis out six independent
analysis of a test samples of bortezomib against a
qualified reference standard. The % RSD of six
independent test values were calculated.
Limit of detection (LOD) and limit of quantification
(LOQ): The LOD and LOQ for impurity A, B, C, D, E,
F and G, bortezomib isomer, hydroxyamide,
bortezomib and bortezomib ester were evaluated at a of
3:1 and 10:1, signal-to noise ratio by injecting a series
of dilute solutions with known concentrations. The
precision study was also performed at the LOQ level by
injecting six individual samples and calculated the
%RSD of the areas.
Linearity: Linearity test solutions were prepared from
a stock solution at six concentration levels from 50 to
150% of the analyte at concentration for the related
substance method. The peak area versus concentration
details analyzed with least-squares linear regression.
The Linearity test solutions were prepared by diluting
the impurity stock solution to the required
concentrations for the related substance method. The
solutions were diluted at six different concentration
levels from the LOQ to 150%. The slope and y-
intercept of the calibration curve were observed. The
peak area versus concentration data was analyzed using
least squares linear regression. The linearity test
solutions were prepared by diluting the impurity stock
solution to the required concentrations for the related
substance method. The slope and y-intercept of the
calibration curve were reported.
Accuracy: The accuracy of the related substance
method was evaluated in triplicate at three
concentration levels, 50, 100 and 150% and the percent
recovery was also calculated. The impurities A, B, C,
D, E, F and G, Bortezomib isomer, hydroxyamide,
bortezomib ester and bortezomib were spiked into
bortizomib and recovery experiments were performed
to determine the accuracy of the related substance
method for quantification of impurities. The study was
carried out in triplicate at 0.2, 0.4 and 0.6% of the
analyte concentration (2.0 >g/ml). The percent of
recovery for Impurities A, B, C, D, E, F and G,
Bortezomib isomer, hydroxyamide, bortezomib ester
and bortezomib were calculated.
Robustness: The robustness of the developed method
of evaluated at different experimental conditions such
as flow rate, pH and column temperature. The flow rate
of the mobile phase was maintained 0.9 ml/min. To
study the effect of the flow rate on the resolution, the
flow rate was changed by 0.1 units from 0.8 and 1.0
ml/min. The effect of pH on the resolution of the
impurities was studied by varying the pH by ± 0.2 units
from buffer pH 2.8 and 3.2. The effect of the column
temperature on the resolution was studied from 30-
40°C. In all these varied conditions, the components of
the mobile phase was remain constant during this study.
Solution stability and Mobile phase stability: The
stability of bortezomib solution in the proposed method
was carried out by placing the both sample and
reference standard solutions in a tightly capped
volumetric flasks at room temperature for 6 h. The
same sample solutions were assayed for in a 6 h interval
during the study period. The mobile phase stability was
evaluated by assaying the freshly prepared sample
solutions against freshly prepared reference standard
solutions for 6 h intervals. The prepared mobile phase
remained constant during the study period. The % RSD
of the bortezomib impurities was calculated for the
mobile phase as well as solution stability experiments.
The amount of bortezomib and impurity A, B, C, D, E,
F and G, bortezomib isomer, hydroxyamide and
bortezomib ester was determined up to the study period
at 6 h intervals. The stability of mobile phase was
evaluated for48 h by injecting the freshly prepared
sample solutions at every 6 h interval. The content of
bortezomib and impurity A, B, C, D, E, F and G,
bortezomib isomer, hydroxyamide and bortezomib ester
was determined in the test solutions. The prepared
mobile phase remained same during the study period.
Results and Discussion Method development and optimization: The present
study aimed to separate bortezomib and its impurities
from the analyte peak during stress studies. As a
preliminary study using chromatographic method
Impurities and degradation products were co-eluted by
using Inertsil ODS (250 mm x 4.6 mm x 4.5µm) with
different mobile phases such as phosphate, sulphate and
acetate buffers (pH 4.5) in a pump A and organic
modifiers including acetonitrile and methanol in a
pump B. This leads to merging of peak shapes. Then
resolution between the impurities and bortezomib was
improved using Zorbax Extend C18, 100 x 4.6 mm, 1.8
μm as a stationary phase with the reduced concentration
of acetonitrile in mobile phase. The results show that
there is no resolution between the impurities and
analyte was data not shown. To further optimize the
resolution and retention time of impurities, trails were
Jagadeswara Rao K et al. A validated reverse phase stability-indicating HPLC method for….
International Journal of Pharmaceutical Chemistry and Analysis, 3(3):150-161 153
carried out with different mobile phase ratios using
buffer and acetonitrile. The results indicate that the
isocratic trials were not successful in achieving a
favorable resolution between the impurity and
bortezomib peaks and the elution of the process
impurities. Therefore, a gradient method was selected
using buffer and acetonitrile as mobile phase A and B.
Different gradient programs were investigated and
satisfactory results were obtained with a gradient
program of 0.00/100, 10/61, 23/29, 24/0, 25/0, 26/100
and 31/100 (time (min) / %B) with a stationery phase
Zorbax Extend C18, 100 x 4.6 mm, 1.8µm diameter at a
flow rate of 0.9 ml/min. The results indicating that
column temperature was found to be 30°C and the
detection wavelength was maximum at 271 nm with an
injection volume injection volume of 10 µL for
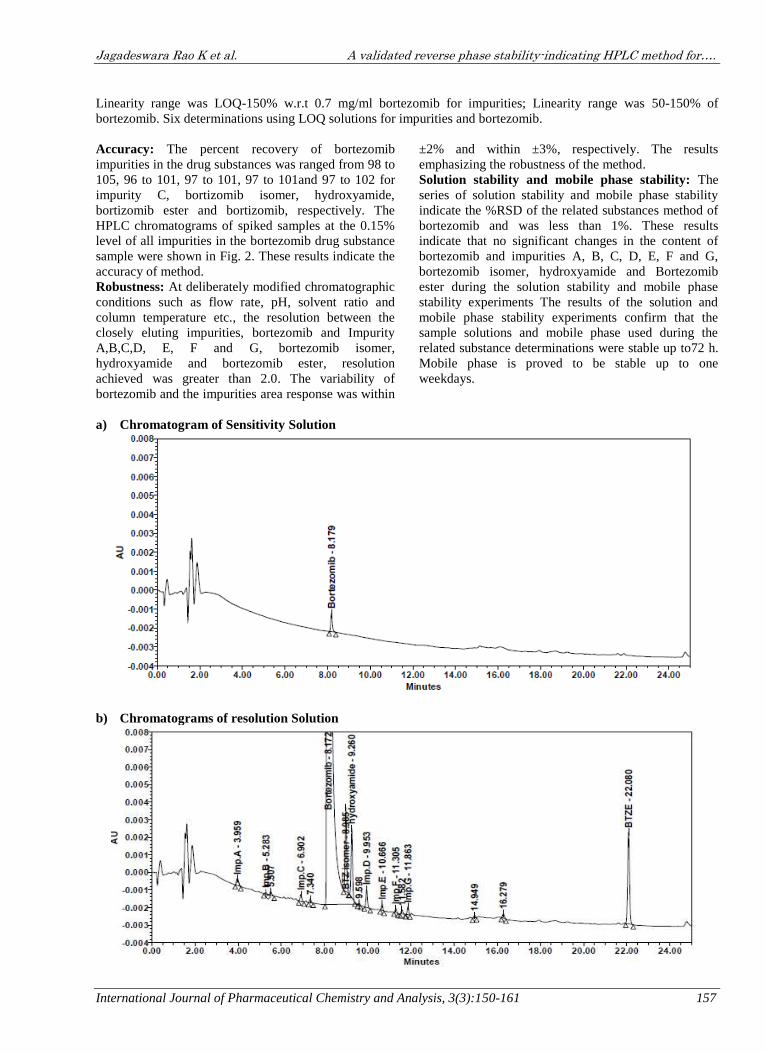
successful resolution (Fig. 2 (b))
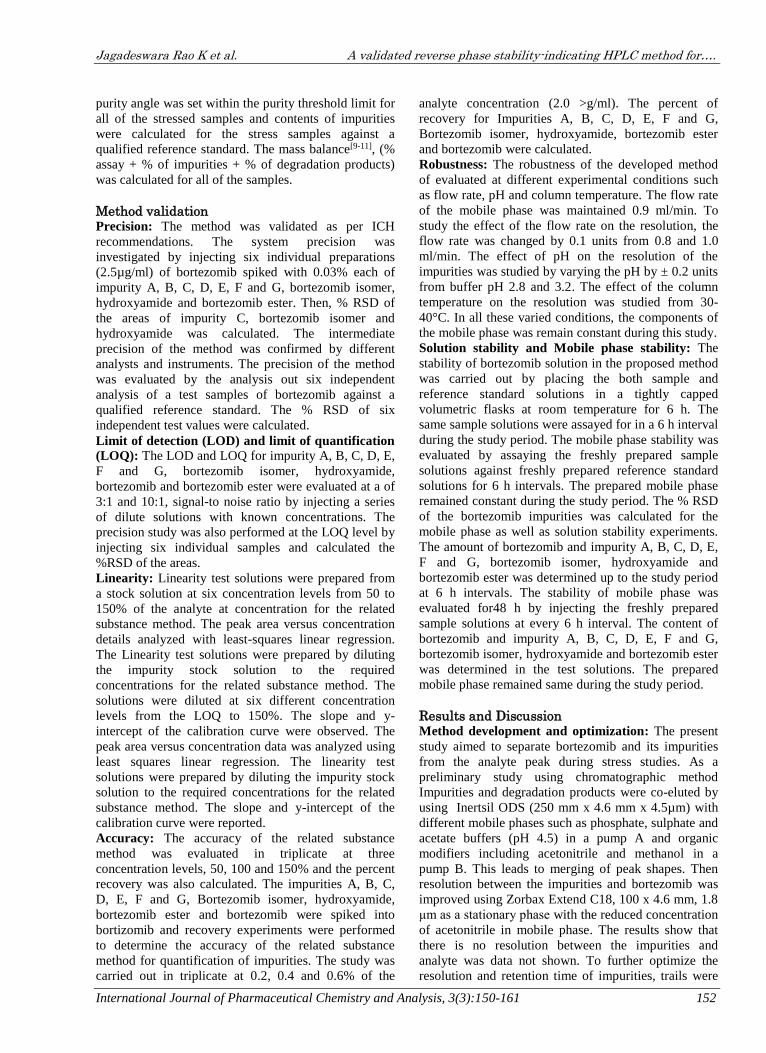
Method validation Precision: Then the method was validated in terms of
precision, linearity, accuracy, robustness, stability and
forced degradation studies as per ICH guidelines[12-16].
The % RSD of bortezomib retention and area was set at
≤ 5% (Table 4). The system precision average of
bortezomib retention time was observed at 8.8 min and
% RSD was 0.11. However, the system precision
average of bortezomib area was noticed at absorbance
of 4762034 and % RSD was 0.87. The system precision
retention time of the impurities in terms of % RSD was
0.27, 0.63, 0.10 and 0.87 for impurity C, bortezomib
isomer, hydroxyamide and bortezomib, respectively
(Table 5). The method precision study was carried out
within 10.0 % RSD. The results show that % RSD of
impurity C was 6.28%, bortezomib isomer was 2.66%
and hydroxyamide was 9.34% (Table 6). Batch
analysis of bortezomib samples were carried (Table 7)
and the results were expressed in % w/w. The results
demonstrate that % w/w of batch 1, 2 and 3 was 0.0260,
0.0243 and 0.0252, respectively for Impurity C; 0.0621,
0.0600 and 0.0590 respectively for bortezomib isomer;
0.0413, 0.0351 and 0.0406 respectively for
hydroxyamide and 99.8, 99.8 and 99.8 respectively for
bortezomib.
Table 4: System precision of bortezomb
S. No. Bortezomib Retention Time Bortezomib areas
1 8.77 4775402
2 8.78 4680395
3 8.78 4770777
4 8.78 4766702
5 8.79 4799746
6 8.78 4779182
Average 8.8 4762034
STDEV 0.01 41612.76
%RSD 0.11 0.87
Table 5: System precision retention times
Number of
injections
Retention Time
Retention of Imp. C (min) Retention of BTZ
isomer (min)
Retention of
hydroxyamide (min)
1 7.43 9.5 9.85
2 7.41 9.52 9.86
3 7.44 9.6 9.87
4 7.45 9.64 9.86
5 7.43 9.61 9.87
6 7.41 9.62 9.87
Average 7.4 9.6 9.9
STDEV 0.02 0.06 0.01
% RSD 0.27 0.63 0.1

Jagadeswara Rao K et al. A validated reverse phase stability-indicating HPLC method for….
International Journal of Pharmaceutical Chemistry and Analysis, 3(3):150-161 154
Table 6: Method precision Results of Impurity C, bortezomib Isomer and hydroxyamide
Sample No. % of Impurity
% of Impurity C % of BTZ isomer % of hydroxyamide
1 0.025 0.0621 0.0413
2 0.0243 0.0602 0.0394
3 0.022 0.0600 0.0351
4 0.0247 0.0615 0.0359
5 0.0219 0.0578 0.0452
6 0.0252 0.059 0.0406
Average 0.0239 0.0601 0.0396
STDEV 0.0015 0.0016 0.0037
% RSD 6.28 2.66 9.34
Table 7: Batch results of bortezomib
B. No. Batch Analysis
Imp. C BTZ isomer hydroxyamide Bortezomib
BTZ-001 0.026 0.0621 0.0413 99.8
BTZ-002 0.0243 0.06 0.0351 99.8
BTZ-003 0.0252 0.059 0.0406 99.8
a: Bortezomib
Molecular weight 384.2
b: Bortezomib isomer
Molecular weight 384.2
c: Hydroxyamide
Molecular weight 270.29
d: Impurity A
Molecular weight 270.29

Jagadeswara Rao K et al. A validated reverse phase stability-indicating HPLC method for….
International Journal of Pharmaceutical Chemistry and Analysis, 3(3):150-161 155
e: Impurity B
Molecular weight: 271.28
f: Impurity C
Molecular weight: 384.25
g: Impurity D
Molecular weight: 389.28
h: Impurity E
Molecular weight: 356.43
i: Impurity F
Molecular weight: 285.31
j: Impurity G
Molecular weight: 356.43
Jagadeswara Rao K et al. A validated reverse phase stability-indicating HPLC method for….
International Journal of Pharmaceutical Chemistry and Analysis, 3(3):150-161 156
k: Bortezomib ester
Molecular weight: 271.23
Fig. 1: Chemical structure of Bortezomib and its
impurities
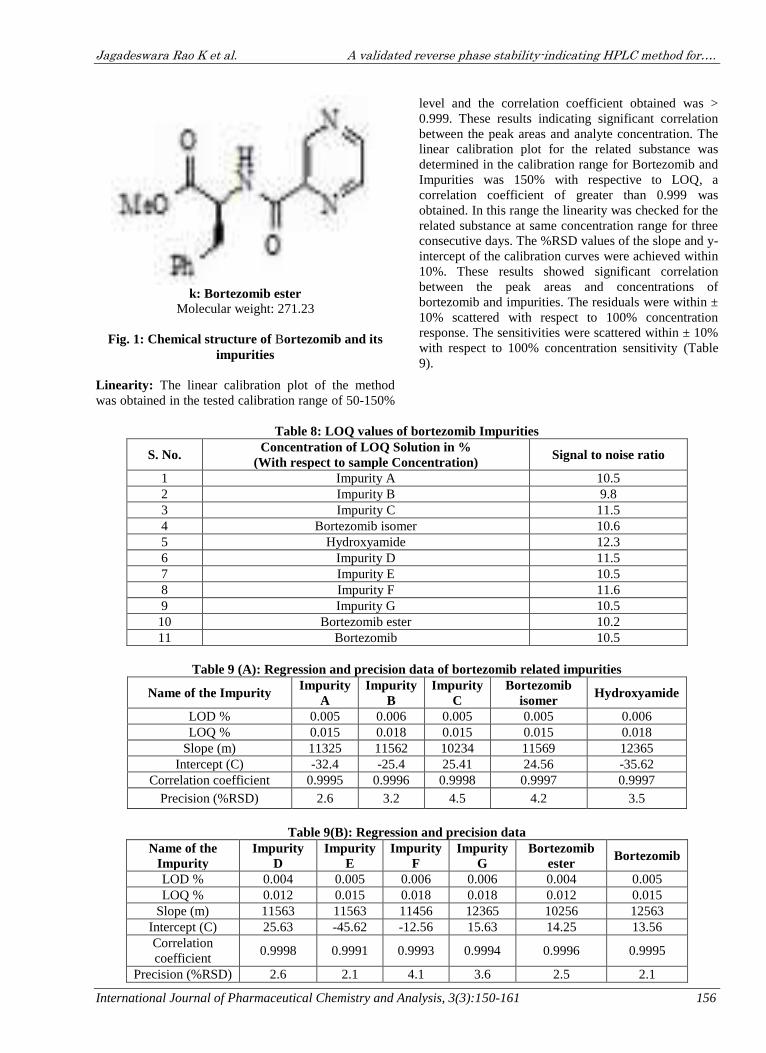
Linearity: The linear calibration plot of the method
was obtained in the tested calibration range of 50-150%
level and the correlation coefficient obtained was >
0.999. These results indicating significant correlation
between the peak areas and analyte concentration. The
linear calibration plot for the related substance was
determined in the calibration range for Bortezomib and
Impurities was 150% with respective to LOQ, a
correlation coefficient of greater than 0.999 was
obtained. In this range the linearity was checked for the
related substance at same concentration range for three
consecutive days. The %RSD values of the slope and y-
intercept of the calibration curves were achieved within
10%. These results showed significant correlation
between the peak areas and concentrations of
bortezomib and impurities. The residuals were within ±
10% scattered with respect to 100% concentration
response. The sensitivities were scattered within ± 10%
with respect to 100% concentration sensitivity (Table
9).
Table 8: LOQ values of bortezomib Impurities
S. No. Concentration of LOQ Solution in %
(With respect to sample Concentration) Signal to noise ratio
1 Impurity A 10.5
2 Impurity B 9.8
3 Impurity C 11.5
4 Bortezomib isomer 10.6
5 Hydroxyamide 12.3
6 Impurity D 11.5
7 Impurity E 10.5
8 Impurity F 11.6
9 Impurity G 10.5
10 Bortezomib ester 10.2
11 Bortezomib 10.5
Table 9 (A): Regression and precision data of bortezomib related impurities
Name of the Impurity Impurity
A
Impurity
B
Impurity
C
Bortezomib
isomer Hydroxyamide
LOD % 0.005 0.006 0.005 0.005 0.006
LOQ % 0.015 0.018 0.015 0.015 0.018
Slope (m) 11325 11562 10234 11569 12365
Intercept (C) -32.4 -25.4 25.41 24.56 -35.62
Correlation coefficient 0.9995 0.9996 0.9998 0.9997 0.9997
Precision (%RSD) 2.6 3.2 4.5 4.2 3.5
Table 9(B): Regression and precision data
Name of the
Impurity
Impurity
D
Impurity
E
Impurity
F
Impurity
G
Bortezomib
ester Bortezomib
LOD % 0.004 0.005 0.006 0.006 0.004 0.005
LOQ % 0.012 0.015 0.018 0.018 0.012 0.015
Slope (m) 11563 11563 11456 12365 10256 12563
Intercept (C) 25.63 -45.62 -12.56 15.63 14.25 13.56
Correlation
coefficient 0.9998 0.9991 0.9993 0.9994 0.9996 0.9995
Precision (%RSD) 2.6 2.1 4.1 3.6 2.5 2.1
Jagadeswara Rao K et al. A validated reverse phase stability-indicating HPLC method for….
International Journal of Pharmaceutical Chemistry and Analysis, 3(3):150-161 157
Linearity range was LOQ-150% w.r.t 0.7 mg/ml bortezomib for impurities; Linearity range was 50-150% of
bortezomib. Six determinations using LOQ solutions for impurities and bortezomib.
Accuracy: The percent recovery of bortezomib
impurities in the drug substances was ranged from 98 to
105, 96 to 101, 97 to 101, 97 to 101and 97 to 102 for
impurity C, bortizomib isomer, hydroxyamide,
bortizomib ester and bortizomib, respectively. The
HPLC chromatograms of spiked samples at the 0.15%
level of all impurities in the bortezomib drug substance
sample were shown in Fig. 2. These results indicate the
accuracy of method.
Robustness: At deliberately modified chromatographic
conditions such as flow rate, pH, solvent ratio and
column temperature etc., the resolution between the
closely eluting impurities, bortezomib and Impurity
A,B,C,D, E, F and G, bortezomib isomer,
hydroxyamide and bortezomib ester, resolution
achieved was greater than 2.0. The variability of
bortezomib and the impurities area response was within
±2% and within ±3%, respectively. The results
emphasizing the robustness of the method.
Solution stability and mobile phase stability: The
series of solution stability and mobile phase stability
indicate the %RSD of the related substances method of
bortezomib and was less than 1%. These results
indicate that no significant changes in the content of
bortezomib and impurities A, B, C, D, E, F and G,
bortezomib isomer, hydroxyamide and Bortezomib
ester during the solution stability and mobile phase
stability experiments The results of the solution and
mobile phase stability experiments confirm that the
sample solutions and mobile phase used during the
related substance determinations were stable up to72 h.
Mobile phase is proved to be stable up to one
weekdays.
a) Chromatogram of Sensitivity Solution
b) Chromatograms of resolution Solution

Jagadeswara Rao K et al. A validated reverse phase stability-indicating HPLC method for….
International Journal of Pharmaceutical Chemistry and Analysis, 3(3):150-161 158
c) Chromatograms of bortezomib and impurities under acid stress condition
d) Chromatograms of bortezomib and impurities under base stress condition
e) Chromatograms of bortezomib and impurities under oxidative stress condition

Jagadeswara Rao K et al. A validated reverse phase stability-indicating HPLC method for….
International Journal of Pharmaceutical Chemistry and Analysis, 3(3):150-161 159
f) Chromatograms of bortezomib and impurities under heat stress condition
g) Chromatograms of bortezomib and impurities under UV stress condition
h) Chromatograms of bortezomib and impurities UV stress condition
Forced degradation studies: Then bortezomib stressed
samples were subjected to forced degradation studies
using light and heat. significant degradation of the drug
substance and its products was detected with thermal,
acid and oxidation, which leading to the formation of
one major un known degradation product with RRT of
1.19 (Fig. 2 (C, D, E, F, G, H)). Peak purity test results
derived from the PDA detector confirmed that the
bortezomib peak and the degraded peaks were
homogeneous and pure in all of the analyzed stress
samples. The degradation studies were carried out for
the stress samples at 100>g/ml against a qualified
reference standard of bortezomib. The mass balance of
the stressed samples was close to 99.5%. These results
indicate that assay of bortezomib was unaffected by the
presence of bortezomib and Impurities A, B, C, D, E, F
and G, bortezomib isomer, hydroxyamide, and
bortezomib ester and its degradation products,
Jagadeswara Rao K et al. A validated reverse phase stability-indicating HPLC method for….
International Journal of Pharmaceutical Chemistry and Analysis, 3(3):150-161 160
confirming the stability-indicating power of the developed method (Table 10).
Table 10: Forced degradation bortezomib
S.
No.
Conc.
of
solution
mL add
stress agent
Temperature
(°C)
Time
in
Hours
Mass balance (%
assay + %
impurities + %
degradation
products)
%Total
Impurities Remarks
1 650 1 mL
Coc.HCl 35°C 1 93.1 2.5
Prominent
Degradation is
observed
2 650
0.5 mL of
24%
NH4OH
35°C 1 80.2 15.5
Prominent
Degradation is
observed
3 650 100uL of
3% H2O2 35°C 1 86.1 10.5
Prominent
Degradation is
observed
4 650
100 W Hg-
lamp (∼ 1m
distance)
35°C 1 85.7 12.0
Prominent
Degradation is
observed
5 650 Heating in
normal atm. 60°C 24 95.2 2.5
No Prominent
Degradation is
observed
6 1000
100 W Hg-
lamp (∼ 1m
distance)
35°C 72 90 7.5
Prominent
Degradation is
observed
7 1000 Heating in
normal atm. 100°C 5 88.6 8.5
Prominent
Degradation is
observed
8 650 Unstressed 99.3 0.25
Conclusion The degradation pathway of bortezomib was
established as per ICH recommendations[17-21]. The
gradient LC method was developed and used for stress
studies also fit for quantitative impurities of bortezomib
drug product. The behavior of bortezomib under
various stress conditions was studied. The thermal and
all of the degradation products and process impurities
were well separated from the bortezomib and related
impurities demonstrates the stability-indicating power
of the method. This method is sensitive and can be
detected up to 0.002% impurities. This method was
precise, accurate and stability indicative. The method
was validated as per ICH recommendations. The
developed method can be used to determine the
impurities in bortezomib injection in the routine and
stability sample analysis[17-21].
Acknowledgements The authors wish to thank the management of
Terra Scientific Pvt. Ltd, Hyderabad and India for
supporting this work. We thank management of
GITAM University for supporting research work.
References 1. Richardson PG, Mitsiades C, Schlossman R. Bortezomib
in the frontline treatment of multiple myeloma. Expert
Review of Anticancer Therapy 2008:8:1053–1072.
2. Mikhael J, Chang H. Bortezomib: proteasome inhibition
as a novel mechanism of cancer therapy-implications for
hematological malignancies. Letters in Drug Design &
Discovery 2007;4:82–86.
3. Kasa Srinivasulu, Mopidevi Narasimha Naidu,
Kadaboina Rajasekhar, Murki Veerender, Mukukutla
Venkata Suryanarayana. Development and validation of a
Stability indicating LC method for the Assay and related
substances determination of a Proteasome Inhibitor.
2012:2012:13.
4. Smith MB, March J. March's Advanced Organic
Chemistry, John Wiley &Sons, Hoboken, NJ, USA, 6th
edition,2007.
5. Pitt B, Remme W, Zannad F, Bortezomib Post-Acute
Myocardial Infarction Heart Failure Efficacy and
Survival Study Investigators, ACC Current Journal
Review. 2003;12:57B.
6. Venkataramanna M, Sudhakar Babu K, Anwar sulaiman
KC. A validated stability-Indicating UF LC method for
Bortezomib in the presence of degradation products and
its process- related impurities. 2012:2.
7. Utage M, Dr. Swamy BMV. Stability indicating HPLC
Method for Estimation of Bortezomib for injection 3.5
mg/ vial. 2013:2:2
8. Burgess E, Niegowksa J, Tan KW, Kipnes MS, Roniker
B, Patrick J. L, et al. Bortezomib 016 Investigators
American Journal of Hypertension. Volume 15, Issue
2002; 1: A23, A57-A58.
9. Bruce A, Pearlman, Amphlett G, Padilla, John T, Hach,
Jeffrey L, et al. Havens, and Muniraj D, Pillai A, New
Approach to the Furan Degradation Problem Involving
ozonolysis of the trans- Enedione and Its Use in a Cost-
Effective Synthesis of Bortezomib Chemical Research

Jagadeswara Rao K et al. A validated reverse phase stability-indicating HPLC method for….
International Journal of Pharmaceutical Chemistry and Analysis, 3(3):150-161 161
and Development, Pfizer, Incorporated, Kalamazoo,
Michigan. 2006:8:2111–2113.
10. Zhang Ji Y, Douglas M Fast, Alan P. Bureau, Journal of
Chromatography B. 2003:787:333-344.
11. Rane VP, Patil KR, Sangshetti JN, Yeole RDV, Shinde
DB. Stability-indicating RP-HPLC method for analysis of
bortezomib in the bulk drug and in a pharmaceutical
dosage form.2009:21:619-629.
12. ICH Q2 (R1), Validation of analytical procedures: Text
and methodology, 2005.
13. ICH Q1 (R2), Stability testing of New Drug Substances
and Products, 2000.
14. ICH, Photo stability testing of new drug substances and
products Q1B.
15. Singh S, Bakshi M. 200:24:1-14.
16. ICH Guidelines on validation of analytical Procedures
definitions and terminology.
17. Drug stability principles and practices third edition,
edited by Jens T, Carstensen Rhodes CT. 2000.
18. Bakshi M, Singh S, Development of validated stability
indicating assay methods critical review. J Pharm
Biomed. 2002:28:1011-1040.
19. Validation of compendial methods The United States
Pharmacopeia.2016:42.
20. Jens T, Carstensen, Rhodes CT, Drug stability principles
and practices, Marcel Dekker, New York, 2000.
21. ICH Stability Testing of New Drug Substances and
Products Q1A (R2), International Conference on
Harmonization, IFPMA, Geneva, 2003.