forced degradation studies for therapeutic proteins - ebe€¦ · · 2017-06-26forced degradation...
TRANSCRIPT
European Biopharmaceutical Enterprises (EBE), a specialised group of EFPIA
Leopold Plaza Building Rue du Trône 108
BE-1050 Brussels www.ebe-biopharma.org [email protected]
EBE
Concept Paper
Forced Degradation Studies for Therapeutic Proteins
March 24, 2015
EBE: Concept Paper – Forced Degradation Studies for Therapeutic Proteins
2
Table of Content
1 Executive summary ............................................................................................................... 5
2 Objective / Scope .................................................................................................................. 5
3 Definitions ............................................................................................................................ 6
4 Preparation of forced degraded material .............................................................................. 6
5 Selection of stability indicating analytical methods ............................................................... 7
6 Understanding of possible degradation pathways ................................................................. 8
7 Application of FDS for molecule development ..................................................................... 11 7.1 Use for selection of research candidates ................................................................................... 11 7.2 Use for formulation selection ................................................................................................... 13 7.3 Use for manufacturing process development ............................................................................ 13 7.4 Conclusion ................................................................................................................................ 13
8 FDS applied to comparability studies ................................................................................... 14 8.1 Case study 1 – comparison of kinetics of degradation – example of an antibody drug conjugate 14 8.2 Case study 2 – “dynamic” comparison of kinetics of degradation – example of a monoclonal antibody ............................................................................................................................................... 15 8.3 Case study 3 – “static comparison” of pre-‐ and post-‐change – example of a monoclonal antibody 17_Toc414972453 8.4 Statistical evaluation of degradation – discussion on acceptance criteria .................................. 19
9 Photostability ...................................................................................................................... 19
10 Overall conclusion ............................................................................................................... 23
11 Acknowledgements ............................................................................................................. 23
12 References .......................................................................................................................... 23
EBE: Concept Paper – Forced Degradation Studies for Therapeutic Proteins
3
Abbreviations
ADC Antibody Drug Conjugate ANCOVA Analysis of Co-variance
API Active Pharmaceutical Ingredient AUC Analytical UltraCentrifugation
CD Circular Dichroism CEX Cation Exchange
(p)CQA (potential) Critical Quality Attribute DLS Dynamic Light Scattering
DP Drug Product DS Drug Substance
DSC Differential Scanning Calorimetry EBE European Biopharmaceutical Enterprises
FDA Food and Drug Administration FDS Forced Degradation Studies
FTIR Fourier Transform InfraRed GMP Good Manufacturing Practices
HC Heavy Chain HDX Hydrogen Deuterium Exchange
HMW High Molecular Weight HOS Higher Order Structure
HPLC High Performance Liquid Chromatography ICH International Conference on Harmonisation
(c) IEF (Capillary) IsoElectric Focusing IEX Ion Exchange
LC Light Chain LC-MS-MS Liquid Chromatography – Mass Spectrometry – Mass Spectrometry
LMW Low Molecular Weight Mab Monoclonal Antibody
PTM Post Translational Modifications RPM Revolution Per Minute
SDS-PAGE Sodium Dodecylsulfate-Polyacrylamide Gel Electrophoresis SE Size Exclusion
EBE: Concept Paper – Forced Degradation Studies for Therapeutic Proteins
4
SEC Size Exclusion Chromatography UPLC Ultra Performance Liquid Chromatography
W Watts Glossary
Static analysis Analysis performed on a stressed sample at a given time point (e.g. stressed for 4 weeks at 40°C)
Dynamic analysis Analysis performed on a stressed sample at different time points to evaluate the kinetics of degradation.

EBE: Concept Paper – Forced Degradation Studies for Therapeutic Proteins
5
1 Executive summary
Forced degradation studies (FDS) are performed on API and/or DP to determine possible product degradation pathways under various stress conditions such as temperature, pH, light, exposure to oxidising agents and mechanical stress. Currently, there are no industry guidelines available defining how to perform FDS. The purpose of this concept paper is to assess current practices for the use of FDS for therapeutic proteins in industry based on the experience of the EBE member companies. This document does not define regulatory requirements for FDS but provides a guidance for biopharmaceutical companies when performing FDS. This paper highlights forced degradation study considerations such as understanding quality attributes, the approaches to select analytical methods and the application of FDS to understand relevant degradation pathways of therapeutic proteins. This paper also provides details on how FDS can be utilised to demonstrate comparability between products and aid in the selection of drug candidates.
A number of case studies have been provided as examples to highlight the potential application of FDS such as comparison of static analysis for pre- and post-process changes for a monoclonal antibody and comparison of kinetics of degradation for monoclonal antibodies, antibody drug conjugates and other proteins. These case studies provide examples of approaches to perform a FDS and how these studies can provide improved understanding of the stability profile for therapeutic proteins. Other approaches than those presented here might be applicable as well.
2 Objective / Scope
The purpose of the concept paper is to provide industry with current practices in the field of FDS for therapeutic proteins based on the experience of the EBE member companies. This document aims to provide guidance for biopharmaceutical companies to plan for FDS. This document does not aim at defining any regulatory requirement. The goal of this document is to discuss considerations on how FDS can be used in the frame of:
• Selection of stability indicating analytical methods
• Understanding of possible degradation pathways of API or DP (to understand quality attributes)
• Selection of drug candidates in research
• Formulation and manufacturing process development
• Comparability assessments. This document will define the purpose of FDS and provide guidance on the different FDS conditions that can be applied and how these can be used in various studies.
ICH stability studies under recommended and accelerated conditions are out of scope of this document, as well as conditions mimicking in vivo degradation (e.g. spiked serum). Specificities linked to biosimilarity evaluation are also out of scope of this document. Temperature stressed stability conditions are considered as part of FDS.
EBE: Concept Paper – Forced Degradation Studies for Therapeutic Proteins
6
3 Definitions
A forced degradation study is the intentional degradation of the API and/or DP to an appropriate extent by means of various stress conditions such as pH, temperature, light, oxidising agents, mechanical stress. 4 Preparation of forced degraded material
Biological products usually degrade via different pathways following different kinetics (first order to higher order). The extent of degradation considered appropriate for FDS cannot be unequivocally established and may vary from product to product. The extent of degradation should be targeted depending also on the knowledge of the molecule (e.g. considering pCQAs, biological activity etc.) and of the variability of the technique/method used to measure the degraded product. An excessive level of degradation may not be representative of degradation observed under normal manufacturing and storage conditions and may lead to difficult interpretation of the results as it could be the result of further degradation of degradants. There may also be situations where a reasonable level of stress would not induce significant changes to a resistant molecule. The starting material used for FDS should be as representative as possible of the API or of the DP material produced by the process being evaluated. The choice of the storage containers for the samples used for FDS is also important to avoid possible artifacts related to the container material itself, especially under stressing conditions. They should, where possible, be representative of the containers used to store the API or the DP material. The samples from early development phases can be stored at -70°C until the FDS is performed during a later development phase. For the evaluation of analytical methods, the following approaches to generate forced degraded material can be used:
- Option 1: Stress a small but sufficient amount of material to evaluate a method at a given time point and re-prepare a new batch of forced degraded material when a new method is developed.
- Option 2: Prepare a large amount of forced degraded material representative of the current development phase and store this material at an appropriate storage temperature e.g. -70°C for use throughout the product development phase.
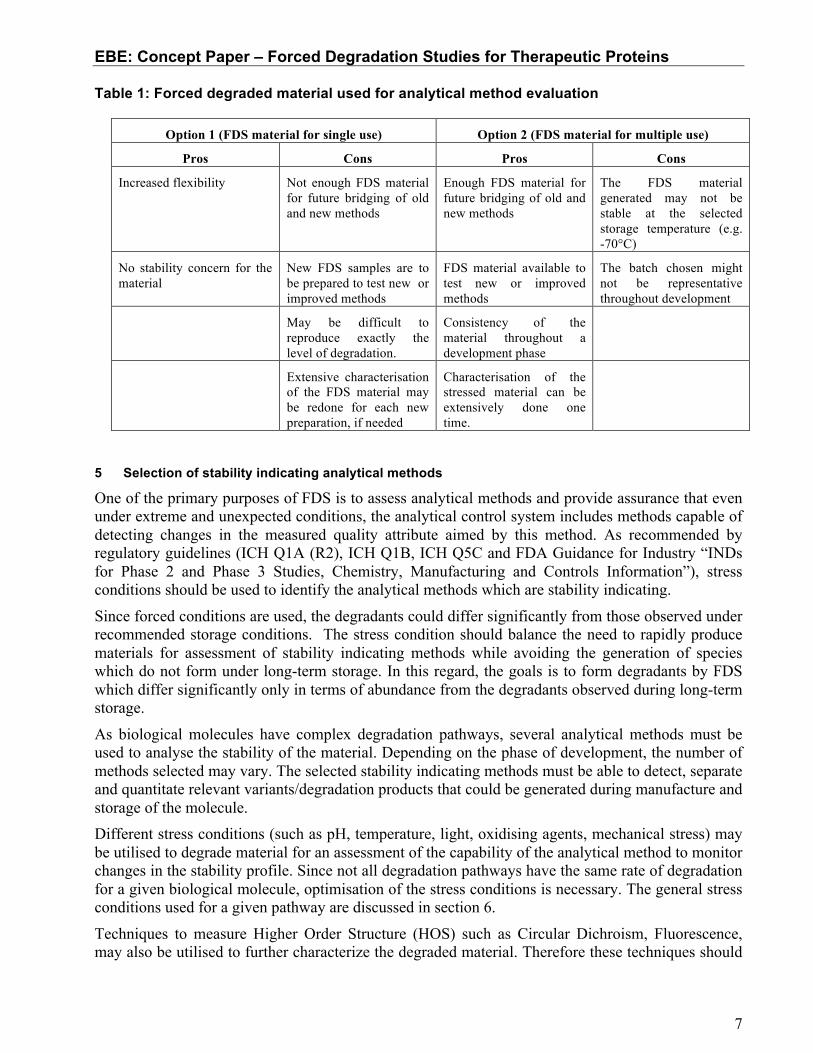
Both options have pros and cons (Table 1), and either one or the other may be used depending on the particular situation. Other alternatives may also be appropriate.
EBE: Concept Paper – Forced Degradation Studies for Therapeutic Proteins
7
Table 1: Forced degraded material used for analytical method evaluation
Option 1 (FDS material for single use) Option 2 (FDS material for multiple use)
Pros Cons Pros Cons
Increased flexibility Not enough FDS material for future bridging of old and new methods
Enough FDS material for future bridging of old and new methods
The FDS material generated may not be stable at the selected storage temperature (e.g. -70°C)
No stability concern for the material
New FDS samples are to be prepared to test new or improved methods
FDS material available to test new or improved methods
The batch chosen might not be representative throughout development
May be difficult to reproduce exactly the level of degradation.
Consistency of the material throughout a development phase
Extensive characterisation of the FDS material may be redone for each new preparation, if needed
Characterisation of the stressed material can be extensively done one time.
5 Selection of stability indicating analytical methods
One of the primary purposes of FDS is to assess analytical methods and provide assurance that even under extreme and unexpected conditions, the analytical control system includes methods capable of detecting changes in the measured quality attribute aimed by this method. As recommended by regulatory guidelines (ICH Q1A (R2), ICH Q1B, ICH Q5C and FDA Guidance for Industry “INDs for Phase 2 and Phase 3 Studies, Chemistry, Manufacturing and Controls Information”), stress conditions should be used to identify the analytical methods which are stability indicating.
Since forced conditions are used, the degradants could differ significantly from those observed under recommended storage conditions. The stress condition should balance the need to rapidly produce materials for assessment of stability indicating methods while avoiding the generation of species which do not form under long-term storage. In this regard, the goals is to form degradants by FDS which differ significantly only in terms of abundance from the degradants observed during long-term storage.
As biological molecules have complex degradation pathways, several analytical methods must be used to analyse the stability of the material. Depending on the phase of development, the number of methods selected may vary. The selected stability indicating methods must be able to detect, separate and quantitate relevant variants/degradation products that could be generated during manufacture and storage of the molecule. Different stress conditions (such as pH, temperature, light, oxidising agents, mechanical stress) may be utilised to degrade material for an assessment of the capability of the analytical method to monitor changes in the stability profile. Since not all degradation pathways have the same rate of degradation for a given biological molecule, optimisation of the stress conditions is necessary. The general stress conditions used for a given pathway are discussed in section 6.
Techniques to measure Higher Order Structure (HOS) such as Circular Dichroism, Fluorescence, may also be utilised to further characterize the degraded material. Therefore these techniques should

EBE: Concept Paper – Forced Degradation Studies for Therapeutic Proteins
8
also be evaluated for suitability to measure degraded material even though they are not meant to be used for release or stability testing.
In the case of potency assays or of certain biophysical assays (e.g. HOS assays), a greater degree of degradation may be needed to demonstrate a change in activity or structure due to the higher variability of these methods. A higher extent of degradation may be needed to demonstrate a change in activity or in structure compared to physico-chemical methods. In this regard, a high level of stress, well outside the expected routine conditions, may be needed. Depending on the location of the change and mode of action of the molecule, even changes in structure may not impact the activity of the molecule as measured by potency assays. The formulation of the sample is also very important for the success of the method evaluation. Certain formulation components may already preserve the molecule from specific degradation (e.g. aggregation, oxidation) that may occur in their absence. In the case of lyophilised formulations, it is advisable to perform FDS on both the API and on the reconstituted cake. The intent here is to provide knowledge about the capabilities of the analytical methods with the caveat that the information on the degradation pathways observed in the liquid state will likely be different from those for the lyophilized product.
6 Understanding of possible degradation pathways
FDS can be performed to understand the critical quality attributes of a molecule by highlighting the degradation routes. Degradation routes more likely to occur during routine manufacturing and storage should be leveraged to ensure relevant degradation pathways are identified and characterised.
Product platform knowledge can be used to determine the choice of stress conditions and analytical methods to be used based on the likelihood of the molecule to be degraded via a particular degradation pathway. The list below provides examples of typical quality attributes to monitor in an FDS study:
- Primary structure (amino acid modification and/or clipping) - Size variants (aggregates/HMW species, fragments)
- Charge variants (e.g. deamidation) - Oligosaccharide profile (if applicable)
- Glycation (if applicable) - Pegylation (if applicable)
- Potency (if known/suspected to change under FDS conditions) - Oxidation
Various stressing conditions or agents can be investigated. Examples include the following: - Elevated temperature (at least 10°C increment above the accelerated testing temperature as
recommended by ICH Q1A and below the lowest melting temperature Tm) - Freeze/Thawing
- Low and high pH (e.g., below pH 4 and above pH 8 also combined with elevated temperature if needed, for deamidation)

EBE: Concept Paper – Forced Degradation Studies for Therapeutic Proteins
9
- Oxidising conditions (chemical agent such as hydrogen peroxide, t-butyl hydroperoxide or 2.2’-azobis(2-amidinopropane) dihydrochloride (AAPH))
- Light (e.g. using conditions prescribed in ICH Q1B or milder conditions depending on the molecule)
- Agitation - Addition of metals (may lead to oxidation)
- UV exposure (may lead to aggregation or to a detectable change in higher order structure) The conditions should be defined / optimised case-by-case and proper controls should be used (e.g. dark control for light stress). All conditions are compared to a reference sample which can either be the same batch of API or a representative sample like the reference standard (if sufficiently available), however it can be easier to compare quality attributes using the same batch of material as a control.
It is recommended to not only evaluate degradation at an end point condition (referenced as “static” condition in this document), but also in certain cases (e.g. comparability, structure/function studies) to consider whether beneficial information can be obtained from a kinetics study by adding intermediate time points.
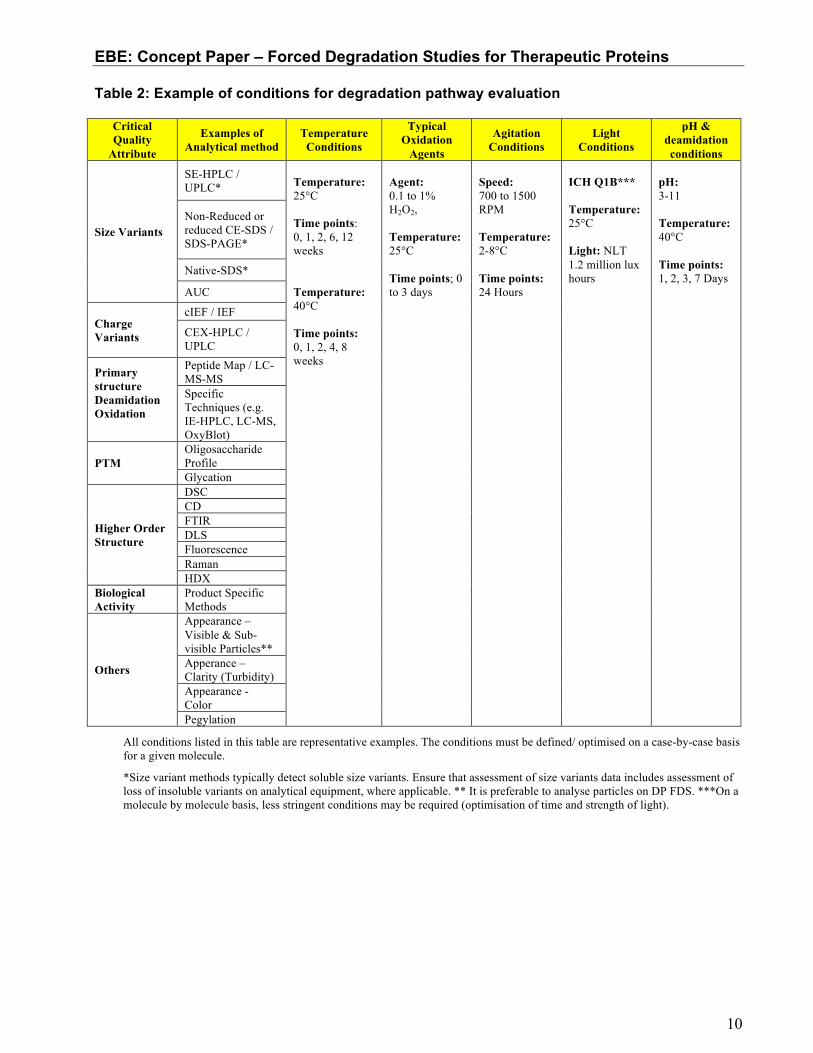
Table 2 shows an example of parameters and conditions that can be tested to evaluate the degradation pathways of a molecule.
EBE: Concept Paper – Forced Degradation Studies for Therapeutic Proteins
10
Table 2: Example of conditions for degradation pathway evaluation
Critical Quality
Attribute
Examples of Analytical method
Temperature Conditions
Typical Oxidation
Agents
Agitation Conditions
Light Conditions
pH & deamidation conditions
Size Variants
SE-HPLC / UPLC*
Temperature: 25°C Time points: 0, 1, 2, 6, 12 weeks Temperature: 40°C Time points: 0, 1, 2, 4, 8 weeks
Agent: 0.1 to 1% H2O2, Temperature: 25°C Time points; 0 to 3 days
Speed: 700 to 1500 RPM Temperature: 2-8°C Time points: 24 Hours
ICH Q1B*** Temperature: 25°C Light: NLT 1.2 million lux hours
pH: 3-11 Temperature: 40°C Time points: 1, 2, 3, 7 Days
Non-Reduced or reduced CE-SDS / SDS-PAGE*
Native-SDS*
AUC
Charge Variants
cIEF / IEF
CEX-HPLC / UPLC
Primary structure Deamidation Oxidation
Peptide Map / LC-MS-MS Specific Techniques (e.g. IE-HPLC, LC-MS, OxyBlot)
PTM Oligosaccharide Profile Glycation
Higher Order Structure
DSC CD FTIR DLS Fluorescence Raman HDX
Biological Activity
Product Specific Methods
Others
Appearance – Visible & Sub-visible Particles** Apperance – Clarity (Turbidity) Appearance - Color Pegylation
All conditions listed in this table are representative examples. The conditions must be defined/ optimised on a case-by-case basis for a given molecule.
*Size variant methods typically detect soluble size variants. Ensure that assessment of size variants data includes assessment of loss of insoluble variants on analytical equipment, where applicable. ** It is preferable to analyse particles on DP FDS. ***On a molecule by molecule basis, less stringent conditions may be required (optimisation of time and strength of light).

EBE: Concept Paper – Forced Degradation Studies for Therapeutic Proteins
The degraded samples are at first screened by a limited number of methods such as SE-H/UPLC, CEX-H/UPLC, CE-SDS or SDS-PAGE to identify major changes. Based on the results obtained, the phase of development and the total number of samples, a selective analysis by other more sophisticated methods can be performed.
To minimize the impact of the analytical method variability and to allow a more accurate comparison of the stressed material with the controls, it is recommended, where possible to store the material at -70°C, and to evaluate the samples in a side-by-side analysis (see as example Figure 7 for gel electrophoresis) or a single analytical run (e.g. HPLC). This is especially helpful for kinetic studies to compare degradation rates. 7 Application of FDS for molecule development
7.1 Use for selection of research candidates
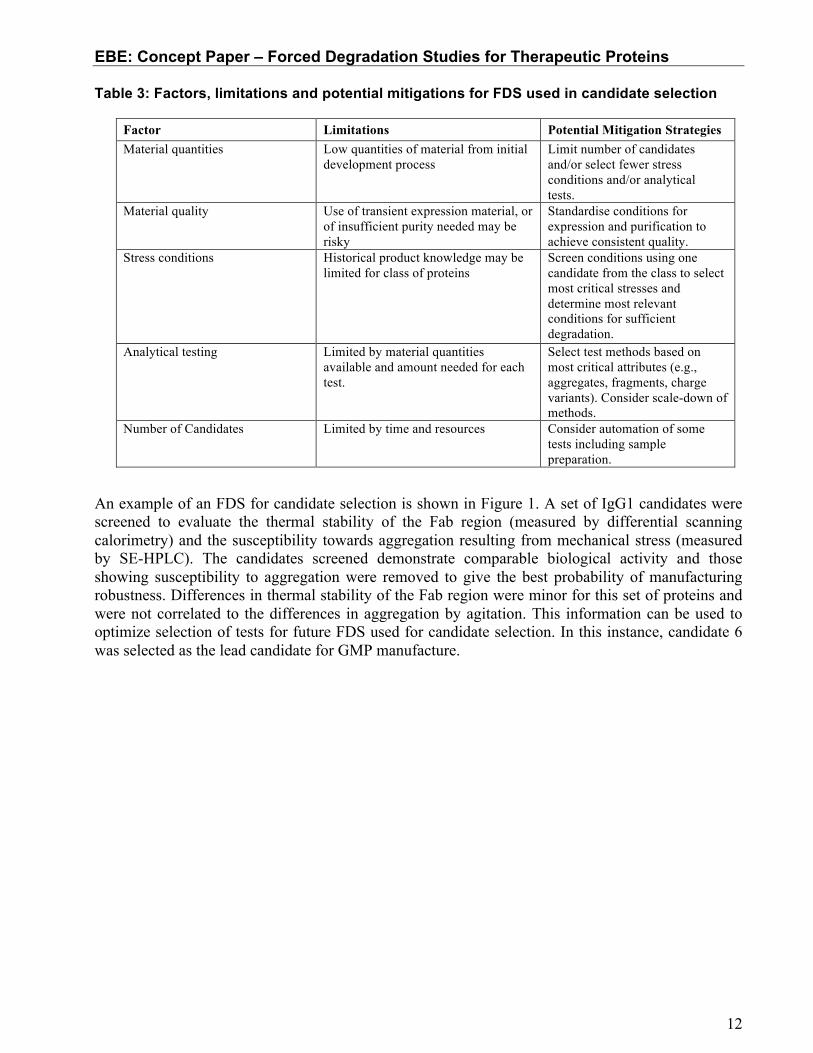
FDS can provide very useful information to select research candidates. The goal is to identify the best or optimal molecule from a pool of candidates using FDS such that the molecule chosen for clinical development has reasonable degradation properties. If institutional experience with the class of proteins is not available, a panel of forced degradation conditions suitable for the particular class of proteins can be applied before screening a set of candidates. A test panel can be selected to quantitatively or qualitatively evaluate the impact to quality attributes such as primary structure and post-translational modifications, higher order structure, charge, size variants and biological activity. Practical considerations, which limit the scope of FDS, such as availability of sufficient quantities of material, may necessarily restrict the number of stress conditions and tests which can be used for the evaluation at the early development stage. Decisions regarding which quality attributes to monitor during FDS have to be made using these considerations and the available product knowledge from initial screening studies. Additionally, FDS in early development for candidate selection are used to evaluate the fundamental stability of the molecule prior to the introduction of any manufacturing process controls, since the final drug substance and drug product processes have not been developed. For example, the pathways that dominate under heat stress conditions in certain buffer compositions may not be the same as those in the final formulation. Table 3 highlights the factors to be considered and potential mitigation strategies.
EBE: Concept Paper – Forced Degradation Studies for Therapeutic Proteins
12
Table 3: Factors, limitations and potential mitigations for FDS used in candidate selection
Factor Limitations Potential Mitigation Strategies Material quantities Low quantities of material from initial
development process Limit number of candidates and/or select fewer stress conditions and/or analytical tests.
Material quality Use of transient expression material, or of insufficient purity needed may be risky
Standardise conditions for expression and purification to achieve consistent quality.
Stress conditions Historical product knowledge may be limited for class of proteins
Screen conditions using one candidate from the class to select most critical stresses and determine most relevant conditions for sufficient degradation.
Analytical testing Limited by material quantities available and amount needed for each test.
Select test methods based on most critical attributes (e.g., aggregates, fragments, charge variants). Consider scale-down of methods.
Number of Candidates Limited by time and resources Consider automation of some tests including sample preparation.
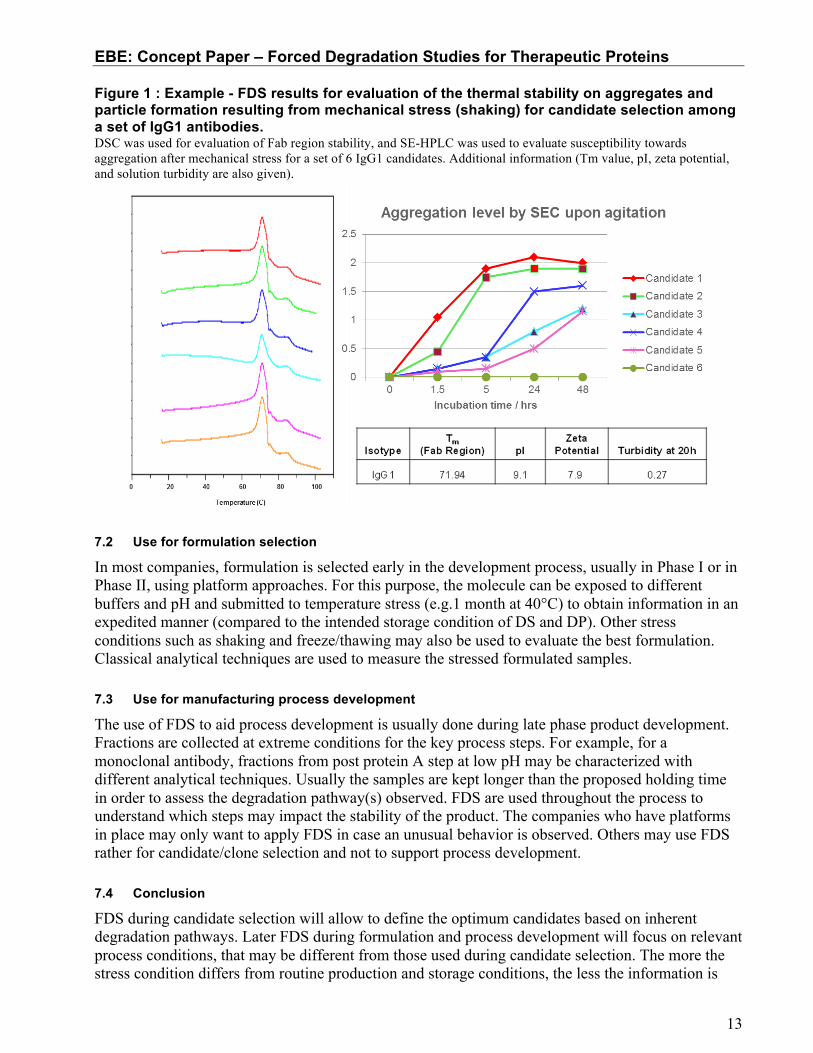
An example of an FDS for candidate selection is shown in Figure 1. A set of IgG1 candidates were screened to evaluate the thermal stability of the Fab region (measured by differential scanning calorimetry) and the susceptibility towards aggregation resulting from mechanical stress (measured by SE-HPLC). The candidates screened demonstrate comparable biological activity and those showing susceptibility to aggregation were removed to give the best probability of manufacturing robustness. Differences in thermal stability of the Fab region were minor for this set of proteins and were not correlated to the differences in aggregation by agitation. This information can be used to optimize selection of tests for future FDS used for candidate selection. In this instance, candidate 6 was selected as the lead candidate for GMP manufacture.
EBE: Concept Paper – Forced Degradation Studies for Therapeutic Proteins
13
Figure 1 : Example - FDS results for evaluation of the thermal stability on aggregates and particle formation resulting from mechanical stress (shaking) for candidate selection among a set of IgG1 antibodies. DSC was used for evaluation of Fab region stability, and SE-HPLC was used to evaluate susceptibility towards aggregation after mechanical stress for a set of 6 IgG1 candidates. Additional information (Tm value, pI, zeta potential, and solution turbidity are also given).
7.2 Use for formulation selection
In most companies, formulation is selected early in the development process, usually in Phase I or in Phase II, using platform approaches. For this purpose, the molecule can be exposed to different buffers and pH and submitted to temperature stress (e.g.1 month at 40°C) to obtain information in an expedited manner (compared to the intended storage condition of DS and DP). Other stress conditions such as shaking and freeze/thawing may also be used to evaluate the best formulation. Classical analytical techniques are used to measure the stressed formulated samples.
7.3 Use for manufacturing process development
The use of FDS to aid process development is usually done during late phase product development. Fractions are collected at extreme conditions for the key process steps. For example, for a monoclonal antibody, fractions from post protein A step at low pH may be characterized with different analytical techniques. Usually the samples are kept longer than the proposed holding time in order to assess the degradation pathway(s) observed. FDS are used throughout the process to understand which steps may impact the stability of the product. The companies who have platforms in place may only want to apply FDS in case an unusual behavior is observed. Others may use FDS rather for candidate/clone selection and not to support process development.
7.4 Conclusion
FDS during candidate selection will allow to define the optimum candidates based on inherent degradation pathways. Later FDS during formulation and process development will focus on relevant process conditions, that may be different from those used during candidate selection. The more the stress condition differs from routine production and storage conditions, the less the information is
EBE: Concept Paper – Forced Degradation Studies for Therapeutic Proteins
14
relevant to candidate selection, comparability assessment, formulation and manufacturing process development. 8 FDS applied to comparability studies
FDS can also be performed to assess comparability and whether planned changes to the manufacturing process alter the degradation pathways or rates of degradation of the molecule. The use of FDS may reveal slight differences in the structure of the molecule that would not be detectable otherwise through a typical stability study. The information gained by an FDS could trigger additional studies to understand the basis for the differences in degradation between pre- and post-change materials. Comparison can be done under either a given condition (“static comparison”) or at different time points (multiple time points are required) to evaluate the kinetics of degradation (“dynamic comparison”). Importantly, compared to routine stability studies conducted under intended and accelerated conditions, FDS can also expedite understanding whether or not the planned changes to the manufacturing process impact stability. FDS cannot be used alone for comparability studies, but as a tool in addition to release data, to characterization data and to routine stability studies (such as those conducted per ICH). For stressed stability comparisons, head-to-head studies of pre- and post-change materials using multiple time points should be preferably used, where possible, to evaluate degradation pathways. Such FDS studies can be used for both drug substance and drug product evaluation.
Exposing pre-process-change and the post-process-change material to forced degradation conditions side-by-side reduces the contribution of analytical method variability and the variability of the FDS study itself relating to exposure, storage and handling conditions. The number of batches involved in the comparability and the extent of testing is usually increased for late phases of development and for commercial product compared to early phase programs. Indeed, for early phase products, the number of batches for each condition may be limited. The number of batches considered for the study may also influence the relevance of the statistical analysis used.
In some cases, the use of pre-determined numerical assessment criteria for the comparison of degradation profiles and rate of degradation is not possible nor appropriate. A minimum best practice criterion, though, is that no new species with relevant intensity appear in the stressed post-change material, as compared to the stressed pre-change material. Several case studies are presented below illustrating possible approaches to set assessment criteria together with their limitations. Other approaches may be fully acceptable.
Any stressing agent, relevant for the molecule of interest can be used. Examples with temperature as the stress condition will be illustrated in this section.
Importantly, comparability studies may be performed after the implementation of a change intended to improve the process and/or product quality. In this case, comparability studies and FDS can provide valuable confirmation of the expected outcome of the process change to support the clinical/commercial use of the product manufactured by the revised process.
8.1 Case study 1 – comparison of kinetics of degradation – example of an antibody drug conjugate
A side-by-side study was conducted to compare two main degradation pathways (increases in soluble aggregates & fragments) of one pre-change batch with one post-change batch for an antibody-drug conjugate (ADC). Four weeks at +40°C was selected as the stress condition based on previous knowledge on this product. Dimer content, the sum of other High Molecular Weight (HMW) and

EBE: Concept Paper – Forced Degradation Studies for Therapeutic Proteins
15
Low Molecular Weight (LMW) components (fragments) determined by Size Exclusion Chromatography (SEC) were plotted against time. Rates of degradation of pre- and post-change batch were compared by calculation of the ratio of the slopes for each species. The acceptance criteria were selected for this example as 80-125% based on preliminary discussions with health authorities (FDA). Plots of dimer and fragment versus time are provided in Figure 2 and Figure 3, respectively. Slope ratios (post-change/pre-change) were obtained as 100% and 90%, respectively, for dimer and fragment. A slope ratio of 96% was also measured for “other HMWs increase” (Graph not shown). Figure 2 : Dimer increase by SEC
Figure 3 : LMWs increase by SEC
8.2 Case study 2 – “dynamic” comparison of kinetics of degradation – example of a monoclonal antibody
In this example, three batches of pre-change and three batches of post-change material were submitted to the stressed stability study at 25°C for 12 weeks. The kinetics of degradation pre- and post-change have been compared using the pooling criterion described in ICHQ1E. The equality of the model (slope and intercept) was evaluated through a co-variance analysis, at a level of significance of 0.25. Three models are possible:
- Model 1: Simple common regression model (same intercept and same slope, profiles are homogeneous)
EBE: Concept Paper – Forced Degradation Studies for Therapeutic Proteins
16
- Model 2: Common slope but different intercept (degradation profiles behave the same but they differ by an offset potentially caused by lot-to-lot variability)
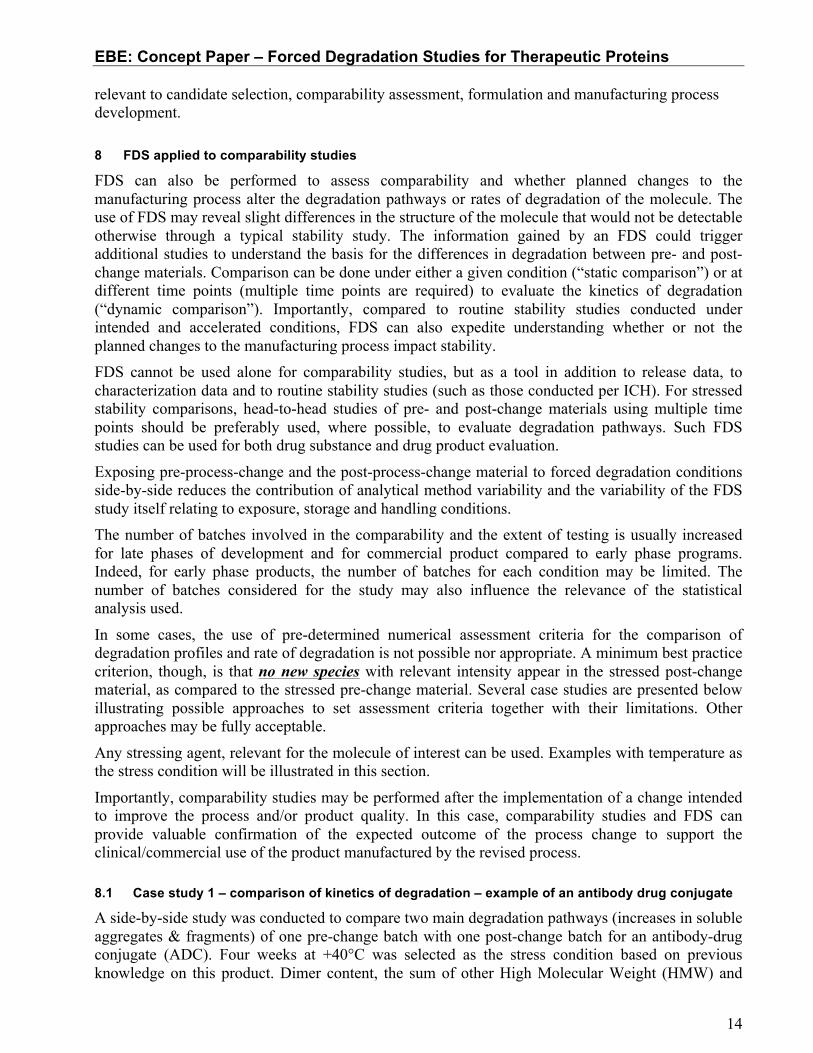
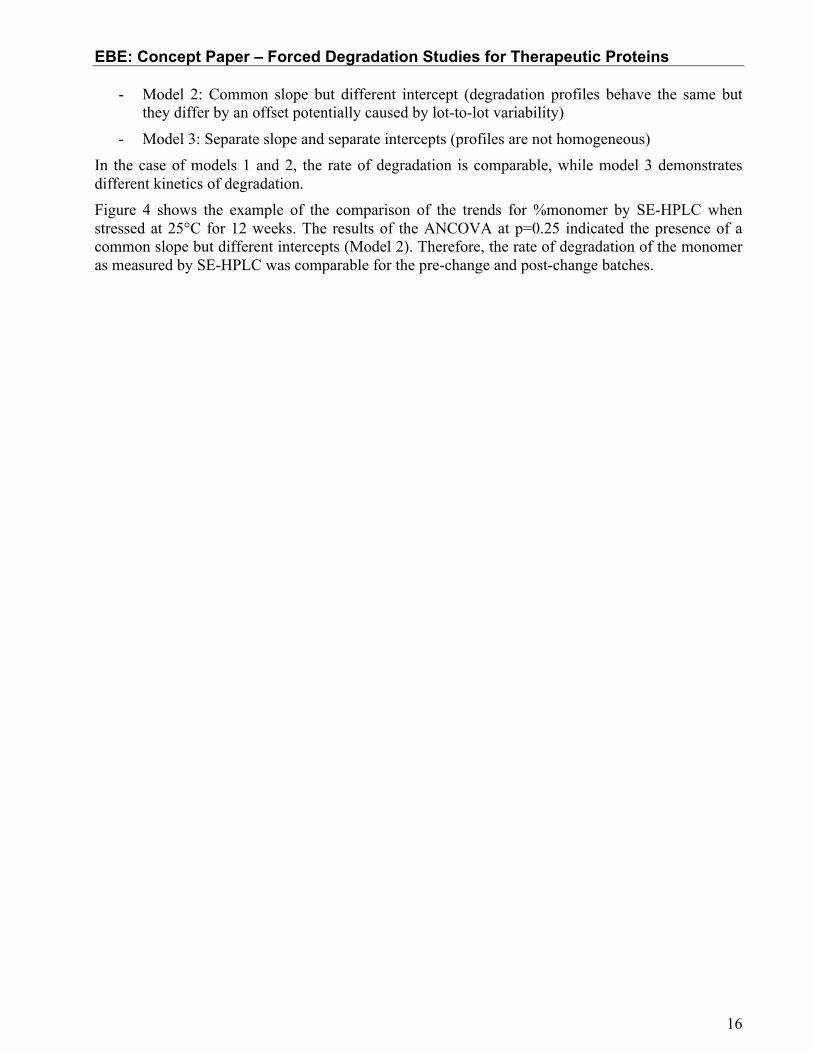
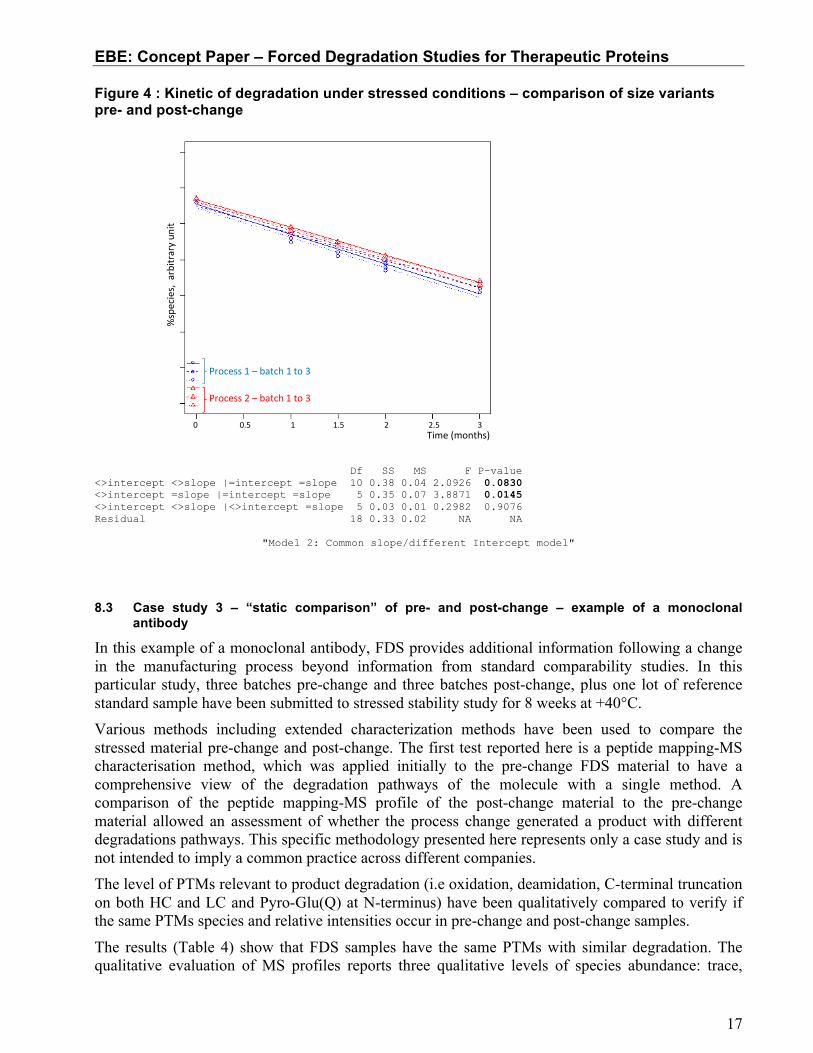
- Model 3: Separate slope and separate intercepts (profiles are not homogeneous) In the case of models 1 and 2, the rate of degradation is comparable, while model 3 demonstrates different kinetics of degradation. Figure 4 shows the example of the comparison of the trends for %monomer by SE-HPLC when stressed at 25°C for 12 weeks. The results of the ANCOVA at p=0.25 indicated the presence of a common slope but different intercepts (Model 2). Therefore, the rate of degradation of the monomer as measured by SE-HPLC was comparable for the pre-change and post-change batches.
EBE: Concept Paper – Forced Degradation Studies for Therapeutic Proteins
17
Figure 4 : Kinetic of degradation under stressed conditions – comparison of size variants pre- and post-change
Df SS MS F P-value <>intercept <>slope |=intercept =slope 10 0.38 0.04 2.0926 0.0830 <>intercept =slope |=intercept =slope 5 0.35 0.07 3.8871 0.0145 <>intercept <>slope |<>intercept =slope 5 0.03 0.01 0.2982 0.9076 Residual 18 0.33 0.02 NA NA
"Model 2: Common slope/different Intercept model"
8.3 Case study 3 – “static comparison” of pre- and post-change – example of a monoclonal antibody
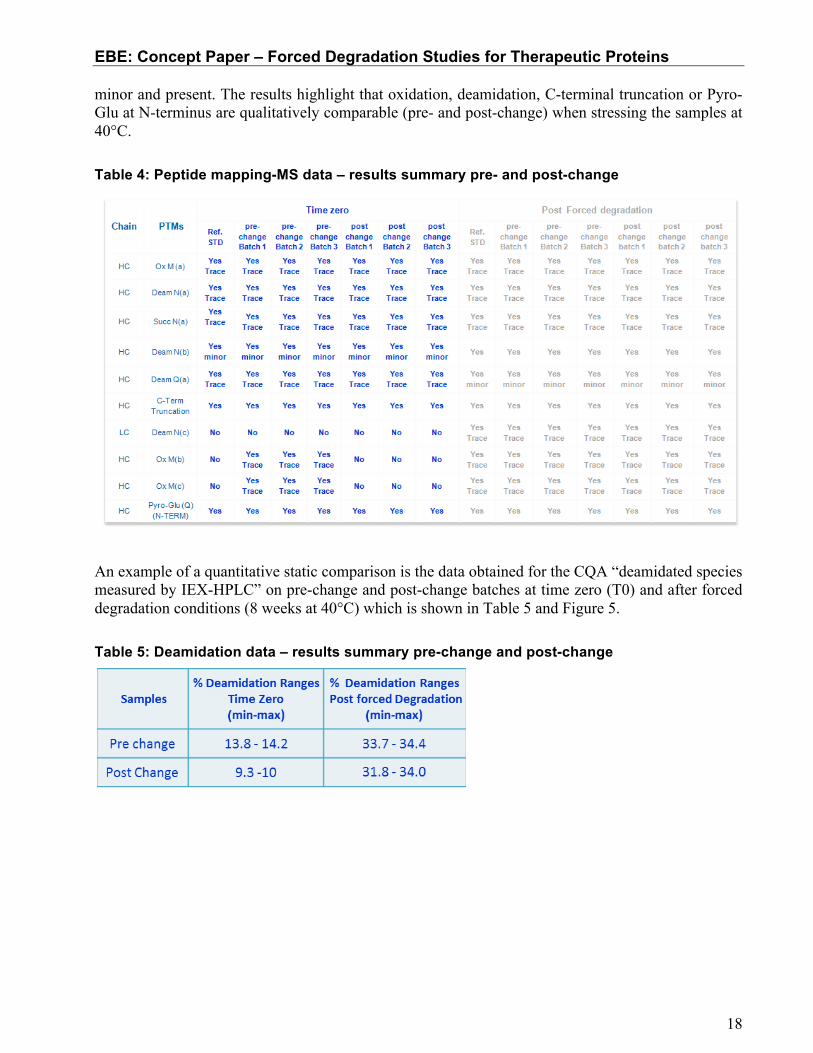
In this example of a monoclonal antibody, FDS provides additional information following a change in the manufacturing process beyond information from standard comparability studies. In this particular study, three batches pre-change and three batches post-change, plus one lot of reference standard sample have been submitted to stressed stability study for 8 weeks at +40°C. Various methods including extended characterization methods have been used to compare the stressed material pre-change and post-change. The first test reported here is a peptide mapping-MS characterisation method, which was applied initially to the pre-change FDS material to have a comprehensive view of the degradation pathways of the molecule with a single method. A comparison of the peptide mapping-MS profile of the post-change material to the pre-change material allowed an assessment of whether the process change generated a product with different degradations pathways. This specific methodology presented here represents only a case study and is not intended to imply a common practice across different companies. The level of PTMs relevant to product degradation (i.e oxidation, deamidation, C-terminal truncation on both HC and LC and Pyro-Glu(Q) at N-terminus) have been qualitatively compared to verify if the same PTMs species and relative intensities occur in pre-change and post-change samples.
The results (Table 4) show that FDS samples have the same PTMs with similar degradation. The qualitative evaluation of MS profiles reports three qualitative levels of species abundance: trace,
Time (months) 0 0.5 1 1.5 2 2.5 3
%species, arbitrary un
it
Process 1 – batch 1 to 3 to 3 Process 2 – batch 1 to 3
EBE: Concept Paper – Forced Degradation Studies for Therapeutic Proteins
18
minor and present. The results highlight that oxidation, deamidation, C-terminal truncation or Pyro-Glu at N-terminus are qualitatively comparable (pre- and post-change) when stressing the samples at 40°C. Table 4: Peptide mapping-MS data – results summary pre- and post-change
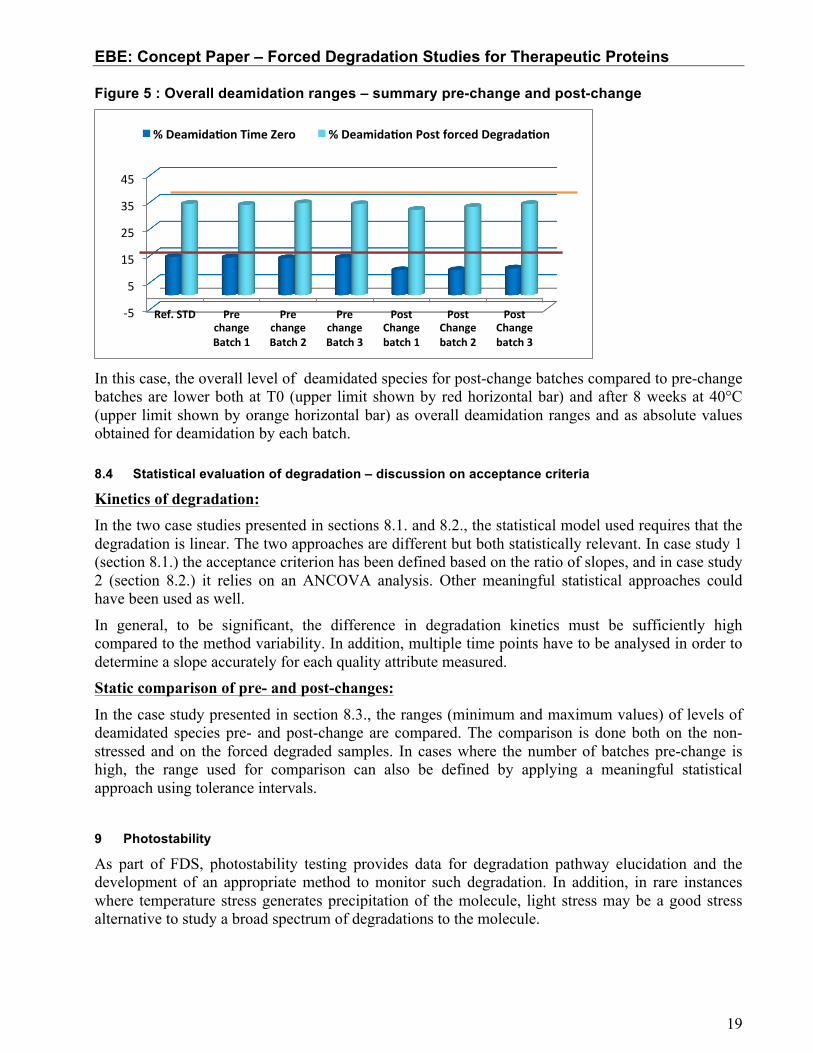
An example of a quantitative static comparison is the data obtained for the CQA “deamidated species measured by IEX-HPLC” on pre-change and post-change batches at time zero (T0) and after forced degradation conditions (8 weeks at 40°C) which is shown in Table 5 and Figure 5. Table 5: Deamidation data – results summary pre-change and post-change
EBE: Concept Paper – Forced Degradation Studies for Therapeutic Proteins
19
Figure 5 : Overall deamidation ranges – summary pre-change and post-change
In this case, the overall level of deamidated species for post-change batches compared to pre-change batches are lower both at T0 (upper limit shown by red horizontal bar) and after 8 weeks at 40°C (upper limit shown by orange horizontal bar) as overall deamidation ranges and as absolute values obtained for deamidation by each batch.
8.4 Statistical evaluation of degradation – discussion on acceptance criteria
Kinetics of degradation: In the two case studies presented in sections 8.1. and 8.2., the statistical model used requires that the degradation is linear. The two approaches are different but both statistically relevant. In case study 1 (section 8.1.) the acceptance criterion has been defined based on the ratio of slopes, and in case study 2 (section 8.2.) it relies on an ANCOVA analysis. Other meaningful statistical approaches could have been used as well.
In general, to be significant, the difference in degradation kinetics must be sufficiently high compared to the method variability. In addition, multiple time points have to be analysed in order to determine a slope accurately for each quality attribute measured. Static comparison of pre- and post-changes:
In the case study presented in section 8.3., the ranges (minimum and maximum values) of levels of deamidated species pre- and post-change are compared. The comparison is done both on the non-stressed and on the forced degraded samples. In cases where the number of batches pre-change is high, the range used for comparison can also be defined by applying a meaningful statistical approach using tolerance intervals. 9 Photostability
As part of FDS, photostability testing provides data for degradation pathway elucidation and the development of an appropriate method to monitor such degradation. In addition, in rare instances where temperature stress generates precipitation of the molecule, light stress may be a good stress alternative to study a broad spectrum of degradations to the molecule.
-‐5
5
15
25
35
45
Ref. STD Pre change Batch 1
Pre change Batch 2
Pre change Batch 3
Post Change batch 1
Post Change batch 2
Post Change batch 3
% DeamidaWon Time Zero % DeamidaWon Post forced DegradaWon

EBE: Concept Paper – Forced Degradation Studies for Therapeutic Proteins
20
Photostability is recommended by ICH Q1B which states that for confirmatory studies, samples should be exposed to light providing an overall illumination of not less than 1.2 million lux hours and an integrated near ultraviolet energy of not less than 200 Watt hours/square meter. The conditions specified in ICHQ1B were first implemented for small molecules, but it has been subsequently observed that the conditions may not be appropriate for all therapeutic proteins because it may be too destructive. Consequently ICH conditions have to be applied but in addition, the appropriate conditions may need to be determined on a molecule by molecule basis and may require further optimisation (e.g. time, light, intensity, wavelength distribution of light, etc.) to ensure a suitable level of degradation is obtained. Studies to evaluate various parameters that would be more generally suitable to determine the photolytic susceptibility of therapeutic proteins are on-going. These parameters include the impact of time courses, UV/ fluorescence, DS and DP containers, equipment variation, temperature-light combination effects, etc.
Case Study 4 In this case study, an IgG molecule was incubated under the recommended ICH photostability conditions using an irradiation device Atlas Suntest CPS. Vials used for incubation were DP vials and standard validated vials used on Atlas Suntest CPS device.
ICH Confirmatory Conditions
1) 25ºC ≥ 1.2 million lux hours and ≥ 200 Watt hrs/m2
2) 25ºC ≥ 1.2 million lux hours: visible conditions (sample protected by UV filter)
3) 25°C Dark control: sample wrapped in aluminum foil
The resulting protein degradation was analysed using an array of size, charge and appearance methods. A subset of these results is presented here.
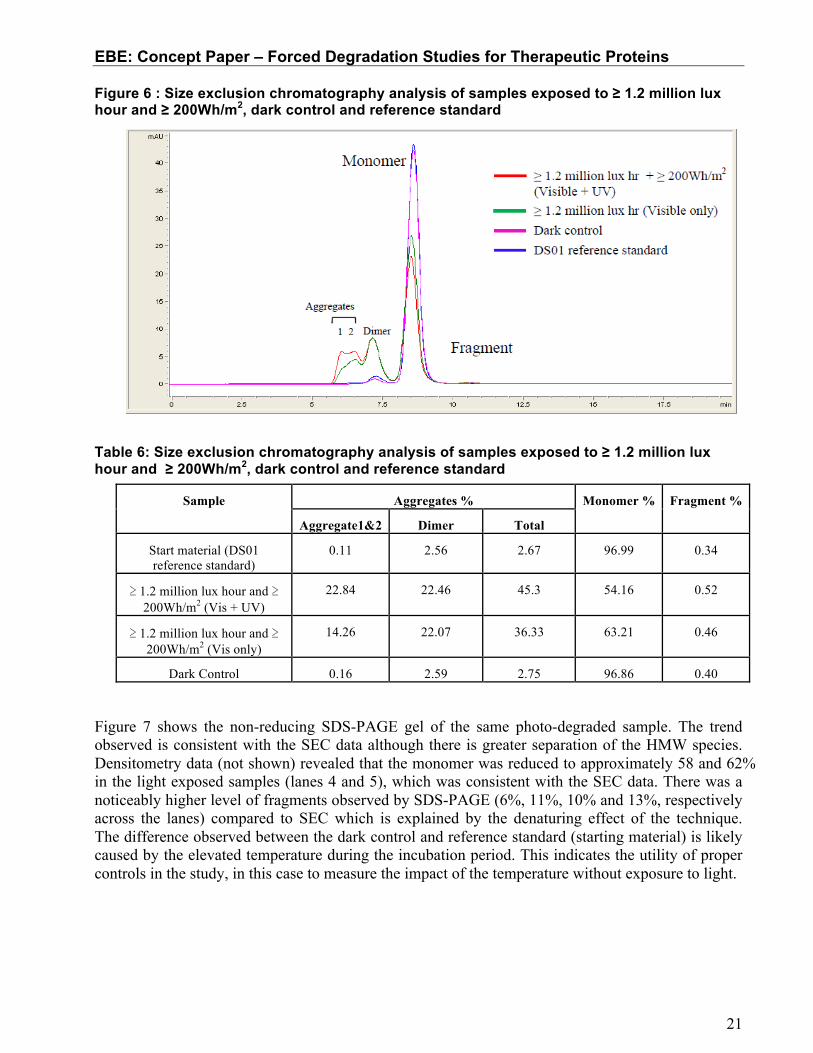
SEC results indicated that light exposure at the ICH guideline level generates a significant amount of dimer and HMW species (confirmed as aggregates). Table 6 shows a reduction of almost half the monomer IgG with a significant increase in total aggregates in the light exposed samples when compared to the dark control. The total aggregate level of the sample exposed to visible + UV light (≥ 1.2 million lux hours and ≥ 200Wh/m2) and visible light only (≥ 1.2 million lux hours) increased from the dark control by approximately 42% and 33%, respectively. For this molecule, the level of dimer present in both photo-exposed samples was similar at 22%. There was a minor increase in the level of fragments (<0.2%). The results clearly show that the direct light exposure per ICH guidelines induce measureable HMW species to form at a significant level.
EBE: Concept Paper – Forced Degradation Studies for Therapeutic Proteins
21
Figure 6 : Size exclusion chromatography analysis of samples exposed to ≥ 1.2 million lux hour and ≥ 200Wh/m2, dark control and reference standard
Table 6: Size exclusion chromatography analysis of samples exposed to ≥ 1.2 million lux hour and ≥ 200Wh/m2, dark control and reference standard
Sample Aggregates % Monomer % Fragment %
Aggregate1&2 Dimer Total
Start material (DS01 reference standard)
0.11 2.56 2.67 96.99 0.34
≥ 1.2 million lux hour and ≥ 200Wh/m2 (Vis + UV)
22.84 22.46 45.3 54.16 0.52
≥ 1.2 million lux hour and ≥ 200Wh/m2 (Vis only)
14.26 22.07 36.33 63.21 0.46
Dark Control 0.16 2.59 2.75 96.86 0.40
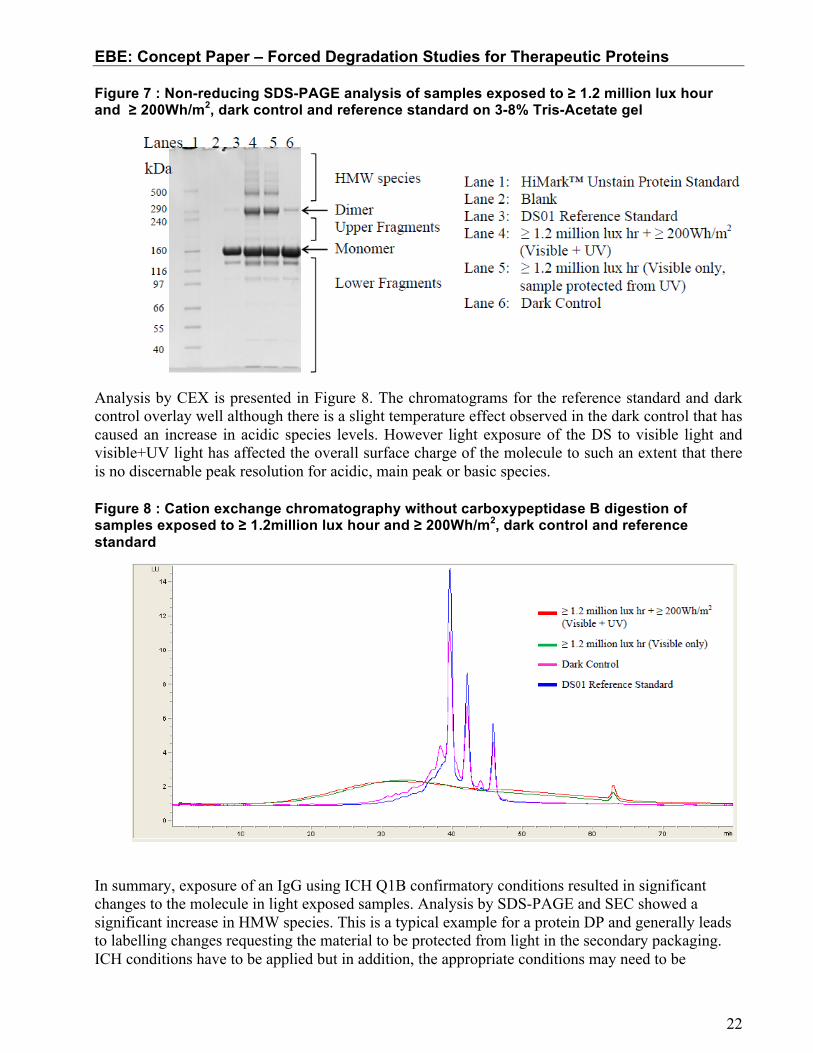
Figure 7 shows the non-reducing SDS-PAGE gel of the same photo-degraded sample. The trend observed is consistent with the SEC data although there is greater separation of the HMW species. Densitometry data (not shown) revealed that the monomer was reduced to approximately 58 and 62% in the light exposed samples (lanes 4 and 5), which was consistent with the SEC data. There was a noticeably higher level of fragments observed by SDS-PAGE (6%, 11%, 10% and 13%, respectively across the lanes) compared to SEC which is explained by the denaturing effect of the technique. The difference observed between the dark control and reference standard (starting material) is likely caused by the elevated temperature during the incubation period. This indicates the utility of proper controls in the study, in this case to measure the impact of the temperature without exposure to light.
EBE: Concept Paper – Forced Degradation Studies for Therapeutic Proteins
22
Figure 7 : Non-reducing SDS-PAGE analysis of samples exposed to ≥ 1.2 million lux hour and ≥ 200Wh/m2, dark control and reference standard on 3-8% Tris-Acetate gel
Analysis by CEX is presented in Figure 8. The chromatograms for the reference standard and dark control overlay well although there is a slight temperature effect observed in the dark control that has caused an increase in acidic species levels. However light exposure of the DS to visible light and visible+UV light has affected the overall surface charge of the molecule to such an extent that there is no discernable peak resolution for acidic, main peak or basic species.
Figure 8 : Cation exchange chromatography without carboxypeptidase B digestion of samples exposed to ≥ 1.2million lux hour and ≥ 200Wh/m2, dark control and reference standard
In summary, exposure of an IgG using ICH Q1B confirmatory conditions resulted in significant changes to the molecule in light exposed samples. Analysis by SDS-PAGE and SEC showed a significant increase in HMW species. This is a typical example for a protein DP and generally leads to labelling changes requesting the material to be protected from light in the secondary packaging. ICH conditions have to be applied but in addition, the appropriate conditions may need to be
EBE: Concept Paper – Forced Degradation Studies for Therapeutic Proteins
23
determined on a molecule by molecule basis and may require optimisation of times and of strength of light to obtain more meaningful results.
10 Overall conclusion
FDS have multiple applications in the biopharmaceutical industry. To date there has been no consensus on the importance of FDS for different applications or guidance on how FDS can be applied to proteins. This paper has taken the expertise from several leading biopharmaceutical companies that regularly use FDS and herein provides a guidance for current practices. It outlines several of the key uses for FDS, discusses the considerations when applying FDS and provides non-prescriptive case studies to illustrate how studies with different purposes may be performed.
11 Acknowledgements
Concept paper focus group and main authors are: - Annick Gervais, UCB
- Gabriella Angiuoni, Merck-Serono - John O’Hara, UCB
- Karin Juul Jensen, Novo Nordisk - Karin Sewerin, Medimmune
- Mara Rossi, Merck-Serono - Michael Nedved, Janssen Biologics
- Paul Dillon, Pfizer - Shahid Uddin, Medimmune
- Stéphane Cornen, Sanofi - Volker Schnaible, Roche The paper was written in collaboration with experts in FDS, reviewers and others from the EBE BioManufacturing group member companies that contributed and supported the preparation of this document.
12 References
Hawe, A.; Wiggenhorn, M.; Van De Weert, M.; Garbe, J. H. O.; Mahler, H.; Jiskoot, W. (2011) “Forced Degradation of Therapeutic Proteins,“ J. Pharm. Sci. 101, 895-913. Manning, M.C.; Chou, D.K.; Murphy, B.M.; Payne, R.W.; Katayama, D.S. (2010) “Stability of Protein Pharmaceuticals: An Update,” Pharmaceutical Research 27, 544-575. Kats, M. (2005) "Forced degradation studies: regulatory considerations and implementation", BioPharm Intl.
EBE: Concept Paper – Forced Degradation Studies for Therapeutic Proteins
24
Reynolds, D. W.; Facchine, K. L.; Mullaney, J. F., Alsante, K.M.; Hatajik, T.D.; Motto, M.G. (2002) "Available guidance and best practices for conducting forced degradation studies", Pharmaceutical Technology, 48-56. The Gold Sheet (2005) “Stability Programs for Biotechnology Products”, Pharmaceutical & Biotechnology Quality Control, 39, 10. EBE Concept Paper : Comparability (2011) Mallaney, M.; Wang, S.; Sneedhara, A. (2014) “Effect of ambient light on monoclonal antibody product quality during small-scale mammalian cell culture process in clear glass bioreactors”, Biotechnology Progress 3(3), 562-570.