original research article comparative assessment of
TRANSCRIPT
Indian Journal of Pharmacy and Pharmacology 2021;8(1):58–64
Content available at: https://www.ipinnovative.com/open-access-journals
Indian Journal of Pharmacy and Pharmacology
Journal homepage: https://www.ijpp.org.in/
Original Research Article
Comparative assessment of groundwater quality in different areas of Delhi NCR(Ghaziabad, Noida) and East UP (Varanasi)
Shabnam Ain
1,*, Qurratul Ain1, Shambhavi Chaturvedi1, Babita Kumar1
1Dept. of Pharmacy, Sanskar College of Pharmacy & Research, Ghaziabad, Uttar Pradesh, India
A R T I C L E I N F O
Article history:Received 14-03-2021Accepted 05-04-2021Available online 19-04-2021
Keywords:GroundwaterIndustrial pollution andgastrointestinal disordersHardness
A B S T R A C T
Aim: The main aim of this study was to compare the quality of groundwater on the basis of its physicaland chemical parameters analyzed. For this purpose, different areas of Varanasi, Ghaziabad and Noida.Introduction: One the oldest Indian ancient cities, Varanasi, known for the Hindu spiritual practices hasnow topped the country’s list of the most polluted city and Ghaziabad, considered as one of the mostdeveloped areas of the state Uttar Pradesh had highest pollution level among the 42 cities of the countryin the previous year, 2017. Despite being the developed towns of the state, people have to suffer for basicneeds, particularly the water needs. Contamination of underground water is one of the biggest hazards thatthe world will witness sooner or later. Underground water contamination in the present scenario is donemore by the indirect pollution methods which include inadequate treatment of the waste product beforetheir disposal into the water bodies. Ions transported by the rivers are an essential source of almost all theelements found on Earth. The major ions which are responsible to maintain the quality of water, particularlythe groundwater includes sundry cations and anions like: carbonate (CO3
2−), Phosphate (PO43−), Nitrate
(NO3−), Bicarbonate (HCO3
−), Chloride (Cl−), Sulphate (SO42−), Calcium (Ca++), Magnesium (Mg++),
Cupper (Cu++), Fluoride (F−), Sodium (Na+) and Potassium (K+). Among the above-listed ions, Calcium(Ca++) and Magnesium (Mg++) are particularly responsible for the hardness of water, intake of this hardwater by humans and animals can result in sundry medical complications like diarrhea and GastrointestinalDisorders.Materials and Methods: Water samples from nine different areas of Ghaziabad (NCR) and Varanasi (EastUP) were collected and analyzed various physical and chemical parameters.Conclusion: Comparison of groundwater quality showed higher values of observed parameters at Salarpurand Kavi Nagar area of NCR region. This showed that the major contaminants in groundwater of NCRregion were mixed pollution sources e.g. effluents from Industries, soil and mineral dust.
© This is an open access article distributed under the terms of the Creative Commons AttributionLicense (https://creativecommons.org/licenses/by/4.0/) which permits unrestricted use, distribution, andreproduction in any medium, provided the original author and source are credited.
1. Introduction
One of the oldest living cities in India is Varanasi whichis also known as Kashi or Banaras. The place is verymuch known for the several spiritual activities and peopleassociate this holy place with Lord Shiva and River Ganga.Varanasi in Hindu Mythology is referred as the hometownof Lord Shiva and so the city witnesses several religiouspractices done to please Lord Shiva. Ghaziabad, on theother hand, is known for fast industrial and hometown
* Corresponding author.E-mail address: [email protected] (S. Ain).
developments in the state Uttar Pradesh. Out of the twoVaranasi is a holy place while the Ghaziabad is anattractive site to the emerging Industrialists. Despite beingthe developed towns of the state, Varanasi tops the country’slist of the most polluted city and Ghaziabad was knownto have the highest pollution level among the 42 cities ofthe country in the previous year, 2017. Apart from this,people here have to suffer for basic needs, particularly thewater needs. Every other citizen in the two cities faces acutepurified water shortage and has to work with unhealthywater to meet their daily needs. With every passing day,
https://doi.org/10.18231/j.ijpp.2021.0102393-9079/© 2021 Innovative Publication, All rights reserved. 58
Ain et al. / Indian Journal of Pharmacy and Pharmacology 2021;8(1):58–64 59
the two states are witnessing a several-fold increase in thelevel of pollutants and contaminants which poisoning thewater of the cities and making it unfit for consumption bythe organisms. The prime requirement for the survival ofall the living organisms on the Earth is Water and nowthe country has arrived at such a stage that people lack orhas to adjust with the basic water needs. Due to all theIndustrial pollution and activities, the water level in thetwo cities has lost its purity. The same can be seen by thecontamination of one of the Holy Indian River, River Ganga.The river has been contaminated to an extent that now 270million liters of water from the river cannot meet the dailyrequirements of the citizens of Varanasi. It is not only aboutthe contamination of the river water but the groundwaterwhich is one of the purest forms of stored water and occursbelow the surface of the earth and occupies all or a part ofinterstitial spaces, also known as the void spaces in the soilwitnesses the same fate. Sundry processes taking place ata faster pace are responsible for deriving the compositionof groundwater. These processes are dissolution, hydrolysisand precipitation reactions; oxidation, reduction, absorptionand ion exchanges taking place between groundwater andthe atmosphere is responsible for deriving the compositionof groundwater. One of the major reasons for thegroundwater contamination is the indirect cause, doneparticularly by the human activities. Some of the man-made pollutants such as gasoline, road salts, oils, andchemicals when get mixed with groundwater makes it unfitfor consumption, especially human consumption and thesame is called groundwater contamination. Other than this,chemicals manufactured by the Industries to kill unwantedinsects and weeds and to fertilize the crops, fertilizers,and pesticides when move from the surface of the landthrough the soil into the groundwater it becomes toxic andis then regarded as unfit and unsafe for human use. Diseaseslike hepatitis, dysentery, gastric disorders, poisoning bytoxins and a certain type of deadly cancers are some ofthe serious medical ailments caused by aster consuming thetoxic groundwater.1 Other diseases like jaundice, cholera,diarrhea, polymavirus infection, amoebiasis, lead poisoningand further still undiscovered disorders are the results of thewater contamination, which now has to be taken seriously.1
Groundwater is a significant source for the provisions ofgood quality drinking water which requires its judicialuse to last long in the future to sustain life on earth. Inthe developing countries, two million infants deaths areobserved yearly due to consumption of unsafe drinkingwater.2 The present study assesses the groundwater qualityof different areas of Delhi NCR and East UP region.
2. Materials and Methods
2.1. Study area
The different areas of Varanasi (East UP) includesHariharpur, Bhogabir, Kotwa, Lohta and Dinapurandtheareas of Ghaziabad and Noida (Delhi NCR) includes RajNagar, Kavi Nagar, Salarpur and Nehru Nagar were selectedfor sample collection.
2.2. Collection and analysis of groundwater samples
Groundwater samples were collected from various watersources like River, Hand-pumps in polyethylene bottlesfrom sampling sites of Varanasi and Ghaziabad of UttarPradesh during March to May 2019. The bottles weresoaked overnight in 15% nitric acid and were later washedwith deionized water and were dried at room temperature.Next, rinsing of the containers was done several timeswith good water source to ensure sufficient flushing beforecollection and the same was followed by the collectionof water samples after pumping the water for 10 mintues.After that, all samples were brought to the laboratory inan ice box jar to avoid unusual changes to take placein water quality and before analysis to take place theywere stored in a refrigerator at 4◦C. The American PublicHealth Association (APHA) has listed precise methodsof collection, preparation, and preservation which werefollowed in the experiment.3–6
2.3. Experimental work done
The measurement and standardization of the pH value of theriver water samples which were to be analyzed were doneusing Systronic pH meter, type 335 and buffer solution ofpH 4 and pH 9.2 respectively. Later on, the total alkalinityand hardness of water samples were respectively determinedby titrating with N/50 H2SO4 using methyl orange indicatorand complexometric titration with EDTA using Eriochromeblack T as an external indicator. Complexometric titrationwith EDTA using ammonium purpurate as an indicatorwas also carried out to determine cadmium hardness ofwater samples. While the estimation of chloride ion wasmade by titrating the water solution against the standardsolution of silver nitrate using potassium chromate asan indicator, Na+ & K+ were estimated using FlamePhotometer (128) and NO3
−, SO4−−, F− were estimated
using U.V. Spectrophotometer. TDS was measured bygravimetric analysis, one of the famous quantitative titrationtechniques and EC Value under investigation was measuredby Systronic E.C. meter. Various parameters were recordedas per requirements.4,5 So, Area wise our water analysis andits data recording has been done in the three of the tabularform charts.

60 Ain et al. / Indian Journal of Pharmacy and Pharmacology 2021;8(1):58–64
3. Results and Discussion
Though theoretically the pH of water is taken as 7and is considered neutral in science but according tothe WHO guidelines, the pH of water which is fit forhuman consumption ranges around 6.5-8.5. The extentof deterioration and contamination of the water samplescollected from the two different cities was studied andcompared by pH analysis. The result of the analysis wasthat the pH value of all the collected water samples rangedfrom 9.78-11.28, which indicates the presence of highlyalkaline nature of the water bodies. Alkaline water iscommonly defined as a beverage that has a value greaterthan 7 on the pH scale and desirable limit for totalalkalinity is 200 mg/L. Water samples upon analysis showeda higher pH level than regular drinking water which isdefinitely accountable to several medical complicationsand is one of the prime reasons for the gastrointestinaldisorders caused by the lowering of natural stomach aciditywhich is maintained by the level of intestinal acid HCl,which helps to kill bacteria and expel other undesirablepathogens from entering one’s bloodstream. Intake of alarge amount of alkaline water may agitate the body’snormal pH, leading to metabolic alkalosis, a condition thatmay lead to multiple organ failure if lasted for months.Apart from this contaminated water has been knownto cause some of the long-term medical complicationslike kidney dysfunction, cardiovascular dysfunction, Gutinfections and other metabolic abnormalities. Apart fromthe severe medical disorders caused by the consumptionof the unfit and alkaline water, there is an overall excessof alkalinity in the body of several individuals which maycause serious epidermal layer infections and irritations.7,8
There are sundry reasons for the increase in the pH of thewater samples in the two cities and one of the key causesof the same is the increased concentration of pesticides andfertilizers into the water samples collected from the twocities. The water present over the land surfaces, particularlythe agricultural surfaces when unifies with the river andunderground water mixes up the harmful pollutants andsurface chemicals, increasing the pH of the water bodiesand making it unfit for consumption. The desirable limit forhardness in drinking water according to I.S. is 300 mg/L,whereas its value varied strongly from 535 – 570 mg/L. Thehardening of water occurs primarily due to the increase inthe level of calcium and magnesium ions.
The level of Na+ in the water samples which isconsidered apt for drinking should be below 50ppm and ifits content in the water bodies exceeds 50 ppm then, thewater is considered unsuitable for drinking purposes andcan result in certain complications. The current analysisrevealed that the level of Na+ content in the given watersamples were more than expected. value of Na+ in theexamined samples was sorted around 425-510 mg/L, whichis a major point of concern. Sodium Ion is very much
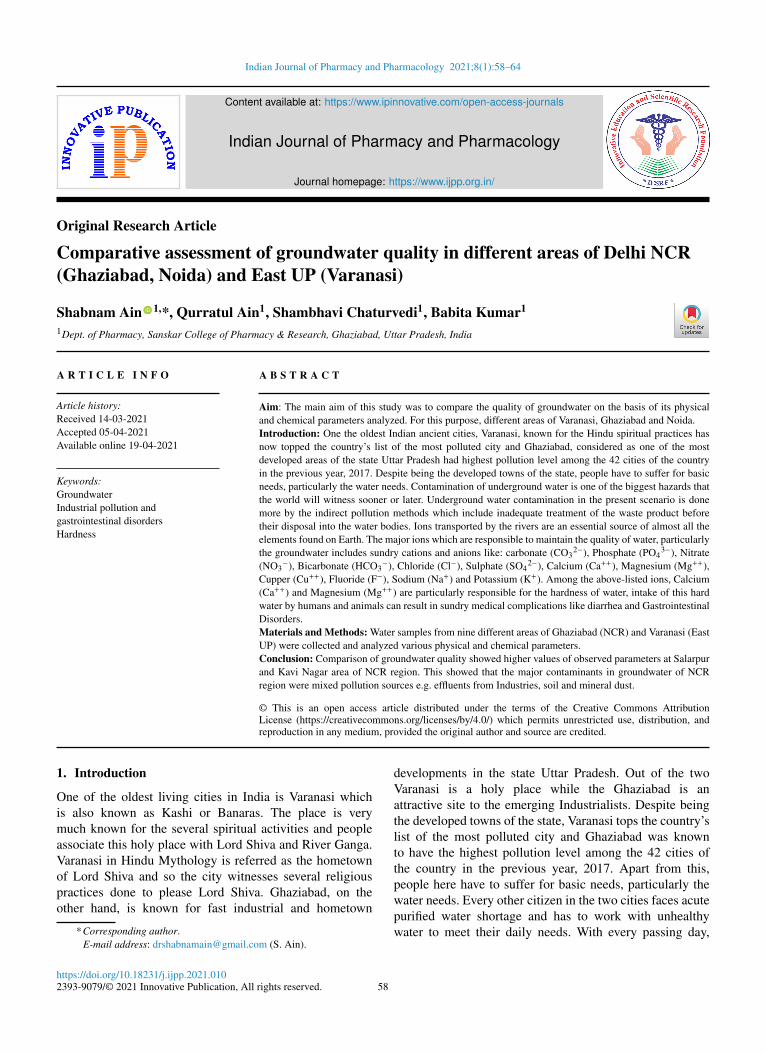
Fig. 1: Comparative profile of groundwater sample of Raj Nagar,Bhogabir and Salarpur
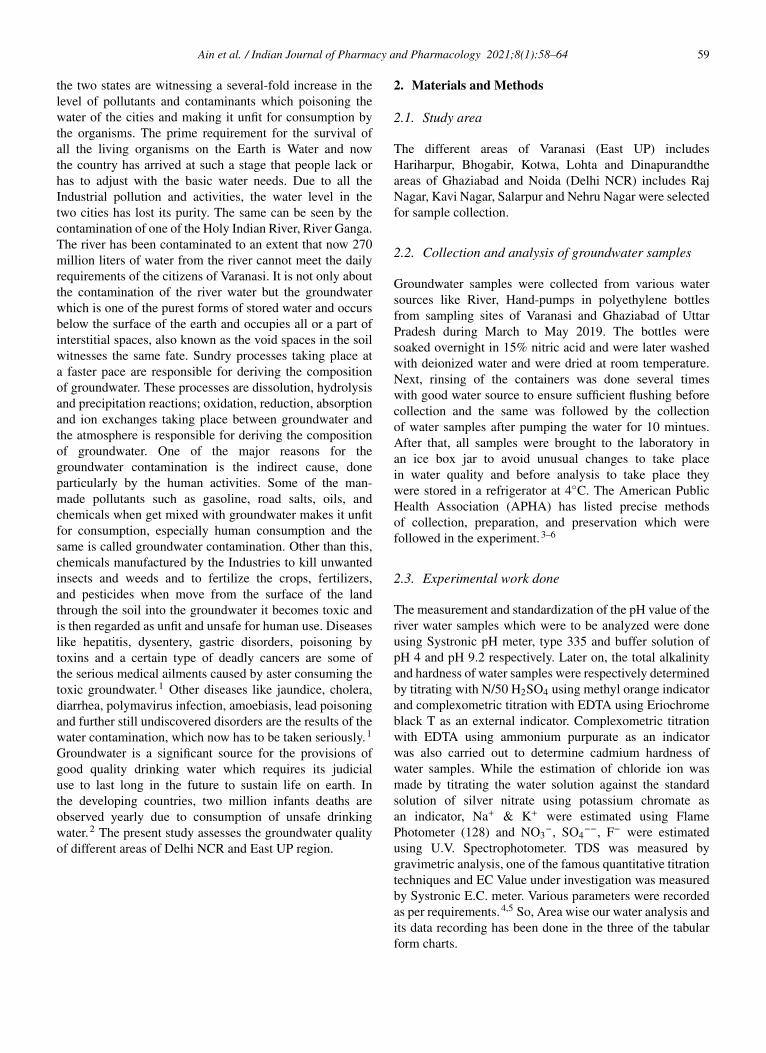
Fig. 2: Comparative profile of groundwater sample of Hariharpur,Kavi Nagar and Lohta
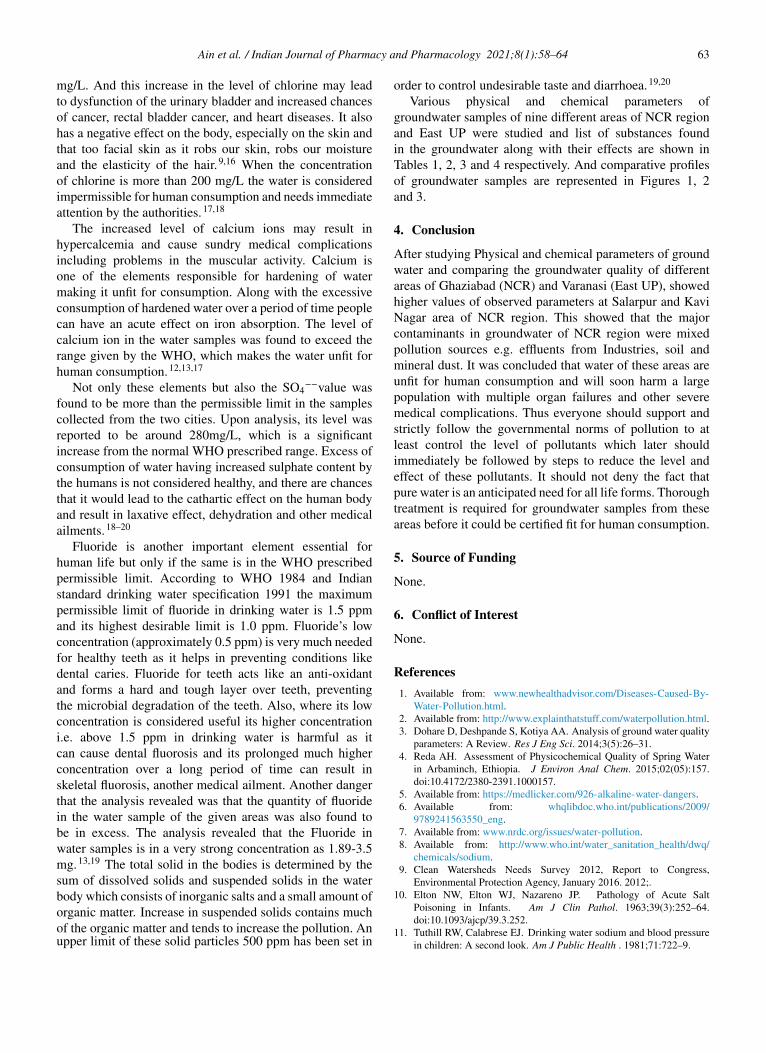
Fig. 3: Comparative profile of groundwater sample of Kotwa,Nehru Nagar and Dinapu

Ain et al. / Indian Journal of Pharmacy and Pharmacology 2021;8(1):58–64 61
Table 1: Physicaland chemical parameters of groundwater sample from Raj Nagar, Bhogabir and Salarpur
S. No. Parameter Raj Nagar Bhogabir Salarpur1 pH 9.95 8.84 10.122 Total Alkalinity 548 470 5403 Total Hardness 940 640 7704 Ca++ 660 580 5705 Mg++ 838 830 4906 Na+ 74.5 164.2 610.67 K+ 359.5 370.5 330.28 Cl- 750.56 660.55 655.859 SO4– 324.1 350 23810 NO3- 1.8 3.6 4.511 F- 1.76 3.45 3.112 Total Dissolved Solid 2378 2730 324013 Electrical Conductivity 980 975 865
Table 2: Physical and chemical parameters of groundwater from Hariharpur, Kavi Nagar and Lohta
S. No. Parameter Hariharpur Kavi Nagar Lohta1 pH 8.82 8.69 8.12 Total; Alkalinity 346 476 5303 Total Hardness 785 876 7864 Ca++ 550 560 5105 Mg++ 231 328 2796 Na+ 66.8 120.8 138.87 K+ 230.4 240.5 230.88 Cl- 575.46 580.75 556.259 SO4– 242.1 235 23110 NO3- 2.9 5.7 6.511 F- 1.88 3.8 4.212 Total Dissolved Solid 2458 3780 238013 Electrical Conductivity 778 870 1875
Table 3: Physical and chemical parameters of groundwater from Kotwa, Nehru Nagar and Dinapur
S. No Parameter Kotwa Nehru Nagar Dinapur1 pH 7.82 8.58 8.92 Total Alkalinity 436 486 4303 Total Hardness 794 864 7764 Ca++ 556 542 5955 Mg++ 242 332 2826 Na+ 67.8 153.8 148.87 K+ 238.5 260.5 250.88 Cl- 655.97 590.58 756.869 SO4– 142.1 275 28410 NO3- 2.6 5.8 8.511 F- 1.89 7.9 4.212 Total Dissolved Solid 2678 2680 288013 Electrical Conductivity 774 895 975

62 Ain et al. / Indian Journal of Pharmacy and Pharmacology 2021;8(1):58–64
Table 4: Physical and chemical properties of groundwater and list of substances found in the groundwater along with their effects9
S.No.Physical and Chemical
Parameters Unit Acceptable Permissible Types of ProblemLimit Limit
1 Colour Hazen unit 5 15 -2 Odor - Agreeable Agreeable -3 pH - 6.5-8.5 No relaxation -4 Turbidity ntu 1 5 -5 Total dissolved material mg/l 500 2000 -6 Ammonia mg/l 0.5 0.5 Portability,
Corrosiveness7 Boron mg/l 0.5 1 Corrosiveness8 Calcium mg/l 75 200 Encrustation9 Chloride mg/l 250 1000 Portability,
Corrosiveness10 Fluoride mg/l 1 1.5 Fluorosis11 Magnesium mg/l 30 100 Encrustation12 Nitrate mg/l 45 45 Methemoglobinemia13 Total alkalinity mg/l 200 600 Portability, Health
aspects14 Sulphate mg/l 200 400 Portability15 Total Hardness mg/l 200 600 -16 Temperature 0C - -17 Sodium mg/l - - Hypertension
18 Iron mg/l 0.3 0.3 Encrustation, stainingof
laundry and toiletfixtures
19 Cadmium mg/l 0.003 - Portability,Corrosiveness
20 Chromium mg/l 0.05 0.05 Portability,Corrosiveness
21 Zinc mg/l 5 15 Portability,Corrosiveness
22 Manganese mg/l 0.1 0.3 Encrustation, stainingof laundry and toilet
fixtures23 Nickel mg/l 0.02 0.02 Portability, Health
aspects24 Silica - - - Encrustation
required to regulate body activities and being easily solublein water it cannot be removed from water bodies, makingincreased sodium content in the water sample one of thealarming issues.8,10,11 Any increase or decrease in its levelcan lead to several medical issues, like nausea, musculartwitching, arterial hypertension, convulsions, teratogenicity,embryotoxicity, the problem of dismaintenance of osmoticpressure, reproductive toxicity and others, thereby causinghypermatracemia within the body.8,12,13
Another vital extracellular ion required for the properand healthy functioning of the living organism is potassium.The level of K+ which is considered essential for thesurvival of the living organisms varies from 210 – 220.3mg/L.8 Any change in the level of potassium ions can leadto medical ailments like Hyperkalemia and Hypokalemia.There are chances that some serious issues involving
nerve impulse conduction persist if recurrent and prolongedhyperkalemia occurs. The adequate potassium intake foradults (19–>70 years of age) is 4.7 g/day (IOM, 2004).The same is equivalent to 78 mg/kg body weight per dayfor a 60 kg adult. Individuals may suffer from tremendouscomplications probably due to increase in the level ofpotassium ions like arterial disorders, immature kidneyfunction, diabetes, adrenal insufficiency, hypertension, andcoronary artery disease and other. The same is also foundto affectinfants which have underdeveloped organs andimmature liver, limited renal reserve, and kidney functionand can affect the processes like metabolism and excretion.Accordingly, ingestion of potassium supplements of up to3700 mg/day is likely to be without overt effects.10,13–15
As prescribed by WHO the chloride value was found tobe more than the permissible limit i.e. greater than 5800
Ain et al. / Indian Journal of Pharmacy and Pharmacology 2021;8(1):58–64 63
mg/L. And this increase in the level of chlorine may leadto dysfunction of the urinary bladder and increased chancesof cancer, rectal bladder cancer, and heart diseases. It alsohas a negative effect on the body, especially on the skin andthat too facial skin as it robs our skin, robs our moistureand the elasticity of the hair.9,16 When the concentrationof chlorine is more than 200 mg/L the water is consideredimpermissible for human consumption and needs immediateattention by the authorities.17,18
The increased level of calcium ions may result inhypercalcemia and cause sundry medical complicationsincluding problems in the muscular activity. Calcium isone of the elements responsible for hardening of watermaking it unfit for consumption. Along with the excessiveconsumption of hardened water over a period of time peoplecan have an acute effect on iron absorption. The level ofcalcium ion in the water samples was found to exceed therange given by the WHO, which makes the water unfit forhuman consumption.12,13,17
Not only these elements but also the SO4−−value was
found to be more than the permissible limit in the samplescollected from the two cities. Upon analysis, its level wasreported to be around 280mg/L, which is a significantincrease from the normal WHO prescribed range. Excess ofconsumption of water having increased sulphate content bythe humans is not considered healthy, and there are chancesthat it would lead to the cathartic effect on the human bodyand result in laxative effect, dehydration and other medicalailments.18–20
Fluoride is another important element essential forhuman life but only if the same is in the WHO prescribedpermissible limit. According to WHO 1984 and Indianstandard drinking water specification 1991 the maximumpermissible limit of fluoride in drinking water is 1.5 ppmand its highest desirable limit is 1.0 ppm. Fluoride’s lowconcentration (approximately 0.5 ppm) is very much neededfor healthy teeth as it helps in preventing conditions likedental caries. Fluoride for teeth acts like an anti-oxidantand forms a hard and tough layer over teeth, preventingthe microbial degradation of the teeth. Also, where its lowconcentration is considered useful its higher concentrationi.e. above 1.5 ppm in drinking water is harmful as itcan cause dental fluorosis and its prolonged much higherconcentration over a long period of time can result inskeletal fluorosis, another medical ailment. Another dangerthat the analysis revealed was that the quantity of fluoridein the water sample of the given areas was also found tobe in excess. The analysis revealed that the Fluoride inwater samples is in a very strong concentration as 1.89-3.5mg.13,19 The total solid in the bodies is determined by thesum of dissolved solids and suspended solids in the waterbody which consists of inorganic salts and a small amount oforganic matter. Increase in suspended solids contains muchof the organic matter and tends to increase the pollution. Anupper limit of these solid particles 500 ppm has been set in
order to control undesirable taste and diarrhoea.19,20
Various physical and chemical parameters ofgroundwater samples of nine different areas of NCR regionand East UP were studied and list of substances foundin the groundwater along with their effects are shown inTables 1, 2, 3 and 4 respectively. And comparative profilesof groundwater samples are represented in Figures 1, 2and 3.
4. Conclusion
After studying Physical and chemical parameters of groundwater and comparing the groundwater quality of differentareas of Ghaziabad (NCR) and Varanasi (East UP), showedhigher values of observed parameters at Salarpur and KaviNagar area of NCR region. This showed that the majorcontaminants in groundwater of NCR region were mixedpollution sources e.g. effluents from Industries, soil andmineral dust. It was concluded that water of these areas areunfit for human consumption and will soon harm a largepopulation with multiple organ failures and other severemedical complications. Thus everyone should support andstrictly follow the governmental norms of pollution to atleast control the level of pollutants which later shouldimmediately be followed by steps to reduce the level andeffect of these pollutants. It should not deny the fact thatpure water is an anticipated need for all life forms. Thoroughtreatment is required for groundwater samples from theseareas before it could be certified fit for human consumption.
5. Source of Funding
None.
6. Conflict of Interest
None.
References1. Available from: www.newhealthadvisor.com/Diseases-Caused-By-
Water-Pollution.html.2. Available from: http://www.explainthatstuff.com/waterpollution.html.3. Dohare D, Deshpande S, Kotiya AA. Analysis of ground water quality
parameters: A Review. Res J Eng Sci. 2014;3(5):26–31.4. Reda AH. Assessment of Physicochemical Quality of Spring Water
in Arbaminch, Ethiopia. J Environ Anal Chem. 2015;02(05):157.doi:10.4172/2380-2391.1000157.
5. Available from: https://medlicker.com/926-alkaline-water-dangers.6. Available from: whqlibdoc.who.int/publications/2009/
9789241563550_eng.7. Available from: www.nrdc.org/issues/water-pollution.8. Available from: http://www.who.int/water_sanitation_health/dwq/
chemicals/sodium.9. Clean Watersheds Needs Survey 2012, Report to Congress,
Environmental Protection Agency, January 2016. 2012;.10. Elton NW, Elton WJ, Nazareno JP. Pathology of Acute Salt
Poisoning in Infants. Am J Clin Pathol. 1963;39(3):252–64.doi:10.1093/ajcp/39.3.252.
11. Tuthill RW, Calabrese EJ. Drinking water sodium and blood pressurein children: A second look. Am J Public Health . 1981;71:722–9.

64 Ain et al. / Indian Journal of Pharmacy and Pharmacology 2021;8(1):58–64
12. Available from: http://www.who.int/water_sanitation_health/dwq/chemicals/sulfate.
13. Chinoy JN. Effects of fluoride on physiology of animals and humanbeings. Indian J Environ Toxicol. 1991;1:17–32.
14. Reda AH. Physico-chemical characterization of tannery effluent andits impact on the nearby river. J Environ Chem Ecotoxicol. 2016;8:44–50.
15. Available from: https://medlicker.com/926-alkaline-water-dangers.16. Fatula MI. The frequency of arterial hypertension among persons
using water with elevated sodium chloride content. Soviet Med.1967;30:134–6.
17. Available from: http://www.bioray.com/content/Chlorine.18. Available from: https://www.sciencedaily.com/terms/water_pollution.
htm.19. Bureau of Indian Standards, New Delhi, IS 10500: 2012.20. Koplin D. Agricultural chemicals in Iowa’s ground water. US
Geological Surv. 1997;p. 1982–95.
Author biography
Shabnam Ain, Professor
https://orcid.org/0000-0003-0986-1037
Qurratul Ain, Professor
Shambhavi Chaturvedi, Student
Babita Kumar, Director
Cite this article: Ain S, Ain Q, Chaturvedi S, Kumar B. Comparativeassessment of groundwater quality in different areas of Delhi NCR(Ghaziabad, Noida) and East UP (Varanasi). Indian J Pharm Pharmacol2021;8(1):58-64.