original article - washington university in st. louisgzhang/publications/cp3.pdf · diac...
TRANSCRIPT

1228
Atrial and ventricular action potentials are initiated by a large membrane-depolarizing Na+ flux through the car-
diac voltage-gated Na+ channel (NaV1.5). In large animals and
humans, persistent NaV1.5 current is also a significant regu-
lator of action potential duration. Because of its central role in determining the action potential, molecular-level interac-tions that perturb Na
V1.5 channel function have a significant
effect on the ability of the myocardium to initiate and sus-tain arrhythmias. Mutations to Na
V1.5 are known to cause
long QT syndrome type 3, Brugada syndrome (BrS), sick sinus syndrome, atrial fibrillation, and familial heart block.1,2 Furthermore, class I small molecule antiarrhythmics target the Na
V1.5 pore with the aim of diminishing Na+ current to pre-
vent arrhythmia.3 To date, characterization of NaV1.5 muta-
tion pathology and drug interactions has primarily relied on measuring the ionic current response to elaborately designed voltage-pulse protocols. Here, we develop novel Na
V1.5 con-
structs to augment these protocols by monitoring changes in
conformation with fluorescence labeling, at the same time we observe the ionic current, with voltage-clamp fluorometry (VCF). By applying VCF to observe channels that carry inher-ited mutations, we expect to improve phenotypic precision by characterizing the molecular pathology of the disease.
The NaV1.5 α-subunit, encoded by SCN5A, is composed
of 4 homologous domains (DI–DIV), each with 6 transmem-brane-spanning segments (S1–S6). Within DI–DIV, S1–S4 form the voltage-sensing domains (VSDs), which respond to changes in membrane potential (V
m) to cause Na
V1.5 gating.
The NaV1.5 pore is formed by the S5–S6 segments. A hydro-
phobic triplet located in the intracellular DIII/DIV linker is required for inactivation,4 and its action is modulated by the C-terminus.5
Previously, VCF was used to relate skeletal muscle Na+ channel, Na
V1.4, VSD conformations to channel activation
and inactivation6–10 and to probe the domain-specific interac-tions of toxins11–13 and local anesthetics.14,15
© 2015 American Heart Association, Inc.
Circ Arrhythm Electrophysiol is available at http://circep.ahajournals.org DOI: 10.1161/CIRCEP.115.003155
Original Article
Background—Dysregulation of voltage-gated cardiac Na+ channels (NaV1.5) by inherited mutations, disease-linked
remodeling, and drugs causes arrhythmias. The molecular mechanisms whereby the NaV1.5 voltage-sensing domains
(VSDs) are perturbed to pathologically or therapeutically modulate Na+ current (INa
) have not been specified. Our aim was to correlate I
Na kinetics with conformational changes within the 4 (DI–DIV) VSDs to define molecular mechanisms
of NaV1.5 modulation.
Method and Results—Four NaV1.5 constructs were created to track the voltage-dependent kinetics of conformational changes
within each VSD, using voltage-clamp fluorometry. Each VSD displayed unique kinetics, consistent with distinct roles in determining I
Na. In particular, DIII-VSD deactivation kinetics were modulated by depolarizing pulses with durations in the
intermediate time domain that modulates late INa
. We then used the DII-VSD construct to probe the molecular pathology of 2 Brugada syndrome mutations (A735V and G752R). A735V shifted DII-VSD voltage dependence to depolarized potentials, whereas G752R significantly slowed DII-VSD kinetics. Both mutations slowed I
Na activation, although DII-
VSD activation occurred at higher potentials (A735V) or at later times (G752R) than ionic current activation, indicating that the DII-VSD allosterically regulates the rate of I
Na activation and myocyte excitability.
Conclusions—Our results reveal novel mechanisms whereby the NaV1.5 VSDs regulate channel activation and inactivation.
The ability to distinguish distinct molecular mechanisms of proximal Brugada syndrome mutations demonstrates the potential of these methods to reveal how inherited mutations, post-translational modifications, and antiarrhythmic drugs alter Na
V1.5 at the molecular level. (Circ Arrhythm Electrophysiol. 2015;8:1228-1239. DOI: 10.1161/
CIRCEP.115.003155.)
Key Words: Brugada syndrome ◼ fluorometry ◼ ion channels ◼ mutation ◼ sodium channels
Received December 3, 2014; accepted July 26, 2015.From the Department of Biomedical Engineering, Washington University in St. Louis, MO (Z.V., W.Z., A.R.S., J.L.P., A.K., E.J.H., M.A.Z., J.C., J.R.S.);
and MTA-DE-NAP B Ion Channel Structure-Function Research Group, RCMM, Department of Biophysics and Cell Biology, University of Debrecen, Debrecen, Hungary (Z.V.).
The Data Supplement is available at http://circep.ahajournals.org/lookup/suppl/doi:10.1161/CIRCEP.115.003155/-/DC1.Correspondence to Jonathan R. Silva, PhD, Washington University in St. Louis, Campus Box 1097, 1 Brookings Dr, St. Louis, MO 63130. E-mail
Direct Measurement of Cardiac Na+ Channel Conformations Reveals Molecular Pathologies of Inherited Mutations
Zoltan Varga, PhD; Wandi Zhu, BS; Angela R. Schubert, BS; Jennifer L. Pardieck, BS; Arie Krumholz, PhD; Eric J. Hsu, BS; Mark A. Zaydman, BS; Jianmin Cui, PhD;
Jonathan R. Silva, PhD
by guest on March 22, 2017
http://circep.ahajournals.org/D
ownloaded from
by guest on M
arch 22, 2017http://circep.ahajournals.org/
Dow
nloaded from
by guest on March 22, 2017
http://circep.ahajournals.org/D
ownloaded from
by guest on M
arch 22, 2017http://circep.ahajournals.org/
Dow
nloaded from
by guest on March 22, 2017
http://circep.ahajournals.org/D
ownloaded from
by guest on M
arch 22, 2017http://circep.ahajournals.org/
Dow
nloaded from
by guest on March 22, 2017
http://circep.ahajournals.org/D
ownloaded from
by guest on M
arch 22, 2017http://circep.ahajournals.org/
Dow
nloaded from
by guest on March 22, 2017
http://circep.ahajournals.org/D
ownloaded from

Varga et al Cardiac Na+ Channel Conformations 1229
In this study, we present 4 novel constructs that report on the distinctive VSD conformations of Na
V1.5 for the pur-
pose of assessing molecular mechanisms of NaV1.5-linked
pathologies and therapies. To demonstrate the potential of the method, we probe the molecular phenotype of 2 proximal BrS mutations, A735V and G752R, which are both located on the DII-VSD. The electrocardiographic phenotypes of patients with each mutation differ. Patients with A735V present with ST-segment elevation in leads V1–V3,16 whereas those with G752R show ST-segment elevation17 in addition to a promi-nent J wave in leads II, III, and aVF.18 We hypothesized that in addition to electrocardiographic differences, there may also exist fundamentally different molecular pathologies, despite the proximity of the mutations.
Materials and MethodsVoltage-Clamp FluorometrycRNAs for human Na
V1.5 α- and β
1-subunits were injected into
Xenopus laevis oocytes for cut-open oocyte recordings19,20 at 19°C. The internal solution was 105 mmol/L of NMG-Mes, 10 mmol/L of Na-Mes, 20 mmol/L of HEPES, and 2 mmol/L of EGTA, pH 7.4, and the external solution was composed of 25 mmol/L of NMG-Mes, 90 mmol/L of Na-Mes, 20 mmol/L of HEPES, and 2 mmol/L of Ca-Mes
2,
pH 7.4. For gating currents, 10 μmol/L of tetrodotoxin was used, and Na-Mes was replaced by NMG-Mes. For fluorescence recordings, oocytes were labeled with 10 µmol/L of methanethiosulfonate-car-boxytetramethylrhodamine (MTS-TAMRA). Data were collected on a custom rig (Methods section in the Data Supplement). Animal proce-dures were performed according to institutional guidelines.
Data AnalysisFor photobleaching correction, baseline fluorescence recorded over time without voltage pulsing was subtracted from traces recorded
during the application of the voltage protocol. Fluorescence magni-tude is expressed as ΔF/F
0, ΔF is the signal amplitude change and F
0
is the baseline fluorescence.Steady-state voltage dependence was quantified by Boltzmann
function fitting: y=1/(1+exp[(V−V1/2
)/k]). t10%–90%
for current activa-tion is the duration between 10% and 90% of the ionic current peak. For fluorescence signals, t
10%–90%,C was calculated from the time con-
stants of single exponential fits (τ).Statistical comparisons were done using paired or independent-
sample t tests or 1-way ANOVA with post hoc tests for pairwise com-parison. P<0.05 was considered significant. The ± symbols in the text and error bars in the figures represent the 95% confidence interval with the number of trials [n] in brackets.
ResultsOur first aim was to create 4 Na
V1.5 constructs to track con-
formational changes within each of the NaV1.5 channel VSDs.
Initial attempts to record fluorescence signals were unsuc-cessful because of insufficient expression of human Na
V1.5,
which is significantly reduced compared with rat NaV1.4, the
isoform used to acquire most existing Na+-channel VCF data. Examination of differences between the 2 channels revealed that Na
V1.5 contains an ubiquitination motif that enhances the
channel recycling rate and reduces the number of channels in the membrane21; this motif is not found in Na
V1.4. Ablation of
the ubiquitination site by the Y1977A mutation and coinjec-tion with β
1-subunit RNA resulted in sufficient Na
V1.5 expres-
sion for the detection of useful fluorescence signals. We also introduced C373Y, increasing tetrodotoxin22 sensitivity and allowing ionic current blockade for the measurement of gating currents. This mutation also removes an externally accessible cysteine, preventing nonspecific labeling.
Two protocols were performed to compare our new con-struct with wild-type (WT). We first quantified the conduc-tance–voltage (G–V) relationship, found by measuring peak current after a series of depolarizing pulses and dividing by driving force. The second protocol measured the voltage dependence of steady-state inactivation (SSI); peak current was measured during a short test pulse to −20 mV that fol-lowed 200-ms inactivation-inducing pulses to varying poten-tials. The voltage dependence of the G–V and SSI curves was not substantially affected by these mutations (P=0.951 and 0.069, respectively; Figure 1). For fluorescence track-ing, cysteine mutations (specified below) in the individual domains were introduced in this Y1977A–C373Y mutant, which we named WT-LFS (large fluorescence signal). The mutants produced for VSD tracking in this background will be accordingly referred to as DI-LFS, DII-LFS, DIII-LFS, and DIV-LFS. Cysteines were introduced at several positions within each VSD, but most of these did not produce useful signals. We were fortunate to find a single useful site for each domain.
To track the conformation of the DI-VSD, we tested 10 positions from L212 to T220 and R222. V215C (DI-LFS) was the only mutant to express well and produce a usable fluorescence signal (Figure 2). The Na
V1.5 VSDs play an
essential role in determining gating, and we expected the MTS-TAMRA labeling in conjunction with the introduced cysteine to affect gating to some extent. We observed a nega-tive shift (ΔV
1/2=−16.8 mV) in the G–V and a slight positive
shift (ΔV1/2
=+8 mV) in the SSI curves compared with the
WHAT IS KNOWN
•The cardiac Na+ channel initiates atrial and ventric-ular action potentials, and inherited mutations that cause its dysfunction lead to syndromes that predis-pose patients to sudden death.
•Commonly prescribed class I antiarrhythmics that are targeted to the Na+ channel can be effective for treating and diagnosing affected patients. However, the most effective drug choice for treating patients with a particular mutation is not always apparent.
WHAT THE STUDY ADDS
•We develop protocols to observe the voltage-sensing machinery that controls cardiac Na+-channel open-ing and closing to understand how inherited muta-tions pathologically alter the channel at the molecu-lar level.
•Despite having similar ionic current phenotypes, we observed that 2 proximal Brugada syndrome muta-tions display different molecular characteristics. This improved phenotypic precision may eventually enable therapeutic approaches that specifically ac-count for the molecular pathology of the arrhythmia.
by guest on March 22, 2017
http://circep.ahajournals.org/D
ownloaded from

1230 Circ Arrhythm Electrophysiol October 2015
background WT-LFS construct, implying that the labeled V215C channel opens at more negative potentials and inac-tivates at more positive potentials than WT-LFS. Comparing labeled and unlabeled DI-LFS showed that the G–V shift is a consequence of adding the MTS-TAMRA label (Figure I in the Data Supplement). We also used gating currents to assess whether charge movement across the transmembrane electric field was affected by labeling (Figure II in the Data Supplement). If the probe significantly affected charge trans-fer, we would expect to observe a change in the voltage dependence of the gating current integral, the gating charge. For the 4 constructs, the charge–voltage (Q–V) relationship was shifted over a range of 5 to 11 mV in comparison with WT-LFS (Figure I in the Data Supplement; Table), suggesting that charge displacement was modestly affected by cysteine-conjugated fluorophore replacement of the WT residue.
Simultaneously, recording changes in fluorescence mag-nitude during these protocols allowed us to correlate DI-VSD conformations with channel gating. We refer to the fluo-rescence that was recorded during the G–V protocol as the fluorescence–voltage relationship (F–V curve) and the fluo-rescence from the SSI protocols as the SSI F–V curve. The F–V curves reflect the voltage dependence of the conformations
in the DI-VSD that are reported by MTS-TAMRA. For the DI-VSD, the midpoint of the F–V curve was 27.2-mV negative of the G–V curve, indicating that DI-VSD movement occurs at much more negative potentials than pore opening. On the contrary, the SSI and SSI F–V curves had similar midpoints, showing that inactivation and DI-VSD movement occur in the same voltage range. However, in contrast to DIV, the DI-VSD SSI F–V and SSI slopes differed substantially (k=−15.4 [5] versus −6.4 [8] mV, respectively; P<0.001), suggesting that the 2 events are not tightly coupled.
The fluorescence kinetics recorded during the F–V curve reflect the voltage-dependent rates of VSD activation and deactivation. Because current and VSD activation kinetics are described by different functions, we measured the time between 10% and 90% of the peak current and calculated t10%–90%,C
for fluorescence (Methods section). DI-VSD rise time was slower (t
10%–90%,C=0.82±0.23 ms at +30 mV) than
ionic current activation (t10%–90%
=0.24±0.04 ms), but the events overlapped because of the sigmoidal delay in ionic current activation (Figure III in the Data Supplement). At elevated potentials (>+20 mV), a slow component in the DI-VSD fluo-rescence signal became apparent with an opposite sign rela-tive to the original deflection. Although significant numbers
Figure 1. Ionic and gating currents from the wild-type large fluorescence signal (WT-LFS) construct. Currents from WT-LFS and WT chan-nels were recorded in the cut-open oocyte configuration. The mean±95% confidence interval for groups of 6 to 22 cells is reported. A, Top, Ionic currents. From −100 mV, a 50-ms step to −120 mV preceded 100-ms depolarizing pulses from −140 to +40 mV in 10-mV steps, which were followed by a 50-ms step to −120 mV before returning to holding potential. Membrane capacitance and leak were removed using P/−8 leak subtraction. For clarity, only the first 40 ms of traces corresponding to −130 to +30 mV in 20-mV steps are shown. Bottom, Voltage dependence of steady-state activation and steady-state inactivation (SSI) curves for the WT-LFS (G–V, black circles; SSI, black squares) and the WT channels (G–V, gray up triangle; SSI, gray down triangle). G–V curves were constructed from I–V relationships recorded from cells depolarized in 10- or 20-mV increments from −120 mV. Na+ reversal potential was determined for each cell individually. For the SSI curve, cells were held at potentials ranging from −150 to +20 mV for 200 ms, and the available fraction was assessed by a −20-mV test pulse. Boltzmann-fit parameters are provided in the Table. B, Top, Gating currents from WT-LFS channels were recorded during 20-ms depolarizing steps ranging from −150 to +50 mV in 20-mV steps. Capacitance and leak were removed using P/4 leak subtraction with a subsweep holding level of +40 mV. Bottom, Gating currents were integrated for 10 ms after the voltage change.
by guest on March 22, 2017
http://circep.ahajournals.org/D
ownloaded from

Varga et al Cardiac Na+ Channel Conformations 1231
of channels will not make this slow transition to a new state during a single action potential, channels may accumulate in this state at rapid heart rates.
Because fast inactivation is known to hinder the recovery of the gating charges on repolarization (immobilization), we performed experiments to measure the deactivation rate of the DI-VSD after depolarizing pulses of varying length, which inactivated the channels to different extents. The deactivation kinetics measured at −120 mV did not change as a function of pulse duration (t
10%–90%,C=0.99±0.22 ms after a 2-ms pulse
and 0.99±0.13 ms after a 200-ms pulse [4]; P=0.948). This result suggests that DI-VSD deactivation is not influenced by Na
V1.5 open-state inactivation, which had not occurred during
the 2-ms pulse and is nearly complete after 200 ms.
We tracked the DII-VSD with S805C (DII-LFS), which yielded large and robust signals. The voltage-dependent steady-state parameters (G–V and SSI curves) were mini-mally affected in comparison with WT-LFS; there was no shift in the G–V curve and a +7.4-mV shift in the SSI curve (Figure 3). Measurement of the F–V revealed that it was 12.5-mV negative of the G–V curve, showing that the DII-VSD starts to move before activation; however, it reaches saturation at higher potentials than the conductance because of its shal-lower slope, which indicates that the 2 events are not tightly coupled. Comparing the SSI and SSI-FV curves shows that inactivation occurs at more negative potentials than DII-VSD activation (V
1/2=−79.2 and −52.2 mV, respectively) and that
the inactivation slope is much steeper than DII-VSD activation
Figure 2. V215C (DI-large fluorescence signal [LFS]) ionic currents and fluorescence. Na+ currents and fluorescence were recorded from human NaV1.5 channels carrying the LFS-S215C mutations with cut-open oocyte voltage-clamp fluorometry (Materials and Methods sec-tion). The mean±95% confidence interval for groups of 4 to 14 cells is reported. A, Top, Ionic currents (above) and fluorescence signals (below). From −100 mV, a 50-ms step to −120 mV preceded 20-ms-long depolarizing pulses ranging from −150 to +30 mV in 20-mV steps. These steps were then followed by a 50-ms step to −120 mV before returning to the holding potential. Membrane capacitance and leak were removed using P/−8 leak subtraction. For clarity, only traces corresponding to −150, −90, −30, and +30 mV are shown. Bottom, G–V curve (black circles) and steady-state inactivation (SSI; black squares) and the corresponding fluorescence signals (orange circles and squares, respectively). All curves were obtained by Figure 1 protocols. The fluorescence amplitude for the F–V and SSI F–V curves was determined by taking the mean of the signal for at least 3 ms at the greatest displacement of the signal. For the SSI F–V curve, ΔF was calculated as the difference between the signal amplitude measured at the conditioning potential and −20 mV. Boltzmann-fit parameters are provided in the Table. Dotted lines represent WT-LFS G–V and SSI curves for comparison. B, Top, Tail currents and fluorescence measured at −120 mV after depolarizing steps to +50 mV for 2 (black) or 200 ms (orange). Inactivation does not occur during the shorter pulse resulting in a large tail current. Bottom, t10%–90%,C values calculated from deactivation time constants of the fluorescence signal from exponential fits after the step back to −120 mV, from depolarizing steps to 0 or +50 mV for 1- to 200-ms durations.
by guest on March 22, 2017
http://circep.ahajournals.org/D
ownloaded from
1232 Circ Arrhythm Electrophysiol October 2015
(k=−6.5 [7] and −17.5 [6] mV, respectively; P<0.001). Thus, at holding potentials which completely abolish the conduc-tance by inactivation (V>−50 mV), the DII-VSD is still far from having completed its motion, likely precluding it from participating in closed-state inactivation. The DI-VSD and DII-VSD activate at similar rates (t
10%–90%,C=0.98±0.19 ms at
+30 mV [5]; P=0.332), and when superimposed on the ionic current, DII-VSD activation precedes ionic current activation (Figure III in the Data Supplement). As for DI, the DII-VSD deactivation kinetics are not substantially affected by the length of the depolarizing pulse (t
10%–90%,C=0.86±0.29 ms after
2 ms and 0.99±0.13 ms after 200 ms [4]; P=0.171).Conformations in the DIII-VSD were tracked with
M1296C (DIII-LFS), which was the only construct to produce a signal out of I1299C, K1300C, and S1301C. The DIII con-struct had G–V and SSI curves nearly identical to those of DII, but relative to the DII-VSD, the F–V, and SSI F–V curves were dramatically shifted by −54.6 and −70.3 mV, respectively (Figure 4). Comparison of the G–V and SSI curves shows that DIII-VSD activation precedes pore opening by a large volt-age margin during activation, and similarly, during inactiva-tion, most of the VSD movement is completed before any noticeable drop in the conductance because of inactivation. Activation kinetics of the DIII-VSD were similar to those of DI and DII (t
10%–90%,C=0.81±0.25 ms at +30 mV [5]; P=0.332),
although deactivation was >10× slower. Furthermore, in con-trast to DI and DII, the deactivation kinetics of the DIII-VSD were significantly slowed when the duration of depolarizing pulse was increased (t
10%–90%,C=12.85±2.37 ms after a 2-ms
pulse and 18.58±1.58 after 200 ms [6]; P=0.009). The mark-edly slowed deactivation of the DIII-VSD after long depolar-izations indicates that its return could be inhibited by entry
of the channel into the deeper inactivated states that occur after longer depolarizations that stabilize it in the activated conformation.
Finally, to track the DIV-VSD, we introduced S1618C (DIV-LFS) and L1621C (no signal). The unlabeled DIV-LFS construct displays a nonsaturating SSI curve that is corrected by fluorophore conjugation. Recording of the unlabeled con-struct with a reducing agent confirmed that this phenomenon was because of disulphide bond formation in the absence of the fluorophore (Figure I in the Data Supplement). Both the G–V and SSI curves of the DIV-VSD construct were shifted relative to WT-LFS by +5.3 and +12.4 mV, respec-tively (Figure 5). Comparison of the fluorescence and ionic current shows that the midpoint of the F–V curve was 32.2 mV more negative than that of the G–V, whereas the SSI and SSI F–V curves overlapped, further supporting strong correla-tion between DIV-VSD activation and closed-state inactiva-tion that is primarily measured by the SSI curve. In addition, slowing of fast inactivation caused by the introduction of the cysteine mutation is also readily apparent in the ionic cur-rent recordings. In comparison with the other 3 domains, the DIV fluorescence signal activated much more slowly (t10%–
90%,C=1.91±0.44 ms at +30 mV [7]; P<0.001). Deactivation
kinetics were significantly slower than those of the DI and DII but 2 to 3× faster than that of DIII. Surprisingly, DIV-VSD deactivation did not slow with increasing pulse duration (t
10%–
90%,C=5.71±4.04 ms after a 2-ms pulse and 6.63±3.91 ms after
200-ms pulse [4]; P=0.411). Given the prominent role of DIV in inactivation, the lack of slowing in DIV-VSD recovery with longer pulses is highly unexpected and is in clear contrast with Na
V1.4 results,8 suggesting different interactions between the
DIII- and DIV-VSDs and inactivation.
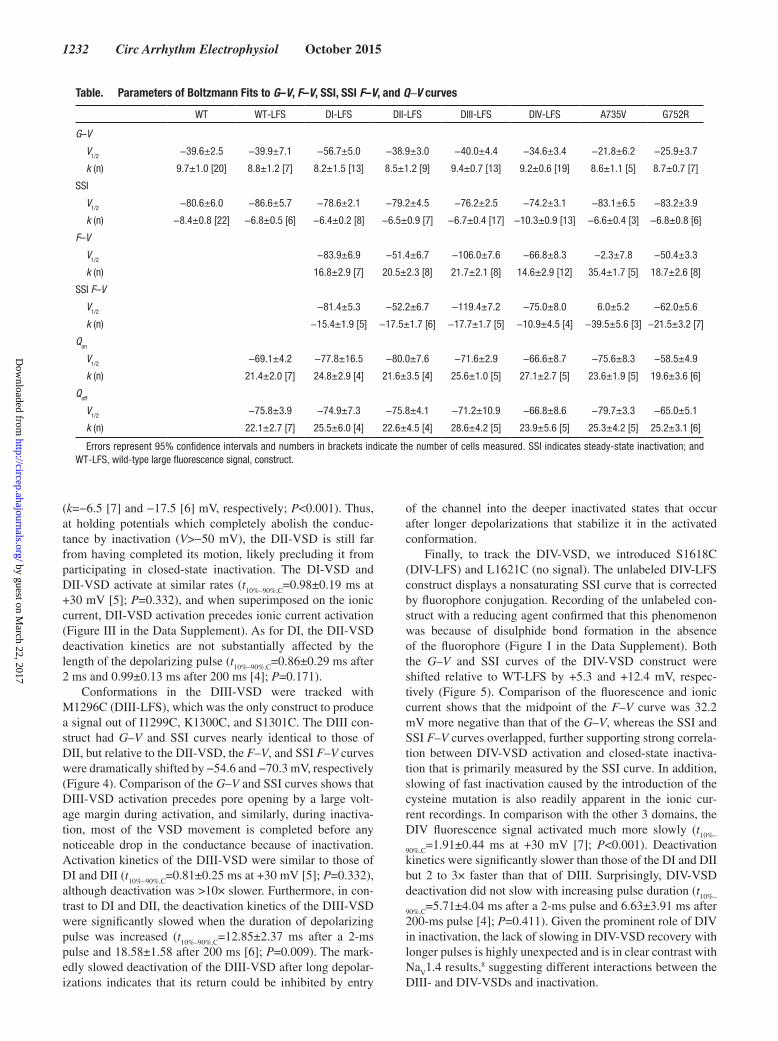
Table. Parameters of Boltzmann Fits to G–V, F–V, SSI, SSI F–V, and Q–V curves
WT WT-LFS DI-LFS DII-LFS DIII-LFS DIV-LFS A735V G752R
G–V
V1/2
−39.6±2.5 −39.9±7.1 −56.7±5.0 −38.9±3.0 −40.0±4.4 −34.6±3.4 −21.8±6.2 −25.9±3.7
k (n) 9.7±1.0 [20] 8.8±1.2 [7] 8.2±1.5 [13] 8.5±1.2 [9] 9.4±0.7 [13] 9.2±0.6 [19] 8.6±1.1 [5] 8.7±0.7 [7]
SSI
V1/2
−80.6±6.0 −86.6±5.7 −78.6±2.1 −79.2±4.5 −76.2±2.5 −74.2±3.1 −83.1±6.5 −83.2±3.9
k (n) −8.4±0.8 [22] −6.8±0.5 [6] −6.4±0.2 [8] −6.5±0.9 [7] −6.7±0.4 [17] −10.3±0.9 [13] −6.6±0.4 [3] −6.8±0.8 [6]
F–V
V1/2
−83.9±6.9 −51.4±6.7 −106.0±7.6 −66.8±8.3 −2.3±7.8 −50.4±3.3
k (n) 16.8±2.9 [7] 20.5±2.3 [8] 21.7±2.1 [8] 14.6±2.9 [12] 35.4±1.7 [5] 18.7±2.6 [8]
SSI F–V
V1/2
−81.4±5.3 −52.2±6.7 −119.4±7.2 −75.0±8.0 6.0±5.2 −62.0±5.6
k (n) −15.4±1.9 [5] −17.5±1.7 [6] −17.7±1.7 [5] −10.9±4.5 [4] −39.5±5.6 [3] −21.5±3.2 [7]
Qon
V1/2
−69.1±4.2 −77.8±16.5 −80.0±7.6 −71.6±2.9 −66.6±8.7 −75.6±8.3 −58.5±4.9
k (n) 21.4±2.0 [7] 24.8±2.9 [4] 21.6±3.5 [4] 25.6±1.0 [5] 27.1±2.7 [5] 23.6±1.9 [5] 19.6±3.6 [6]
Qoff
V1/2
−75.8±3.9 −74.9±7.3 −75.8±4.1 −71.2±10.9 −66.8±8.6 −79.7±3.3 −65.0±5.1
k (n) 22.1±2.7 [7] 25.5±6.0 [4] 22.6±4.5 [4] 28.6±4.2 [5] 23.9±5.6 [5] 25.3±4.2 [5] 25.2±3.1 [6]
Errors represent 95% confidence intervals and numbers in brackets indicate the number of cells measured. SSI indicates steady-state inactivation; and WT-LFS, wild-type large fluorescence signal, construct.
by guest on March 22, 2017
http://circep.ahajournals.org/D
ownloaded from

Varga et al Cardiac Na+ Channel Conformations 1233
Our next aim was to assess the molecular pathology of 2 proximal DII-VSD BrS mutations, A735V and G752R (Figure 6). We introduced each into the DII-LFS construct. The F–V and SSI F–V curves of A735V were dramatically positive-shifted relative to DII-LFS (by +49.1 mV and +58.5 mV, respectively) and also relative to the G–V and SSI curves of the channel itself (by +19.5 mV and +89.1 mV, respec-tively). In addition, the voltage sensitivity of the DII-VSD was severely reduced; both had shallow slope factors (35.4 mV and −39.5 mV, respectively). DII-VSD activation kinetics were also slightly slowed by the mutation at +40 mV based on the t
10%–90%,C values (DII-LFS: 0.99±0.19 ms [8] and DII-LFS-
A735V: 1.49±0.36 ms [5]; P=0.005), but even more strikingly, the DII-VSD activation rate of the mutant lost its voltage dependence (1.45±0.42 ms at −20 mV and 1.49±0.36 ms at +40 mV [5]; P=0.850) as opposed to DII-LFS (1.42±0.19 ms at −20 mV and 0.99±0.19 ms at +40 mV [8]; P=0.002). To the contrary, ionic current activation of the mutant conserved its voltage dependence but was slower than DII-LFS at potentials
<10 mV (t10%–90%
=1.48±0.17 ms [5] versus 0.71±0.47 ms [3], respectively, at −20 mV; P=0.002). Despite the severely right-shifted F–V of A735V, the mutant Q–V (V
1/2=−75.6±8.3
mV [5]) was not significantly different from that of DII-LFS (−80.0±7.6 mV [4]; P=0.241) or WT-LFS (−69.1±4.2 mV [7]; P=0.058).
In contrast, G752R caused minor F–V and SSI F–V shifts (by +1.0 mV and −9.8 mV, respectively, compared with DII-LFS) and displayed similar slope factors but resulted in a severe slowing of the DII-VSD activation. In response to a depolarizing step, the rate of DII-VSD activation was about 7-fold slower in the mutant than in the DII-LFS channel (t
10%–
90%,C=0.99±0.19 ms [8] and 6.96±1.21 ms [8] at +40 mV,
respectively; P<0.001). The Q–V curve was right-shifted by ≈20 mV with respect to DII-LFS. However, extending the interval over which charge was integrated from 10 to 20 ms, to account for G752R-induced slowing, shifted the curve left-ward and closer to DII-LFS. Significant slowing of activation kinetics was also observed in the ionic current of G752R. In
Figure 3. DII-large fluorescence signal (LFS; S805C) ionic currents and fluorescence. Na+ currents and fluorescence were recorded from DII-LFS. Conditions were as in Figure 2 unless noted. The mean±95% confidence interval is reported for groups of 3 to 9 cells. A, Top, Ionic currents (above) and fluorescence (below). Bottom, G–V curve (black circles), steady-state inactivation (SSI; black squares), and the corresponding fluorescence (green circles and squares, respectively). Curves were constructed as in Figure 2. Boltzmann-fit parameters are provided in the Table. Dotted lines represent wild-type G–V and SSI curves for comparison. B, Tail currents and fluorescence mea-sured after the step back to −120 mV from depolarizing steps to +50 mV for 2 (black) or 200 ms (green). t10%–90%,C values calculated from deactivation time constants of the fluorescence signal from exponential fits after the step back to −120 mV, from depolarizing steps to 0 or +50 mV for 1- to 200-ms durations.
by guest on March 22, 2017
http://circep.ahajournals.org/D
ownloaded from

1234 Circ Arrhythm Electrophysiol October 2015
the −40 to +30 mV voltage range, the activation rate was 1.7 to 2.9× slower than that of the DII-LFS as measured by the t
10%–90%
times (1.51±0.15 ms [7] and 0.71±0.47 ms [3], respectively, at −20 mV; P<0.001; Figure IV in the Data Supplement).
To ensure that the mechanisms we observed in oocytes are still operative across cell lines, we expressed both mutants in HEK293T cells. A comparison (Figure V in the Data Supplement) shows that as in oocytes, current activation mea-sured by the t
10%–90% was slowed in both BrS mutants compared
with DII-LFS (at −20 mV, DII-LFS: 0.27±0.09 ms [4], A735V: 0.81±0.32 ms [5], G752R: 0.66±0.07 ms [4]; P=0.002).
DiscussionOur results represent the first measurements of human Na
V1.5
VSD conformations and show that each VSD has unique kinetics, consistent with specific gating roles. Specifically, the
4 VSDs activate at different membrane potentials that span a range >50 mV. DIII activates at the most hyperpolarized potentials (V
1/2=−106.0 mV), followed by DI (−83.9 mV),
DIV (−66.8), and finally DII (−51.4), all negative of the G–V curve that characterizes current activation (V
1/2=−39.9 mV for
WT-LFS). Furthermore, all 4 VSDs have a t10%–90
rise time that is slower than ionic current activation, which is to be expected if ionic current activation is caused by the combined motions of several VSDs that can be modeled as a cubed gate (eg, m3 in Hodgkin–Huxley type models), allowing for a more rapid activation after a delay.
Although our results support the hypothesis of concerted action of several VSDs in activating Na
V channels, our mutation
results contrast to classical models that require tight coupling of the gates to pore opening. Comparing DII-VSD activation volt-age dependence in A735V with its G–V relationship (Figure 6A)
Figure 4. DIII-large fluorescence signal (LFS; M1296C) ionic currents and fluorescence. Na+ currents and fluorescence from DIII-LFS. The mean±95% confidence interval is reported for groups of 5 to 17 cells. A, Top, Ionic currents (above) and fluorescence (below) were recorded during 20-ms pulses ranging from −170 to +30 mV in 20-mV steps. For clarity, only traces corresponding to −170, −110, −50, and +10 mV are shown. Bottom, G–V (black circles), steady-state inactivation (SSI; black squares), and the corresponding fluorescence signals (blue circles and squares, respectively). Curves were constructed as in Figure 2. Boltzmann-fit parameters in Table. For compari-son, dotted lines represent wild-type G–V and SSI curves. B, Tail currents and fluorescence measured after the step back to −120 mV from depolarizing steps to +50 mV for 2 (black) or 200 ms (green) pulses. Red dotted lines indicate exponential fits to the fluorescence traces. Time constants for this cell were 4.1 and 7.5 ms after 2- and 200-ms-long depolarizations, respectively. t10%–90%,C values calculated from deactivation time constants of the fluorescence signal from exponential fits after the step back to −120 mV, from depolarizing steps to 0 or +50 mV for 1- to 200-ms durations.
by guest on March 22, 2017
http://circep.ahajournals.org/D
ownloaded from

Varga et al Cardiac Na+ Channel Conformations 1235
reveals that the channel fully opens at 0 mV, although the DII-VSD is not fully activated even at +80 mV. This phenomenon is observed in DII-LFS as well, indicating that this property is intrinsic to NaV1.5, but the effect is greatly enhanced in A735V. Thus, DII-VSD activation facilitates channel opening through an allosteric mechanism where the lack of VSD activation sim-ply slows activation but does not prevent it. This mechanism may be evolutionarily beneficial because it allows for moderate alteration of VSD kinetics by mutations without preventing Na+ channel activation and myocyte excitability.
Correlation of VSD activation with inactivation can be assessed by comparing the SSI and SSI F–V curves and pulse duration protocols. The SSI protocols show that the DII-VSD is least likely to participate in inactivation: at potentials, when the channel is completely blocked by inactivation, the DII-VSD has yet to significantly activate (Figure 3). In contrast, the close overlap of the SSI and DIV SSI F–V curves supports the notion that the closed-state inactivation reported by this
protocol is tightly coupled to DIV-VSD movement. Finally, the pulse duration protocol may reveal VSD interaction with deeper inactivation states that occur at depolarized potentials, which are likely to modulate the late Na+ current.
Origin of ΔFOur detected changes in MTS-TAMRA fluorescence emis-sion are likely due to photoinduced electron transfer, which is a quenching nonradiative electron transfer between 2 mol-ecules that are within 10 Å, in close van der Waals contact.23 Many different residues may quench the fluorophore, which implies that our fluorescence signal is highly dependent on the surrounding residues that interact with the fluorophore as it moves. This dependence introduces the possibility that the fluorescence changes we observe do not necessarily reflect the movement of the charged S4 segments across the membrane.
Our Q–V curves that are calculated from gating cur-rents directly quantify charge transfer within all 4 domains
Figure 5. DIV-large fluorescence signal (LFS; S1618C) ionic currents and fluorescence. Na+ currents and fluorescence from DIV-LFS. The mean±95% confidence interval is reported for groups of 3 to 20 cells. A, Top, Ionic currents (above) and fluorescence (below) as in Figure 2. Only traces from −150, −90, −30, and +30 mV are shown for clarity. G–V (black circles) and steady-state inactivation (SSI; black squares), and the corresponding fluorescence signals (purple circles and squares, respectively). Curves were constructed as in Figure 2. Boltzmann-fit parameters are provided in the Table. Dotted lines represent wild-type G–V and SSI curves for comparison. B, Top, Tail currents and fluorescence measured during step back to −120 mV from steps to +50 mV for 2 (black) or 200 ms (green) pulses. Bottom, t10%–90%,C values calculated from deactivation time constants of the fluorescence signal from exponential fits after the step back to −120 mV, from depolarizing steps to 0 or +50 mV for 1- to 200-ms durations.
by guest on March 22, 2017
http://circep.ahajournals.org/D
ownloaded from

1236 Circ Arrhythm Electrophysiol October 2015
across the membrane field. Thus, we expect that if we are tracking charge transfer, then the valence-weighted aver-age midpoint of the F–V curves will match the Q–V curves (Figure 7; Table).6,24 The WT-LFS Q–V is accurately recon-structed by the valence-weighted F–V curves (Figure 7A). Moreover, the confounding left shift in the A735V Q–V rela-tive to G752R is also predicted by this analysis (Figure 7B) and results from much less charge being assigned to the DII
F–V because of its reduced slope, which lessens its right-shifting contribution. With the G752R construct, we observe less charge transferred at some of the lower potentials. This slight difference is likely due to the substantial slowing of charge movement at these potentials, which sharply reduces the gating current and precludes its detection. Alternatively, G752R may be slowing the activation of the other 3 domains, causing a right-shifted Q–V. Previous work in Na
V1.4 shows
Figure 6. DII-large fluorescence signal (LFS)-A735V and DII-LFS-G752R Brugada syndrome mutants. Na+ currents and fluorescence were recorded from A735V (left) and G752R (right) mutations in the DII-LFS background. The mean±95% confidence interval is reported for groups of 3 to 8 cells. Ionic currents (top) and fluorescence (bottom) from DII-LFS-A735V (A) and DII-LFS-G752R (B) channels were recorded during 50-ms-long pulses ranging from −140 to +60 mV in 20-mV steps. For clarity, only −140, −80, −20, and +40 mV traces are shown. Kinetics of voltage-sensing domain activation in DII-LFS-A735V and DII-LFS-G752R channels are tracked by the fluorescence signal. For comparison, the gray dotted line represents a normalized signal from DII-LFS recorded at +40 mV. G–V (black circles) and SSI (black squares), and the corresponding fluorescence signals (green circles and squares, respectively) for DII-LFS-A735V and DII-LFS-G752R channels. For comparison, dotted lines represent DII-LFS curves. Voltage dependence of integrated gating charge movement for 10 ms for A735V and G752R channels. The dashed black line indicates the Q–V function of the ON gating current of wild-type LFS for reference. For G752R, the dashed green line shows gating charge calculated from a 20-ms interval.
by guest on March 22, 2017
http://circep.ahajournals.org/D
ownloaded from

Varga et al Cardiac Na+ Channel Conformations 1237
that a DII-VSD activation shift modestly affects the activa-tion of the DI, DIII, and DIV VSDs.25 Future efforts to probe Na
V1.5 cooperativity will be needed to test whether this is
the case for A735V and G752R.A simple 2-state model of the VSD would predict that the
SSI F–V is simply a mirror image of the F–V and that they should cross at 0.5. This is the case for the DI- and DII-VSDs but not for the DIII- and DIV-VSDs, which showed a lower crossing. Because the SSI F–V uses a 200-ms pulse, whereas the F–V is measured after several milliseconds, the difference is likely due to multiple activated or resting states of the VSD. This is not surprising, as multiple DIII-VSD resting states have been posited to model lidocaine interaction and we also infer multiple states from the pulse duration protocol. For
the DIV-VSD, this crossing was in the range of experimental variability, but it may be linked to DIV-VSD interaction with inactivation.
Comparison With Previous ResultsVCF has been used to study Na
V1.4, and many of the results
have been extrapolated across the superfamily of NaV chan-
nels. Although we observe many similarities, there are sev-eral distinct Na
V1.5 features. In rNa
V1.4, the VSD activation
midpoints all fell within a 20-mV range. In contrast, mid-points of the F–V curves for hNa
V1.5 spanned a range of
≈50 mV. In particular, DIII was activated at hyperpolarized potentials, and DII activation was substantially depolarized relative to the Q–V (by 30 mV). For the DII-VSD, this depo-larizing shift may be because of loose coupling between the DII-VSD and channel activation, which was not observed in Na
V1.4.
Further differences are seen when comparing the con-nection between channel inactivation and VSD activation. Classical studies of Na
V gating charge movement found that,
after prolonged depolarization, a fraction of the gating charge is immobilized: that is, it returns with much slower kinetics on repolarization than the majority of the charge.26 In human Na
V1.4, this immobilized fraction was associated with DIII
and DIV.8 Consistently, deactivation of hNaV1.5 DI-VSD and
DII-VSD was independent of the length of the depolarizing pulse. Conversely, return of the hNa
V1.5 DIII-VSD was sig-
nificantly slowed by long depolarizations, whereas the DIV-VSD deactivation rate was unaffected, in clear contrast to Na
V1.4. However, this observation is in agreement with previ-
ous reports showing that charge immobilization of the NaV1.5
DIV-VSD is independent of inactivation and that the inacti-vation particle can only modulate gating charge recovery of DIII but not DIV.27 Thus, our data reconcile these 2 previously discrepant results by showing that the hNa
V1.5 VSDs interact
with inactivation uniquely.Many have previously probed the functional contribu-
tions of each VSD to NaV1.5 gating, and our data show the
timing of these contributions. For example, outward stabi-lization of the DI-S4 strongly reduced peak Na
V1.5 current
(45%) without affecting rapid channel kinetics.28 In our data, we observed a slow DI-VSD transition at elevated poten-tials that may be linked to this peak reduction through slow inactivation (Figure 2). In contrast, DII-VSD outward stabi-lization does affect rapid gating kinetics, shifting the G–V leftward along with SSI.28 Our results show that this DII-VSD regulation of channel activation is through an allosteric connection, which facilitates channel opening when the DII-VSD is activated. Similar work has also probed the conse-quences of DIII and DIV-VSD outward stabilization,29 both of which alter channel availability without affecting activa-tion. Although the link between the 4 VSDs and inactivation is consistent with our results, it remains to be seen whether a slowing of DI, DIII, or DIV may also affect channel activa-tion as observed in DII.
RelevanceFor the inherited BrS mutations, A735V and G752R, we observed 2 different molecular pathologies (Figure 6). A735V
Figure 7. Comparison of valence-weighted F–V functions with Q–V functions. F–V curves from each domain and the valence-weighted sum of these functions24 (grey) are shown along with the Q–V curves (black) for wild-type large fluorescence signal (WT-LFS) (A), A735V (B), and G752R (C). For G752R, the 20-ms integral is shown (Figure 6B), and the F–V was also measured at 20 ms.
by guest on March 22, 2017
http://circep.ahajournals.org/D
ownloaded from

1238 Circ Arrhythm Electrophysiol October 2015
clearly shifts the voltage dependence, whereas at positive potentials, DII-VSD activation kinetics are nearly as rapid as WT. In contrast, DII-VSD voltage dependence is preserved with G752R, but it arrives at its steady state much more slowly. For both mutants, the consequence for the ionic cur-rent is slower activation. Thus, our results show that dramati-cally different molecular pathologies can give rise to similar ionic current phenotypes. Still, molecular-level differences are likely to have significant consequences for the interaction of the channel with antiarrhythmic therapies.
From a theoretical perspective, the noncanonical NaV1.5
activation mechanism revealed by the G752R and A735V mutations suggests a specific Markov state diagram where opening is possible from closed states where the VSDs are not yet activated. Recent work on L-type Ca2+ channels revealed that this type of allosteric model was best suited to describe its data. Given the recent attention to similarities between Ca2+ and Na+ channels, it would not be surprising if a similar model would be more suitable for describing Na
V1.5 gating.
We expect that future work probing the contribution of each VSD to channel gating will be immensely useful for inform-ing these widely used models.
Future DirectionsAs demonstrated by our ability to observe the molecular pathology of 2 BrS mutations, we expect that we will be able to better understand mechanisms whereby some of the >150 Na
V1.5 inherited mutations cause disease. In addition,
NaV1.5 is known to interact with many accessory proteins, and
it is tightly controlled by post-translational modification. By observing how these modulatory proteins and modifications affect the VSDs, we expect to unravel molecular mechanisms whereby the cell regulates hNa
V1.5 gating to modulate cardiac
myocyte excitability.
AcknowledgmentsWe thank Jennifer N.A. Silva, MD, and James Ballard for many help-ful discussions and advice.
Sources of FundingThis work was supported by Burroughs Wellcome Fund Career Award at the Scientific Interface 1010299 (J.R. Silva), National Institutes of Health (NIH) training grants T32-HL007275 (J.R. Silva) and R01-HL70393 and R01-NS060706 (J. Cui), and American Heart Association fellowship 11PRE5720009 and NIH T32-HL007873 (M.A. Zaydman) and R01-HL95010 and KTIA_NAP_13-2-2015-0009 (Z. Varga) and Z. Varga is a Bolyai Fellowship awardee.
DisclosuresNone.
References 1. Silva JN, Silva JR. Updates on the inherited cardiac ion channelopathies:
from cell to clinical. Curr Treat Options Cardiovasc Med. 2012;14:473–489. doi: 10.1007/s11936-012-0198-1.
2. Zaydman MA, Silva JR, Cui J. Ion channel associated diseases: overview of molecular mechanisms. Chem Rev. 2012;112:6319–6333. doi: 10.1021/cr300360k.
3. Sheets MF, Fozzard HA, Lipkind GM, Hanck DA. Sodium channel mo-lecular conformations and antiarrhythmic drug affinity. Trends Cardiovasc Med. 2010;20:16–21. doi: 10.1016/j.tcm.2010.03.002.
4. West JW, Patton DE, Scheuer T, Wang Y, Goldin AL, Catterall WA. A clus-ter of hydrophobic amino acid residues required for fast Na(+)-channel inactivation. Proc Natl Acad Sci U S A. 1992;89:10910–10914.
5. Motoike HK, Liu H, Glaaser IW, Yang AS, Tateyama M, Kass RS. The Na+ channel inactivation gate is a molecular complex: a novel role of the COOH-terminal domain. J Gen Physiol. 2004;123:155–165. doi: 10.1085/jgp.200308929.
6. Silva JR, Goldstein SA. Voltage-sensor movements describe slow inacti-vation of voltage-gated sodium channels II: a periodic paralysis mutation in Na(V)1.4 (L689I). J Gen Physiol. 2013;141:323–334. doi: 10.1085/jgp.201210910.
7. Silva JR, Goldstein SA. Voltage-sensor movements describe slow in-activation of voltage-gated sodium channels I: wild-type skeletal muscle Na(V)1.4. J Gen Physiol. 2013;141:309–321. doi: 10.1085/jgp.201210909.
8. Cha A, Ruben PC, George AL Jr, Fujimoto E, Bezanilla F. Voltage sensors in domains III and IV, but not I and II, are immobilized by Na+ channel fast inactivation. Neuron. 1999;22:73–87.
9. Chanda B, Bezanilla F. Tracking voltage-dependent conformational changes in skeletal muscle sodium channel during activation. J Gen Physiol. 2002;120:629–645.
10. Capes DL, Goldschen-Ohm MP, Arcisio-Miranda M, Bezanilla F, Chanda B. Domain IV voltage-sensor movement is both sufficient and rate limit-ing for fast inactivation in sodium channels. J Gen Physiol. 2013;142:101–112. doi: 10.1085/jgp.201310998.
11. Campos FV, Chanda B, Beirão PS, Bezanilla F. Beta-scorpion toxin modi-fies gating transitions in all four voltage sensors of the sodium channel. J Gen Physiol. 2007;130:257–268. doi: 10.1085/jgp.200609719.
12. Campos FV, Chanda B, Beirão PS, Bezanilla F. Alpha-scorpion toxin impairs a conformational change that leads to fast inactivation of mus-cle sodium channels. J Gen Physiol. 2008;132:251–263. doi: 10.1085/jgp.200809995.
13. Capes DL, Arcisio-Miranda M, Jarecki BW, French RJ, Chanda B. Gating transitions in the selectivity filter region of a sodium channel are coupled to the domain IV voltage sensor. Proc Natl Acad Sci U S A. 2012;109:2648–2653. doi: 10.1073/pnas.1115575109.
14. Arcisio-Miranda M, Muroi Y, Chowdhury S, Chanda B. Molecular mech-anism of allosteric modification of voltage-dependent sodium channels by local anesthetics. J Gen Physiol. 2010;136:541–554. doi: 10.1085/jgp.201010438.
15. Muroi Y, Chanda B. Local anesthetics disrupt energetic coupling be-tween the voltage-sensing segments of a sodium channel. J Gen Physiol. 2009;133:1–15. doi: 10.1085/jgp.200810103.
16. Vatta M, Dumaine R, Varghese G, Richard TA, Shimizu W, Aihara N, Nademanee K, Brugada R, Brugada J, Veerakul G, Li H, Bowles NE, Brugada P, Antzelevitch C, Towbin JA. Genetic and biophysical basis of sudden unexplained nocturnal death syndrome (SUNDS), a disease allelic to Brugada syndrome. Hum Mol Genet. 2002;11:337–345.
17. Hoogendijk MG, Potse M, Linnenbank AC, Verkerk AO, den Ruijter HM, van Amersfoorth SC, Klaver EC, Beekman L, Bezzina CR, Postema PG, Tan HL, Reimer AG, van der Wal AC, Ten Harkel AD, Dalinghaus M, Vinet A, Wilde AA, de Bakker JM, Coronel R. Mechanism of right precor-dial ST-segment elevation in structural heart disease: excitation failure by current-to-load mismatch. Heart Rhythm. 2010;7:238–248. doi: 10.1016/j.hrthm.2009.10.007.
18. Potet F, Mabo P, Le Coq G, Probst V, Schott JJ, Airaud F, Guihard G, Daubert JC, Escande D, Le Marec H. Novel brugada SCN5A mutation leading to ST segment elevation in the inferior or the right precordial leads. J Cardiovasc Electrophysiol. 2003;14:200–203.
19. Rudokas MW, Varga Z, Schubert AR, Asaro AB, Silva JR. The xenopus oocyte cut-open vaseline gap voltage-clamp technique with fluorometry. J Vis Exp. 2014;(85). doi: 10.3791/51040.
20. Stefani E, Bezanilla F. Cut-open oocyte voltage-clamp technique. Methods Enzymol. 1998;293:300–318.
21. van Bemmelen MX, Rougier JS, Gavillet B, Apothéloz F, Daidié D, Tateyama M, Rivolta I, Thomas MA, Kass RS, Staub O, Abriel H. Cardiac voltage-gated sodium channel Nav1.5 is regulated by Nedd4-2 mediated ubiquitination. Circ Res. 2004;95:284–291. doi: 10.1161/01.RES.0000136816.05109.89.
22. Satin J, Kyle JW, Chen M, Bell P, Cribbs LL, Fozzard HA, Rogart RB. A mutant of TTX-resistant cardiac sodium channels with TTX-sensitive properties. Science. 1992;256:1202–1205.
23. Chen H, Ahsan SS, Santiago-Berrios MB, Abruña HD, Webb WW. Mechanisms of quenching of Alexa fluorophores by natural amino acids. J Am Chem Soc. 2010;132:7244–7245. doi: 10.1021/ja100500k.
by guest on March 22, 2017
http://circep.ahajournals.org/D
ownloaded from

Varga et al Cardiac Na+ Channel Conformations 1239
24. Pantazis A, Savalli N, Sigg D, Neely A, Olcese R. Functional hetero-geneity of the four voltage sensors of a human L-type calcium chan-nel. Proc Natl Acad Sci U S A. 2014;111:18381–18386. doi: 10.1073/pnas.1411127112.
25. Chanda B, Asamoah OK, Bezanilla F. Coupling interactions between voltage sensors of the sodium channel as revealed by site-specific measurements. J Gen Physiol. 2004;123:217–230. doi: 10.1085/jgp.200308971.
26. Armstrong CM, Bezanilla F. Inactivation of the sodium channel. II. Gating current experiments. J Gen Physiol. 1977;70:567–590.
27. Sheets MF, Hanck DA. Charge immobilization of the voltage sensor in domain IV is independent of sodium current inactivation. J Physiol. 2005;563(Pt 1):83–93. doi: 10.1113/jphysiol.2004.077644.
28. Sheets MF, Chen T, Hanck DA. Outward stabilization of the voltage sen-sor in domain II but not domain I speeds inactivation of voltage-gated sodium channels. Am J Physiol Heart Circ Physiol. 2013;305:H1213–H1221. doi: 10.1152/ajpheart.00225.2013.
29. Sheets MF, Hanck DA. Outward stabilization of the S4 segments in do-mains III and IV enhances lidocaine block of sodium channels. J Physiol. 2007;582(Pt 1):317–334. doi: 10.1113/jphysiol.2007.134262.
by guest on March 22, 2017
http://circep.ahajournals.org/D
ownloaded from

Hsu, Mark A. Zaydman, Jianmin Cui and Jonathan R. SilvaZoltan Varga, Wandi Zhu, Angela R. Schubert, Jennifer L. Pardieck, Arie Krumholz, Eric J.
Pathologies of Inherited Mutations Channel Conformations Reveals Molecular+Direct Measurement of Cardiac Na
Print ISSN: 1941-3149. Online ISSN: 1941-3084 Copyright © 2015 American Heart Association, Inc. All rights reserved.
Avenue, Dallas, TX 75231is published by the American Heart Association, 7272 GreenvilleCirculation: Arrhythmia and Electrophysiology
doi: 10.1161/CIRCEP.115.0031552015;8:1228-1239; originally published online August 17, 2015;Circ Arrhythm Electrophysiol.
http://circep.ahajournals.org/content/8/5/1228World Wide Web at:
The online version of this article, along with updated information and services, is located on the
http://circep.ahajournals.org/content/suppl/2015/08/17/CIRCEP.115.003155.DC1Data Supplement (unedited) at:
http://circep.ahajournals.org//subscriptions/
is online at: Circulation: Arrhythmia and Electrophysiology Information about subscribing to Subscriptions:
http://www.lww.com/reprints Information about reprints can be found online at: Reprints:
document. Answer
Permissions and Rights Question andunder Services. Further information about this process is available in thepermission is being requested is located, click Request Permissions in the middle column of the Web pageClearance Center, not the Editorial Office. Once the online version of the published article for which
can be obtained via RightsLink, a service of the CopyrightCirculation: Arrhythmia and Electrophysiologyin Requests for permissions to reproduce figures, tables, or portions of articles originally publishedPermissions:
by guest on March 22, 2017
http://circep.ahajournals.org/D
ownloaded from

SUPPLEMENTAL MATERIAL
Supplemental Methods
Molecular Biology All mutagenesis was performed using the overlap extension polymerase chain reaction (PCR) with Phusion Hot Start Flex Kit (New England Biolabs) and primers from Sigma‐Aldrich. PCR products were ligated into the parent plasmid using T4 DNA ligase (New England Biolabs) and were chemically transformed into Turbo Competent cells (New England Biolabs). Multiple clones were selected and plasmids were isolated using the NucleoSpin Plasmid miniprep kit (Macherey‐Nagel). Samples were then sequenced to select a single clone for Midiprep (NucleoBond Xtra Midi, Macherey‐Nagel). Each construct was then linearized and purified with the NucleoSpin Gel and PCR Clean‐up kit (Macherey‐Nagel). Finally, capped mRNA was synthesized (mMessage mMachine T7 Transcription Kit, Life Technologies).
Xenopus Laevis Oocyte harvest was performed on Xenopus Laevis (Nasco) no more than four times (~25 frogs). During the oocyte harvest procedure, distress was minimized by anesthetizing frogs in water containing 0.2% tricaine (3‐aminobenzoic acid ethyl ester, methane sulfonate salt). After oocyte harvest, the wound was sutured while the frog is still anesthetized, according to our protocols that were approved by the Institutional Animal Care and Use Committee and in accordance with NIH guidelines.
Cut‐open oocyte recording cRNAs for the human β1 subunit (UniProtKB/Swiss‐Prot accession no. Q07699.1) and α‐subunit NaV1.5 (accession no. Q14524.1) were produced from the pBSTA and pMAX vectors (respectively) and injected at a 2:1 molar ratio (50 ng per cell total) into Xenopus laevis oocytes. Oocytes were incubated at 18°C for 2–7 d in solution with (mM) 93 NaCl, 5 KCl, 1.8 CaCl2, 1 MgCl2, 5 HEPES, and 2.5 Na‐pyruvate, and 1% penicillin‐streptomycin, pH 7.4. Cut‐open oocyte recordings1, 2 were performed using an amplifier (CA‐1B; Dagan Corporation) coupled to an A/D converter (Digidata 1440; Molecular Devices) with Clampex and Clampfit software (v10; Molecular Devices) for acquisition and analysis. Temperature was maintained at 19°C with a controller (HCC‐100A; Dagan Corporation). The internal solution was (mM): 105 NMG‐Mes, 10 Na‐Mes, 20 HEPES, and 2 EGTA, pH 7.4. The external solution was composed of (mM): 25 NMG‐Mes, 90 Na‐Mes, 20 HEPES, and 2 Ca‐Mes2, pH 7.4. For gating currents, Na‐Mes was replaced by NMG‐Mes in both the external and internal solutions and the external solution contained 10 μM TTX.
Data was collected with standard I‐V protocols by simultaneous recording of the ionic current and the fluorescence signal from the labeled domain to construct the voltage dependence of steady‐state activation (G‐V) and voltage dependence of VS movement (F‐V) functions. Cells were depolarized in 10 or 20 mV increments from a holding potential of ‐100 mV. Depolarizing pulses were preceded by a 100‐ms‐long prepulse and 50‐ms‐long postpulse to ‐120 mV. Capacitance compensation and P/‐8 leak subtraction were applied prior to recording ionic currents. To obtain the voltage‐dependence of steady‐state inactivation (SSI) and the corresponding VS movement (SSI F‐V) curves cells were held at the conditioning potential for 200 ms and the available channel fraction was assessed by a depolarizing pulse to ‐20 mV. For gating currents P/4 subtraction was used with an interpulse holding potential of +40 mV.
VCF measurements Oocytes were labeled with 10 µM methanethiosulfonate‐carboxytetramethylrhodamine (MTS‐TAMRA; Santa Cruz Biotechnology) in a depolarizing solution (mM: 110 KCl, 1.5 MgCl2, 0.8 CaCl2, 0.2 EDTA and 10 HEPES, pH 7.1) on ice for 20 min. MTS‐TAMRA stock solution was 10 mM in DMSO and stored at −20°C. Illumination was provided by a green, high‐powered LED (Luminus, PT‐121) controlled through a driver

(Lumina Power, LDPC‐30‐6‐24VDC) by the acquisition software to minimize photobleaching of the probe. The light was then focused into a liquid light guide with a 45°, 5mm compound parabolic concentrator (Edmund Optics) and the guide was coupled to the microscope via a collimating adapter (EXFO). A 40× water‐immersion objective with a numerical aperture of 0.8 (CFI Plan Fluor, Nikon) was used. Light measurements were made with a photodiode (PIN‐040A; United Detector Technology) mounted on an XY axis manipulator (Thorlabs Inc.) at the microscope epifluorescence port. The photodiode was attached to the integrating headstage of a patch‐clamp amplifier (Axopatch‐200A; Molecular Devices) for low noise amplification of the photocurrent. The fluorescence emission was focused onto the photodiode active area using an achromatic doublet (Thorlabs Inc.) with a focal distance of 25 mm.
Data analysis For the analysis of fluorescence data, baseline fluorescence traces were recorded with no change of voltage during the illumination period. To correct for photobleaching, this baseline trace was filtered and subtracted from the fluorescence traces recorded during the application of the voltage protocol.
The magnitude of fluorescence signals is expressed as F / F0, where F is the change in the signal amplitude in response to the voltage change and F0 is the baseline fluorescence.
Steady‐state G‐V, SSI, F‐V and SSI F‐V curves were obtained by fitting the data points with a Boltzmann‐ function: y = 1 / (1+ exp[‐(V‐V1/2)/k)], where V1/2 is the half‐activation voltage and k is the slope factor. For direct comparison of current and VSD kinetics we used t10‐90% due to the different functions they follow. t10‐90% for current activation kinetics was determined by the time duration between the time points when the current reached 10 and 90 % of the peak value. For fluorescence signals with low signal to noise ratio t10‐90% determination was inaccurate, therefore for all fluorescence signals we calculated
t10‐90%C from the time constants of single exponential fits () to the signal by t10‐90%C = 2.197.
Valence‐weighted F‐V curves were calculated as F(V)w= (F(V)1z1 + F(V)2z2 + F(V)3z3 + F(V)4z4) / (z1 + z2 + z3 + z4), where F(V)I represents the F(V) function of the ith domain and zi the valence of F(V)I
determined from the Boltzmann‐fit y = 1 / (1+ exp[‐z(V‐V1/2)/kT), where V1/2 is the half‐activation voltage and k is the Boltzmann‐constant and T is temperature3.
Statistical significance was attributed to p<.05 as determined by a two‐tailed Student’s t‐test. For the comparison of multiple groups one‐way ANOVA was applied and in the case of a significant difference it was followed by post‐hoc Holm‐Sidak pairwise comparisons among all groups or versus control. Errors in text and error bars in figures represent 95% confidence interval with number of trials [n] in brackets.
References
1. Rudokas MW, Varga Z, Schubert AR, Asaro AB, Silva JR. The xenopus oocyte cut‐open vaseline gap voltage‐clamp technique with fluorometry. J Vis Exp. 2014
2. Stefani E, Bezanilla F. Cut‐open oocyte voltage‐clamp technique. Methods Enzymol. 1998;293:300‐318.
3. Pantazis A, Savalli N, Sigg D, Neely A, Olcese R. Functional heterogeneity of the four voltage sensors of a human l‐type calcium channel. Proc Natl Acad Sci U S A. 2014;111:18381‐18386.

Figure S1. G‐V and SSI functions of the unlabeled fluorescence constructs
G‐V and SSI functions were obtained using the protocols described in the text from unlabeled LFS constructs (circles). Points represent mean ± 95CI from groups of 3 to 6 cells. The dotted line shows the WT‐LFS data, while the dashed lines are curves from TAMRA‐MTS labeled constructs. For DIV‐LFS the SSI curve did not saturate at negative potentials (filled circles), but after DTT treatment (empty circles) approached the labeled channel.

Figure S2. Comparison of integrated gating charge movement for WT‐LFS and fluorescence constructs.
Voltage‐dependence of integrated gating charge movement for WT‐LFS, DI‐LFS, DII‐LFS, DIII‐LFS and DIV‐LFS channels. Gating currents were recorded during 20‐ms depolarizing steps ranging from ‐150 to +50 mV in 20‐mV steps. Capacitance and leak were removed using P/4 leak subtraction with a sub‐sweep holding level of +40 mV. Gating currents were integrated for 10 ms following the voltage change. See Table 1 in manuscript for parameters. Each point represents the mean ± 95CI from 4 to 7 cells.

Figure S3. Comparison of ionic current and fluorescence kinetics in the four domains.
Na+ currents and fluorescence signals were recorded from DI‐LFS, DII‐LFS, DIII‐LFS and DIV‐LFS channels to compare the kinetics of activation. Traces were recorded during a voltage step to +30 mV from ‐120 mV. The first 10 ms duration is shown.
Nor
mal
ized
Curr
ent /
Fluo
resc
ence
Nor
mal
ized
Curr
ent /
Fluo
resc
ence
DI-LFS DII-LFS
DIII-LFS DIV-LFS
2 ms

Figure S4. Comparison of ionic current activation kinetics of DII‐LFS and the BrS mutants.
Activation kinetics were measured as t10‐90% rise time following a step to the indicated potentials from a prepulse of ‐120 mV for DII‐LFS, DII‐LFS‐A735V and DII‐LFS‐G752R. Each point represents the mean ± 95CI from groups of 3 to 7 cells.

Figure S5: Steady‐state inactivation, activation, and rise times for BrS mutants compared to wild‐type expressed in HEK293T cells.
(A) Activation kinetics were measured as t10‐90% rise time following a step to the indicated potentials from a prepulse of ‐120 mV for WT [n=4], A735V [n=3], and G752R [n=4].
(B) Voltage‐dependence of steady‐state activation and steady‐state inactivation curves for the WT, A735V, and G752R (purple, green, and red respectively). G‐V curves were constructed from I‐V relationships recorded from cells depolarized in 10 or 20 mV increments from a prepulse potential of ‐120 mV. Na+ reversal potential was determined for each cell individually. For the SSI curves, cells were held at the conditioning potential ranging from ‐120 to +20 mV for 50 ms and the available channel fraction was assessed by a depolarizing pulse to ‐20 mV. Each point represents the mean ± 95CI from 4 to 11 cells.