orient overseas (international) limited - ooil - … anama l alian l aoya l london l buan l le are l...
TRANSCRIPT
2013Interim Report
(Incorporated in Bermuda with Limited Liability)
Orient Overseas (International) Limited
OOCL San Francisco
OOCL ChicagoOOCL Zhoushan OOCL Australia
OOCL Beijing
OOCL CanadaOOCL New YorkOOCL Canada
OOCL Shanghai
OOCL Shenzhen
OOCL Long BeachOOCL Hamburg
OOCL QingdaoOOCL Ningbo
OOCL AtlantaOOCL Southampton
OOCL Kobe
OOCL Houston
OOCL YokohamaOOCL New ZealandOOCL California
OOCL Tianjin
OOCL Jakarta OOCL Texas
OOCL Netherland
OOCL Rotterdam OOCL America
OOCL SavannahOOCL Guangzhou
OOCL LuxembourgOOCL SavannahOOCL Washington
OOCL Hong Kong
OOCL Charleston
OOCL China
OOCL Montreal OOCL Norfolk
OOCL Belgium
OOCL Brisbane
OOCL Tokyo
OOCL Panama
OOCL Dalian
OOCL Nagoya
OOCL London
OOCL Busan
OOCL Le Havre OOCL Seoul
OOCL EuropeOOCL Asia OOCL Canada
OOCL Beijing

Orient Overseas (International) Limited Interim Report 2013 1
Contents
2 Statement to Shareholders from the Chairman
5 Management Discussion and Analysis
10 Other information
15 Index – Interim Financial information
16 Report on Review of Interim Financial Information
Interim Financial Information
17 – Condensed Consolidated Profit and Loss Account
18 – Condensed Consolidated Statement of Comprehensive Income
19 – Condensed Consolidated Balance Sheet
21 – Condensed Consolidated Cash Flow Statement
22 – Condensed Consolidated Statement of Changes in Equity
23 – Notes to the Interim Financial Information

Orient Overseas (International) Limited Interim Report 20132
Statement to Shareholders from the Chairman
The global economic environment painted a diverging picture in the first half of 2013. Encouraging statistics coming out of the US, a relatively quiet few months in Europe, a smooth leadership transition in China, and proactive measures from Japan seem to have given the markets a degree of hope. Notwithstanding the US Federal Reserve’s seemingly cautious optimism in the US economy, the markets, however, seem to have differing views on whether recovery is firmly in place. Indeed, the fact remains that there continues to be great uncertainty in the global economy. The US recovery remains at early stages with unemployment still hovering at 7.6%, and new mortgage application seem to lag behind actual housing starts. Europe, while showing some growth in industrial production and retail sales in recent months, is still dealing with many structural issues, and expected to have another year of contraction for the year 2013. Japan’s industrial production rose for five consecutive months, but the sustainability and success of “Abenomics” remains unclear. Finally, while the Chinese Government’s emphasis on structural reforms is undoubtedly positive for both China and the global economy in the long term, the shift of focus will mean a more modest economic growth in 2013.
In the midst of these uncertainties, the container transportation industry continues to tackle the challenges of weak cargo growth, capacity oversupply and high bunker costs. Market growth across major trades grew only by approximately 2.2% during the first half of 2013. While the markets expect a more robust second half on the demand side, the industry is still expecting a full year newbuilding supply increase of 10% in TEU terms or 270 new ships in 2013. These factors culminated in a disappointing first half for the Group.
INTERIM RESULTOrient Overseas (International) Limited and its subsidiaries (the “Group”) recorded a loss after tax and non-controlling interests attributable to equity holders of US$15.3 million for the six month period ended 30th June 2013. The 2013 interim result represents a US$131.8 million decrease in earnings compared to the profit for the same period in 2012 of US$116.5 million.
The loss after tax and non-controlling interests attributable to equity holders for the first six months of 2013 includes a capital expenditure and revaluation gain netoff for Wall Street Plaza, whose market value was independently assessed at US$170 million as at 30th June 2013, and US$9.1 million dividend income in relation to our investment in Hui Xian, its primary underlying asset being Beijing Oriental Plaza.
Loss per ordinary share for the first half of 2013 was US2.4 cents, whereas earnings per ordinary share for the first half of 2012 were US18.6 cents.
DIVIDENDThe Board of Directors has resolved not to pay an interim dividend for 2013. This decision for the interim reflects the lack of profitability for the first half of the year and is consistent with the Group’s efforts in preserving capital and minimising cash out flows during unprofitable periods.
CONTAINER TRANSPORT AND LOGISTICSThe international container transport and logistics business of the Group, trading under the “OOCL” name, reported a net loss after tax of US$22.6 million for the first six months of the year, a US$65.5 million decrease from the profit of US$42.9 million reported for the first half of 2012.
Total liftings for the first half of 2013 were down 1.5% compared to the corresponding period last year. Average freight revenue per TEU for the period was US$1,088, a decrease of 2.2% over the 2012 first-half average of US$1,112 per TEU.
The operating environment in the first half of 2013 was characterised by the deterioration of freight rates from the last quarter of 2012, especially on the Asia-Europe trade, and the extremely competitive freight rates recorded in both the Trans-Pacific and the Intra-Asia trades. A series of rate increases during the second quarter in the market on the East West trades generally could not be sustained.

Orient Overseas (International) Limited Interim Report 2013 3
Statement to Shareholders from the Chairman
The slow growth in volume and the competitive freight rate environment resulted in reduced contribution for the Group. The Trans-Pacific and Intra-Asia trades, the two largest trade for the Group by volume, recorded dissappointing results.
In the first half of 2013, OOCL took delivery of seven newbuilding vessels, among which five were of 13,200 TEU size. Two of these large vessels are chartered to our alliance partner for a period of three years. We expect to take delivery of another three 13,200 TEU vessels in the second half of the year, two of which are also on charter to our alliance partner.
OTHER ACTIVITIESThe Group’s investments include its long-standing ownership of Wall Street Plaza located in New York. The physical damage sustained during Hurricane Sandy has been identified and is being addressed. The property continues to have an occupancy rate of over 93%, and will perform in-line with budget for the full year. The New York real estate market continues to improve and Wall Street Plaza has been revalued upwards by US$5 million to US$170 million as at 30th June 2013. This revaluation gain was net off with capital expenditure primarily related to Hurricane Sandy, and has been included in the net loss reported above.
The Group continues its investment in Beijing Oriental Plaza both through direct holdings of the Hui Xian REIT and indirectly through Hui Xian Holdings Ltd. which holds units in the Hui Xian REIT. Both Hui Xian REIT and Hui Xian Holdings Ltd. paid a dividend during the first half of 2013. The two dividends, totalling US$9.1 million to the Group, are included in the net loss reported above.
CORPORATE SOCIAL RESPONSIBILITYThe Group continues to see environmental care and community support as part of our responsibility. We are committed to strengthening our sustainability profile and meeting the evolving needs of our stakeholders for greener global supply chains with the least environmental impact on our communities.
We strive to play our part in tackling global issues concerning global warming, air pollution, and marine environment degradation through internal initiatives as well as participation and engagement with organisations such as the Business Environment Council, the Clean Cargo Working Group and the World Wildlife Fund. In addition, as one of the leading carriers that initiated the Fair Winds Charter in Hong Kong, we are working with other carriers and the Hong Kong Government to improve shipboard emission during port call. Our efforts towards reducing sulphur oxides, nitrogen oxides, carbon dioxide and other air emissions from our fleet will continue going forward.
I am pleased to report that we received the Gold Award of the 2012 Hong Kong Awards for Environmental Excellence (HKAEE) as well as the “Best Performing Ship Management Company Award” from the Hong Kong Marine Department in the first half of 2013.

Orient Overseas (International) Limited Interim Report 20134
Statement to Shareholders from the Chairman
OUTLOOKThere seems to be early indications that the global economic conditions are set to improve. We need to be mindful, however, that the slowdown of the Chinese economy, the ongoing economic restructuring in Europe, and the uncertainties around the sustainability and strength of the recoveries in the US and Japan continues to post challenges for the global economy. Against this backdrop, the industry still faces a 21% growth in capacity between today and 2015. We therefore expect margins to remain thin and volatile, and that the situation will not improve substantially until fundamental supply and demand reaches a better balance.
The industry has traditionally endured hardship and losses brought about by a relentless pursuit of market share rather than improvement in cost efficiencies and services. In an environment already characterised by an unbalanced supply and demand, carriers should take stock of the situation, and look for ways to better improve both their cost structures and service quality. At the same time, shippers need to be aware that sustained carrier losses over the long term is not conducive to a stable freight environment, nor is it in the interest of shippers to accept declining levels of carrier service in reaction to losses incurred.
The Group continues to focus on enhancing contribution by a more disciplined approach to differentiation and segmentation, and ensuring better cost efficiency by continuous efforts to drive down costs without compromising service quality. Alliances remain an important element for carriers in terms of cost efficiency optimisation and improved service coverage. These alliance platforms have become an integral part of the industry. The GA (Grand Alliance) and G6 (GA plus the New World Alliance) today provides an excellent and competitive foundation for member carriers in the Asia-Europe, Trans-Pacific and Trans-Atlantic Trades. We will continue to work with our partners to ensure that the alliance product stays competitive.
As part of our retonnage program, we ordered ten 13,200 TEU mega newbuildings in 2011 and disposed of six mid 1990s built 5,400 TEU vessels in 2011 and 2012. Out of the ten newbuildings, four are chartered to our alliance partner on a short term basis. All ten vessels, the remaining five to be delivered in the second half of 2013 and 2014, are expected to improve our cost structure given their size and design. In addition, we will take delivery of our remaining four 8,888 TEU vessels in 2014 and 2015. These vessels, originally contracted for delivery this year, were delayed as part of our joint initiative with the shipyard to improve main engine efficiency. In total, we expect enhanced competitiveness in the trades where all these vessels are deployed.
We remain focused and deliberate in our efforts to maintain a strong and liquid Group balance sheet. This is especially important during challenging times as it allows the Group the ability to retain the widest degree of initiative and flexibility as a competitive edge. Notwithstanding the turbulent times, we continue to plan for the future and invest in tonnage, port facility in North America, IT infrastructure and logistics services. We believe these efforts will help us maintain our competitive edge in the industry going forward.
The first half of 2013 was a disappointing period for OOIL. My colleagues and I remain focused in managing our business, and ensuring that the Group is well positioned when the global economy moves into a more sustainable recovery. We remain hopeful for a more profitable second half of the year.
C C TungChairman
Hong Kong, 7th August 2013

Orient Overseas (International) Limited Interim Report 2013 5
Management Discussion and Analysis
GROUP RESULTSFor the first six months of 2013 Orient Overseas (International) Limited and its subsidiaries (the “Group”) recorded a loss attributable to equity holders of US$15.3 million compared with a profit of US$116.5 million for the corresponding period of 2012.
OOIL Interim Results Analysis
RestatedUS$’000 2013 2012
(Loss)/profit before tax from operating activities (12,585) 81,637Investment income from Hui Xian 9,064 42,596Revaluation of Wall Street Plaza (4,560) 5,000
(Loss)/Profit Before Tax for the Period Ended 30th June (8,081) 129,233Taxation (7,056) (12,003)Non-controlling Interests (127) (699)
(Loss)/Profit Attributable to Equity Holders (15,264) 116,531
The loss attributable to equity holders for the first half of 2013 included investment income of US$9.1 million from Hui Xian and a revaluation loss of US$4.6 million on Wall Street Plaza.
Loss from operating activities for the first half of the year was US$12.6 million, as compared to a profit of US$81.6 million in the first six months of 2012. Results of the operating activities include the Group’s business of container transportation and logistics conducted through the “OOCL” brand, and the Group’s liquidity management and investment activities at the corporate level.
ORIENT OVERSEAS CONTAINER LINETotal liner lifting for the first half of the year decreased 1.5% and revenue decreased 3.7% when compared with same period last year. A record number of mega size newbuilding deliveries (over 10,000 TEU capacity) into the Asia-Europe trade added freight rate pressure in this trade lane as carriers took aggressive rate to fill the ships. This phenomenon, however, was not confined to the Asia-Europe trade. The ships that the mega vessels replaced were cascaded to serve other trades that generally operate with smaller containerships. This led to the upsizing and introduction of additional services in those trade lanes. Overall, while freight rate erosion was most prominent in the Asia-Europe trade, the effects of the cascade rippled to other markets.
Overall capacity increased 1.8% and load factor was 2.4% lower than the corresponding period in 2012.
The G6 Alliance cooperation in the Asia-Europe trade which started in 2012 extended to the Asia-to-North America East Coast trade in the second quarter of this year.
Trans-Pacific TradeAverage revenue per TEU increased 3.4% in the Trans-Pacific trade, but lifting decreased 4.0% so overall revenue decreased 0.8%. Spot market rates in the eastbound trade lane deteriorated throughout the second quarter, while those in the westbound improved. The eastbound rate level is expected to stabilise or improve in the second half of the year when the market enters into the traditional peak shipping season.
Asia-Europe TradeLifting and overall revenue decreased 2.7% and 6.9% respectively in the Asia-Europe trade. Average revenue per TEU decreased 4.4%. Rate deterioration accelerated in the second quarter when more mega vessels were delivered into the Asia-Europe trade against a market marked by reduction in cargo demand. By June, the freight rate dropped to a level that was last seen in early 2012, and prompted freight rate increases in the market. It is anticipated that the westbound rates in the second half of the year may also improve from the very low level.

Orient Overseas (International) Limited Interim Report 20136
Management Discussion and Analysis
Intra-Asia & Australasia TradeLifting increased 1.0% in the Intra-Asia and Australasia trade, but revenue decreased 2.5% as the average revenue per TEU level dropped by 3.4%. This situation was attributed to the cascading effect of a growing number of larger ships serving the trade. The unsustainable freight rate level has driven carriers to void some sailing windows to reduce losses and if this continues, rates in the second half of the year may stabilise.
Trans-Atlantic TradeLifting and revenue in the Trans-Atlantic trade decreased by 7.2% and 10.3% respectively when compared with the corresponding period in 2012. Average revenue per TEU was 3.3% lower. The lower demand levels in the U.S. and Europe for each other’s goods have dragged down both lifting and rates.
LogisticsOur international logistics business, consisting of ocean transportation services (“OceanPlus”) and supply chain management business, achieved revenue growth of 16% in the first half of 2013 compared to the same period in 2012.
OceanPlus Full-Container Load revenue increased by 30% as compared with the first half of 2012. The growth was mainly from the Intra-Asia trade sector, which has been the focus of our business development. Gross profit margin, however, reduced due to the competitive market environment. For OceanPlus Less-than-Container Load, we are in the process of developing our network and refining our trade lane focus.
In our domestic logistics business, however, we have been repositioning our approach by aiming for a more sustainable business model, and as a result, revenue was slightly reduced. In China, we will continue to build our service capabilities and customer portfolio along our commodity focus in the Apparel, FMCG, Retail, Chemical and Cotton segments. Chemical DG transportation is also an added service offering to customers.
We are also pursuing a similar commodity focus for other Asian countries. ASEAN north and south regions have been set up and India is organised into two sub-regions for better management focus and cross-regional business development.
In support of customers’ requirements, our service network will be extended to selected countries in Central America, South America and Europe.
We expect steady growth in the second half of the year, supported by both international and domestic logistics businesses. We will continue to gear up the organisation for business growth and productivity improvement.
Bunker PriceThe average price of bunker in the first half of 2013 was US$626 per ton compared with US$689 per ton for the corresponding period in 2012. The softened bunker price in the first half year resulted in a 4.4% saving in fuel costs.
VESSELSDuring the first half of 2013, the Group took delivery of two 8,888 TEU ‘SX’ Class new buildings, namely the ‘OOCL Miami’ and ‘OOCL Memphis’, from Hudong Zhonghua Shipbuilding in China. They are the third and fourth vessels in the series of 8,888 TEU new buildings ordered from the Hudong shipyard in Shanghai. The remaining four vessels are expected to be delivered by mid-2015.
In addition, the Group took delivery of five 13,200 TEU ‘Mega’ Class vessels from Samsung Heavy Industries in South Korea, namely the ‘OOCL Brussels’, ‘OOCL Berlin’, ‘OOCL Chongqing’, ‘NYK Helios’ and ‘NYK Hercules’. They are currently the largest containerships being delivered to the Group. A total of 10 units of the 13,200 TEU vessels were ordered from the Samsung shipyard and the remaining five vessels are expected to be delivered by mid-2014.
Two of the 13,200 TEU vessels delivered in January and May, the ‘NYK Helios’ and ‘NYK Hercules’, were the first two among a total of four ‘Mega’ class vessels being time chartered out to our alliance partner and they have both joined the G6 Alliance’s Asia-Europe service. The remaining two units chartered to our alliance partner are expected to be delivered in the second half of 2013.
No orders for new buildings were being placed in the first half of 2013.

Orient Overseas (International) Limited Interim Report 2013 7
Management Discussion and Analysis
NEWBUILDING DELIVERY SCHEDULE
Delivery Shipyard Hull No. TEU Date of Order
Jul 2013 Samsung Heavy Industries HN2007 13,200 2011Sep 2013 Samsung Heavy Industries HN2008 13,200 2011Oct 2013 Samsung Heavy Industries HN2009 13,200 2011Mar 2014 Samsung Heavy Industries HN2010 13,200 2011Apr 2014 Samsung Heavy Industries HN2011 13,200 2011Oct 2014 Hudong-Zhonghua Shipbuilding H1565A 8,888 2007Dec 2014 Hudong-Zhonghua Shipbuilding H1585A 8,888 2007Feb 2015 Hudong-Zhonghua Shipbuilding H1667A 8,888 2010Apr 2015 Hudong-Zhonghua Shipbuilding H1668A 8,888 2010
OTHER ACTIVITIESThe other activities of the Group consist of support functions, including a centralised function to manage the Group’s liquidity and investments. The Group’s investments include Wall Street Plaza, an office building in New York, and a minority investment in Hui Xian REIT through both direct holdings and a 7.9% holding of Hui Xian Holdings Ltd., a majority unit holder of Hui Xian REIT. The primary asset of Hui Xian REIT is Beijing Oriental Plaza, a mixed used development in Beijing.
Wall Street Plaza continues to perform in line with expectations. After Hurricane Sandy in the last quarter of 2012, rectification costs were incurred in 2012 and first half of 2013. Based on an independent valuation, it has been re-valued upwards by US$5 million as at 30th June 2013 to reflect an assessed market value of US$170 million. After offsetting a total of US$9.6 million improvement to the building spent in the first six months of the year, the net fair value loss for the first half of 2013 was therefore US$4.6 million.
In the first half of 2013, Hui Xian Holdings Ltd. declared a non-recurring cash dividend to its shareholders, of which the Group’s share amounted to US$7.9 million. In addition, the Group also received a distribution of US$1.2 million from its direct holding of Hui Xian REIT units. As at 30th June 2013, the Group’s investment in Hui Xian was re-valued at US$145.9 million.
The investments in Wall Street Plaza and Hui Xian are both historical in nature and the Group currently has no intention of further investment in property other than that in relation to the operations of the container transportation and logistics business.

Orient Overseas (International) Limited Interim Report 20138
Management Discussion and Analysis
LIQUIDITY AND FINANCIAL RESOURCESAs at 30th June 2013, the Group had total liquid assets of US$2,374.2 million and a total indebtedness of US$3,385.5 million. Net debt as at 30th June 2013 was therefore US$1,011.3 million versus US$542.0 million as at the 2012 year-end. The increase in net debt in the first half of 2013 was mainly a result of payments made for the newbuilding orders.
The Group continues to have sufficient borrowing capacity and remains comfortably within its target of keeping a net debt to equity ratio below 1:1.
The indebtedness of the Group mainly comprises bank loans, finance leases and other obligations which are largely denominated in US dollars. The Group’s borrowings are monitored to ensure a smooth repayment schedule to maturity. The profile of the Group’s long-term liabilities is set out in Note 18 to the Interim Financial Information.
The liquid assets of the Group are predominantly cash deposits with a range of banks and with tenors from overnight to up to six months. We review the list of approved banks and exposure limits on each bank on a regular basis.
Given the inherently volatile nature of shipping industry earnings and the fluctuations in asset values, the Group maintains a portion of its liquidity reserves in a portfolio of longer tenor investments. The Group’s investment portfolio of US$474.1 million as at 30th June 2013 is predominantly comprised of a mix of investment grade bonds and Hong Kong listed equities.
CURRENCY EXPOSURE AND RELATED HEDGESThe Group’s principal income is mainly comprised of freight revenues, receipts from terminal operations and rental income from investment properties, which are mainly denominated in US dollars. Over 61% of cost items are also US-dollar based. Certain costs, such as terminal charges, transportation charges and administrative expenses for regional offices, are in local currencies. The Group’s policy is to hedge the payment of certain major currencies such as the Euro, Canadian Dollars and Japanese Yen as appropriate.
Over 99% of the Group’s total borrowings are denominated in US dollars. Consequently, the risk of currency fluctuations affecting the Group’s debt profile is effectively mitigated.
EMPLOYEE INFORMATIONAs at 30th June 2013, the Group had 9,012 full-time equivalent employees. Salary and benefit levels are maintained at competitive levels and employees are rewarded on a performance-related basis within the general policy and framework of the Group’s salary and discretionary bonus schemes. These schemes, based on the performance of the Company and individual employees, are regularly reviewed. Other benefits are also provided including medical insurance and retirement funds. In support of the continuous development of individual employees, training and development programmes for different levels of employee are arranged. Social and recreational activities are arranged for our employees around the world.

Orient Overseas (International) Limited Interim Report 2013 9
Management Discussion and Analysis
SAFETY, SECURITY AND ENVIRONMENTAL PROTECTIONSafety and security are a top priority in our business operations onshore and at sea, for our people, cargo, ships and facilities. Our Group maintains the highest safety and security standards.
The Group’s Corporate Security Policy, standards and procedures guide our company in the prevention and suppression of security threats against international supply chain operations. We are committed not only to complying with rules and regulations such as the ISPS Code, but also to exceeding them by embracing industry best practices and voluntary initiatives. We participate in various national security programs, including the Customs-Trade Partnership Against Terrorism (C-TPAT) and the Authorised Economic Operator (AEO) initiatives.
We also actively collaborate with various governments and authorities worldwide in our efforts against acts that might impinge upon maritime or cargo security. In addition, our Global Data Centre maintains ISO 27001 certification in order to provide our customers and partners with quality and secure information in accordance with international standards on information security management.
To combat the increasing threat of maritime piracy, OOCL applies anti-piracy measures by adopting best practice guidelines and establishing close communications with our staff onboard.
The OOIL Group also recognises that businesses must take responsibility for their industry’s effects on the environment. OOIL proactively promotes and adopts green practices at every level of our organisation.
For instance, OOCL’s online Carbon Calculator is designed for our customers to measure carbon dioxide emissions in their supply chains, and it has been verified by a third party auditor for data accuracy and transparency. It is the first emissions calculator of its kind to offer multiple shipment searches and full intermodal emissions data. This calculator demonstrates OOCL’s commitment to environmental care and our drive to help our customers understand the carbon footprint in their end-to-end supply chains.
Similar to our success last year, we once again received certification from DNV on the accuracy of our environmental data disclosure to the Clean Cargo Working Group, an ongoing voluntary initiative to measure, evaluate and report environmental performance in marine container transport. We are committed to maintaining our standard of data accuracy and transparency in this regard.
To demonstrate our long-term commitment to corporate sustainability, transparency and accountability, we publish our Group Sustainability Report on an annual basis. This report covers the significant environmental, economic and social aspects of the business arising from the principal activities of OOIL and its subsidiaries.
In addition to the four Hong Kong Voluntary Observing Ship Gold Awards and two special certificates received from the Hong Kong Observatory, OOCL also won the Gold Award of the 2012 Hong Kong Awards for Environmental Excellence (HKAEE) as well as the “Best Performing Ship Management Company Award” from the Hong Kong Marine Department in the first half of 2013. We are very pleased to have been recognised for our consistent and sustained efforts in environmental protection initiatives and safety management.
We continue to achieve one of the best records for the Green Flag Program organised by the Port of Long Beach and Port of Los Angeles in the United States, achieving full voluntary compliance in vessel speed reduction for our vessels. In addition, OOCL is also one of the leading carriers that initiated the Fair Winds Charter in Hong Kong. Under this voluntary Charter, our vessels switch to cleaner fuel when berthed at the Hong Kong port.
Through membership with organisations such as the Clean Cargo Working Group, the Business Environment Council and the World Wildlife Fund, the OOIL Group has demonstrated its commitment to tackling the issue of climate change and environmental protection in Hong Kong and the regions in which we operate.
Orient Overseas (International) Limited Interim Report 201310
Other Information
INTERIM DIVIDENDThe Board of Directors (the “Board”) of the Company has resolved not to declare the payment of an interim dividend for the six months ended 30th June 2013.
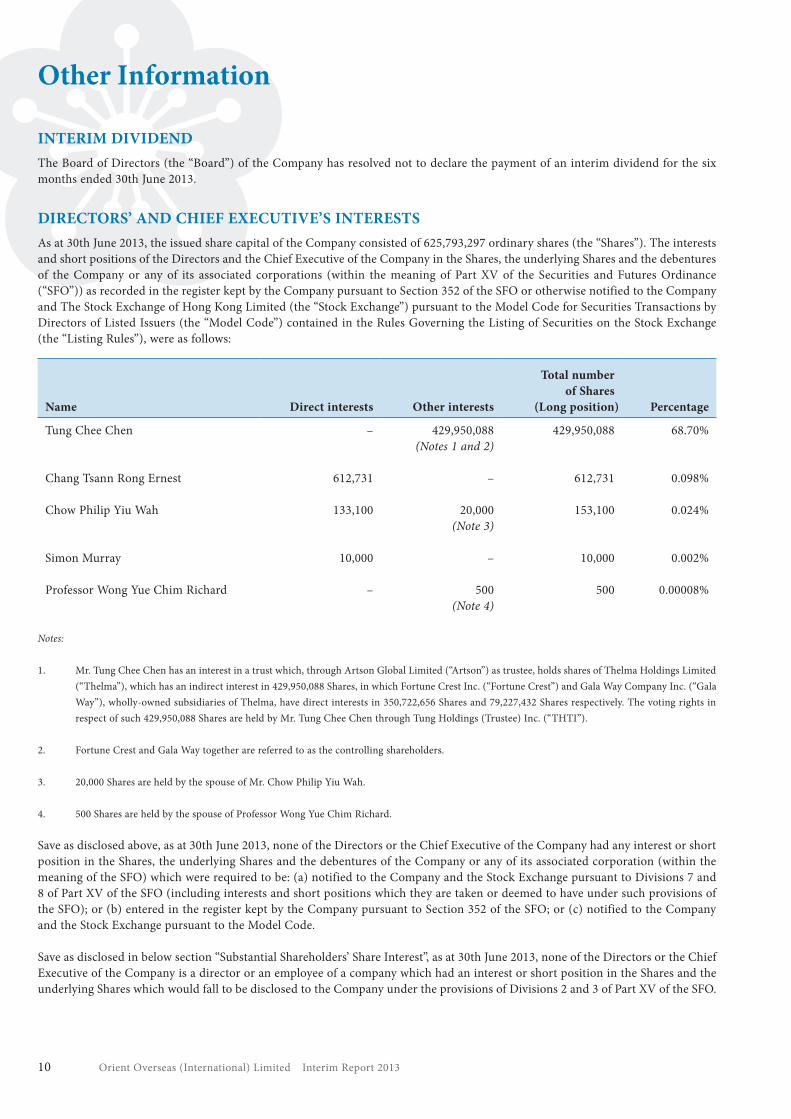
DIRECTORS’ AND CHIEF EXECUTIVE’S INTERESTSAs at 30th June 2013, the issued share capital of the Company consisted of 625,793,297 ordinary shares (the “Shares”). The interests and short positions of the Directors and the Chief Executive of the Company in the Shares, the underlying Shares and the debentures of the Company or any of its associated corporations (within the meaning of Part XV of the Securities and Futures Ordinance (“SFO”)) as recorded in the register kept by the Company pursuant to Section 352 of the SFO or otherwise notified to the Company and The Stock Exchange of Hong Kong Limited (the “Stock Exchange”) pursuant to the Model Code for Securities Transactions by Directors of Listed Issuers (the “Model Code”) contained in the Rules Governing the Listing of Securities on the Stock Exchange (the “Listing Rules”), were as follows:
Name Direct interests Other interests
Total number of Shares
(Long position) Percentage
Tung Chee Chen – 429,950,088(Notes 1 and 2)
429,950,088 68.70%
Chang Tsann Rong Ernest 612,731 – 612,731 0.098%
Chow Philip Yiu Wah 133,100 20,000(Note 3)
153,100 0.024%
Simon Murray 10,000 – 10,000 0.002%
Professor Wong Yue Chim Richard – 500(Note 4)
500 0.00008%
Notes:
1. Mr. Tung Chee Chen has an interest in a trust which, through Artson Global Limited (“Artson”) as trustee, holds shares of Thelma Holdings Limited (“Thelma”), which has an indirect interest in 429,950,088 Shares, in which Fortune Crest Inc. (“Fortune Crest”) and Gala Way Company Inc. (“Gala Way”), wholly-owned subsidiaries of Thelma, have direct interests in 350,722,656 Shares and 79,227,432 Shares respectively. The voting rights in respect of such 429,950,088 Shares are held by Mr. Tung Chee Chen through Tung Holdings (Trustee) Inc. (“THTI”).
2. Fortune Crest and Gala Way together are referred to as the controlling shareholders.
3. 20,000 Shares are held by the spouse of Mr. Chow Philip Yiu Wah.
4. 500 Shares are held by the spouse of Professor Wong Yue Chim Richard.
Save as disclosed above, as at 30th June 2013, none of the Directors or the Chief Executive of the Company had any interest or short position in the Shares, the underlying Shares and the debentures of the Company or any of its associated corporation (within the meaning of the SFO) which were required to be: (a) notified to the Company and the Stock Exchange pursuant to Divisions 7 and 8 of Part XV of the SFO (including interests and short positions which they are taken or deemed to have under such provisions of the SFO); or (b) entered in the register kept by the Company pursuant to Section 352 of the SFO; or (c) notified to the Company and the Stock Exchange pursuant to the Model Code.
Save as disclosed in below section “Substantial Shareholders’ Share Interest”, as at 30th June 2013, none of the Directors or the Chief Executive of the Company is a director or an employee of a company which had an interest or short position in the Shares and the underlying Shares which would fall to be disclosed to the Company under the provisions of Divisions 2 and 3 of Part XV of the SFO.

Orient Overseas (International) Limited Interim Report 2013 11
Other Information
SUBSTANTIAL SHAREHOLDERS’ SHARE INTERESTAs at 30th June 2013, the following persons (other than the Directors or the Chief Executive of the Company) had an interest or short position in the Shares and the underlying Shares which would fall to be disclosed to the Company under the provisions of Divisions 2 and 3 of Part XV of the SFO as recorded in the register required to be kept by the Company under Section 336 of the SFO:
Name Nature of interest
Number of Shares interested
(Long position) Percentage
Artson Global Limited* Trustee 429,950,088(Note 1)
68.70%
Hanberry Global Limited Trustee 429,950,088(Note 2)
68.70%
Thelma Holdings Limited* Indirect 429,950,088(Note 3)
68.70%
Tung Chee Hwa Indirect 429,975,319(Note 4)
68.70%
Archmore Investment Limited* Beneficiary of a trust 429,950,088(Note 5)
68.70%
Edgemont Holdings Limited* Indirect 429,950,088(Note 6)
68.70%
Javier Global Limited* Indirect 429,950,088(Note 7)
68.70%
Bartlock Assets Ltd. Beneficiary of a trust 429,950,088(Note 8)
68.70%
Flowell Development Inc. Beneficiary of a trust 429,950,088(Note 9)
68.70%
Izone Capital Limited* Beneficiary of a trust 429,950,088(Note 10)
68.70%
Jeference Capital Inc.* Beneficiary of a trust 429,950,088(Note 11)
68.70%
Tung Holdings (Trustee) Inc.* Voting 429,950,088(Note 12)
68.70%
Fortune Crest Inc.* Direct 350,722,656(Note 13)
56.04%
Gala Way Company Inc.* Direct 79,227,432(Note 14)
12.66%

Orient Overseas (International) Limited Interim Report 201312
Other Information
Notes:
1. Artson, a company which is wholly owned by Mr. Tung Chee Chen, holds 56.36% of the shares of Thelma and, accordingly, has an indirect interest in the same Shares in which Thelma has an interest.
2. Hanberry Global Limited (“Hanberry”), a company which is wholly owned by Mr. Tung Chee Hwa (brother of Mr. Tung Chee Chen, brother-in-law of Professor Roger King and father of Mr. Tung Lieh Cheung Andrew and Mr. Tung Lieh Sing Alan), holds 43.64% of the shares of Thelma and, accordingly, has an indirect interest in the same Shares in which Thelma has an interest.
3. Thelma, a company which is owned collectively by Artson and Hanberry, has an indirect interest in the same Shares in which Fortune Crest and Gala Way, wholly-owned subsidiaries of Thelma, have an interest.
4. Mr. Tung Chee Hwa has an interest in a trust which, through Hanberry as trustee, holds shares of Thelma, which has an indirect interest in 429,950,088 Shares. Mrs. Tung Chiu Hung Ping Betty (spouse of Mr. Tung Chee Hwa, sister-in-law of Mr. Tung Chee Chen and Professor Roger King, and mother of Mr. Tung Lieh Cheung Andrew and Mr. Tung Lieh Sing Alan) owns 25,231 Shares.
5. Archmore Investment Limited (“Archmore”), a company which is wholly owned by Edgemont Holdings Limited (“Edgemont”), has an interest in a trust which, through Artson as trustee, holds shares of Thelma, which has an indirect interest in 429,950,088 Shares.
6. Edgemont has an indirect interest in the same Shares in which Archmore, a wholly-owned subsidiary of Edgemont, has an interest.
7. Javier Global Limited (“Javier”), a company which is wholly owned by Mr. Tung Chee Chen, has an indirect interest in the same Shares in which Edgemont, a wholly-owned subsidiary of Javier, has an interest.
8. Bartlock Assets Ltd., a company which is wholly owned by Mr. Tung Chee Hwa, has an interest in a trust which, through Hanberry as trustee, holds shares of Thelma, which has an indirect interest in 429,950,088 Shares.
9. Flowell Development Inc., a company which is wholly owned by Mr. Tung Chee Chen, has an interest in a trust which, through Artson as trustee, holds shares of Thelma, which has an indirect interest in 429,950,088 Shares.
10. Izone Capital Limited, a company which is wholly owned by Mr. Tung Chee Chen, has an interest in a trust which, through Artson as trustee, holds shares of Thelma, which has an indirect interest in 429,950,088 Shares.
11. Jeference Capital Inc., a company which is wholly owned by Mr. Tung Chee Chen, has an interest in a trust which, through Artson as trustee, holds shares of Thelma, which has an indirect interest in 429,950,088 Shares.
12. THTI is a company wholly owned by Mr. Tung Chee Chen.
13. Fortune Crest has a direct interest in 350,722,656 Shares.
14. Gala Way has a direct interest in 79,227,432 Shares.
* For those companies marked with an asterisk, Mr. Tung Chee Chen is either a director of these companies or a director of a company which is a corporate director of these companies.
Save as disclosed herein, as at 30th June 2013, the Company has not been notified by any person (other than the Directors or the Chief Executive of the Company) who had an interest or short position in the Shares or the underlying Shares which were required to be disclosed to the Company under the provisions of Divisions 2 and 3 of Part XV of the SFO, or which were recorded in the register required to be kept by the Company under Section 336 of the SFO.

Orient Overseas (International) Limited Interim Report 2013 13
Other Information
DIRECTORS’ RIGHTS TO ACQUIRE SHARES OR DEBENTURESAs at 30th June 2013, neither the Company nor any of its subsidiaries was a party to any arrangements to enable the Directors of the Company to acquire benefits by means of the acquisition of shares in, or debentures of, the Company or any other body corporate.
PURCHASE, SALE OR REDEMPTION OF SHARESDuring the six-month period ended 30th June 2013, the Company has not redeemed any of its Shares and neither the Company nor any of its subsidiaries has purchased or sold any of the Company’s Shares.
PRE-EMPTIVE RIGHTSNo pre-emptive rights exist under laws of Bermuda in relation to the issue of new shares by the Company.
UPDATE ON DIRECTORS’ INFORMATION UNDER RULE 13.51B(1) OF THE LISTING RULESBelow are the changes of Directors’ information since the date of the 2012 Annual Report, required to be disclosed pursuant to Rule 13.51B(1) of the Listing Rules:
Mr. TUNG Chee Chen, the Chairman, President and Chief Executive Officer of the Company, retired as an Independent Non-Executive Director of Sing Tao News Corporation Limited, Wing Hang Bank, Limited and BOC Hong Kong (Holdings) Limited on 8th May 2013, 9th May 2013 and 28th May 2013 respectively.
Mr. TUNG Lieh Sing Alan, an Executive Director of the Company, was appointed as the Acting Chief Financial Officer and was elected as a member of the Executive Committee and the Compliance Committee of the Company, all with effect from 1st June 2013.
Mr. CHOW Philip Yiu Wah, a Non-Executive Director of the Company, is a consultant of the Company since 1st July 2012 and his consultancy contract which expired on 1st July 2013 was extended from 1st July 2013 up to 31st December 2013 at a consultancy fee of HK$2,103,101 per annum on a pro-rata basis.
Mr. Simon MURRAY, an Independent Non-Executive Director of the Company, ceased to be a Non-Executive Chairman of Glencore International Plc (“Glencore”) when Glencore was restructured after their annual general meeting on 16th May 2013; and an Independent Director of Sino-Forest Corporation on 30th January 2013. Mr. MURRAY was appointed as the Chairman and an Independent Non-Executive Director of Gulf Keystone Petroleum Ltd. (a company listed in the United Kingdom) on 4th July 2013.
Orient Overseas (International) Limited Interim Report 201314
Other Information
CORPORATE GOVERNANCE
Compliance with the Corporate Governance CodeThe Board and management of the Company are committed to maintaining high standards of corporate governance and the Company considers that effective corporate governance makes an important contribution to corporate success and to the enhancement of shareholder value.
The Company has adopted its own corporate governance code (the “CG Code”), applying the principles as set out in the Corporate Governance Code and Corporate Governance Report (the “SEHK Code”) contained in Appendix 14 to the Listing Rules, and also incorporates and conforms to local and international best practices. The CG Code sets out the corporate governance principles applied by the Company and its subsidiaries (the “Group”) and is constantly reviewed to ensure transparency, accountability and independence.
Throughout the period from 1st January 2013 to 30th June 2013, the Company complied with the SEHK Code, save for the following:
• Code Provision
Code provision of the SEHK Code
Deviation Considered reason for deviation
Separation of the role of Chairman and Chief Executive Officer of a listed issuer.
Mr. TUNG Chee Chen currently assumes the role of both Chairman and Chief Executive Officer of the Company.
The executive members of the Board currently consist of the chief executive officer of the principal division of the Group and there is effective separation of the roles between the chief executive of its principal division and the Chief Executive Officer of the Company. The Board considers that further separation of the roles of Chief Executive Officer and Chairman would represent duplication and is not necessary for the time being.
Independent Non-Executive Directors and other Non-Executive Directors should attend general meetings.
Mr. Simon MURRAY, an Independent Non-Executive Director of the Company, did not attend the annual general meeting of the Company held on 26th April 2013.
Mr. MURRAY had prior business commitment in Europe and was unable to attend the annual general meeting of the Company on 26th April 2013.
• Recommended Best Practices
• the remuneration of senior management is disclosed in bands
• operational results are announced and published quarterly instead of financial results
Securities Transactions by DirectorsThe Company has adopted its own code of conduct regarding securities transactions by Directors on terms no less exacting than the required standard set out in the Model Code contained in Appendix 10 to the Listing Rules.
All Directors have confirmed, following specific enquiry by the Company, that they have fully complied with the required standards set out in both the Company’s own code and the Model Code throughout the period from 1st January 2013 to 30th June 2013.

Orient Overseas (International) Limited Interim Report 2013 15
Index – Interim Financial Information
Content Page no.
Report on Review of Interim Financial Information 16Condensed Consolidated Profit and Loss Account (unaudited) 17Condensed Consolidated Statement of Comprehensive Income (unaudited) 18Condensed Consolidated Balance Sheet (unaudited) 19Condensed Consolidated Cash Flow Statement (unaudited) 21Condensed Consolidated Statement of Changes in Equity (unaudited) 22Notes to the Interim Financial Information1. General Information 232. Basis of Preparation 233. Financial Risk Management 254. Critical Accounting Estimates and Judgements 285. Revenue 286. Operating Profit 297. Key Management Compensation 308. Finance Costs 309. Taxation 3010. Interim Dividend 3011. (Loss)/Earnings Per Ordinary Share 3112. Capital Expenditure 3113. Debtors and Prepayments 3214. Derivative Financial Instruments 3215. Share Capital 3316. Reserves 3317. Creditors and Accruals 3418. Borrowings 3419. Commitments 3520. Segment Information 36

Orient Overseas (International) Limited Interim Report 201316
Report on Review of Interim Financial Information
To the Board of Directors ofOrient Overseas (International) Limited(Incorporated in Bermuda with limited liability)
IntroductionWe have reviewed the interim financial information set out on pages 17 to 38, which comprises the condensed consolidated balance sheet of Orient Overseas (International) Limited (the “Company”) and its subsidiaries (together, the “Group”) as at 30th June 2013 and the condensed consolidated profit and loss account, the condensed consolidated statement of comprehensive income, the condensed consolidated cash flow statement and the condensed consolidated statement of changes in equity for the six-month period then ended, and a summary of significant accounting policies and other explanatory notes. The Rules Governing the Listing of Securities on The Stock Exchange of Hong Kong Limited require the preparation of a report on interim financial information to be in compliance with the relevant provisions thereof and Hong Kong Accounting Standard 34 “Interim Financial Reporting” issued by the Hong Kong Institute of Certified Public Accountants. The Directors of the Company are responsible for the preparation and presentation of this interim financial information in accordance with Hong Kong Accounting Standard 34 “Interim Financial Reporting”. Our responsibility is to express a conclusion on this interim financial information based on our review and to report our conclusion solely to you, as a body, in accordance with our agreed terms of engagement and for no other purpose. We do not assume responsibility towards or accept liability to any other person for the contents of this report.
Scope of ReviewWe conducted our review in accordance with Hong Kong Standard on Review Engagements 2410, “Review of Interim Financial Information Performed by the Independent Auditor of the Entity” issued by the Hong Kong Institute of Certified Public Accountants. A review of interim financial information consists of making inquiries, primarily of persons responsible for financial and accounting matters, and applying analytical and other review procedures. A review is substantially less in scope than an audit conducted in accordance with Hong Kong Standards on Auditing and consequently does not enable us to obtain assurance that we would become aware of all significant matters that might be identified in an audit. Accordingly, we do not express an audit opinion.
ConclusionBased on our review, nothing has come to our attention that causes us to believe that the interim financial information is not prepared, in all material respects, in accordance with Hong Kong Accounting Standard 34 “Interim Financial Reporting”.
PricewaterhouseCoopersCertified Public Accountants
Hong Kong, 7th August 2013
Orient Overseas (International) Limited Interim Report 2013 17
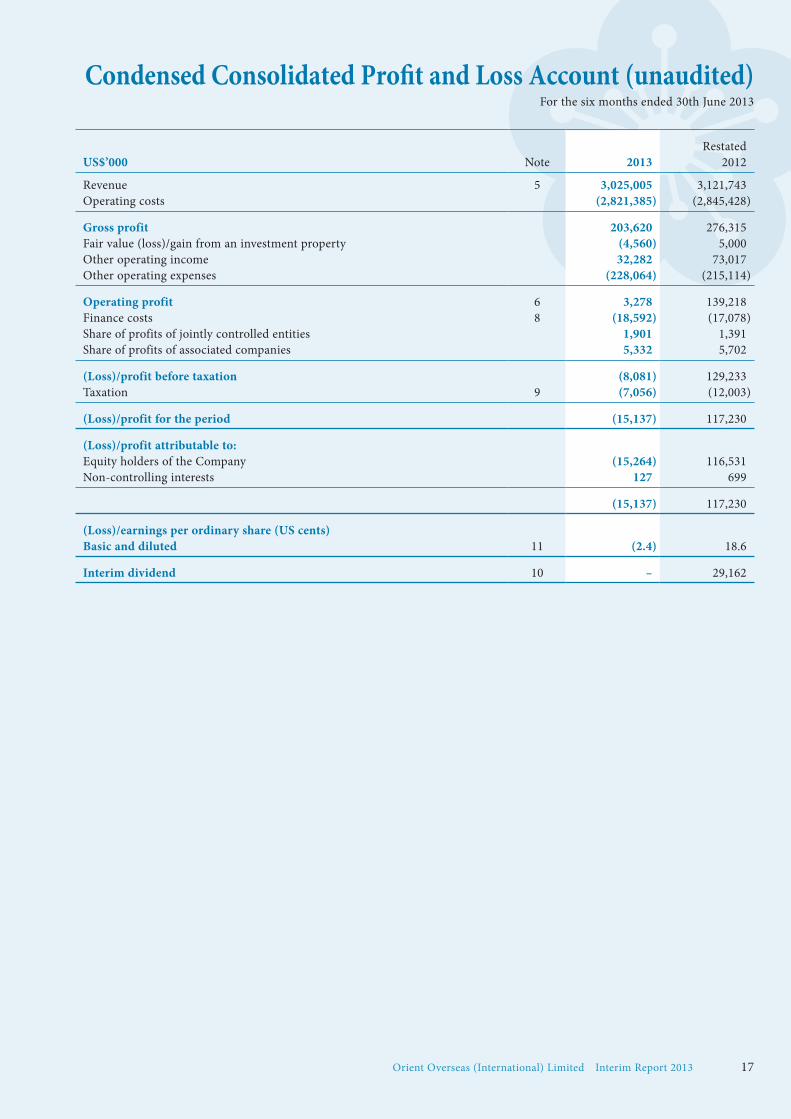
Condensed Consolidated Profit and Loss Account (unaudited)For the six months ended 30th June 2013
US$’000 Note 2013Restated
2012
Revenue 5 3,025,005 3,121,743Operating costs (2,821,385) (2,845,428)
Gross profit 203,620 276,315Fair value (loss)/gain from an investment property (4,560) 5,000Other operating income 32,282 73,017Other operating expenses (228,064) (215,114)
Operating profit 6 3,278 139,218Finance costs 8 (18,592) (17,078)Share of profits of jointly controlled entities 1,901 1,391Share of profits of associated companies 5,332 5,702
(Loss)/profit before taxation (8,081) 129,233Taxation 9 (7,056) (12,003)
(Loss)/profit for the period (15,137) 117,230
(Loss)/profit attributable to:Equity holders of the Company (15,264) 116,531Non-controlling interests 127 699
(15,137) 117,230
(Loss)/earnings per ordinary share (US cents)Basic and diluted 11 (2.4) 18.6
Interim dividend 10 – 29,162

Orient Overseas (International) Limited Interim Report 201318
Condensed Consolidated Statement of Comprehensive Income (unaudited)For the six months ended 30th June 2013
US$’000 2013Restated
2012
(Loss)/profit for the period (15,137) 117,230
Other comprehensive income:Item that will not be subsequently reclassified to profit or loss:Actuarial losses on defined benefit schemes (6,554) (7,234)
Items that may be reclassified subsequently to profit or loss: Available-for-sale financial assets– Change in fair value (8,414) (29,690)– Assets revaluation reserve realised (112) –Share of other comprehensive income/(loss)– Associated companies 1,829 (443)– Jointly controlled entities 134 (34)Currency translation adjustments– Foreign subsidiaries 3,005 (918)– Non-controlling interests 103 (6)
Total items that may be reclassified subsequently to profit or loss (3,455) (31,091)
Other comprehensive loss for the period, net of tax (10,009) (38,325)
Total comprehensive (loss)/income for the period (25,146) 78,905
Total comprehensive (loss)/income attributable to:Equity holders of the Company (25,376) 78,212Non-controlling interests 230 693
(25,146) 78,905

Orient Overseas (International) Limited Interim Report 2013 19
Condensed Consolidated Balance Sheet (unaudited)As at 30th June 2013
30th JuneRestated
31st DecemberUS$’000 Note 2013 2012
ASSETSNon-current assetsProperty, plant and equipment 12 5,091,810 4,664,773Investment property 12 170,000 165,000Prepayments of lease premiums 12 9,685 9,793Jointly controlled entities 8,684 7,610Associated companies 127,907 111,917Intangible assets 12 39,550 38,916Deferred taxation assets 1,597 1,711Pension and retirement assets 6,142 10,386Derivative financial instruments 14 5,309 7,022Restricted bank balances 20,360 18,030Available-for-sale financial assets 146,575 154,463Held-to-maturity investments 251,709 253,956Other non-current assets 22,048 22,158
5,901,376 5,465,735
Current assetsInventories 145,410 153,785Debtors and prepayments 13 532,774 543,982Portfolio investments 222,385 205,427Restricted bank balances 1,265 460Cash and bank balances 1,878,515 1,861,650
2,780,349 2,765,304
Total assets 8,681,725 8,231,039
EQUITYEquity holdersShare capital 15 62,579 62,579Reserves 16 4,348,873 4,419,236
4,411,452 4,481,815Non-controlling interests 6,056 5,778
Total equity 4,417,508 4,487,593

Orient Overseas (International) Limited Interim Report 201320
Condensed Consolidated Balance Sheet (unaudited)As at 30th June 2013
30th JuneRestated
31st DecemberUS$’000 Note 2013 2012
LIABILITIESNon-current liabilitiesBorrowings 18 2,964,851 2,325,777Deferred taxation liabilities 53,970 57,558Pension and retirement liabilities 289 301Derivative financial instruments 14 7,578 7,418
3,026,688 2,391,054
Current liabilitiesCreditors and accruals 17 803,074 784,500Amounts due to jointly controlled entities 8,927 5,948Borrowings 18 420,668 555,753Current taxation 4,860 6,191
1,237,529 1,352,392
Total liabilities 4,264,217 3,743,446
Total equity and liabilities 8,681,725 8,231,039
Net current assets 1,542,820 1,412,912
Total assets less current liabilities 7,444,196 6,878,647
C C TungAlan TungDirectors

Orient Overseas (International) Limited Interim Report 2013 21
Condensed Consolidated Cash Flow Statement (unaudited)For the six months ended 30th June 2013
US$’000 2013 2012
Cash flows from operating activities Cash generated from operations 164,776 194,171 Interest paid (13,252) (7,654) Interest element of finance lease rental payments (5,487) (8,700) Overseas taxes paid (13,568) (5,968)
Net cash from operating activities 132,469 171,849
Cash flows from investing activities Sale of property, plant and equipment 15,341 32,099 Sale of available-for-sale financial assets 116 – Purchase of property, plant and equipment (167,885) (237,529) Addition of investment property (9,560) – Purchase of available-for-sale financial assets – (5) Purchase of held-to-maturity investments – (19,400) Increase in portfolio investments (16,958) (29,013) Increase in amounts due to jointly controlled entities 2,979 2,079 Increase in restricted bank balances and bank deposits maturing more than three months from the date of placement (179,061) (434,363) Increase of investment in an associated company (10,051) (19,837) Increase in intangible assets (4,848) (4,557) Decrease/(increase) in other non-current assets 110 (257) Interest received 16,786 17,684 Dividends received from portfolio investments 164 275 Dividends received from available-for-sale financial assets 7,906 7,937 Dividends received from associated companies and a jointly controlled entity 961 6,675 Capital contribution from non-controlling interests 48 –
Net cash used in investing activities (343,952) (678,212)
Cash flows from financing activities New loans 464,100 348,985 Repayment of loans (242,095) (116,746) Capital element of finance lease rental payments (125,791) (92,507) Dividend paid to equity holders of the Company (44,987) – Dividend paid to non-controlling interests – (704)
Net cash from financing activities 51,227 139,028
Net decrease in cash and cash equivalents (160,256) (367,335)Cash and cash equivalents at beginning of period 1,597,018 1,909,154Currency translation adjustments 1,241 (1,035)
Cash and cash equivalents at end of period 1,438,003 1,540,784
Analysis of cash and cash equivalents Bank balances and deposits maturing within three months from the date of placement 1,438,129 1,540,894 Bank overdrafts (126) (110)
1,438,003 1,540,784

Orient Overseas (International) Limited Interim Report 201322
Condensed Consolidated Statement of Changes in Equity (unaudited)For the six months ended 30th June 2013
Equity holders
US$’000 Share capital Reserves Sub-total
Non-controlling
interests Total
Balance at 31st December 2012 As previously reported 62,579 4,446,911 4,509,490 5,778 4,515,268 Prior year adjustment (note 2) – (27,675) (27,675) – (27,675)
As restated 62,579 4,419,236 4,481,815 5,778 4,487,593Total comprehensive (loss)/income for the period – (25,376) (25,376) 230 (25,146)Transactions with owners 2012 final dividend – (44,987) (44,987) – (44,987) Capital contribution from non-controlling interests – – – 48 48
Balance at 30th June 2013 62,579 4,348,873 4,411,452 6,056 4,417,508
Balance at 31st December 2011 As previously reported 62,579 4,188,283 4,250,862 6,686 4,257,548 Prior year adjustment – (17,394) (17,394) – (17,394)
As restated 62,579 4,170,889 4,233,468 6,686 4,240,154Total comprehensive income for the period – 78,212 78,212 693 78,905Transaction with owners Dividend paid to non-controlling interests – – – (704) (704)
Balance at 30th June 2012 62,579 4,249,101 4,311,680 6,675 4,318,355

Orient Overseas (International) Limited Interim Report 2013 23
Notes to the Interim Financial Information
1. General InformationOrient Overseas (International) Limited (the “Company”) is a limited liability company incorporated in Bermuda. The address of its registered office is 33rd floor, Harbour Centre, No. 25 Harbour Road, Wanchai, Hong Kong.
The Company has its listing on the Main Board of The Stock Exchange of Hong Kong Limited.
This interim financial information was approved by the Board of Directors on 7th August 2013.
2. Basis of PreparationThe interim financial information has been prepared in accordance with Hong Kong Financial Reporting Standards (“HKFRS”). They have been prepared under the historical cost convention, as modified by the revaluation of investment property, available-for-sale financial assets, and financial assets and financial liabilities (including derivative financial instruments) at fair value through profit or loss, which are carried at fair value and in accordance with Hong Kong Accounting Standard (“HKAS”) 34 “Interim Financial Reporting” issued by the Hong Kong Institute of Certified Public Accountants (“HKICPA”).
The accounting policies and methods of computation used in the preparation of the interim financial information are consistent with those used in the annual accounts for the year ended 31st December 2012 except as disclosed below.
The adoption of revised HKFRSIn 2013, the Group adopted the following new standards, amendments and improvements to HKFRS below, which are relevant to its operations.
New standards and amendments
HKAS 1 Amendment Presentation of Financial StatementsHKAS 19 Amendment Employee BenefitsHKAS 27 (2011) Separate Financial StatementsHKAS 28 (2011) Associates and Joint VenturesHKFRS 7 Amendment Financial Instruments:
Disclosures – Offsetting Financial Assets and Financial LiabilitiesHKFRS 10 Consolidated Financial StatementsHKFRS 10 Amendment Consolidated Financial Statements – Transition GuidanceHKFRS 11 Joint ArrangementsHKFRS 11 Amendment Joint Arrangements – Transition GuidanceHKFRS 12 Disclosure of Interests in Other EntitiesHKFRS 12 Amendment Disclosure of Interests in Other Entities – Transition GuidanceHKFRS 13 Fair Value Measurements
Annual improvements to HKFRS published in June 2012
HKAS 1 Amendment Presentation of Financial StatementsHKAS 16 Amendment Property, Plant and EquipmentHKAS 32 Amendment Financial Instruments: PresentationHKAS 34 Amendment Interim Financial Reporting
Excepted for HKAS 19 Amendment and HKFRS 13 mentioned below, there are no other new standards, amendments and improvements that are effective for the first time for this interim period that would have a material impact on the Group.
Orient Overseas (International) Limited Interim Report 201324
Notes to the Interim Financial Information
2. Basis of Preparation (Continued)
The adoption of revised HKFRS (Continued)
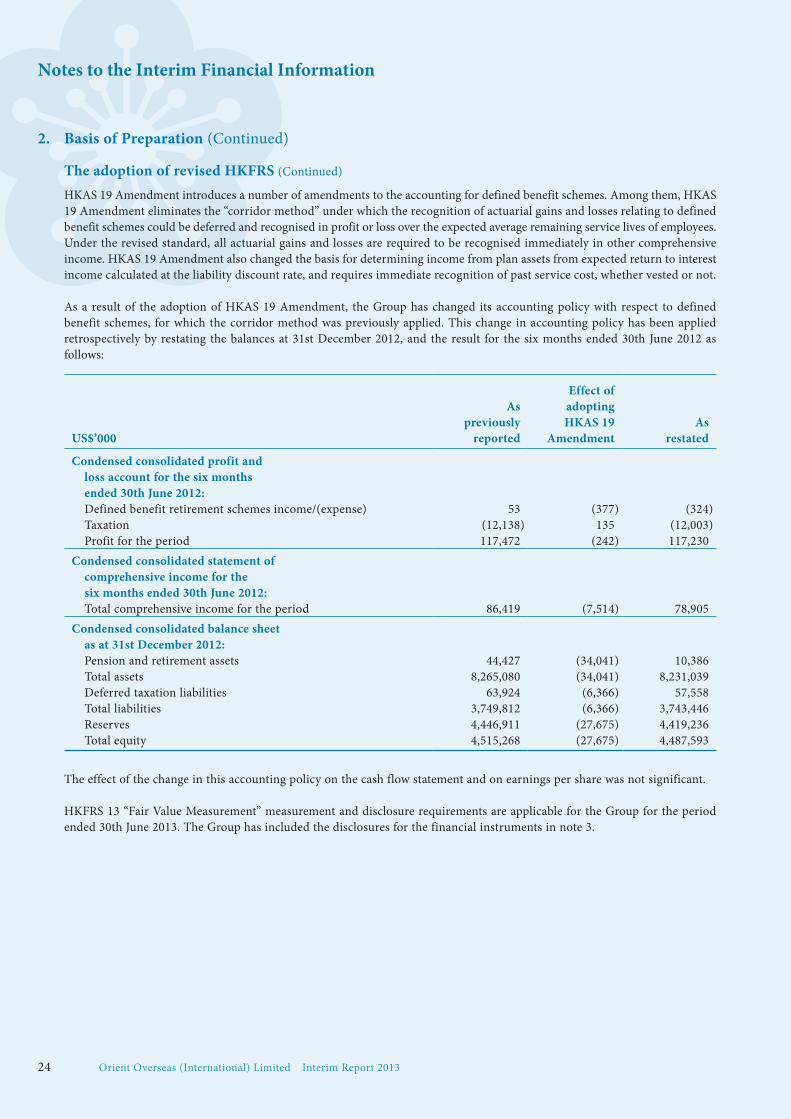
HKAS 19 Amendment introduces a number of amendments to the accounting for defined benefit schemes. Among them, HKAS 19 Amendment eliminates the “corridor method” under which the recognition of actuarial gains and losses relating to defined benefit schemes could be deferred and recognised in profit or loss over the expected average remaining service lives of employees. Under the revised standard, all actuarial gains and losses are required to be recognised immediately in other comprehensive income. HKAS 19 Amendment also changed the basis for determining income from plan assets from expected return to interest income calculated at the liability discount rate, and requires immediate recognition of past service cost, whether vested or not.
As a result of the adoption of HKAS 19 Amendment, the Group has changed its accounting policy with respect to defined benefit schemes, for which the corridor method was previously applied. This change in accounting policy has been applied retrospectively by restating the balances at 31st December 2012, and the result for the six months ended 30th June 2012 as follows:
Effect ofAs adopting
previously HKAS 19 AsUS$’000 reported Amendment restated
Condensed consolidated profit and loss account for the six months ended 30th June 2012: Defined benefit retirement schemes income/(expense) 53 (377) (324) Taxation (12,138) 135 (12,003) Profit for the period 117,472 (242) 117,230
Condensed consolidated statement of comprehensive income for the six months ended 30th June 2012: Total comprehensive income for the period 86,419 (7,514) 78,905
Condensed consolidated balance sheet as at 31st December 2012: Pension and retirement assets 44,427 (34,041) 10,386 Total assets 8,265,080 (34,041) 8,231,039 Deferred taxation liabilities 63,924 (6,366) 57,558 Total liabilities 3,749,812 (6,366) 3,743,446 Reserves 4,446,911 (27,675) 4,419,236 Total equity 4,515,268 (27,675) 4,487,593
The effect of the change in this accounting policy on the cash flow statement and on earnings per share was not significant.
HKFRS 13 “Fair Value Measurement” measurement and disclosure requirements are applicable for the Group for the period ended 30th June 2013. The Group has included the disclosures for the financial instruments in note 3.

Orient Overseas (International) Limited Interim Report 2013 25
Notes to the Interim Financial Information
2. Basis of Preparation (Continued)
Standard, amendments and interpretation to existing standards that are relevant but not yet effective to the Group
New standard, amendments and interpretation
Effective for accounting periods beginning on or after
HKAS 32 Amendment Financial Instruments: 1st January 2014 Presentation: Offsetting Financial Assets and Financial Liabilities
HKAS 36 Amendment Recoverable amount disclosures 1st January 2014 for non-financial assets
HK(IFRIC) – Int 21 Levies 1st January 2014HKFRS 7 Amendment Financial Instruments: Disclosures 1st January 2015*
– Mandatory Effective date of HKFRS 9 and Transitional Disclosures
HKFRS 9 Financial Instruments 1st January 2015
* Effective for annual periods beginning 1st January 2015 for those in connection with HKFRS 9
The Group has not early adopted the above standard, amendments and interpretation and is not yet in a position to state whether substantial changes to the Group’s accounting policies and presentation of accounts will result.
3. Financial Risk ManagementAll aspects of the Group’s financial risk management objectives and policies are consistent with those disclosed in the annual accounts for the year ended 31st December 2012.
3.1 Fair value estimationThe table below analyses financial instruments carried at fair value by valuation method. The different levels have been defined as follows:
• Quoted prices (unadjusted) in active markets for identical assets or liabilities (level 1).
• Inputs other than quoted prices included within level 1 that are observable for the asset or liability, either directly (that is, as prices) or indirectly (that is, derived from prices) (level 2).
• Inputs for the asset or liability that are not based on observable market data (that is, unobservable inputs) (level 3).

Orient Overseas (International) Limited Interim Report 201326
Notes to the Interim Financial Information
3. Financial Risk Management (Continued)
3.1 Fair value estimation (Continued)
The following table presents the Group’s financial assets and liabilities that are measured at fair value at 30th June 2013.
US$’000 Level 1 Level 2 Level 3 Total
AssetsPortfolio investments – Equity securities 22,388 – – 22,388 – Debt securities 194,901 – – 194,901 – Funds and other investments 5,096 – – 5,096
Derivative financial instruments – 5,309 – 5,309Available-for-sale financial assets – Listed equity securities 37,791 – – 37,791 – Other investments – – 108,784 108,784
Total assets 260,176 5,309 108,784 374,269
LiabilitiesDerivative financial instruments – 7,578 – 7,578
Total liabilities – 7,578 – 7,578
The following table presents the Group’s financial assets and liabilities that are measured at fair value at 31st December 2012.
US$’000 Level 1 Level 2 Level 3 Total
AssetsPortfolio investments – Equity securities 24,875 – – 24,875 – Debt securities 175,292 141 – 175,433 – Funds and other investments – 5,119 – 5,119Derivative financial instruments – 7,022 – 7,022Available-for-sale financial assets – Listed equity securities 39,129 – – 39,129 – Other investments – – 115,334 115,334
Total assets 239,296 12,282 115,334 366,912
LiabilitiesDerivative financial instruments – 7,418 – 7,418
Total liabilities – 7,418 – 7,418
There were no transfers among Levels 1, 2 and 3 during the period.

Orient Overseas (International) Limited Interim Report 2013 27
Notes to the Interim Financial Information
3. Financial Risk Management (Continued)
3.1 Fair value estimation (Continued)
Specific valuation techniques used to value Levels 2 and 3 financial instruments include:
• Dealer quotes.
• The fair value of interest rate swaps is calculated as the present value of the estimated future cash flows based on observable yield curves.
• The fair value of forward foreign exchange contracts is determined using forward exchange rates at the balance sheet date, with the resulting value discounted back to present value.
• Marketability discount rate derived from management’s judgment is applied to estimate the fair value of unlisted equity security classified as available-for-sale financial asset.
There were no changes in valuation techniques during the period.
The following table presents the changes in level 3 instruments:
US$’000
Opening balance at 31st December 2012 115,334Disposals (116)Currency translation adjustments (34)Fair value change recognised in other comprehensive income (6,400)
Closing balance at 30th June 2013 108,784
Level 3 financial instruments mainly represent unlisted equity security classified as available-for-sale financial asset of which a marketability discount rate of 15% is applied to estimate the fair value. If the change in the discount rate for that financial instrument increases or decreases by 1%, the impact on other comprehensive income would be decreased or increased by US$1.3 million.

Orient Overseas (International) Limited Interim Report 201328
Notes to the Interim Financial Information
3. Financial Risk Management (Continued)
3.2 Fair value of financial assets and liabilities measured at amortised cost
Carrying amount Fair value30th 31st 30th 31stJune December June December
US$’000 2013 2012 2013 2012
Non-current bank loans 1,653,231 1,351,435 1,654,129 1,352,378
Held-to-maturity investments 251,709 253,956 260,503 274,238
The fair values of the following financial assets and liabilities approximate their carrying amounts:
• Debtors and prepayments
• Prepayment of lease premiums
• Cash and bank balances
• Restricted bank balances
• Other current financial assets
• Creditors and accruals
• Borrowings except for those disclosed above
• Other current financial liabilities
4. Critical Accounting Estimates and JudgementsEstimates and judgements used are continually evaluated and are based on historical experience and other factors, including expectations of future events that are believed to be reasonable under the circumstances. The resulting accounting estimates will, by definition, seldom equal the related actual results.
The estimates and assumptions applied in the preparation of the interim financial information are consistent with those used in the annual accounts for the year ended 31st December 2012.
5. Revenue
US$’000 2013 2012
Container transport and logistics 3,012,234 3,107,661Rental income 12,771 14,082
3,025,005 3,121,743
The principal activities of the Group are container transport and logistics.
Revenue comprises turnover which includes gross freight, charterhire, service and other income from the operation of the container transport and logistics and rental income from the investment property.

Orient Overseas (International) Limited Interim Report 2013 29
Notes to the Interim Financial Information
6. Operating Profit
US$’000 2013 2012
Operating profit is arrived at after crediting:
Interest income from banks 7,427 12,232Interest income from held-to-maturity investments 5,033 3,834Gross rental income from an investment property 12,771 14,082Net gain on disposal of property, plant and equipment – Containers 2,682 – – Others 3,592 –Income from available-for-sale financial assets – Gain on disposal 112 – – Distribution 1,164 – – Dividend income 7,906 42,633Net gain on interest rate swap contracts – 350Fair value gain on foreign exchange forward contracts – 687Portfolio investment income – Fair value gain (realised and unrealised) – 7,145 – Interest income 3,822 3,530 – Dividend income 258 275Exchange gain – 2,035
and after charging:
Depreciation Owned assets 104,390 80,282 Leased assets 39,503 36,179Operating lease rental expense Vessels and equipment 183,453 195,591 Terminals and berths 12,177 12,704 Land and buildings 11,675 13,712Rental outgoings in respect of an investment property 7,399 5,899Net loss on disposal of property, plant and equipment – Container Vessels – 4,041 – Containers – 596 – Others – (120)Portfolio investment loss – Fair value loss (realised and unrealised) 14,651 –Net loss on interest rate swap contracts 621 –Fair value loss on foreign exchange forward contracts 944 –Amortisation of intangible assets 4,215 6,186Amortisation of prepayments of lease premiums 244 229Exchange loss 1,161 –

Orient Overseas (International) Limited Interim Report 201330
Notes to the Interim Financial Information
7. Key Management Compensation
US$’000 2013 2012
Salaries and other short-term employee benefits 2,622 2,270Pension costs – defined contribution plans 255 211
2,877 2,481
The Group usually determines and pays discretionary bonuses to employees (including Directors) around April/May each year based on the actual financial results of the Group for the preceding year. The discretionary bonuses shown above represent actual payments to the Directors and individuals during the current financial period in relation to performance for the preceding year.
8. Finance Costs
US$’000 2013 2012
Interest expense (20,876) (17,748)Amount capitalised under assets 2,284 670
Net interest expense (18,592) (17,078)
9. Taxation
US$’000 2013Restated
2012
Current taxation Hong Kong profits tax (794) (650) Overseas taxation (9,806) (9,777)
(10,600) (10,427)
Deferred taxation Overseas taxation 3,544 (1,576)
(7,056) (12,003)
Taxation has been provided at the appropriate tax rates prevailing in the countries in which the Group operates on the estimated assessable profits for the period. These rates range from 10% to 47% (2012: 10% to 47%) and the rate applicable for Hong Kong profits tax is 16.5% (2012: 16.5%).
10. Interim Dividend
US$’000 2013 2012
Interim dividend of US cents nil (2012: US4.66 cents) per ordinary share – 29,162
The Board of Directors does not recommend the payment of an interim dividend for 2013 (2012: US4.66 cents per ordinary share).
Orient Overseas (International) Limited Interim Report 2013 31
Notes to the Interim Financial Information
11. (Loss)/Earnings Per Ordinary ShareThe calculation of basic and diluted (loss)/earnings per ordinary share is based on the Group’s (loss)/profit attributable to equity holders of the Company divided by the number of ordinary shares in issue during the period.
The basic and diluted (loss)/earnings per ordinary share are the same since there are no potential dilutive shares.
US$’000 2013Restated
2012
Number of ordinary shares in issue (thousands) 625,793 625,793
Group’s (loss)/profit attributable to: Equity holders of the Company (15,264) 116,531 Non-controlling interests 127 699
(15,137) 117,230
(Loss)/earnings per share attributable to equity holders of the Company (US cents) (2.4) 18.6
12. Capital Expenditure
US$’000
Property,plant and
equipmentInvestment
property
Prepaymentsof lease
premiumsIntangible
assets Total
Net book amounts:Balance at 31st December 2012 4,664,773 165,000 9,793 38,916 4,878,482Currency translation adjustments 488 – 136 1 625Fair value loss – (4,560) – – (4,560)Additions 579,509 9,560 – 4,848 593,917Disposals (9,067) – – – (9,067)Depreciation and amortisation (143,893) – (244) (4,215) (148,352)
Balance at 30th June 2013 5,091,810 170,000 9,685 39,550 5,311,045
Balance at 31st December 2011 4,205,194 160,000 10,249 40,014 4,415,457Currency translation adjustments (357) – (37) – (394)Fair value gain – 5,000 – – 5,000Additions 238,199 – – 4,557 242,756Classified as asset held for sale (33,186) – – – (33,186)Disposals (34,273) – – – (34,273)Depreciation and amortisation (116,461) – (229) (6,186) (122,876)
Balance at 30th June 2012 4,259,116 165,000 9,983 38,385 4,472,484

Orient Overseas (International) Limited Interim Report 201332
Notes to the Interim Financial Information
13. Debtors and Prepayments
US$’00030th June
201331st December
2012
Trade receivables 330,185 345,193Less: Provision for impairment (8,708) (7,365)
Trade receivables – net 321,477 337,828Other debtors 84,936 87,819Other prepayments 101,857 95,519Utility and other deposits 6,685 8,107Tax recoverable 17,819 14,709
532,774 543,982
Trade receivables are normally due for payment on presentation of invoices or granted with an approved credit period ranging mainly from 10 to 30 days. Trade receivables with overdue balances are requested to settle all outstanding balances before any further credit is granted. The ageing analysis of the Group’s trade receivables, net of provision for impairment, prepared in accordance with the due dates of invoices, is as follows:
US$’00030th June
201331st December
2012
Below one month 295,956 308,787Two to three months 19,748 23,700Four to six months 3,472 4,650Over six months 2,301 691
321,477 337,828
14. Derivative Financial Instruments
US$’00030th June
201331st December
2012
AssetsNon-current assets Interest rate swap contracts 5,309 7,022
LiabilitiesNon-current liabilities Interest rate swap contract (2,740) (3,524) Foreign exchange forward contract (4,838) (3,894)
(7,578) (7,418)

Orient Overseas (International) Limited Interim Report 2013 33
Notes to the Interim Financial Information
15. Share Capital
US$’00030th June
201331st December
2012
Authorised: 900,000,000 ordinary shares of US$0.10 each 90,000 90,000 65,000,000 convertible redeemable preferred shares of US$1 each 65,000 65,000 50,000,000 redeemable preferred shares of US$1 each 50,000 50,000
205,000 205,000
Issued and fully paid: 625,793,297 (2012: 625,793,297) ordinary shares of US$0.10 each 62,579 62,579
16. Reserves
US$’000Share
premiumContributed
surplus
Capitalredemption
reserve
Available-for-sale
financialassets
revaluationreserve
Foreignexchange
translationreserve
Retainedprofit Total
Balance at 31st December 2012 As previously reported 172,457 88,547 4,696 117,614 59,712 4,003,885 4,446,911 Prior year adjustment (note 2) – – – – – (27,675) (27,675)
As restated 172,457 88,547 4,696 117,614 59,712 3,976,210 4,419,236Total comprehensive (loss)/ income for the period – – – (8,526) 4,968 (21,818) (25,376)Transactions with owners 2012 final dividend – – – – – (44,987) (44,987)
Balance at 30th June 2013 172,457 88,547 4,696 109,088 64,680 3,909,405 4,348,873
Balance at 31st December 2011 As previously reported 172,457 88,547 4,696 128,178 57,945 3,736,460 4,188,283 Prior year adjustment – – – – – (17,394) (17,394)
As restated 172,457 88,547 4,696 128,178 57,945 3,719,066 4,170,889Total comprehensive income/(loss) for the period – – – (29,690) (1,357) 109,259 78,212
Balance at 30th June 2012 172,457 88,547 4,696 98,488 56,588 3,828,325 4,249,101Total comprehensive income for the period – – – 19,126 3,124 176,819 199,069Transactions with owners 2012 interim dividend – – – – – (29,198) (29,198) Acquisition of additional interest in a subsidiary – – – – – 264 264
Balance at 31st December 2012 172,457 88,547 4,696 117,614 59,712 3,976,210 4,419,236

Orient Overseas (International) Limited Interim Report 201334
Notes to the Interim Financial Information
17. Creditors and Accruals
US$’00030th June
201331st December
2012
Trade payables 242,405 279,040Other creditors 66,144 72,728Accrued expenses 449,681 374,892Deferred revenue 44,844 57,840
803,074 784,500
The ageing analysis of the Group’s trade payables, prepared in accordance with dates of invoices, is as follows:
US$’00030th June
201331st December
2012
Below one month 197,179 169,860Two to three months 44,722 102,961Four to six months 438 5,378Over six months 66 841
242,405 279,040
18. Borrowings
US$’00030th June
201331st December
2012
Non-currentBank loans– Secured 1,552,231 1,340,366– Unsecured 101,000 11,069Finance lease obligations 1,311,620 974,342
2,964,851 2,325,777
CurrentBank overdrafts, unsecured 126 172Bank loans– Secured 147,975 221,684– Unsecured 24,997 31,079Finance lease obligations 247,570 302,818
420,668 555,753
Total borrowings 3,385,519 2,881,530

Orient Overseas (International) Limited Interim Report 2013 35
Notes to the Interim Financial Information
19. Commitments
(a) Capital commitments – Property, plant and equipment
US$’00030th June
201331st December
2012
Contracted but not provided for 970,899 1,324,115Authorised but not contracted for 113,660 305,327
1,084,559 1,629,442
(b) Operating lease commitmentsThe future aggregate minimum lease rental expenses under non-cancellable operating leases are payable in the following years:
US$’000Vessels andequipment
Land andbuildings Total
As at 30th June 2013 2013/14 250,287 24,518 274,805 2014/15 135,795 12,088 147,883 2015/16 76,907 6,293 83,200 2016/17 71,856 3,793 75,649 2017/18 70,312 1,506 71,818 2018/19 onwards 233,296 4,874 238,170
838,453 53,072 891,525
As at 31st December 2012 (Restated) 2013 208,353 25,659 234,012 2014 152,881 17,605 170,486 2015 93,243 6,487 99,730 2016 69,789 4,538 74,327 2017 69,479 4,148 73,627 2018 onwards 258,613 3,944 262,557
852,358 62,381 914,739
The Group entered into the Preferential Assignment Agreement (the “Agreement”) with the Port of Long Beach (“POLB”) for the use of the Middle Harbor Terminal (the “Terminal”) in Long Beach, California USA on 30th April 2012. The term of the Agreement is 40 years commencing on 1st July 2011. On 28th March 2013, the Group signed the First Amendment to Preferential Assignment Agreement (the “Amendment”) with POLB, which has amended certain terms within Agreement and has altered the expected guaranteed minimum annual compensation to be made for the relevant period of the lease term.
The guaranteed minimum annual compensation is computed based on the guaranteed minimum annual compensation per acreage (ranging from US$180,000 to US$270,000 in the first 5 years of the lease) multiplied by the number of acreages of the Terminal becoming available, which is subject to mutual agreement between the Group and POLB along the Terminal construction and based on the milestones set out in the Agreement. The construction is expected to be completed by 2019 and the estimated number of acreages of the Terminal upon completion is estimated to be approximately 304.7 acreages. As of 30th June 2013, the acreages of the Terminal available are 90.8 acreages. The Group and POLB will renegotiate the guaranteed minimum annual compensation per acreage every 5 years which will not be less than the highest guaranteed minimum annual compensation in the previous 5 years.

Orient Overseas (International) Limited Interim Report 201336
Notes to the Interim Financial Information
20. Segment InformationThe principal activities of the Group are container transport and logistics. Container transport and logistics include global containerised shipping services in major trade lanes, covering Trans-Pacific, Trans-Atlantic, Asia/Europe, Asia/Australia and Intra-Asia trades, and integrated services over the management and control of effective storage and flow of goods. In accordance with the Group’s internal financial reporting provided to the chief operating decision-makers, who are responsible for allocating resources, assessing performance of the operating segments and making strategic decisions, the reportable operating segments are container transport and logistics and others.
Operating segmentsThe segment results for the six months ended 30th June 2013 are as follows:
US$’000
Containertransport
and logistics Others Elimination Group
Revenue 3,012,234 13,203 (432) 3,025,005
Operating profit/(loss) (4,385) 7,663 – 3,278Finance costs (18,592) – – (18,592)Share of profits of jointlycontrolled entities 1,901 – – 1,901Share of profits of associated companies 5,332 – – 5,332
(Loss)/profit before taxation (15,744) 7,663 – (8,081)Taxation (6,887) (169) – (7,056)
(Loss)/profit for the period (22,631) 7,494 – (15,137)
Capital expenditure 584,354 9,563 – 593,917Depreciation 143,893 – – 143,893Amortisation 4,459 – – 4,459
The segment results for the six months ended 30th June 2012 are as follows:
US$’000
Containertransport
and logistics Others EliminationRestated
Group
Revenue 3,107,661 14,499 (417) 3,121,743
Operating profit 60,490 78,728 – 139,218Finance costs (17,078) – – (17,078)Share of profits of jointly controlled entities 1,391 – – 1,391Share of profits of associated companies 5,702 – – 5,702
Profit before taxation 50,505 78,728 – 129,233Taxation (7,621) (4,382) – (12,003)
Profit for the period 42,884 74,346 – 117,230
Capital expenditure 242,756 – – 242,756Depreciation 116,461 – – 116,461Amortisation 6,415 – – 6,415
Others mainly represent corporate level activities including central treasury management and property investment.
Inter-segment transfers or transactions are conducted at prices and terms mutually agreed amongst those business segments.
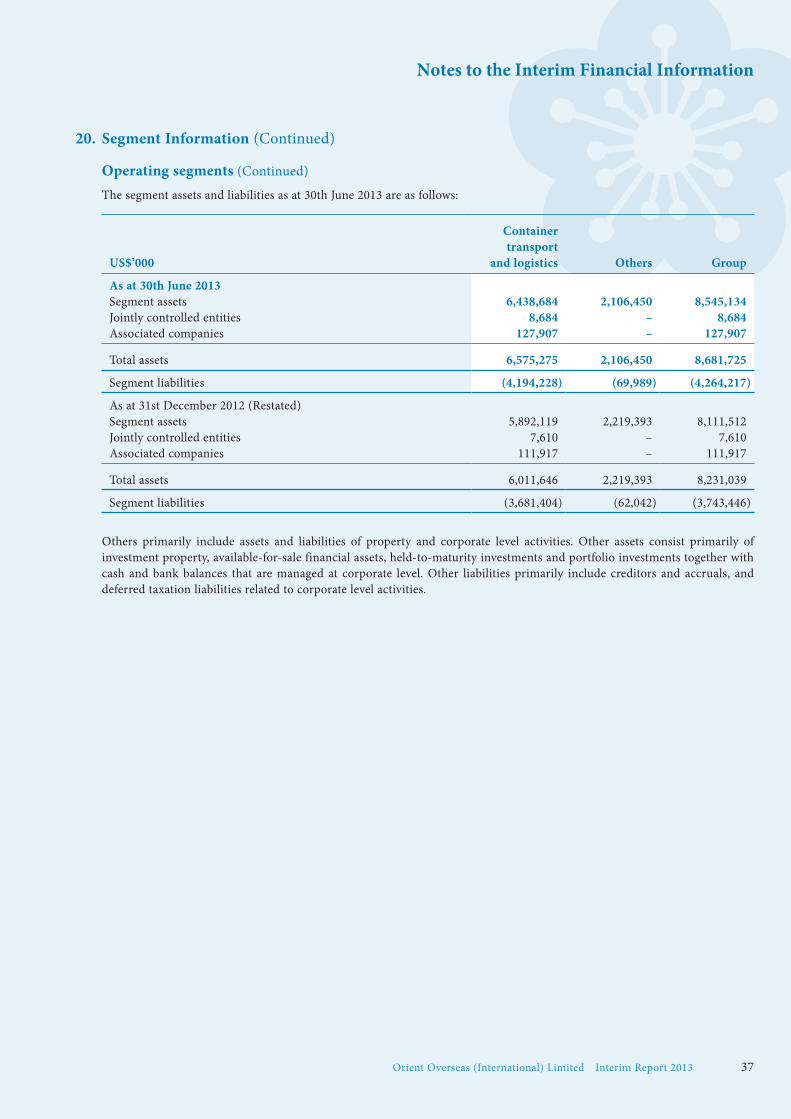
Orient Overseas (International) Limited Interim Report 2013 37
Notes to the Interim Financial Information
20. Segment Information (Continued)
Operating segments (Continued)
The segment assets and liabilities as at 30th June 2013 are as follows:
US$’000
Containertransport
and logistics
Others
Group
As at 30th June 2013Segment assets 6,438,684 2,106,450 8,545,134Jointly controlled entities 8,684 – 8,684Associated companies 127,907 – 127,907
Total assets 6,575,275 2,106,450 8,681,725
Segment liabilities (4,194,228) (69,989) (4,264,217)
As at 31st December 2012 (Restated)Segment assets 5,892,119 2,219,393 8,111,512Jointly controlled entities 7,610 – 7,610Associated companies 111,917 – 111,917
Total assets 6,011,646 2,219,393 8,231,039
Segment liabilities (3,681,404) (62,042) (3,743,446)
Others primarily include assets and liabilities of property and corporate level activities. Other assets consist primarily of investment property, available-for-sale financial assets, held-to-maturity investments and portfolio investments together with cash and bank balances that are managed at corporate level. Other liabilities primarily include creditors and accruals, and deferred taxation liabilities related to corporate level activities.
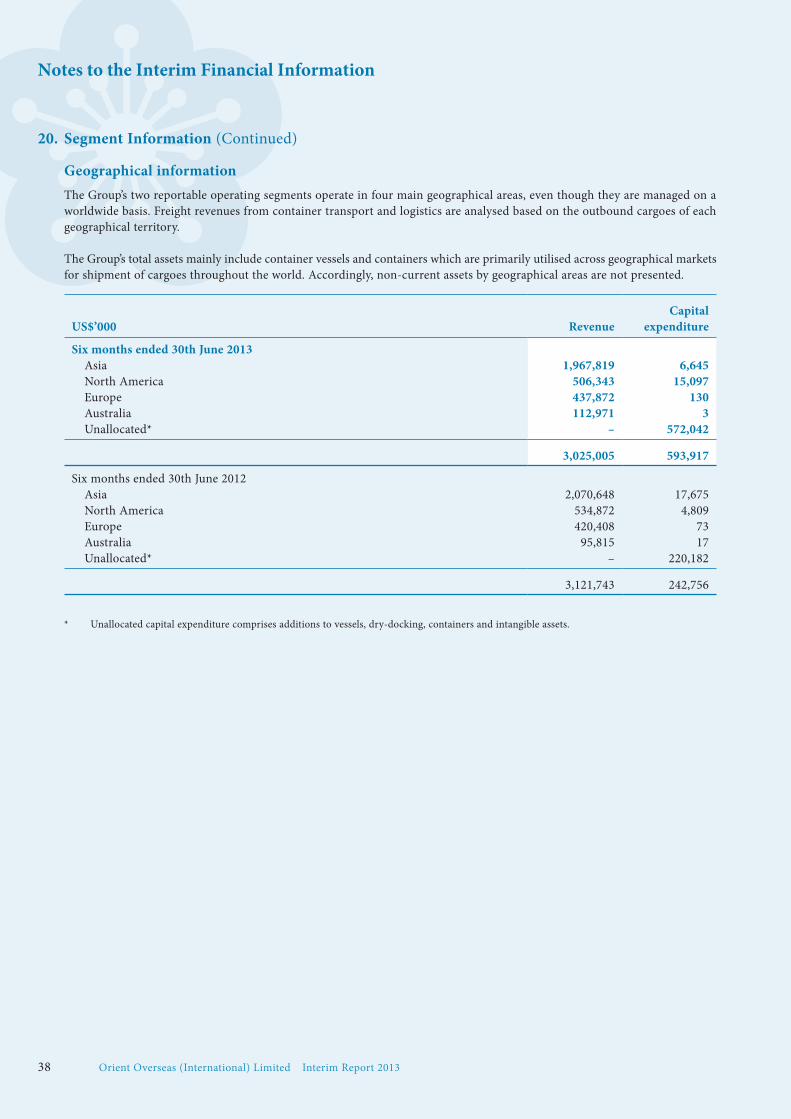
Orient Overseas (International) Limited Interim Report 201338
Notes to the Interim Financial Information
20. Segment Information (Continued)
Geographical informationThe Group’s two reportable operating segments operate in four main geographical areas, even though they are managed on a worldwide basis. Freight revenues from container transport and logistics are analysed based on the outbound cargoes of each geographical territory.
The Group’s total assets mainly include container vessels and containers which are primarily utilised across geographical markets for shipment of cargoes throughout the world. Accordingly, non-current assets by geographical areas are not presented.
US$’000 Revenue Capital
expenditure
Six months ended 30th June 2013 Asia 1,967,819 6,645 North America 506,343 15,097 Europe 437,872 130 Australia 112,971 3 Unallocated* – 572,042
3,025,005 593,917
Six months ended 30th June 2012 Asia 2,070,648 17,675 North America 534,872 4,809 Europe 420,408 73 Australia 95,815 17 Unallocated* – 220,182
3,121,743 242,756
* Unallocated capital expenditure comprises additions to vessels, dry-docking, containers and intangible assets.