organizing data 10-1 warm up warm up lesson presentation lesson presentation problem of the day...
TRANSCRIPT

Organizing Data10-1
Warm UpWarm Up
Lesson PresentationLesson Presentation
Problem of the DayProblem of the Day
Lesson QuizzesLesson Quizzes

Organizing Data10-1
Warm UpCompare. Write < or >.
1. 3(6) 15
2. 53 – 37 19
3. 27 2(14)
4. 49 – (–4) 51
<
>
<
>

Organizing Data10-1
Problem of the Day
If today is Wednesday, what day of the week will it be in 100 days?Friday

Organizing Data10-1
Prep for MA.8.S.3.1 …Organize and construct appropriate data displays…to convey information and make conjectures about possible relationships.Review MA.7.S.6.2
Sunshine State Standards

Organizing Data10-1
Vocabulary
line plot
stem-and-leaf plot
back-to-back stem-and-leaf plot
Venn diagram
Organizing Data10-1
Organizing raw data can help you see patterns and trends. One way to organize data is to use a line plot. A line plot uses a number line to show how often a value occurs in a data set.

Organizing Data10-1
Additional Example 1: Organizing Data in Line Plots
Use a line plot to organize the math exam scores.
Find the least value, 50, and the greatest value, 100, in the data set. Then draw a number line from 50 to 100. Place an “x” above each number on the number line for each time it appears in the data set.
Student Test Scores
100 95 75 80
60 100 60 75
90 85 80 100
50 90 65 80

Organizing Data10-1
Additional Example 1 Continued
Use a line plot to organize the math exam scores.
There are 16 numbers in the data set and 16 x’s above the number line.
Student Test Scores
100 95 75 80
60 100 60 75
90 85 80 100
50 90 65 80
50 55 60 65 70 75 80 85 90 95 100
xxx x x
xx
xxx
xx x
xxx

Organizing Data10-1
Check It Out: Example 1
Use a line plot to organize the feet of snow each season.
Find the least value, 1, and the greatest value, 11, in the data set. Then draw a number line from 1 to 11. Place an “x” above each number on the number line for each time it appears in the data set.
Feet of Snow
4 11 7 5
1 9 5 10
7 4 3 9
11 10 7 6
5 9 10 11

Organizing Data10-1
Check It Out: Example 1 Continued
There are 20 numbers in the data set and 20 x’s above the number line.
1 2 3 4 5 6 7 8 9 10 11
x xxx
xxx
xxx x
xxxx
xx
xxx
Feet of Snow
4 11 7 5
1 9 5 9
7 4 3 9
11 10 7 6
5 9 10 11
Use a line plot to organize the feet of snow each season.

Organizing Data10-1
A stem-and-leaf plot is a graph used to organize and display data to compare frequencies. Each leaf on the plot represents the right-hand digit in a data value. Each stem represents the remaining left-hand digits.
Stem = first digit(s)
Leaf = last digit
2 5 = 25
Organizing Data10-1
Additional Example 2: Reading Stem-and-Leaf Plots
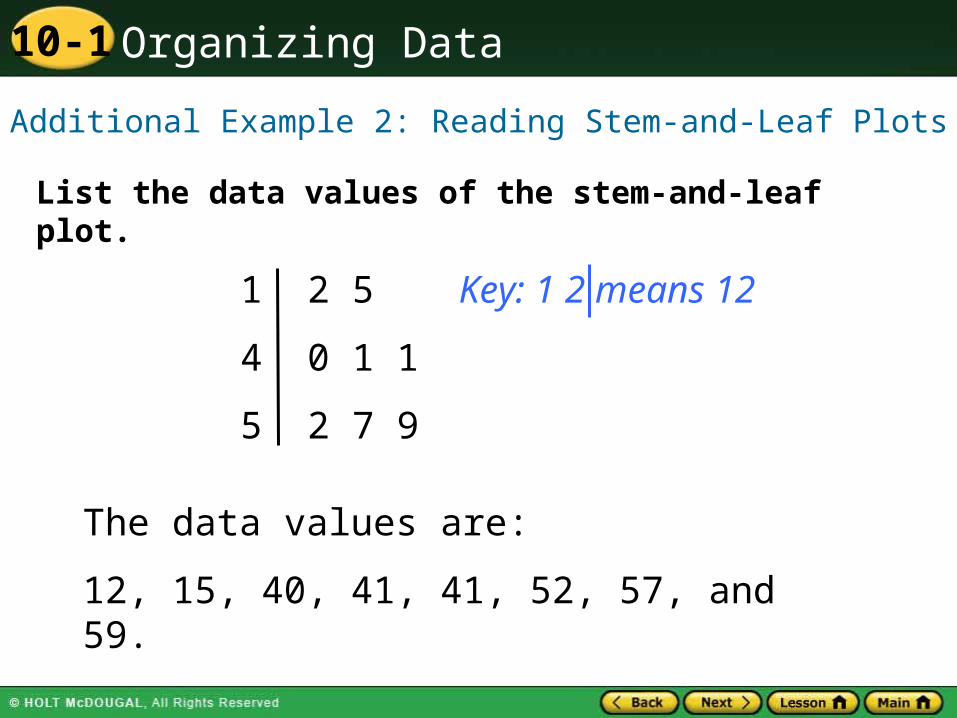
List the data values of the stem-and-leaf plot.
1 2 5
4 0 1 1
5 2 7 9
Key: 1 2 means 12
The data values are:
12, 15, 40, 41, 41, 52, 57, and 59.

Organizing Data10-1
Check It Out: Example 2
List the data values of the stem-and-leaf plot.
2 3 6
3 7 8 9
4 2 5 6
Key: 2 3 means 23
The data values are:
23, 26, 37, 38, 39, 42, 45, and 46.

Organizing Data10-1
A back-to-back stem-and-leaf plot can be used to compare two sets of data. The stems are in the center, and the left leaves are read in reverse.

Organizing Data10-1Additional Example 3: Organizing Data in Back-to-
Back Stem-and-Leaf PlotsUse the given data to make a back-to-back stem-and-leaf plot.
1 2 3 4
200019500 5 9 9 8 4
5 1 3
Key: | 2 | 9 means 29 8 | 1 | means 18
9

Organizing Data10-1
Check It Out: Example 3
Use the given data to make a back-to-back stem-and-leaf plot.
0 8
1 0 2 6 6
2 3 4
Voting Statistics
Age VotedDid not
Vote
Millions Millions
18 to 24 years 8 18
25 to 34 years 16 21
35 to 44 years 24 20
45 to 54 years 23 14
55 to 64 years 16 8
65 to 74 years 12 5
75 years up 10 5
Did not Vote Voted8 5 5
8 4
1 0
Key: | 0 | 8 means 8 4 | 1 | means 14

Organizing Data10-1
Venn Diagrams are used to show relationships between sets.

Organizing Data10-1
Additional Example 4: Organizing Data in Venn Diagrams
Make a Venn diagram to show how many 8th grade students play soccer.
Survey Results
Grade Sport Grade Sport
6 Baseball 8 Tennis
6 Tennis 7 Soccer
8 Soccer 7 Baseball
8 Baseball 6 Soccer
7 Soccer 8 Soccer

Organizing Data10-1
Additional Example 4 Continued
Make a Venn diagram to show how many 8th grade students play soccer.
Draw two circles. Label one circle “8th Graders” and the other circle “Soccer Players”. The region that overlaps represents both 8th Graders and Soccer Players.
2 3 SoccerPlayers
8th Graders 2
3

Organizing Data10-1
Check It Out: Example 4
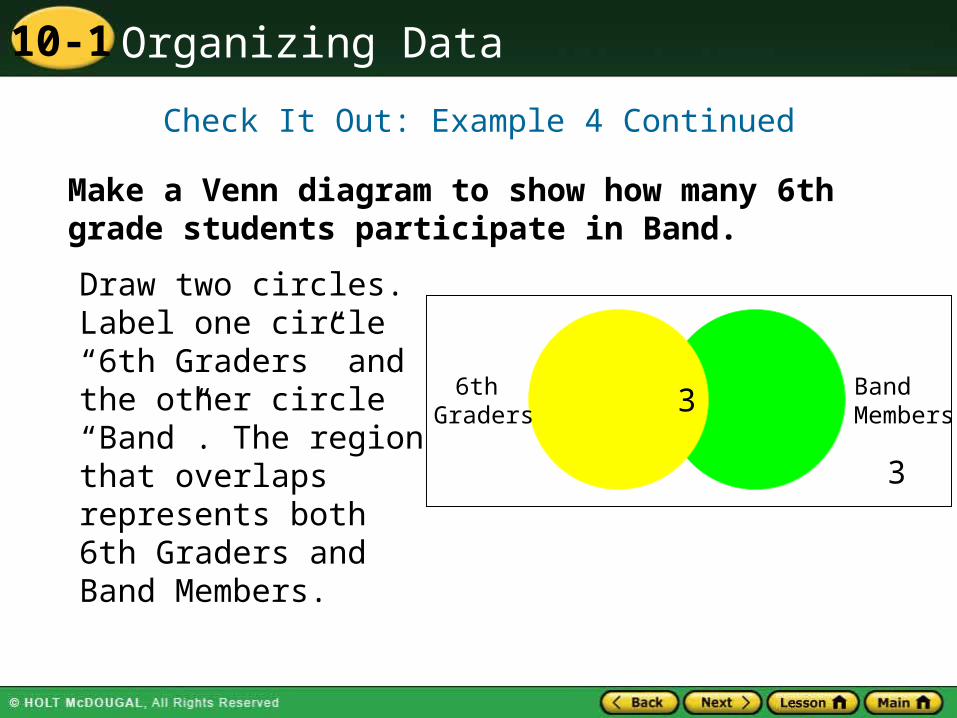
Make a Venn diagram to show how many 6th grade students participate in Band.
Survey Results
Grade Activity Grade Activity
6 Band 8 Art
6 Art 6 Band
8 Band 7 Band
6 Math Club 6 Band
7 Art 8 Math Club
Organizing Data10-1
Check It Out: Example 4 Continued
Draw two circles. Label one circle “6th Graders” and the other circle “Band”. The region that overlaps represents both 6th Graders and Band Members.
2 2
Make a Venn diagram to show how many 6th grade students participate in Band.
Band Members
6th Graders 3
3

Organizing Data10-1
Standard Lesson Quiz
Lesson Quizzes
Lesson Quiz for Student Response Systems

Organizing Data10-1
Lesson Quiz: Part I
1. Use a line plot to organize the data of daily rainfall during the month of June.
Inches of Rainfall During June
0 3 4 1 0 0 0 1 0 5
2 1 0 0 0 0 3 3 0 1
1 1 0 0 4 4 5 2 1 1
0 1 2 3 4 5
xxxxxxxxxxxx
xxxxxxxx
xx
xxx
xxx
xx

Organizing Data10-1
Lesson Quiz: Part II
2. List the data values in the stem-and-leaf plot.
0 6 9
1 4 7
2 2 5
Key: 1 5 means 15
6, 9, 14, 17, 22, 25

Organizing Data10-1
Lesson Quiz: Part III
3. Make a Venn diagram to show how many voters under age 30 responded to the survey.
Survey Results
Age Registered to Vote
Age Registered to Vote
18 yes 55 yes
20 no 31 no
47 no 43 no
62 yes 25 yes
29 yes 19 no

Organizing Data10-1
1. Identify a line plot to organize the data of the weights of students in a class.
A.
B.
Lesson Quiz for Student Response Systems

Organizing Data10-1
2. Identify the list of data values in the stem and leaf plot.
A. 40, 90, 12, 22, 52, 62, 83, 13, 33
B. 4, 9, 21, 22, 25, 26, 31, 33, 33
C. 4, 9, 21, 21, 31, 33, 52, 62, 83
D. 1, 1, 2, 3, 4, 5, 6, 8, 9
Lesson Quiz for Student Response Systems

Organizing Data10-1
3. Identify a Venn diagram to show how many students in the sixth grade belong to both cultural and sports team.
A. B.
Lesson Quiz for Student Response Systems