organic purchasing trends in the current climate lorcan bourke bord bia & chair of the daff...
Post on 19-Dec-2015
214 views
TRANSCRIPT

Organic Purchasing Trends in the Current Climate
Lorcan Bourke Bord Bia & Chair of the DAFF Organic Market Development Group

Introduction – ‘The Current Climate’
Consumer Sentiment

Background – Food Price Deflation
December 2007 = €178-1.7%!
How much did it cost last year?
What about December 2006?
December 2006 = €161+10.5%!
A basket of 85 commonly bought SKU’s costs €175 today

Vs.
1. Differential cost comparison of a basket of groceries products in ROI vs. NI 2. Consumers shopping North of border/UK
Background - Sterling Exchange Rate

In RoI shoppers are now shopping around more for the offers and visiting on average 2.8 multiples in a 4 weekly period
2.5
2.5
2.4 2.4 2.42.5 2.4
2.5 2.5 2.52.5 2.5 2.5 2.6
2.6 2.6 2.62.6
2.8
4 W/e17
Jun07
4 W/e15Jul07
4 W/e12
Aug07
4 W/e09
Sep07
4 W/e07Oct07
4 W/e04
Nov07
4 W/e02
Dec07
4 W/e24
Feb08
4 W/e23
Mar08
4 W/e20Apr08
4 W/e18
May08
4 W/e15
Jun08
4 W/e13Jul08
4 W/e10
Aug08
4 W/e07
Sep08
4 W/e05Oct08
4 W/e02
Nov08
4 W/e30
Nov08
4 W/e28
Dec08
Shopping around more
Source: TNS Worldpanel, 52 w/e 28th December 08
No of stores visited for multiples
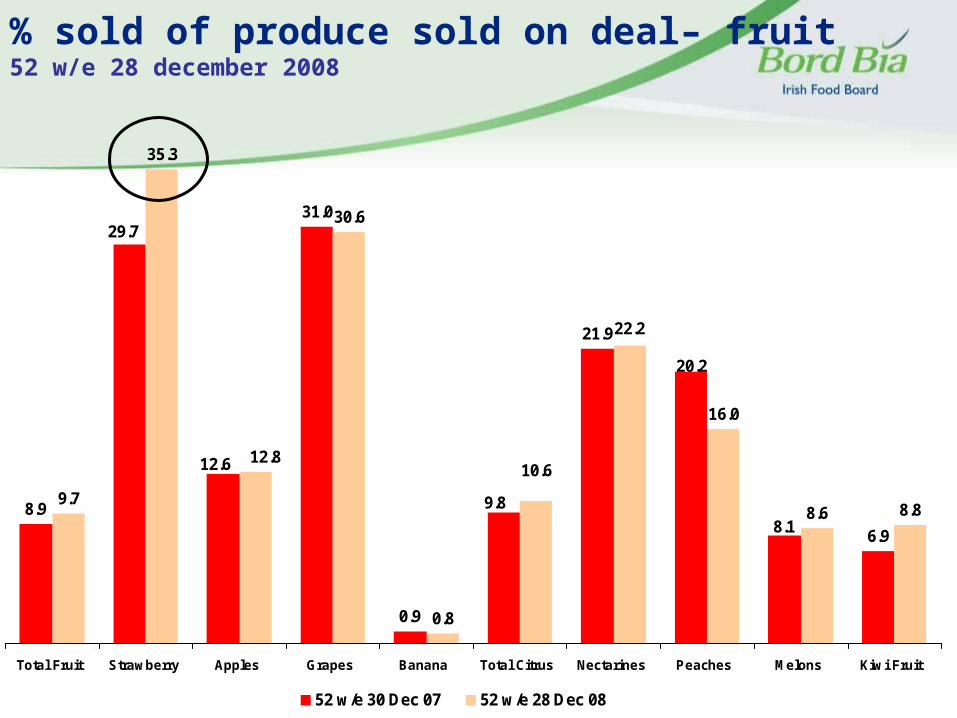
% sold of produce sold on deal– fruit52 w/e 28 december 2008
8.9
31.0
0.9
21.9
6.9
9.7
35.3
30.6
0.8
16.0
8.6 8.8
12.6
29.7
9.8
20.2
8.1
12.810.6
22.2
Total Fruit Strawberry Apples Grapes Banana Total Citrus Nectarines Peaches Melons Kiwi Fruit
52 w/e 30 Dec 07 52 w/e 28 Dec 08

Discounters Increase Market Share of Grocery
14.3 14.6
18.3
Discounters
% change year on year % Change 12 weekly% Change 4 weekly
different retailer?
Trade Down retailer?
Source: TNS Worldpanel, w/e 28th December
08
Growth has happened for the discounters through a combination of HH increased spend in- store and HH switching from other stores
Conclusions on ‘Current Climate’
• The unstable economic conditions has transformed consumers ‘mindset’ and retailers have responded
• We are currently experiencing the most price aggressive mainstream retail environment we have seen for many years (with a knock-on for all suppliers)
• Consumer sentiment is nervous and people are seeking to spend what money they have more wisely i.e. being ‘smarter’ about their purchases
• Any products consumers are paying a ‘premium’ for – the premium must be rationalised / justified and defensible in their minds
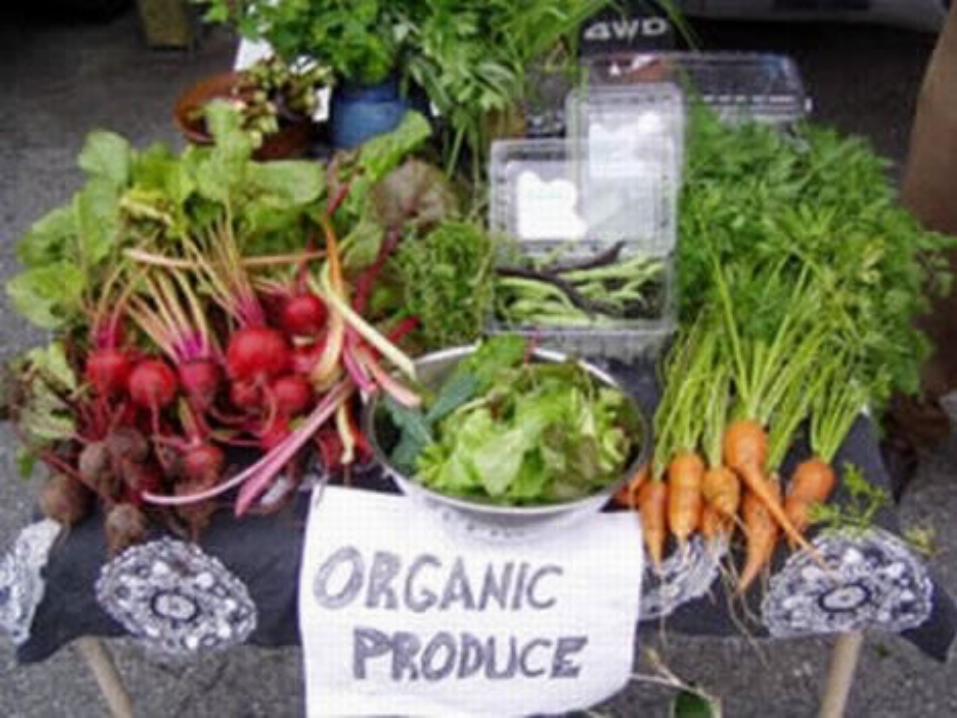
Overview of organic produce
0
10
20
30
40
50
60
70
80
90
1001998
1999
2000
2001
2002
2003
2004
2005
2006
2007
2008
2009
£m’s
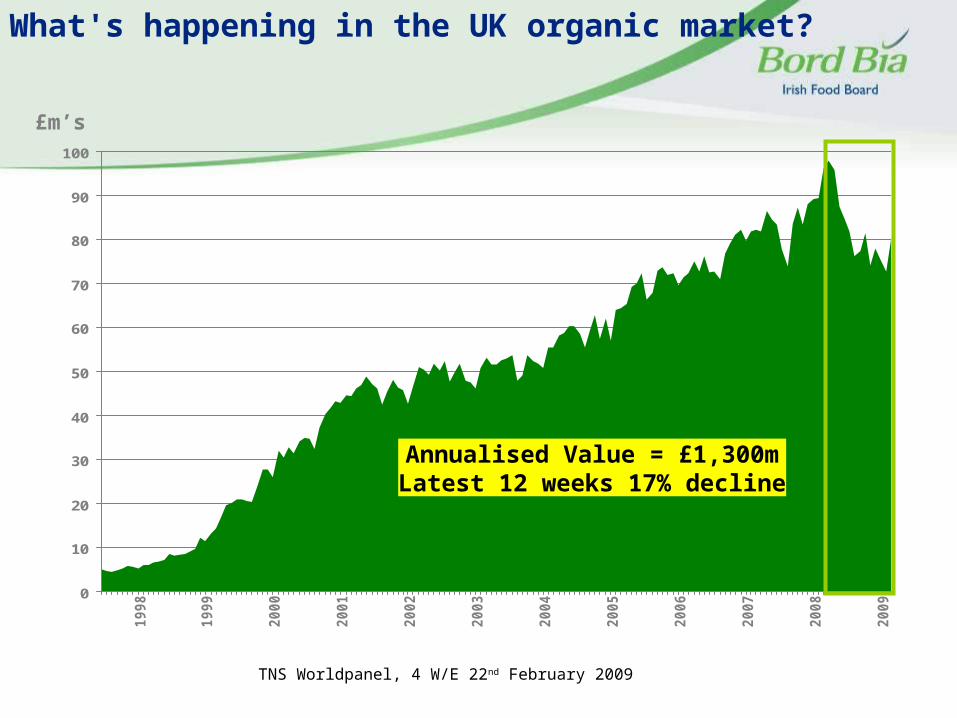
What's happening in the UK organic market?
Annualised Value = £1,300mLatest 12 weeks 17% decline
TNS Worldpanel, 4 W/E 22nd February 2009

Fruit and Vegetables account for 44% of total organic volume sold in the UK
-60
-50
-40
-30
-20
-10
0
10
20
30
Sw
ee
t H
om
eC
oo
kin
g
Ric
e/N
oo
dle
s/P
as
ta
Oil/
Flo
ur/
Am
bie
nt
Sa
uc
es
/Vin
eg
ar
Pa
ck
et
Bre
ak
fas
t
Fre
sh
Po
ult
ry+
Ga
me
Alc
oh
ol
Da
iry
Pro
du
cts
Ca
nn
ed
Go
od
s
Fre
sh
Me
at
Ta
ke
Ho
me
So
ftD
rin
ks
Ho
t B
ev
era
ge
s
To
tal O
rga
nic
Fru
it+
Ve
g+
Sa
lad
s
Bis
cu
its
Ch
ille
dC
on
ve
nie
nc
e
Bre
ad
& M
orn
ing
go
od
s
% c
han
ge
in O
rgan
ic v
olu
me
(pac
ks)
52 w/e % change 12 w/e % change
TNS Worldpanel, 52 % 12 W/E 22nd February 2009

So what's happening in Ireland - Total organic market size
95156.9
120689.5
16151.825394.9 28222.7
0
20000
40000
60000
80000
100000
120000
140000
52 w/e 27 Jan 08 52 w/e 25 Jan 09 12 w/e 28 Jan 07 12 w/e 27 Jan 08 12 w/e 25 Jan 09
Organic
+26.8%
+57.2% +11.1%
000’s euros
annually there is strong growth in the organic market however in the short term growth has slowed down

Which markets are driving the growth of organic YoY? The top 6 organic markets
24.5
6.2
43.8
1113.8
18
05
101520253035404550
Fru
it+
Ve
g+
Sa
lad
s
Fre
sh
Me
at
Bis
cu
its
To
tal M
ilk
Bre
ak
fas
tC
ere
als
Yo
gh
urt
s
% Chg Yoy

Organic fresh produce

Organic market for fresh produce is worth €48 million and growing by
31.9% - organic is 4% of total F&V
Penetration is high at 82% of the population +10.6% YoY
Shoppers are buying the organics sector more often 13 times a year up from 11
Each HH spends on average €38 euros on organic per annum +€4.40

Fresh Produce: organic spilt of the total marketthe discounters are the number 2 retailer in termsof organics - YoY direct sales are increasing
25.8
14.9
9.8
16.4
19.2
3
1.2 0.9
25.6
13.5
8.8
12.8
17.9
4.7
1.7
5.6
Tesco Dunnes Super quinn Super valu TotalDiscounters
OtherMultiples
Green grocer Roadsidestalls
30-Dec-07 28-Dec-08

2.6
3.8
4.5
3 333.2
2.7
Total Fruit & Veg Total Vegetables Potatoes Total Fruit
52 w/e 30 Dec 0752 w/e 28 Dec 08
Which segment of the produce market is driving organic sales?Vegetables is the key sector and up YoY
Key lines in growth are:
Leeks, turnips, swedes,
cumcumber, spinach and
carrots

Total Organic Fresh Produce market sales (quarterly)
6970.47344.4
8325.1 8398.8
9387.59841
11221.211742.4
11432.2
2447.18 2497.08 2624.86 2620.953001.57 3151.64
3481.483877.25 4050.94
0
2000
4000
6000
8000
10000
12000
14000
12 w/e 31Dec 06
12 w/e 25Mar 07
12 w/e 17Jun 07
12 w/e 07Oct 07
12 w/e 30Dec 07
12 w/e 23Mar 08
12 w/e 15Jun 08
12 w/e 05Oct 08
12 w/e 28Dec 08
000's EUROS Volume/000s
+35%
+22%
In the latest quarter value has declined slightly through lower prices. Volume continues to increase quarterly.

Organic vs. Non Organic - Meat

Total Market - Total Meat - Organic Value up 21.7% worth €1833k52 w/e 27
Jan 0852 w/e 25
Jan 09Actual
Change% Change
Expenditure (€000s) 8459 10292 1833 21.7Volume (000s Kgs) 1097 1135 38 3.5Penetration % 23.49 21.44 -2.05 -8.7Purchase Frequency 4.06 4.63 0.56 13.9AWP (Spend per Buyer) 24.21 31.48 7.26 30.0AWP (Kgs per Buyer) 3.14 3.47 0.33 10.6Trip Spend 5.96 6.80 0.84 14.1Trip Volume (Kgs) 0.77 0.75 -0.02 -2.9Price per Kg 7.71 9.07 1.36 17.6
* Penetration contribution includes Population growth of 2.6%
Contribution = €1471k
Contribution = €910k Contribution = -€548k
1135k Kgs +3.5%Contribution = €362k
Penetration % *
€9.07 +17.6%
21.4% -8.7%AWP (Kgs per Buyer)
3.5 Kgs +10.6%
Price per Kg
Expenditure (€000s)€10.3m +21.7%
Increase of €1833k
Volume (000s Kgs)
4.6 trips +13.9%Trip Volume (Kgs)
0.7 Kgs -2.9%Contribution = €1161k
Purchase Frequency
Contribution = -€251k
-1000 -500 0 500 1000 1500 2000 2500 3000
Penetration % Purchase Frequency
Trip Volume (Kgs) Price per Kg
Organic meat is in strong growth of 22% but 18% of the growth is from price increases – as the price increases less
HH are purchasing
Poultry and lamb is the only
sector where organic is growing

Organic spilt by meat typethe growth of organic is from the poultry sector
0.7
1.1
0.7 0.7
1.2
1.1
0.9
1.3
1.1
0.8
Total Meat Total Beef Total Lamb Sausages Total Poultry
52 W/e 27 Jan 08 52 W/e 25 Jan 09
Poultry and lamb are the only segments where organic is growing

Price differential between organic and non-organic
€12.86
€6.25
€8.98
€6.07
€8.95
€6.07
Total Beef Total Poultry
Total Market Non Organic Organic
Organic Performance Eggs
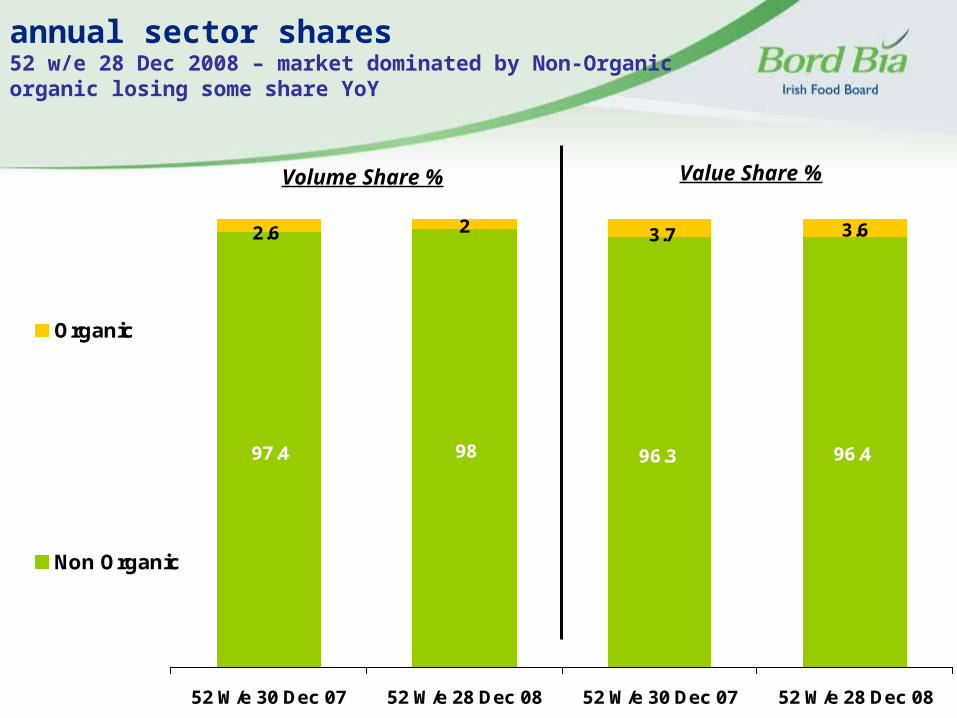
annual sector shares 52 w/e 28 Dec 2008 – market dominated by Non-Organic organic losing some share YoY
96.496.39897.4
2.6 2 3.7 3.6
52 W/e 30 Dec 07 52 W/e 28 Dec 08 52 W/e 30 Dec 07 52 W/e 28 Dec 08
Organic
Non Organic
Volume Share % Value Share %

Organic eggs vs. non organic : annual key diagnostics 52 w/e 28 Dec 2008 – penetration for organic eggs is still very niche – they are double the
price of non-organic
11.0
92.293.1
9.5
94.995.5
Total Eggs Non Organic Organic
52 w/e 30 Dec 07
52 w/e 28 Dec 08
209.8 206.4
45.4 44.8
216219.1
Total Eggs Non Organic Organic
52 W/e 30 Dec 07
52 W/e 28 Dec 08
22 21.5
6 6.6
22.823.3
Total Eggs Non Organic Organic
52 W/e 30 Dec 0752 W/e 28 Dec 08
€0.2
€0.3
€0.2
€0.4
€0.2€0.3
Total Eggs Non Organic Organic
52 W/e 30 Dec 0752 W/e 28 Dec 08
% PenetrationVolume per Buyer (Units)
Price per eggFrequency of Purchase

Is sales of organic food in Ireland recession proof & WHY ???

28
Irish Consumer Research on ‘Response to the Recession’
Methodology• In order to better understand consumer spending plans for the year ahead, TNS mrbi
asked a national sample of adults the following question for a list of core spending categories -
• Interviewing was conducted via PhoneBus®, TNS mrbi’s telephone omnibus, which interviews a sample of 1,000 adults aged 15+ years.
• Respondents are selected using RDD (Random Digit Dialling), thereby ensuring that unlisted households are as likely to be contacted for the interview as listed households.
• A combination of quota controls and weighting is used to ensure the PhoneBus® sample is representative of the national population in terms of gender, age, social class and region.
• Fieldwork for the data presented in this report took place between 10th March – 19th March 2009, during which time 1,016 interviews were successfully completed.
Q. In the year ahead, will you spend less or at least as much on…… ?

75%
72%
68%
66%
65%
63%
62%
56%
54%
49%
49%
49%
48%
47%
46%
45%
42%
34%
25%
28%
32%
34%
35%
37%
38%
44%
46%
51%
51%
51%
52%
53%
54%
55%
58%
66%On buying electrical items for the house
On cigarettes or other tobacoo products
On doing up your house e.g. painting, new furniture
On holidays/short breaks abroad
On going out for a drink
On eating lunch out of home
On going out for an evening meal
On concerts
On holidays/short breaks in Ireland
On renting DVDs
On going to sporting events
On going to the cinema
On cosmetics like make-up, aftershave, perfume etc.
On newspapers or magazines
On organic food
On your mobile phone
On groceries for the household
On entertaining at home
Consumer Spend Plans For 2009
+5
+6
+4
=
+2
+5
+2
+7
+4
= *
+3
+2
+4
-1
+5 *
+5
+9
+5
Will spend at least as much Will spend less
Spend Less % Change Vs. Jan ‘09
* New categories added in Feb ’09. Change Vs. Feb ’09.

Organic Bucks the Trend – Reasons
• People are saying that they are going to spend less on groceries, however no such decline appears (yet !) to exist in terms of Organic spend.
WHY ?
Will it remain so ???

Attitudes – Who Buys Organic Food?
Adult (18+) Grocery Shoppers
100%
(2.00m)
Current Organic Buyers
52%
(1.04m)
Non-Buyers of Organic
48%
(0.96m)
Evolving
Considerers
9%
(0.17m)
Rejectors
39%
(0.78m)
Organic
Believers
17%
(0.35m)
Health
Managers /
Status
Seekers
28%
(0.55m)
Core Buyers - Purchased
Organic in the Past Month
Aspirational
Improvers
7%
(0.14m)
Peripheral Buyers
Purchased Organic in
Past 3–6 Months

2333
4256
6514
19
25
2320
14
19
14
1410
30
2013
5 317
7 5 2 1
Behaviour – Are Consumers Ready To Pay A Price Premium For Organic?(n=1,000)
Definitely buy
Probably buy
Unsure
Probably not buy
Definitely not buy
• In the current economic climate, 47% of all consumers would ‘definitely’ or ‘probably’ buy if a 10% premium is charged. At higher premiums, this interest drops off sharply.
• However, among the core organic buying segment* – those who have purchased organic in the last 1 month (45% of respondents) – the outlook is healthier as 73% are ‘definitely’ or ‘probably’ willing to pay up to a 10% premium.
10% 15% 20% 25% 30%
Extra Extra Extra Extra Extra
% % % % %
If you were considering buy organic food rather than non-organic food, how
likely or not would you be to buy organic if you had to pay …
* n = 577

Anecdotal – behaviour shifts
• Consumers staying in and treating themselves to premium products e.g. organic food

A Clear Message to Consumers???
Reasons to buy ……..