orc south carolina and nevada republican polls october 14 2015
DESCRIPTION
(CNN)Donald Trump holds double-digit leads over Ben Carson in both South Carolina and Nevada, the third and fourth states scheduled to hold nominating contests in next year's race for the presidency, with Trump widely seen in each state as the best candidate to handle a range of top issues, according to new CNN/ORC polls.Trump holds 38% support in Nevada, with Carson in second with 22%, and in South Carolina, Trump doubles Carson's support, 36% to 18%. No other candidate comes close to those top two in either state; the third-place candidate in each case has less than 10% support.Trump's backing in both states outpaces his support in most recent national polling, where he tends to draw around a quarter of Republican voters.In Nevada, where more than half of likely caucus participants say they have made up their mind or are leaning toward someone, Carly Fiorina takes third place with 8%, followed by Florida Sen. Marco Rubio with 7% and former Florida Gov. Jeb Bush with 6%. Texas Sen. Ted Cruz and former Arkansas Gov. Mike Huckabee are next at 4% each, with the remainder of the field at 2% or less.Trump's supporters in Nevada are more committed than others: Among those likely caucus-goers who say they have made up their minds or are leaning toward someone, 53% support Trump, 21% Carson, 7% Rubio and everyone else is at 5% or less. Those who say they are still trying to decide whom to support break 21% each for Carson and Trump, 12% for Fiorina, 10% for Bush, 9% for Huckabee and 6% for Rubio.Among all likely voters in South Carolina, Rubio takes third with 9%, followed by Fiorina at 7%, Bush at 6%, Cruz at 5% and the state's senior senator, Lindsey Graham, also at 5%. Kentucky Sen. Rand Paul follows at 4%, with Huckabee at 3% and the rest at 2% or less.Fewer South Carolina Republican voters say they have made up their minds about whom to support than among Nevada Republicans: 60% say they are still trying to decide, and the difference in candidate support between the two groups is not large enough to be significant.Trump's lead rests on widespread perceptions that he's the best candidate to handle the economy (67% say so in Nevada, 59% in South Carolina, while no other candidate hits double-digits) and illegal immigration (55% in Nevada and 51% in South Carolina, topping the other candidates by 40 points or more). About 6 in 10 in each state say Trump is the candidate most likely to change the way things work in Washington (60% in Nevada, 58% in South Carolina). Furthermore, nearly half -- 47% in Nevada and 44% in South Carolina -- view Trump as the candidate with the best chance of winning the general election next November.TRANSCRIPT

Nevada South Carolina
All interviews conducted by telephone by ORC International on October 3-10, 2015.
EMBARGOED FOR RELEASE:
Wednesday, October 14 at 1:00 p.m.

3
POLL -2- October 3-10, 2015
BASED ON INTERVIEWS WITH 285 REPUBLICAN LIKELY CAUCUS GOERS -- SAMPLING ERROR: +/- 6 PERCENTAGE PTS.
Nevada RP1. If the Republican presidential caucus in Nevada were held today, please tell me which of the
following people you would be most likely to support. Jeb Bush, Ben Carson, Chris Christie, Ted Cruz, Carly Fiorina, Jim Gilmore, Lindsey Graham, Mike Huckabee, Bobby Jindal, John Kasich, George Pataki, Rand Paul, Marco Rubio, Rick Santorum, Donald Trump (RANDOM ORDER)
Oct. 3-10 2015 Trump 38% Carson 22% Fiorina 8% Rubio 7% Bush 6% Cruz 4% Huckabee 4% Paul 2% Christie 1% Gilmore 1% Kasich 1% Pataki 1% Graham * Jindal * Santorum * Someone else (vol.) * None/ No one (vol.) 3% No opinion 3% RP2. Have you definitely decided who you will support in the Nevada Republican caucus, are you leaning
toward someone, or have you considered some candidates but are still trying to decide? Oct. 3-10 2015 Definitely decided 30% Leaning toward someone 23% Still trying to decide 47% No opinion *

3
POLL -3- October 3-10, 2015
RP3. Now I'm going to mention a few issues and for each one, please tell me which Republican candidate you think would best handle that issue if he or she were elected president. Please feel free to name a candidate even if you may not be voting for that person. Which Republican candidate do you think would do the best job handling: (RANDOM ORDER)
The economy Oct. 3-10 2015 Trump 67% Fiorina 7% Bush 6% Carson 6% Rubio 4% Paul 3% Cruz 2% Kasich 2% Christie 1% Graham 1% Huckabee 1% Gilmore * Jindal * Pataki * Santorum * Someone else (vol.) * None/No one (vol.) * No opinion 1% Illegal immigration Oct. 3-10 2015 Trump 55% Rubio 13% Carson 8% Cruz 6% Bush 5% Fiorina 3% Huckabee 3% Paul 2% Graham 1% Christie * Gilmore * Jindal * Kasich * Pataki * Santorum * Someone else (vol.) 1% None/No one (vol.) 1% No opinion 3%
Foreign policy Oct. 3-10 2015 Trump 34% Rubio 13% Bush 12% Carson 11% Fiorina 7% Cruz 6% Paul 5% Huckabee 3% Christie 2% Graham 2% Santorum 1% Gilmore * Jindal * Kasich * Pataki * Someone else (vol.) 1% None/No one (vol.) 1% No opinion 2% Social issues, such as abortion and same-sex
marriage Oct. 3-10 2015 Trump 25% Carson 23% Fiorina 9% Bush 8% Rubio 7% Huckabee 5% Cruz 4% Paul 4% Christie 1% Graham 1% Jindal 1% Kasich 1% Gilmore * Pataki * Santorum * Someone else (vol.) 2% None/No one (vol.) 2% No opinion 6%

3
POLL -4- October 3-10, 2015
RP3. Now I'm going to mention a few issues and for each one, please tell me which Republican candidate
you think would best handle that issue if he or she were elected president. Please feel free to name a candidate even if you may not be voting for that person. Which Republican candidate do you think would do the best job handling: (RANDOM ORDER)
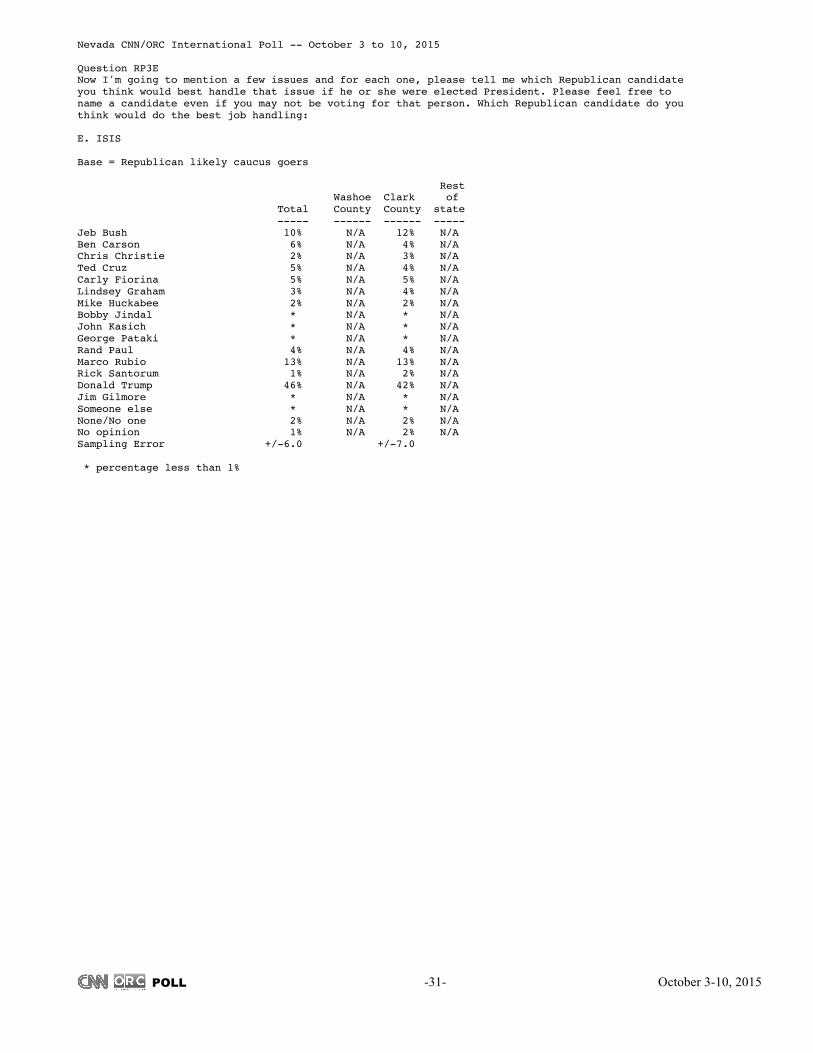
ISIS Oct. 3-10 2015 Trump 46% Rubio 13% Bush 10% Carson 6% Cruz 5% Fiorina 5% Paul 4% Graham 3% Christie 2% Huckabee 2% Santorum 1% Gilmore * Jindal * Kasich * Pataki * Someone else (vol.) * None/No one (vol.) 2% No opinion 1%

3
POLL -5- October 3-10, 2015
RP4. Now I’m going to read you a few phrases which describe the candidates, and for each one, tell me which Republican candidate you think that phrase best describes, regardless of who you are voting for. Which Republican candidate do you think: (RANDOM ORDER)
Best represents the values of Republicans like yourself Oct. 3-10 2015 Trump 34% Carson 19% Cruz 10% Rubio 9% Bush 7% Fiorina 7% Huckabee 4% Paul 4% Christie 2% Graham 1% Kasich 1% Gilmore * Jindal * Pataki * Santorum * Someone else (vol.) * None/No one (vol.) * No opinion 2% Has the best chance of winning in the general election next November Oct. 3-10 2015 Trump 47% Carson 16% Rubio 10% Bush 7% Cruz 5% Fiorina 3% Huckabee 2% Paul 2% Christie 1% Jindal 1% Gilmore * Graham * Kasich * Pataki * Santorum * Someone else (vol.) 1% None/No one (vol.) * No opinion 4%
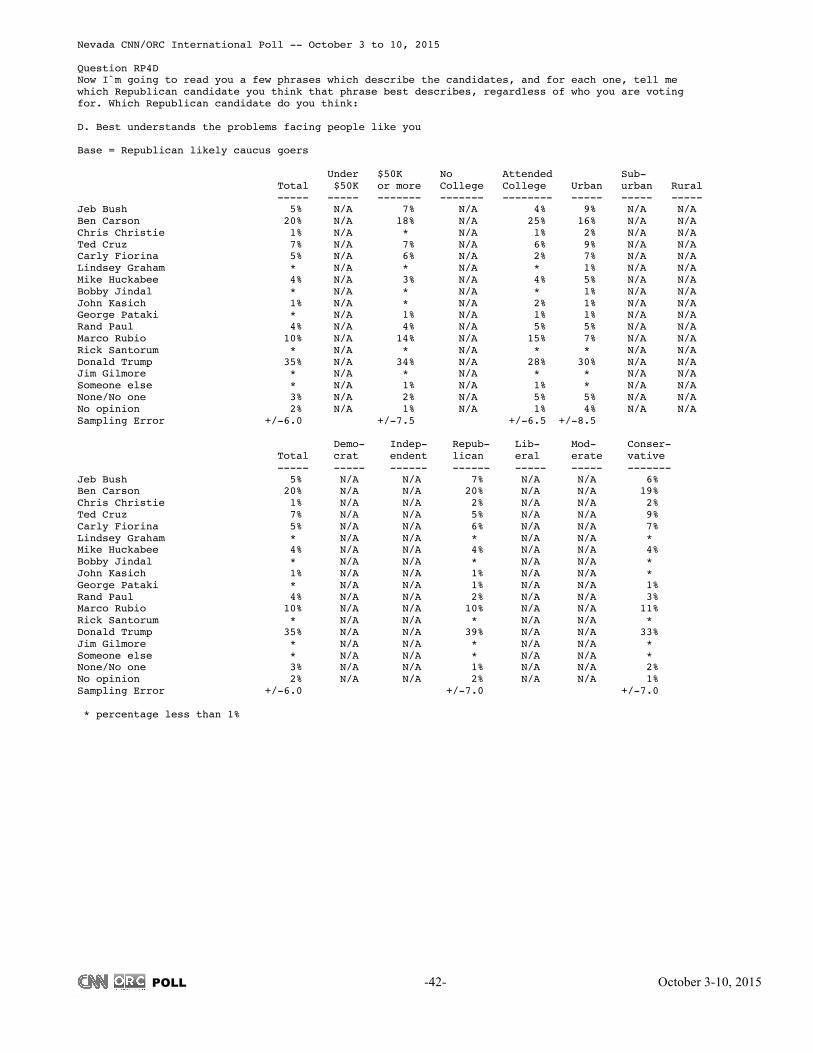
Is most likely to change the way things work in Washington Oct. 3-10 2015 Trump 60% Carson 10% Cruz 5% Fiorina 4% Rubio 4% Bush 3% Paul 3% Christie 1% Gilmore 1% Huckabee 1% Graham * Jindal * Kasich * Pataki * Santorum * Someone else (vol.) 1% None/No one (vol.) 5% No opinion 3% Best understands the problems facing people like you Oct. 3-10 2015 Trump 35% Carson 20% Rubio 10% Cruz 7% Bush 5% Fiorina 5% Huckabee 4% Paul 4% Christie 1% Kasich 1% Gilmore * Graham * Jindal * Pataki * Santorum * Someone else (vol.) * None/No one (vol.) 3% No opinion 2%

3
POLL -6- October 3-10, 2015
5. Which of the following issues will be MOST important to you when you decide how to vote for
president? (RANDOM ORDER) BASED ON INTERVIEWS WITH 1,011 ADULT NEVADANS -- SAMPLING ERROR: +/- 3 PERCENTAGE PTS.
Oct. 3-10 2015 The economy 39% Health care 13% Social issues, such as abortion and same-sex marriage 13% Illegal immigration 11% Terrorism 11% Foreign policy 7% Other (vol.) 3% No opinion 3% BASED ON INTERVIEWS WITH 285 REPUBLICAN LIKELY CAUCUS GOERS -- SAMPLING ERROR: +/- 6 PERCENTAGE PTS. Oct. 3-10 2015 The economy 39% Terrorism 22% Illegal immigration 14% Foreign policy 12% Social issues, such as abortion and same-sex marriage 8% Health care 3% Other (vol.) 1% No opinion 1%

POLL -7- October 3-10, 2015
3
BASED ON INTERVIEWS WITH 521 REPUBLICAN LIKELY VOTERS -- SAMPLING ERROR: +/- 4.5 PERCENTAGE PTS.
South Carolina RP1. If the Republican presidential primary in South Carolina were held today, please tell me which of the
following people you would be most likely to support. Jeb Bush, Ben Carson, Chris Christie, Ted Cruz, Carly Fiorina, Jim Gilmore, Lindsey Graham, Mike Huckabee, Bobby Jindal, John Kasich, George Pataki, Rand Paul, Marco Rubio, Rick Santorum, Donald Trump (RANDOM ORDER)
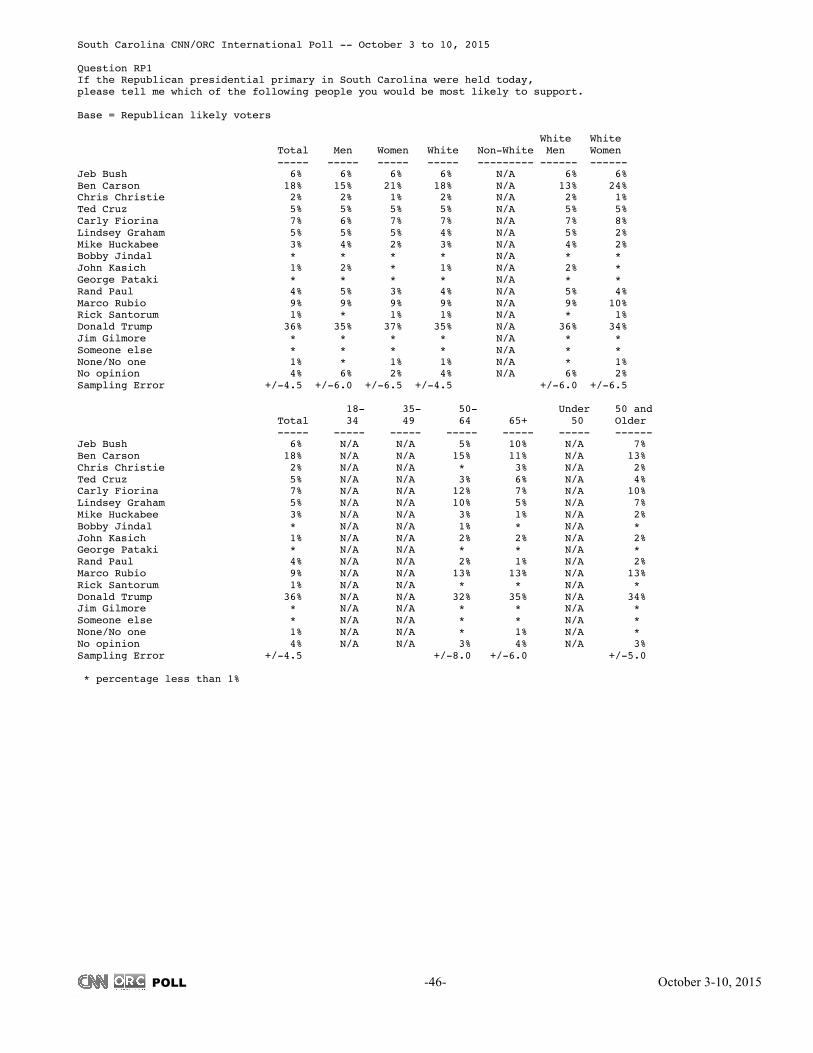
Oct. 3-10 2015 Trump 36% Carson 18% Rubio 9% Fiorina 7% Bush 6% Cruz 5% Graham 5% Paul 4% Huckabee 3% Christie 2% Kasich 1% Santorum 1% Gilmore * Jindal * Pataki * Someone else (vol.) * None/No one (vol.) 1% No opinion 4% RP2. Have you definitely decided who you will support in the South Carolina Republican primary, are you
leaning toward someone, or have you considered some candidates but are still trying to decide? Oct. 3-10 2015 Definitely decided 19% Leaning toward someone 21% Still trying to decide 60% No opinion *

POLL -8- October 3-10, 2015
3
RP3. Now I'm going to mention a few issues and for each one, please tell me which Republican candidate you think would best handle that issue if he or she were elected president. Please feel free to name a candidate even if you may not be voting for that person. Which Republican candidate do you think would do the best job handling: (RANDOM ORDER)
The economy Oct. 3-10 2015 Trump 59% Bush 7% Carson 7% Fiorina 6% Paul 5% Cruz 3% Graham 3% Rubio 3% Christie 1% Kasich 1% Gilmore * Huckabee * Jindal * Pataki * Santorum * Someone else (vol.) * None/No one (vol.) 1% No opinion 3% Illegal immigration Oct. 3-10 2015 Trump 51% Rubio 11% Bush 8% Carson 7% Cruz 7% Graham 3% Paul 3% Christie 2% Fiorina 1% Gilmore * Huckabee * Jindal * Kasich * Pataki * Santorum * Someone else (vol.) 1% None/No one (vol.) 2% No opinion 4%
Foreign policy Oct. 3-10 2015 Trump 27% Bush 14% Rubio 13% Graham 10% Carson 9% Paul 6% Cruz 5% Fiorina 5% Christie 2% Gilmore 1% Huckabee 1% Jindal * Kasich * Pataki * Santorum * Someone else (vol.) 1% None/No one (vol.) 2% No opinion 6% Social issues, such as abortion and same-sex
marriage Oct. 3-10 2015 Carson 26% Trump 22% Fiorina 7% Huckabee 7% Bush 6% Cruz 5% Rubio 5% Paul 4% Christie 2% Graham 2% Kasich 2% Santorum 1% Gilmore * Jindal * Pataki * Someone else (vol.) * None/No one (vol.) 1% No opinion 8%

POLL -9- October 3-10, 2015
3
RP3. Now I'm going to mention a few issues and for each one, please tell me which Republican candidate
you think would best handle that issue if he or she were elected president. Please feel free to name a candidate even if you may not be voting for that person. Which Republican candidate do you think would do the best job handling: (RANDOM ORDER)
ISIS Oct. 3-10 2015 Trump 37% Graham 10% Bush 8% Carson 8% Paul 6% Rubio 6% Fiorina 5% Cruz 3% Christie 2% Huckabee 2% Santorum 1% Gilmore * Jindal * Kasich * Pataki * Someone else (vol.) * None/No one (vol.) 3% No opinion 7%

POLL -10- October 3-10, 2015
3
RP4. Now I’m going to read you a few phrases which describe the candidates, and for each one, tell me which Republican candidate you think that phrase best describes, regardless of who you are voting for. Which Republican candidate do you think: (RANDOM ORDER)
Best represents the values of Republicans like yourself Oct. 3-10 2015 Trump 25% Carson 19% Bush 10% Rubio 8% Graham 7% Cruz 6% Fiorina 5% Huckabee 5% Paul 4% Christie 3% Kasich 1% Santorum 1% Gilmore * Jindal * Pataki * Someone else (vol.) * None/No one (vol.) 2% No opinion 4% Has the best chance of winning in the general election next November Oct. 3-10 2015 Trump 44% Carson 17% Rubio 9% Bush 7% Fiorina 5% Cruz 2% Paul 2% Christie 1% Graham 1% Huckabee 1% Kasich 1% Gilmore * Jindal * Pataki * Santorum * Someone else (vol.) * None/No one (vol.) 3% No opinion 7%
Is most likely to change the way things work in Washington Oct. 3-10 2015 Trump 58% Carson 12% Fiorina 5% Paul 5% Bush 4% Cruz 3% Graham 3% Rubio 2% Christie 1% Huckabee 1% Kasich 1% Santorum 1% Gilmore * Jindal * Pataki * Someone else (vol.) 1% None/No one (vol.) 4% No opinion 2% Best understands the problems facing people like you Oct. 3-10 2015 Trump 28% Carson 21% Rubio 9% Graham 7% Bush 6% Paul 5% Huckabee 4% Christie 3% Cruz 3% Fiorina 3% Kasich 3% Santorum 1% Gilmore * Jindal * Pataki * Someone else (vol.) * None/No one (vol.) 2% No opinion 6%

POLL -11- October 3-10, 2015
3
5. Which of the following issues will be MOST important to you when you decide how to vote for
president? (RANDOM ORDER) BASED ON INTERVIEWS WITH 1,009 ADULT SOUTH CAROLINIANS -- SAMPLING ERROR: +/- 3 PERCENTAGE PTS.
Oct. 3-10 2015 The economy 38% Health care 19% Foreign policy 11% Terrorism 11% Social issues, such as abortion and same-sex marriage 10% Illegal immigration 6% Other (vol.) 1% No opinion 4% BASED ON INTERVIEWS WITH 521 REPUBLICAN LIKELY VOTERS -- SAMPLING ERROR: +/- 4.5 PERCENTAGE PTS. Oct. 3-10 2015 The economy 41% Foreign policy 16% Terrorism 16% Health care 9% Illegal immigration 8% Social issues, such as abortion and same-sex marriage 8% Other (vol.) 1% No opinion 2%

POLL -12- October 3-10, 2015
3
METHODOLOGY
Nevada A total of 1,011 Nevada adults were interviewed by telephone statewide by live interviewers calling both landline and cellphones. All respondents were asked questions concerning basic demographics, and the entire sample was weighted to reflect statewide Census figures for gender, race, age, education and region of the state. This sample includes 611 interviews among landline respondents and 400 interviews among cell phone respondents. Respondents were asked questions about whether they are registered to vote, their likelihood of voting, past voting behavior, and interest in the campaign. Based on the answers to those questions, 538 respondents were classified as likely caucus-goers, including 285 who were likely to participate in the Republican presidential caucus and 253 who were likely to participate in the Democratic presidential caucus. The Nevada regions are composed of the following counties: the "Washoe County" region is composed of Washoe county; the " Clark County" region is composed of Clark county; the "Rest of State" region is composed of Churchill, Douglas, Elko, Esmeralda, Eureka, Humboldt, Lander, Lincoln, Lyon, Mineral, Nye, Pershing, Storey, White Pine and Carson City counties. South Carolina A total of 1,009 South Carolina adults were interviewed by telephone statewide by live interviewers calling both landline and cellphones. All respondents were asked questions concerning basic demographics, and the entire sample was weighted to reflect statewide Census figures for gender, race, age, education and region of the state. This sample includes 609 interviews among landline respondents and 400 interviews among cell phone respondents. Respondents were asked questions about whether they are registered to vote, their likelihood of voting, past voting behavior, and interest in the campaign. Based on the answers to those questions, 822 respondents were classified as likely voters, including 521 who were likely to participate in the Republican presidential primary and 301 who were likely to participate in the Democratic presidential primary. The South Carolina regions are composed of the following counties: the "Upcountry" region is composed of Anderson, Cherokee, Greenville, Oconee, Pickens, Spartanburg counties; the "Piedmont" region is composed of Abbeville, Chester, Edgefield, Greenwood, Lancaster, Laurens, McCormick, Newberry, Saluda, Union and York counties; the "Central" region is composed of Aiken, Allendale, Bamberg, Barnwell, Calhoun, Clarendon, Fairfield, Kershaw, Lee, Lexington, Orangeburg, Richland and Sumter counties; the "PeeDee/Waccamaw" region is composed of Chesterfield, Darlington, Dillon, Florence, Georgetown, Horry Marion, Marlboro and Williamsburg counties; the "Low Country" region is composed of Beaufort, Berkeley, Charleston, Colleton, Dorchester, Hampton and Jasper counties. Crosstabs on the following pages only include results for subgroups with enough unweighted cases to produce a sampling error of +/- 8.5 percentage points or less. Some subgroups represent too small a share of the population of Nevada or South Carolina to produce crosstabs with an acceptable sampling error. Interviews were conducted among these subgroups but results for groups with a sampling error larger than +/-8.5 percentage points are not displayed.

POLL -13- October 3-10, 2015
3
Nevada CNN/ORC International Poll -- October 3 to 10, 2015 Question RP1 If the Republican presidential caucus in Nevada were held today, please tell me which of the following people you would be most likely to support. Base = Republican likely caucus goers White White Total Men Women White Non-White Men Women ----- ----- ----- ----- --------- ------ ------ Jeb Bush 6% 6% N/A 7% N/A 6% N/A Ben Carson 22% 19% N/A 20% N/A 14% N/A Chris Christie 1% 1% N/A 1% N/A 1% N/A Ted Cruz 4% 5% N/A 4% N/A 5% N/A Carly Fiorina 8% 5% N/A 7% N/A 4% N/A Lindsey Graham * * N/A * N/A * N/A Mike Huckabee 4% 5% N/A 3% N/A 2% N/A Bobby Jindal * 1% N/A * N/A 1% N/A John Kasich 1% 1% N/A 1% N/A 1% N/A George Pataki 1% 1% N/A * N/A * N/A Rand Paul 2% 2% N/A 2% N/A 3% N/A Marco Rubio 7% 6% N/A 9% N/A 8% N/A Rick Santorum * * N/A * N/A * N/A Donald Trump 38% 43% N/A 40% N/A 47% N/A Jim Gilmore 1% 1% N/A 1% N/A 2% N/A Someone else * * N/A * N/A 1% N/A None/No one 3% 1% N/A * N/A * N/A No opinion 3% 3% N/A 3% N/A 5% N/A Sampling Error +/-6.0 +/-7.5 +/-6.5 +/-8.5 18- 35- 50- Under 50 and Total 34 49 64 65+ 50 Older ----- ----- ----- ----- ----- ----- ------ Jeb Bush 6% N/A N/A N/A N/A N/A 5% Ben Carson 22% N/A N/A N/A N/A N/A 21% Chris Christie 1% N/A N/A N/A N/A N/A 1% Ted Cruz 4% N/A N/A N/A N/A N/A 3% Carly Fiorina 8% N/A N/A N/A N/A N/A 8% Lindsey Graham * N/A N/A N/A N/A N/A * Mike Huckabee 4% N/A N/A N/A N/A N/A 2% Bobby Jindal * N/A N/A N/A N/A N/A * John Kasich 1% N/A N/A N/A N/A N/A * George Pataki 1% N/A N/A N/A N/A N/A * Rand Paul 2% N/A N/A N/A N/A N/A 1% Marco Rubio 7% N/A N/A N/A N/A N/A 9% Rick Santorum * N/A N/A N/A N/A N/A * Donald Trump 38% N/A N/A N/A N/A N/A 41% Jim Gilmore 1% N/A N/A N/A N/A N/A 2% Someone else * N/A N/A N/A N/A N/A * None/No one 3% N/A N/A N/A N/A N/A 1% No opinion 3% N/A N/A N/A N/A N/A 4% Sampling Error +/-6.0 +/-7.0 * percentage less than 1%

POLL -14- October 3-10, 2015
3
Nevada CNN/ORC International Poll -- October 3 to 10, 2015 Question RP1 If the Republican presidential caucus in Nevada were held today, please tell me which of the following people you would be most likely to support. Base = Republican likely caucus goers Under $50K No Attended Sub- Total $50K or more College College Urban urban Rural ----- ----- ------- ------- -------- ----- ----- ----- Jeb Bush 6% N/A 8% N/A 6% 10% N/A N/A Ben Carson 22% N/A 19% N/A 27% 17% N/A N/A Chris Christie 1% N/A * N/A 1% * N/A N/A Ted Cruz 4% N/A 4% N/A 6% 2% N/A N/A Carly Fiorina 8% N/A 9% N/A 7% 10% N/A N/A Lindsey Graham * N/A * N/A * * N/A N/A Mike Huckabee 4% N/A 4% N/A 5% 4% N/A N/A Bobby Jindal * N/A * N/A * 1% N/A N/A John Kasich 1% N/A * N/A 1% * N/A N/A George Pataki 1% N/A * N/A 1% * N/A N/A Rand Paul 2% N/A 2% N/A 1% 1% N/A N/A Marco Rubio 7% N/A 6% N/A 9% 7% N/A N/A Rick Santorum * N/A * N/A * * N/A N/A Donald Trump 38% N/A 37% N/A 28% 34% N/A N/A Jim Gilmore 1% N/A 1% N/A * * N/A N/A Someone else * N/A * N/A * * N/A N/A None/No one 3% N/A 4% N/A 4% 6% N/A N/A No opinion 3% N/A 4% N/A 3% 6% N/A N/A Sampling Error +/-6.0 +/-7.5 +/-6.5 +/-8.5 Demo- Indep- Repub- Lib- Mod- Conser- Total crat endent lican eral erate vative ----- ----- ------ ------ ----- ----- ------- Jeb Bush 6% N/A N/A 8% N/A N/A 5% Ben Carson 22% N/A N/A 21% N/A N/A 23% Chris Christie 1% N/A N/A * N/A N/A 1% Ted Cruz 4% N/A N/A 3% N/A N/A 6% Carly Fiorina 8% N/A N/A 9% N/A N/A 11% Lindsey Graham * N/A N/A * N/A N/A * Mike Huckabee 4% N/A N/A 4% N/A N/A 4% Bobby Jindal * N/A N/A * N/A N/A * John Kasich 1% N/A N/A * N/A N/A * George Pataki 1% N/A N/A * N/A N/A 1% Rand Paul 2% N/A N/A * N/A N/A 1% Marco Rubio 7% N/A N/A 7% N/A N/A 7% Rick Santorum * N/A N/A * N/A N/A * Donald Trump 38% N/A N/A 39% N/A N/A 32% Jim Gilmore 1% N/A N/A * N/A N/A 1% Someone else * N/A N/A * N/A N/A * None/No one 3% N/A N/A 4% N/A N/A 4% No opinion 3% N/A N/A 3% N/A N/A 4% Sampling Error +/-6.0 +/-7.0 +/-7.0 * percentage less than 1%

POLL -15- October 3-10, 2015
3
Nevada CNN/ORC International Poll -- October 3 to 10, 2015 Question RP1 If the Republican presidential caucus in Nevada were held today, please tell me which of the following people you would be most likely to support. Base = Republican likely caucus goers Rest Washoe Clark of Total County County state ----- ------ ------ ----- Jeb Bush 6% N/A 7% N/A Ben Carson 22% N/A 20% N/A Chris Christie 1% N/A * N/A Ted Cruz 4% N/A 5% N/A Carly Fiorina 8% N/A 10% N/A Lindsey Graham * N/A * N/A Mike Huckabee 4% N/A 5% N/A Bobby Jindal * N/A 1% N/A John Kasich 1% N/A 1% N/A George Pataki 1% N/A 1% N/A Rand Paul 2% N/A 1% N/A Marco Rubio 7% N/A 7% N/A Rick Santorum * N/A * N/A Donald Trump 38% N/A 39% N/A Jim Gilmore 1% N/A * N/A Someone else * N/A * N/A None/No one 3% N/A * N/A No opinion 3% N/A 5% N/A Sampling Error +/-6.0 +/-7.0 * percentage less than 1%

POLL -16- October 3-10, 2015
3
Nevada CNN/ORC International Poll -- October 3 to 10, 2015 Question RP2 Have you definitely decided who you will support in the Nevada Republican caucus, are you leaning toward someone, or have you considered some candidates but are still trying to decide? Base = Republican likely caucus goers White White Total Men Women White Non-White Men Women ----- ----- ----- ----- --------- ------ ------ Definitely decided 30% 32% N/A 29% N/A 29% N/A Leaning toward someone 23% 25% N/A 25% N/A 29% N/A Still trying to decide 47% 42% N/A 46% N/A 43% N/A No opinion * * N/A * N/A * N/A Sampling Error +/-6.0 +/-7.5 +/-6.5 +/-8.5 18- 35- 50- Under 50 and Total 34 49 64 65+ 50 Older ----- ----- ----- ----- ----- ----- ------ Definitely decided 30% N/A N/A N/A N/A N/A 28% Leaning toward someone 23% N/A N/A N/A N/A N/A 28% Still trying to decide 47% N/A N/A N/A N/A N/A 44% No opinion * N/A N/A N/A N/A N/A * Sampling Error +/-6.0 +/-7.0 Under $50K No Attended Sub- Total $50K or more College College Urban urban Rural ----- ----- ------- ------- -------- ----- ----- ----- Definitely decided 30% N/A 26% N/A 26% 25% N/A N/A Leaning toward someone 23% N/A 26% N/A 20% 26% N/A N/A Still trying to decide 47% N/A 47% N/A 54% 49% N/A N/A No opinion * N/A * N/A * * N/A N/A Sampling Error +/-6.0 +/-7.5 +/-6.5 +/-8.5 Demo- Indep- Repub- Lib- Mod- Conser- Total crat endent lican eral erate vative ----- ----- ------ ------ ----- ----- ------- Definitely decided 30% N/A N/A 33% N/A N/A 27% Leaning toward someone 23% N/A N/A 23% N/A N/A 25% Still trying to decide 47% N/A N/A 44% N/A N/A 47% No opinion * N/A N/A * N/A N/A * Sampling Error +/-6.0 +/-7.0 +/-7.0 Rest Washoe Clark of Total County County state ----- ------ ------ ----- Definitely decided 30% N/A 33% N/A Leaning toward someone 23% N/A 21% N/A Still trying to decide 47% N/A 46% N/A No opinion * N/A * N/A Sampling Error +/-6.0 +/-7.0 * percentage less than 1%

POLL -17- October 3-10, 2015
3
Nevada CNN/ORC International Poll -- October 3 to 10, 2015 Question RP3A Now I'm going to mention a few issues and for each one, please tell me which Republican candidate you think would best handle that issue if he or she were elected President. Please feel free to name a candidate even if you may not be voting for that person. Which Republican candidate do you think would do the best job handling: A. The economy Base = Republican likely caucus goers White White Total Men Women White Non-White Men Women ----- ----- ----- ----- --------- ------ ------ Jeb Bush 6% 7% N/A 3% N/A 3% N/A Ben Carson 6% 5% N/A 7% N/A 3% N/A Chris Christie 1% * N/A 1% N/A 1% N/A Ted Cruz 2% 2% N/A 1% N/A 2% N/A Carly Fiorina 7% 9% N/A 7% N/A 9% N/A Lindsey Graham 1% 1% N/A * N/A * N/A Mike Huckabee 1% 1% N/A 1% N/A 1% N/A Bobby Jindal * 1% N/A * N/A 1% N/A John Kasich 2% 2% N/A 2% N/A 3% N/A George Pataki * * N/A * N/A * N/A Rand Paul 3% 3% N/A 2% N/A 2% N/A Marco Rubio 4% 3% N/A 4% N/A 3% N/A Rick Santorum * * N/A * N/A * N/A Donald Trump 67% 65% N/A 70% N/A 71% N/A Jim Gilmore * * N/A * N/A * N/A Someone else * * N/A * N/A 1% N/A None/No one * * N/A * N/A * N/A No opinion 1% 1% N/A 1% N/A 1% N/A Sampling Error +/-6.0 +/-7.5 +/-6.5 +/-8.5 18- 35- 50- Under 50 and Total 34 49 64 65+ 50 Older ----- ----- ----- ----- ----- ----- ------ Jeb Bush 6% N/A N/A N/A N/A N/A 4% Ben Carson 6% N/A N/A N/A N/A N/A 10% Chris Christie 1% N/A N/A N/A N/A N/A 2% Ted Cruz 2% N/A N/A N/A N/A N/A 1% Carly Fiorina 7% N/A N/A N/A N/A N/A 10% Lindsey Graham 1% N/A N/A N/A N/A N/A 1% Mike Huckabee 1% N/A N/A N/A N/A N/A * Bobby Jindal * N/A N/A N/A N/A N/A * John Kasich 2% N/A N/A N/A N/A N/A 3% George Pataki * N/A N/A N/A N/A N/A * Rand Paul 3% N/A N/A N/A N/A N/A 2% Marco Rubio 4% N/A N/A N/A N/A N/A 3% Rick Santorum * N/A N/A N/A N/A N/A * Donald Trump 67% N/A N/A N/A N/A N/A 63% Jim Gilmore * N/A N/A N/A N/A N/A * Someone else * N/A N/A N/A N/A N/A * None/No one * N/A N/A N/A N/A N/A * No opinion 1% N/A N/A N/A N/A N/A 1% Sampling Error +/-6.0 +/-7.0 * percentage less than 1%

POLL -18- October 3-10, 2015
3
Nevada CNN/ORC International Poll -- October 3 to 10, 2015 Question RP3A Now I'm going to mention a few issues and for each one, please tell me which Republican candidate you think would best handle that issue if he or she were elected President. Please feel free to name a candidate even if you may not be voting for that person. Which Republican candidate do you think would do the best job handling: A. The economy Base = Republican likely caucus goers Under $50K No Attended Sub- Total $50K or more College College Urban urban Rural ----- ----- ------- ------- -------- ----- ----- ----- Jeb Bush 6% N/A 5% N/A 6% 7% N/A N/A Ben Carson 6% N/A 5% N/A 5% 8% N/A N/A Chris Christie 1% N/A 1% N/A * * N/A N/A Ted Cruz 2% N/A 3% N/A 4% 2% N/A N/A Carly Fiorina 7% N/A 10% N/A 5% 8% N/A N/A Lindsey Graham 1% N/A 1% N/A 1% 1% N/A N/A Mike Huckabee 1% N/A 1% N/A 1% 2% N/A N/A Bobby Jindal * N/A * N/A * 1% N/A N/A John Kasich 2% N/A 2% N/A 2% 2% N/A N/A George Pataki * N/A * N/A * * N/A N/A Rand Paul 3% N/A 4% N/A 4% 5% N/A N/A Marco Rubio 4% N/A 2% N/A 5% 4% N/A N/A Rick Santorum * N/A * N/A * * N/A N/A Donald Trump 67% N/A 65% N/A 64% 59% N/A N/A Jim Gilmore * N/A * N/A * * N/A N/A Someone else * N/A * N/A * * N/A N/A None/No one * N/A * N/A * * N/A N/A No opinion 1% N/A 1% N/A 1% 1% N/A N/A Sampling Error +/-6.0 +/-7.5 +/-6.5 +/-8.5 Demo- Indep- Repub- Lib- Mod- Conser- Total crat endent lican eral erate vative ----- ----- ------ ------ ----- ----- ------- Jeb Bush 6% N/A N/A 9% N/A N/A 4% Ben Carson 6% N/A N/A 6% N/A N/A 6% Chris Christie 1% N/A N/A 1% N/A N/A 1% Ted Cruz 2% N/A N/A 2% N/A N/A 4% Carly Fiorina 7% N/A N/A 7% N/A N/A 8% Lindsey Graham 1% N/A N/A 1% N/A N/A * Mike Huckabee 1% N/A N/A * N/A N/A 1% Bobby Jindal * N/A N/A * N/A N/A * John Kasich 2% N/A N/A 2% N/A N/A 1% George Pataki * N/A N/A * N/A N/A * Rand Paul 3% N/A N/A * N/A N/A 4% Marco Rubio 4% N/A N/A 3% N/A N/A 3% Rick Santorum * N/A N/A * N/A N/A * Donald Trump 67% N/A N/A 67% N/A N/A 66% Jim Gilmore * N/A N/A * N/A N/A * Someone else * N/A N/A * N/A N/A * None/No one * N/A N/A * N/A N/A * No opinion 1% N/A N/A 1% N/A N/A 1% Sampling Error +/-6.0 +/-7.0 +/-7.0 * percentage less than 1%

POLL -19- October 3-10, 2015
3
Nevada CNN/ORC International Poll -- October 3 to 10, 2015 Question RP3A Now I'm going to mention a few issues and for each one, please tell me which Republican candidate you think would best handle that issue if he or she were elected President. Please feel free to name a candidate even if you may not be voting for that person. Which Republican candidate do you think would do the best job handling: A. The economy Base = Republican likely caucus goers Rest Washoe Clark of Total County County state ----- ------ ------ ----- Jeb Bush 6% N/A 8% N/A Ben Carson 6% N/A 5% N/A Chris Christie 1% N/A 1% N/A Ted Cruz 2% N/A 3% N/A Carly Fiorina 7% N/A 9% N/A Lindsey Graham 1% N/A * N/A Mike Huckabee 1% N/A 1% N/A Bobby Jindal * N/A 1% N/A John Kasich 2% N/A 1% N/A George Pataki * N/A * N/A Rand Paul 3% N/A 4% N/A Marco Rubio 4% N/A 3% N/A Rick Santorum * N/A * N/A Donald Trump 67% N/A 63% N/A Jim Gilmore * N/A * N/A Someone else * N/A * N/A None/No one * N/A * N/A No opinion 1% N/A 1% N/A Sampling Error +/-6.0 +/-7.0 * percentage less than 1%

POLL -20- October 3-10, 2015
3
Nevada CNN/ORC International Poll -- October 3 to 10, 2015 Question RP3B Now I'm going to mention a few issues and for each one, please tell me which Republican candidate you think would best handle that issue if he or she were elected President. Please feel free to name a candidate even if you may not be voting for that person. Which Republican candidate do you think would do the best job handling: B. Illegal immigration Base = Republican likely caucus goers White White Total Men Women White Non-White Men Women ----- ----- ----- ----- --------- ------ ------ Jeb Bush 5% 4% N/A 6% N/A 5% N/A Ben Carson 8% 9% N/A 5% N/A 5% N/A Chris Christie * * N/A * N/A 1% N/A Ted Cruz 6% 7% N/A 5% N/A 10% N/A Carly Fiorina 3% 4% N/A 1% N/A 1% N/A Lindsey Graham 1% 2% N/A * N/A * N/A Mike Huckabee 3% 3% N/A 4% N/A 4% N/A Bobby Jindal * * N/A * N/A 1% N/A John Kasich * * N/A * N/A * N/A George Pataki * * N/A * N/A * N/A Rand Paul 2% 2% N/A 2% N/A 2% N/A Marco Rubio 13% 14% N/A 13% N/A 14% N/A Rick Santorum * * N/A * N/A * N/A Donald Trump 55% 51% N/A 56% N/A 52% N/A Jim Gilmore * * N/A * N/A * N/A Someone else 1% 1% N/A * N/A 2% N/A None/No one 1% * N/A 1% N/A * N/A No opinion 3% 2% N/A 4% N/A 3% N/A Sampling Error +/-6.0 +/-7.5 +/-6.5 +/-8.5 18- 35- 50- Under 50 and Total 34 49 64 65+ 50 Older ----- ----- ----- ----- ----- ----- ------ Jeb Bush 5% N/A N/A N/A N/A N/A 3% Ben Carson 8% N/A N/A N/A N/A N/A 6% Chris Christie * N/A N/A N/A N/A N/A * Ted Cruz 6% N/A N/A N/A N/A N/A 6% Carly Fiorina 3% N/A N/A N/A N/A N/A 3% Lindsey Graham 1% N/A N/A N/A N/A N/A 2% Mike Huckabee 3% N/A N/A N/A N/A N/A 2% Bobby Jindal * N/A N/A N/A N/A N/A * John Kasich * N/A N/A N/A N/A N/A * George Pataki * N/A N/A N/A N/A N/A * Rand Paul 2% N/A N/A N/A N/A N/A 1% Marco Rubio 13% N/A N/A N/A N/A N/A 14% Rick Santorum * N/A N/A N/A N/A N/A * Donald Trump 55% N/A N/A N/A N/A N/A 56% Jim Gilmore * N/A N/A N/A N/A N/A * Someone else 1% N/A N/A N/A N/A N/A * None/No one 1% N/A N/A N/A N/A N/A 1% No opinion 3% N/A N/A N/A N/A N/A 4% Sampling Error +/-6.0 +/-7.0 * percentage less than 1%

POLL -21- October 3-10, 2015
3
Nevada CNN/ORC International Poll -- October 3 to 10, 2015 Question RP3B Now I'm going to mention a few issues and for each one, please tell me which Republican candidate you think would best handle that issue if he or she were elected President. Please feel free to name a candidate even if you may not be voting for that person. Which Republican candidate do you think would do the best job handling: B. Illegal immigration Base = Republican likely caucus goers Under $50K No Attended Sub- Total $50K or more College College Urban urban Rural ----- ----- ------- ------- -------- ----- ----- ----- Jeb Bush 5% N/A 5% N/A 5% 8% N/A N/A Ben Carson 8% N/A 6% N/A 11% 4% N/A N/A Chris Christie * N/A * N/A * * N/A N/A Ted Cruz 6% N/A 6% N/A 7% 6% N/A N/A Carly Fiorina 3% N/A 5% N/A 1% 4% N/A N/A Lindsey Graham 1% N/A * N/A 2% * N/A N/A Mike Huckabee 3% N/A 3% N/A 3% 4% N/A N/A Bobby Jindal * N/A * N/A * * N/A N/A John Kasich * N/A * N/A * * N/A N/A George Pataki * N/A * N/A * * N/A N/A Rand Paul 2% N/A 2% N/A 2% * N/A N/A Marco Rubio 13% N/A 14% N/A 18% 13% N/A N/A Rick Santorum * N/A * N/A * * N/A N/A Donald Trump 55% N/A 55% N/A 49% 51% N/A N/A Jim Gilmore * N/A * N/A * * N/A N/A Someone else 1% N/A * N/A * 2% N/A N/A None/No one 1% N/A 1% N/A * 1% N/A N/A No opinion 3% N/A 3% N/A * 5% N/A N/A Sampling Error +/-6.0 +/-7.5 +/-6.5 +/-8.5 Demo- Indep- Repub- Lib- Mod- Conser- Total crat endent lican eral erate vative ----- ----- ------ ------ ----- ----- ------- Jeb Bush 5% N/A N/A 6% N/A N/A 3% Ben Carson 8% N/A N/A 9% N/A N/A 8% Chris Christie * N/A N/A * N/A N/A * Ted Cruz 6% N/A N/A 6% N/A N/A 8% Carly Fiorina 3% N/A N/A 3% N/A N/A 4% Lindsey Graham 1% N/A N/A 2% N/A N/A * Mike Huckabee 3% N/A N/A 4% N/A N/A 4% Bobby Jindal * N/A N/A * N/A N/A * John Kasich * N/A N/A * N/A N/A * George Pataki * N/A N/A * N/A N/A * Rand Paul 2% N/A N/A * N/A N/A * Marco Rubio 13% N/A N/A 10% N/A N/A 13% Rick Santorum * N/A N/A * N/A N/A * Donald Trump 55% N/A N/A 56% N/A N/A 56% Jim Gilmore * N/A N/A * N/A N/A * Someone else 1% N/A N/A 1% N/A N/A 1% None/No one 1% N/A N/A 1% N/A N/A 1% No opinion 3% N/A N/A 2% N/A N/A 1% Sampling Error +/-6.0 +/-7.0 +/-7.0 * percentage less than 1%

POLL -22- October 3-10, 2015
3
Nevada CNN/ORC International Poll -- October 3 to 10, 2015 Question RP3B Now I'm going to mention a few issues and for each one, please tell me which Republican candidate you think would best handle that issue if he or she were elected President. Please feel free to name a candidate even if you may not be voting for that person. Which Republican candidate do you think would do the best job handling: B. Illegal immigration Base = Republican likely caucus goers Rest Washoe Clark of Total County County state ----- ------ ------ ----- Jeb Bush 5% N/A 5% N/A Ben Carson 8% N/A 10% N/A Chris Christie * N/A * N/A Ted Cruz 6% N/A 5% N/A Carly Fiorina 3% N/A 4% N/A Lindsey Graham 1% N/A 2% N/A Mike Huckabee 3% N/A 1% N/A Bobby Jindal * N/A * N/A John Kasich * N/A * N/A George Pataki * N/A * N/A Rand Paul 2% N/A 1% N/A Marco Rubio 13% N/A 13% N/A Rick Santorum * N/A * N/A Donald Trump 55% N/A 55% N/A Jim Gilmore * N/A * N/A Someone else 1% N/A 1% N/A None/No one 1% N/A * N/A No opinion 3% N/A 3% N/A Sampling Error +/-6.0 +/-7.0 * percentage less than 1%

POLL -23- October 3-10, 2015
3
Nevada CNN/ORC International Poll -- October 3 to 10, 2015 Question RP3C Now I'm going to mention a few issues and for each one, please tell me which Republican candidate you think would best handle that issue if he or she were elected President. Please feel free to name a candidate even if you may not be voting for that person. Which Republican candidate do you think would do the best job handling: C. Foreign policy Base = Republican likely caucus goers White White Total Men Women White Non-White Men Women ----- ----- ----- ----- --------- ------ ------ Jeb Bush 12% 12% N/A 17% N/A 17% N/A Ben Carson 11% 9% N/A 11% N/A 7% N/A Chris Christie 2% 2% N/A 1% N/A 1% N/A Ted Cruz 6% 7% N/A 6% N/A 8% N/A Carly Fiorina 7% 7% N/A 6% N/A 5% N/A Lindsey Graham 2% 3% N/A * N/A 1% N/A Mike Huckabee 3% 2% N/A 4% N/A 3% N/A Bobby Jindal * * N/A 1% N/A 1% N/A John Kasich * 1% N/A * N/A 1% N/A George Pataki * * N/A * N/A * N/A Rand Paul 5% 7% N/A 2% N/A 7% N/A Marco Rubio 13% 13% N/A 15% N/A 13% N/A Rick Santorum 1% 2% N/A * N/A * N/A Donald Trump 34% 34% N/A 31% N/A 32% N/A Jim Gilmore * * N/A * N/A * N/A Someone else 1% 1% N/A * N/A * N/A None/No one 1% * N/A 1% N/A 1% N/A No opinion 2% 2% N/A 4% N/A 3% N/A Sampling Error +/-6.0 +/-7.5 +/-6.5 +/-8.5 18- 35- 50- Under 50 and Total 34 49 64 65+ 50 Older ----- ----- ----- ----- ----- ----- ------ Jeb Bush 12% N/A N/A N/A N/A N/A 11% Ben Carson 11% N/A N/A N/A N/A N/A 8% Chris Christie 2% N/A N/A N/A N/A N/A 3% Ted Cruz 6% N/A N/A N/A N/A N/A 5% Carly Fiorina 7% N/A N/A N/A N/A N/A 8% Lindsey Graham 2% N/A N/A N/A N/A N/A 3% Mike Huckabee 3% N/A N/A N/A N/A N/A 2% Bobby Jindal * N/A N/A N/A N/A N/A 1% John Kasich * N/A N/A N/A N/A N/A * George Pataki * N/A N/A N/A N/A N/A * Rand Paul 5% N/A N/A N/A N/A N/A 3% Marco Rubio 13% N/A N/A N/A N/A N/A 16% Rick Santorum 1% N/A N/A N/A N/A N/A * Donald Trump 34% N/A N/A N/A N/A N/A 33% Jim Gilmore * N/A N/A N/A N/A N/A * Someone else 1% N/A N/A N/A N/A N/A 1% None/No one 1% N/A N/A N/A N/A N/A 2% No opinion 2% N/A N/A N/A N/A N/A 3% Sampling Error +/-6.0 +/-7.0 * percentage less than 1%

POLL -24- October 3-10, 2015
3
Nevada CNN/ORC International Poll -- October 3 to 10, 2015 Question RP3C Now I'm going to mention a few issues and for each one, please tell me which Republican candidate you think would best handle that issue if he or she were elected President. Please feel free to name a candidate even if you may not be voting for that person. Which Republican candidate do you think would do the best job handling: C. Foreign policy Base = Republican likely caucus goers Under $50K No Attended Sub- Total $50K or more College College Urban urban Rural ----- ----- ------- ------- -------- ----- ----- ----- Jeb Bush 12% N/A 12% N/A 12% 15% N/A N/A Ben Carson 11% N/A 10% N/A 11% 10% N/A N/A Chris Christie 2% N/A 2% N/A 2% 1% N/A N/A Ted Cruz 6% N/A 6% N/A 9% 6% N/A N/A Carly Fiorina 7% N/A 10% N/A 6% 9% N/A N/A Lindsey Graham 2% N/A * N/A 3% * N/A N/A Mike Huckabee 3% N/A 3% N/A 3% 3% N/A N/A Bobby Jindal * N/A * N/A * 1% N/A N/A John Kasich * N/A * N/A 1% 1% N/A N/A George Pataki * N/A * N/A * * N/A N/A Rand Paul 5% N/A 4% N/A 5% 8% N/A N/A Marco Rubio 13% N/A 14% N/A 17% 13% N/A N/A Rick Santorum 1% N/A 2% N/A 2% * N/A N/A Donald Trump 34% N/A 34% N/A 26% 29% N/A N/A Jim Gilmore * N/A * N/A * * N/A N/A Someone else 1% N/A * N/A 1% * N/A N/A None/No one 1% N/A 2% N/A 1% * N/A N/A No opinion 2% N/A 2% N/A 2% 3% N/A N/A Sampling Error +/-6.0 +/-7.5 +/-6.5 +/-8.5 Demo- Indep- Repub- Lib- Mod- Conser- Total crat endent lican eral erate vative ----- ----- ------ ------ ----- ----- ------- Jeb Bush 12% N/A N/A 14% N/A N/A 13% Ben Carson 11% N/A N/A 9% N/A N/A 6% Chris Christie 2% N/A N/A 2% N/A N/A 1% Ted Cruz 6% N/A N/A 7% N/A N/A 8% Carly Fiorina 7% N/A N/A 7% N/A N/A 8% Lindsey Graham 2% N/A N/A 2% N/A N/A 1% Mike Huckabee 3% N/A N/A 3% N/A N/A 4% Bobby Jindal * N/A N/A * N/A N/A * John Kasich * N/A N/A * N/A N/A * George Pataki * N/A N/A * N/A N/A * Rand Paul 5% N/A N/A 2% N/A N/A 5% Marco Rubio 13% N/A N/A 12% N/A N/A 16% Rick Santorum 1% N/A N/A * N/A N/A * Donald Trump 34% N/A N/A 37% N/A N/A 35% Jim Gilmore * N/A N/A * N/A N/A * Someone else 1% N/A N/A 1% N/A N/A 1% None/No one 1% N/A N/A 1% N/A N/A * No opinion 2% N/A N/A 2% N/A N/A 2% Sampling Error +/-6.0 +/-7.0 +/-7.0 * percentage less than 1%

POLL -25- October 3-10, 2015
3
Nevada CNN/ORC International Poll -- October 3 to 10, 2015 Question RP3C Now I'm going to mention a few issues and for each one, please tell me which Republican candidate you think would best handle that issue if he or she were elected President. Please feel free to name a candidate even if you may not be voting for that person. Which Republican candidate do you think would do the best job handling: C. Foreign policy Base = Republican likely caucus goers Rest Washoe Clark of Total County County state ----- ------ ------ ----- Jeb Bush 12% N/A 13% N/A Ben Carson 11% N/A 10% N/A Chris Christie 2% N/A 1% N/A Ted Cruz 6% N/A 4% N/A Carly Fiorina 7% N/A 9% N/A Lindsey Graham 2% N/A 2% N/A Mike Huckabee 3% N/A 2% N/A Bobby Jindal * N/A * N/A John Kasich * N/A * N/A George Pataki * N/A * N/A Rand Paul 5% N/A 7% N/A Marco Rubio 13% N/A 14% N/A Rick Santorum 1% N/A 2% N/A Donald Trump 34% N/A 32% N/A Jim Gilmore * N/A * N/A Someone else 1% N/A 1% N/A None/No one 1% N/A * N/A No opinion 2% N/A 3% N/A Sampling Error +/-6.0 +/-7.0 * percentage less than 1%

POLL -26- October 3-10, 2015
3
Nevada CNN/ORC International Poll -- October 3 to 10, 2015 Question RP3D Now I'm going to mention a few issues and for each one, please tell me which Republican candidate you think would best handle that issue if he or she were elected President. Please feel free to name a candidate even if you may not be voting for that person. Which Republican candidate do you think would do the best job handling: D. Social issues, such as abortion and same-sex marriage Base = Republican likely caucus goers White White Total Men Women White Non-White Men Women ----- ----- ----- ----- --------- ------ ------ Jeb Bush 8% 9% N/A 6% N/A 8% N/A Ben Carson 23% 24% N/A 24% N/A 24% N/A Chris Christie 1% 1% N/A 1% N/A 1% N/A Ted Cruz 4% 5% N/A 3% N/A 5% N/A Carly Fiorina 9% 8% N/A 8% N/A 5% N/A Lindsey Graham 1% 2% N/A 1% N/A 1% N/A Mike Huckabee 5% 2% N/A 6% N/A 1% N/A Bobby Jindal 1% 1% N/A * N/A 2% N/A John Kasich 1% 2% N/A 2% N/A 3% N/A George Pataki * * N/A * N/A * N/A Rand Paul 4% 5% N/A 3% N/A 2% N/A Marco Rubio 7% 8% N/A 7% N/A 8% N/A Rick Santorum * * N/A * N/A * N/A Donald Trump 25% 25% N/A 26% N/A 29% N/A Jim Gilmore * * N/A * N/A * N/A Someone else 2% 1% N/A 2% N/A 1% N/A None/No one 2% 3% N/A 3% N/A 4% N/A No opinion 6% 4% N/A 8% N/A 6% N/A Sampling Error +/-6.0 +/-7.5 +/-6.5 +/-8.5 18- 35- 50- Under 50 and Total 34 49 64 65+ 50 Older ----- ----- ----- ----- ----- ----- ------ Jeb Bush 8% N/A N/A N/A N/A N/A 10% Ben Carson 23% N/A N/A N/A N/A N/A 19% Chris Christie 1% N/A N/A N/A N/A N/A 1% Ted Cruz 4% N/A N/A N/A N/A N/A 4% Carly Fiorina 9% N/A N/A N/A N/A N/A 14% Lindsey Graham 1% N/A N/A N/A N/A N/A 1% Mike Huckabee 5% N/A N/A N/A N/A N/A 7% Bobby Jindal 1% N/A N/A N/A N/A N/A * John Kasich 1% N/A N/A N/A N/A N/A 1% George Pataki * N/A N/A N/A N/A N/A * Rand Paul 4% N/A N/A N/A N/A N/A 3% Marco Rubio 7% N/A N/A N/A N/A N/A 6% Rick Santorum * N/A N/A N/A N/A N/A * Donald Trump 25% N/A N/A N/A N/A N/A 25% Jim Gilmore * N/A N/A N/A N/A N/A * Someone else 2% N/A N/A N/A N/A N/A 1% None/No one 2% N/A N/A N/A N/A N/A 3% No opinion 6% N/A N/A N/A N/A N/A 5% Sampling Error +/-6.0 +/-7.0 * percentage less than 1%

POLL -27- October 3-10, 2015
3
Nevada CNN/ORC International Poll -- October 3 to 10, 2015 Question RP3D Now I'm going to mention a few issues and for each one, please tell me which Republican candidate you think would best handle that issue if he or she were elected President. Please feel free to name a candidate even if you may not be voting for that person. Which Republican candidate do you think would do the best job handling: D. Social issues, such as abortion and same-sex marriage Base = Republican likely caucus goers Under $50K No Attended Sub- Total $50K or more College College Urban urban Rural ----- ----- ------- ------- -------- ----- ----- ----- Jeb Bush 8% N/A 7% N/A 4% 7% N/A N/A Ben Carson 23% N/A 23% N/A 26% 15% N/A N/A Chris Christie 1% N/A * N/A * 1% N/A N/A Ted Cruz 4% N/A 5% N/A 7% 5% N/A N/A Carly Fiorina 9% N/A 11% N/A 9% 13% N/A N/A Lindsey Graham 1% N/A 2% N/A 1% 2% N/A N/A Mike Huckabee 5% N/A 3% N/A 5% 6% N/A N/A Bobby Jindal 1% N/A * N/A * 2% N/A N/A John Kasich 1% N/A * N/A 2% 1% N/A N/A George Pataki * N/A * N/A * * N/A N/A Rand Paul 4% N/A 5% N/A 3% 6% N/A N/A Marco Rubio 7% N/A 8% N/A 9% 5% N/A N/A Rick Santorum * N/A * N/A * * N/A N/A Donald Trump 25% N/A 26% N/A 24% 24% N/A N/A Jim Gilmore * N/A * N/A * * N/A N/A Someone else 2% N/A 1% N/A 3% 2% N/A N/A None/No one 2% N/A 2% N/A 2% 1% N/A N/A No opinion 6% N/A 6% N/A 5% 9% N/A N/A Sampling Error +/-6.0 +/-7.5 +/-6.5 +/-8.5 Demo- Indep- Repub- Lib- Mod- Conser- Total crat endent lican eral erate vative ----- ----- ------ ------ ----- ----- ------- Jeb Bush 8% N/A N/A 8% N/A N/A 2% Ben Carson 23% N/A N/A 22% N/A N/A 23% Chris Christie 1% N/A N/A * N/A N/A * Ted Cruz 4% N/A N/A 5% N/A N/A 8% Carly Fiorina 9% N/A N/A 12% N/A N/A 13% Lindsey Graham 1% N/A N/A 1% N/A N/A 1% Mike Huckabee 5% N/A N/A 6% N/A N/A 4% Bobby Jindal 1% N/A N/A 1% N/A N/A 1% John Kasich 1% N/A N/A 1% N/A N/A * George Pataki * N/A N/A * N/A N/A * Rand Paul 4% N/A N/A 3% N/A N/A 4% Marco Rubio 7% N/A N/A 6% N/A N/A 7% Rick Santorum * N/A N/A * N/A N/A * Donald Trump 25% N/A N/A 27% N/A N/A 28% Jim Gilmore * N/A N/A * N/A N/A * Someone else 2% N/A N/A 1% N/A N/A 1% None/No one 2% N/A N/A 2% N/A N/A 2% No opinion 6% N/A N/A 4% N/A N/A 4% Sampling Error +/-6.0 +/-7.0 +/-7.0 * percentage less than 1%

POLL -28- October 3-10, 2015
3
Nevada CNN/ORC International Poll -- October 3 to 10, 2015 Question RP3D Now I'm going to mention a few issues and for each one, please tell me which Republican candidate you think would best handle that issue if he or she were elected President. Please feel free to name a candidate even if you may not be voting for that person. Which Republican candidate do you think would do the best job handling: D. Social issues, such as abortion and same-sex marriage Base = Republican likely caucus goers Rest Washoe Clark of Total County County state ----- ------ ------ ----- Jeb Bush 8% N/A 8% N/A Ben Carson 23% N/A 21% N/A Chris Christie 1% N/A 1% N/A Ted Cruz 4% N/A 5% N/A Carly Fiorina 9% N/A 12% N/A Lindsey Graham 1% N/A * N/A Mike Huckabee 5% N/A 6% N/A Bobby Jindal 1% N/A 1% N/A John Kasich 1% N/A 2% N/A George Pataki * N/A * N/A Rand Paul 4% N/A 4% N/A Marco Rubio 7% N/A 8% N/A Rick Santorum * N/A * N/A Donald Trump 25% N/A 23% N/A Jim Gilmore * N/A * N/A Someone else 2% N/A 3% N/A None/No one 2% N/A 1% N/A No opinion 6% N/A 6% N/A Sampling Error +/-6.0 +/-7.0 * percentage less than 1%

POLL -29- October 3-10, 2015
3
Nevada CNN/ORC International Poll -- October 3 to 10, 2015 Question RP3E Now I'm going to mention a few issues and for each one, please tell me which Republican candidate you think would best handle that issue if he or she were elected President. Please feel free to name a candidate even if you may not be voting for that person. Which Republican candidate do you think would do the best job handling: E. ISIS Base = Republican likely caucus goers White White Total Men Women White Non-White Men Women ----- ----- ----- ----- --------- ------ ------ Jeb Bush 10% 6% N/A 12% N/A 7% N/A Ben Carson 6% 4% N/A 7% N/A 4% N/A Chris Christie 2% 2% N/A 2% N/A 1% N/A Ted Cruz 5% 5% N/A 5% N/A 6% N/A Carly Fiorina 5% 3% N/A 7% N/A 4% N/A Lindsey Graham 3% 3% N/A 1% N/A 1% N/A Mike Huckabee 2% 2% N/A 3% N/A 2% N/A Bobby Jindal * * N/A * N/A * N/A John Kasich * * N/A * N/A * N/A George Pataki * * N/A * N/A * N/A Rand Paul 4% 7% N/A 4% N/A 6% N/A Marco Rubio 13% 14% N/A 13% N/A 13% N/A Rick Santorum 1% 2% N/A * N/A * N/A Donald Trump 46% 49% N/A 43% N/A 50% N/A Jim Gilmore * * N/A * N/A * N/A Someone else * * N/A * N/A * N/A None/No one 2% 2% N/A 1% N/A 3% N/A No opinion 1% 1% N/A 2% N/A 1% N/A Sampling Error +/-6.0 +/-7.5 +/-6.5 +/-8.5 18- 35- 50- Under 50 and Total 34 49 64 65+ 50 Older ----- ----- ----- ----- ----- ----- ------ Jeb Bush 10% N/A N/A N/A N/A N/A 10% Ben Carson 6% N/A N/A N/A N/A N/A 6% Chris Christie 2% N/A N/A N/A N/A N/A 3% Ted Cruz 5% N/A N/A N/A N/A N/A 6% Carly Fiorina 5% N/A N/A N/A N/A N/A 6% Lindsey Graham 3% N/A N/A N/A N/A N/A 4% Mike Huckabee 2% N/A N/A N/A N/A N/A 3% Bobby Jindal * N/A N/A N/A N/A N/A * John Kasich * N/A N/A N/A N/A N/A * George Pataki * N/A N/A N/A N/A N/A * Rand Paul 4% N/A N/A N/A N/A N/A 1% Marco Rubio 13% N/A N/A N/A N/A N/A 12% Rick Santorum 1% N/A N/A N/A N/A N/A * Donald Trump 46% N/A N/A N/A N/A N/A 45% Jim Gilmore * N/A N/A N/A N/A N/A * Someone else * N/A N/A N/A N/A N/A * None/No one 2% N/A N/A N/A N/A N/A 1% No opinion 1% N/A N/A N/A N/A N/A 2% Sampling Error +/-6.0 +/-7.0 * percentage less than 1%

POLL -30- October 3-10, 2015
3
Nevada CNN/ORC International Poll -- October 3 to 10, 2015 Question RP3E Now I'm going to mention a few issues and for each one, please tell me which Republican candidate you think would best handle that issue if he or she were elected President. Please feel free to name a candidate even if you may not be voting for that person. Which Republican candidate do you think would do the best job handling: E. ISIS Base = Republican likely caucus goers Under $50K No Attended Sub- Total $50K or more College College Urban urban Rural ----- ----- ------- ------- -------- ----- ----- ----- Jeb Bush 10% N/A 9% N/A 12% 12% N/A N/A Ben Carson 6% N/A 6% N/A 5% 7% N/A N/A Chris Christie 2% N/A 2% N/A 2% 2% N/A N/A Ted Cruz 5% N/A 6% N/A 7% 4% N/A N/A Carly Fiorina 5% N/A 6% N/A 4% 8% N/A N/A Lindsey Graham 3% N/A * N/A 3% 2% N/A N/A Mike Huckabee 2% N/A 2% N/A 3% 3% N/A N/A Bobby Jindal * N/A * N/A * * N/A N/A John Kasich * N/A * N/A * * N/A N/A George Pataki * N/A * N/A * * N/A N/A Rand Paul 4% N/A 5% N/A 4% 4% N/A N/A Marco Rubio 13% N/A 15% N/A 16% 15% N/A N/A Rick Santorum 1% N/A 2% N/A 2% * N/A N/A Donald Trump 46% N/A 43% N/A 40% 41% N/A N/A Jim Gilmore * N/A * N/A * * N/A N/A Someone else * N/A * N/A * * N/A N/A None/No one 2% N/A 1% N/A 1% 3% N/A N/A No opinion 1% N/A 2% N/A 1% 2% N/A N/A Sampling Error +/-6.0 +/-7.5 +/-6.5 +/-8.5 Demo- Indep- Repub- Lib- Mod- Conser- Total crat endent lican eral erate vative ----- ----- ------ ------ ----- ----- ------- Jeb Bush 10% N/A N/A 10% N/A N/A 10% Ben Carson 6% N/A N/A 7% N/A N/A 4% Chris Christie 2% N/A N/A 3% N/A N/A 2% Ted Cruz 5% N/A N/A 5% N/A N/A 8% Carly Fiorina 5% N/A N/A 4% N/A N/A 4% Lindsey Graham 3% N/A N/A 3% N/A N/A 3% Mike Huckabee 2% N/A N/A 3% N/A N/A 4% Bobby Jindal * N/A N/A * N/A N/A * John Kasich * N/A N/A * N/A N/A * George Pataki * N/A N/A * N/A N/A * Rand Paul 4% N/A N/A 1% N/A N/A 5% Marco Rubio 13% N/A N/A 14% N/A N/A 15% Rick Santorum 1% N/A N/A * N/A N/A * Donald Trump 46% N/A N/A 48% N/A N/A 40% Jim Gilmore * N/A N/A * N/A N/A * Someone else * N/A N/A * N/A N/A * None/No one 2% N/A N/A 1% N/A N/A 2% No opinion 1% N/A N/A 2% N/A N/A 1% Sampling Error +/-6.0 +/-7.0 +/-7.0 * percentage less than 1%
POLL -31- October 3-10, 2015
3
Nevada CNN/ORC International Poll -- October 3 to 10, 2015 Question RP3E Now I'm going to mention a few issues and for each one, please tell me which Republican candidate you think would best handle that issue if he or she were elected President. Please feel free to name a candidate even if you may not be voting for that person. Which Republican candidate do you think would do the best job handling: E. ISIS Base = Republican likely caucus goers Rest Washoe Clark of Total County County state ----- ------ ------ ----- Jeb Bush 10% N/A 12% N/A Ben Carson 6% N/A 4% N/A Chris Christie 2% N/A 3% N/A Ted Cruz 5% N/A 4% N/A Carly Fiorina 5% N/A 5% N/A Lindsey Graham 3% N/A 4% N/A Mike Huckabee 2% N/A 2% N/A Bobby Jindal * N/A * N/A John Kasich * N/A * N/A George Pataki * N/A * N/A Rand Paul 4% N/A 4% N/A Marco Rubio 13% N/A 13% N/A Rick Santorum 1% N/A 2% N/A Donald Trump 46% N/A 42% N/A Jim Gilmore * N/A * N/A Someone else * N/A * N/A None/No one 2% N/A 2% N/A No opinion 1% N/A 2% N/A Sampling Error +/-6.0 +/-7.0 * percentage less than 1%

POLL -32- October 3-10, 2015
3
Nevada CNN/ORC International Poll -- October 3 to 10, 2015 Question RP4A Now I`m going to read you a few phrases which describe the candidates, and for each one, tell me which Republican candidate you think that phrase best describes, regardless of who you are voting for. Which Republican candidate do you think: A. Best represents the values of Republicans like yourself Base = Republican likely caucus goers White White Total Men Women White Non-White Men Women ----- ----- ----- ----- --------- ------ ------ Jeb Bush 7% 6% N/A 8% N/A 6% N/A Ben Carson 19% 18% N/A 21% N/A 21% N/A Chris Christie 2% 1% N/A 3% N/A 1% N/A Ted Cruz 10% 10% N/A 8% N/A 9% N/A Carly Fiorina 7% 5% N/A 7% N/A 2% N/A Lindsey Graham 1% 1% N/A * N/A 2% N/A Mike Huckabee 4% 3% N/A 5% N/A 4% N/A Bobby Jindal * * N/A 1% N/A * N/A John Kasich 1% * N/A 1% N/A 1% N/A George Pataki * * N/A * N/A * N/A Rand Paul 4% 6% N/A 4% N/A 6% N/A Marco Rubio 9% 9% N/A 9% N/A 9% N/A Rick Santorum * * N/A * N/A * N/A Donald Trump 34% 37% N/A 29% N/A 35% N/A Jim Gilmore * * N/A * N/A * N/A Someone else * * N/A * N/A 1% N/A None/No one * * N/A * N/A * N/A No opinion 2% 3% N/A 3% N/A 4% N/A Sampling Error +/-6.0 +/-7.5 +/-6.5 +/-8.5 18- 35- 50- Under 50 and Total 34 49 64 65+ 50 Older ----- ----- ----- ----- ----- ----- ------ Jeb Bush 7% N/A N/A N/A N/A N/A 5% Ben Carson 19% N/A N/A N/A N/A N/A 22% Chris Christie 2% N/A N/A N/A N/A N/A 1% Ted Cruz 10% N/A N/A N/A N/A N/A 9% Carly Fiorina 7% N/A N/A N/A N/A N/A 7% Lindsey Graham 1% N/A N/A N/A N/A N/A * Mike Huckabee 4% N/A N/A N/A N/A N/A 5% Bobby Jindal * N/A N/A N/A N/A N/A 1% John Kasich 1% N/A N/A N/A N/A N/A 1% George Pataki * N/A N/A N/A N/A N/A * Rand Paul 4% N/A N/A N/A N/A N/A 2% Marco Rubio 9% N/A N/A N/A N/A N/A 11% Rick Santorum * N/A N/A N/A N/A N/A * Donald Trump 34% N/A N/A N/A N/A N/A 30% Jim Gilmore * N/A N/A N/A N/A N/A * Someone else * N/A N/A N/A N/A N/A * None/No one * N/A N/A N/A N/A N/A * No opinion 2% N/A N/A N/A N/A N/A 4% Sampling Error +/-6.0 +/-7.0 * percentage less than 1%

POLL -33- October 3-10, 2015
3
Nevada CNN/ORC International Poll -- October 3 to 10, 2015 Question RP4A Now I`m going to read you a few phrases which describe the candidates, and for each one, tell me which Republican candidate you think that phrase best describes, regardless of who you are voting for. Which Republican candidate do you think: A. Best represents the values of Republicans like yourself Base = Republican likely caucus goers Under $50K No Attended Sub- Total $50K or more College College Urban urban Rural ----- ----- ------- ------- -------- ----- ----- ----- Jeb Bush 7% N/A 8% N/A 7% 10% N/A N/A Ben Carson 19% N/A 19% N/A 21% 15% N/A N/A Chris Christie 2% N/A 2% N/A 3% 2% N/A N/A Ted Cruz 10% N/A 11% N/A 13% 8% N/A N/A Carly Fiorina 7% N/A 8% N/A 6% 11% N/A N/A Lindsey Graham 1% N/A * N/A * 2% N/A N/A Mike Huckabee 4% N/A 5% N/A 3% 4% N/A N/A Bobby Jindal * N/A 1% N/A 1% 1% N/A N/A John Kasich 1% N/A 1% N/A 1% 1% N/A N/A George Pataki * N/A * N/A * * N/A N/A Rand Paul 4% N/A 4% N/A 5% 3% N/A N/A Marco Rubio 9% N/A 9% N/A 13% 10% N/A N/A Rick Santorum * N/A * N/A * * N/A N/A Donald Trump 34% N/A 30% N/A 28% 29% N/A N/A Jim Gilmore * N/A * N/A * * N/A N/A Someone else * N/A * N/A * * N/A N/A None/No one * N/A * N/A * * N/A N/A No opinion 2% N/A 2% N/A 1% 4% N/A N/A Sampling Error +/-6.0 +/-7.5 +/-6.5 +/-8.5 Demo- Indep- Repub- Lib- Mod- Conser- Total crat endent lican eral erate vative ----- ----- ------ ------ ----- ----- ------- Jeb Bush 7% N/A N/A 7% N/A N/A 6% Ben Carson 19% N/A N/A 18% N/A N/A 19% Chris Christie 2% N/A N/A 2% N/A N/A 3% Ted Cruz 10% N/A N/A 8% N/A N/A 15% Carly Fiorina 7% N/A N/A 7% N/A N/A 8% Lindsey Graham 1% N/A N/A 1% N/A N/A 1% Mike Huckabee 4% N/A N/A 5% N/A N/A 4% Bobby Jindal * N/A N/A * N/A N/A * John Kasich 1% N/A N/A 1% N/A N/A 1% George Pataki * N/A N/A * N/A N/A * Rand Paul 4% N/A N/A 1% N/A N/A 4% Marco Rubio 9% N/A N/A 8% N/A N/A 9% Rick Santorum * N/A N/A * N/A N/A * Donald Trump 34% N/A N/A 39% N/A N/A 30% Jim Gilmore * N/A N/A * N/A N/A * Someone else * N/A N/A * N/A N/A * None/No one * N/A N/A * N/A N/A * No opinion 2% N/A N/A 2% N/A N/A 1% Sampling Error +/-6.0 +/-7.0 +/-7.0 * percentage less than 1%

POLL -34- October 3-10, 2015
3
Nevada CNN/ORC International Poll -- October 3 to 10, 2015 Question RP4A Now I`m going to read you a few phrases which describe the candidates, and for each one, tell me which Republican candidate you think that phrase best describes, regardless of who you are voting for. Which Republican candidate do you think: A. Best represents the values of Republicans like yourself Base = Republican likely caucus goers Rest Washoe Clark of Total County County state ----- ------ ------ ----- Jeb Bush 7% N/A 7% N/A Ben Carson 19% N/A 18% N/A Chris Christie 2% N/A 2% N/A Ted Cruz 10% N/A 10% N/A Carly Fiorina 7% N/A 9% N/A Lindsey Graham 1% N/A 1% N/A Mike Huckabee 4% N/A 3% N/A Bobby Jindal * N/A * N/A John Kasich 1% N/A 1% N/A George Pataki * N/A * N/A Rand Paul 4% N/A 4% N/A Marco Rubio 9% N/A 9% N/A Rick Santorum * N/A * N/A Donald Trump 34% N/A 33% N/A Jim Gilmore * N/A * N/A Someone else * N/A * N/A None/No one * N/A * N/A No opinion 2% N/A 3% N/A Sampling Error +/-6.0 +/-7.0 * percentage less than 1%

POLL -35- October 3-10, 2015
3
Nevada CNN/ORC International Poll -- October 3 to 10, 2015 Question RP4B Now I`m going to read you a few phrases which describe the candidates, and for each one, tell me which Republican candidate you think that phrase best describes, regardless of who you are voting for. Which Republican candidate do you think: B. Has the best chance of winning the general election next November Base = Republican likely caucus goers White White Total Men Women White Non-White Men Women ----- ----- ----- ----- --------- ------ ------ Jeb Bush 7% 6% N/A 9% N/A 8% N/A Ben Carson 16% 16% N/A 14% N/A 12% N/A Chris Christie 1% 1% N/A * N/A 1% N/A Ted Cruz 5% 5% N/A 5% N/A 6% N/A Carly Fiorina 3% 3% N/A 3% N/A 4% N/A Lindsey Graham * * N/A * N/A * N/A Mike Huckabee 2% 2% N/A 2% N/A 1% N/A Bobby Jindal 1% 1% N/A * N/A 2% N/A John Kasich * * N/A * N/A 1% N/A George Pataki * * N/A * N/A * N/A Rand Paul 2% 3% N/A 1% N/A 4% N/A Marco Rubio 10% 11% N/A 10% N/A 10% N/A Rick Santorum * * N/A * N/A * N/A Donald Trump 47% 48% N/A 47% N/A 48% N/A Jim Gilmore * * N/A * N/A * N/A Someone else 1% 1% N/A 1% N/A 1% N/A None/No one * * N/A * N/A * N/A No opinion 4% 2% N/A 5% N/A 3% N/A Sampling Error +/-6.0 +/-7.5 +/-6.5 +/-8.5 18- 35- 50- Under 50 and Total 34 49 64 65+ 50 Older ----- ----- ----- ----- ----- ----- ------ Jeb Bush 7% N/A N/A N/A N/A N/A 6% Ben Carson 16% N/A N/A N/A N/A N/A 17% Chris Christie 1% N/A N/A N/A N/A N/A 1% Ted Cruz 5% N/A N/A N/A N/A N/A 4% Carly Fiorina 3% N/A N/A N/A N/A N/A 6% Lindsey Graham * N/A N/A N/A N/A N/A * Mike Huckabee 2% N/A N/A N/A N/A N/A * Bobby Jindal 1% N/A N/A N/A N/A N/A * John Kasich * N/A N/A N/A N/A N/A 1% George Pataki * N/A N/A N/A N/A N/A * Rand Paul 2% N/A N/A N/A N/A N/A 2% Marco Rubio 10% N/A N/A N/A N/A N/A 11% Rick Santorum * N/A N/A N/A N/A N/A * Donald Trump 47% N/A N/A N/A N/A N/A 41% Jim Gilmore * N/A N/A N/A N/A N/A * Someone else 1% N/A N/A N/A N/A N/A 2% None/No one * N/A N/A N/A N/A N/A * No opinion 4% N/A N/A N/A N/A N/A 8% Sampling Error +/-6.0 +/-7.0 * percentage less than 1%

POLL -36- October 3-10, 2015
3
Nevada CNN/ORC International Poll -- October 3 to 10, 2015 Question RP4B Now I`m going to read you a few phrases which describe the candidates, and for each one, tell me which Republican candidate you think that phrase best describes, regardless of who you are voting for. Which Republican candidate do you think: B. Has the best chance of winning the general election next November Base = Republican likely caucus goers Under $50K No Attended Sub- Total $50K or more College College Urban urban Rural ----- ----- ------- ------- -------- ----- ----- ----- Jeb Bush 7% N/A 6% N/A 8% 11% N/A N/A Ben Carson 16% N/A 14% N/A 20% 13% N/A N/A Chris Christie 1% N/A 1% N/A 1% 1% N/A N/A Ted Cruz 5% N/A 5% N/A 7% 5% N/A N/A Carly Fiorina 3% N/A 4% N/A 4% 3% N/A N/A Lindsey Graham * N/A * N/A * * N/A N/A Mike Huckabee 2% N/A 1% N/A 3% 3% N/A N/A Bobby Jindal 1% N/A * N/A * 2% N/A N/A John Kasich * N/A 1% N/A * * N/A N/A George Pataki * N/A * N/A * * N/A N/A Rand Paul 2% N/A * N/A 1% 2% N/A N/A Marco Rubio 10% N/A 12% N/A 12% 11% N/A N/A Rick Santorum * N/A * N/A * * N/A N/A Donald Trump 47% N/A 53% N/A 39% 42% N/A N/A Jim Gilmore * N/A * N/A * * N/A N/A Someone else 1% N/A 1% N/A 1% * N/A N/A None/No one * N/A * N/A * * N/A N/A No opinion 4% N/A 3% N/A 3% 6% N/A N/A Sampling Error +/-6.0 +/-7.5 +/-6.5 +/-8.5 Demo- Indep- Repub- Lib- Mod- Conser- Total crat endent lican eral erate vative ----- ----- ------ ------ ----- ----- ------- Jeb Bush 7% N/A N/A 7% N/A N/A 6% Ben Carson 16% N/A N/A 16% N/A N/A 17% Chris Christie 1% N/A N/A 1% N/A N/A * Ted Cruz 5% N/A N/A 6% N/A N/A 6% Carly Fiorina 3% N/A N/A 4% N/A N/A 5% Lindsey Graham * N/A N/A * N/A N/A * Mike Huckabee 2% N/A N/A 2% N/A N/A 3% Bobby Jindal 1% N/A N/A 1% N/A N/A 2% John Kasich * N/A N/A * N/A N/A 1% George Pataki * N/A N/A * N/A N/A * Rand Paul 2% N/A N/A * N/A N/A * Marco Rubio 10% N/A N/A 11% N/A N/A 13% Rick Santorum * N/A N/A * N/A N/A * Donald Trump 47% N/A N/A 46% N/A N/A 43% Jim Gilmore * N/A N/A * N/A N/A * Someone else 1% N/A N/A 1% N/A N/A 1% None/No one * N/A N/A * N/A N/A * No opinion 4% N/A N/A 4% N/A N/A 4% Sampling Error +/-6.0 +/-7.0 +/-7.0 * percentage less than 1%

POLL -37- October 3-10, 2015
3
Nevada CNN/ORC International Poll -- October 3 to 10, 2015 Question RP4B Now I`m going to read you a few phrases which describe the candidates, and for each one, tell me which Republican candidate you think that phrase best describes, regardless of who you are voting for. Which Republican candidate do you think: B. Has the best chance of winning the general election next November Base = Republican likely caucus goers Rest Washoe Clark of Total County County state ----- ------ ------ ----- Jeb Bush 7% N/A 9% N/A Ben Carson 16% N/A 16% N/A Chris Christie 1% N/A * N/A Ted Cruz 5% N/A 4% N/A Carly Fiorina 3% N/A 5% N/A Lindsey Graham * N/A * N/A Mike Huckabee 2% N/A 2% N/A Bobby Jindal 1% N/A 1% N/A John Kasich * N/A * N/A George Pataki * N/A * N/A Rand Paul 2% N/A 3% N/A Marco Rubio 10% N/A 11% N/A Rick Santorum * N/A * N/A Donald Trump 47% N/A 42% N/A Jim Gilmore * N/A * N/A Someone else 1% N/A 1% N/A None/No one * N/A * N/A No opinion 4% N/A 4% N/A Sampling Error +/-6.0 +/-7.0 * percentage less than 1%

POLL -38- October 3-10, 2015
3
Nevada CNN/ORC International Poll -- October 3 to 10, 2015 Question RP4C Now I`m going to read you a few phrases which describe the candidates, and for each one, tell me which Republican candidate you think that phrase best describes, regardless of who you are voting for. Which Republican candidate do you think: C. Is most likely to change the way things work in Washington Base = Republican likely caucus goers White White Total Men Women White Non-White Men Women ----- ----- ----- ----- --------- ------ ------ Jeb Bush 3% 2% N/A 2% N/A 1% N/A Ben Carson 10% 6% N/A 10% N/A 3% N/A Chris Christie 1% * N/A 2% N/A 1% N/A Ted Cruz 5% 5% N/A 4% N/A 6% N/A Carly Fiorina 4% 4% N/A 3% N/A 2% N/A Lindsey Graham * * N/A * N/A * N/A Mike Huckabee 1% * N/A 1% N/A 1% N/A Bobby Jindal * * N/A * N/A * N/A John Kasich * * N/A * N/A 1% N/A George Pataki * * N/A * N/A * N/A Rand Paul 3% 4% N/A 2% N/A 2% N/A Marco Rubio 4% 5% N/A 6% N/A 8% N/A Rick Santorum * * N/A * N/A * N/A Donald Trump 60% 64% N/A 60% N/A 66% N/A Jim Gilmore 1% 1% N/A * N/A * N/A Someone else 1% 1% N/A 1% N/A 1% N/A None/No one 5% 4% N/A 5% N/A 3% N/A No opinion 3% 3% N/A 4% N/A 5% N/A Sampling Error +/-6.0 +/-7.5 +/-6.5 +/-8.5 18- 35- 50- Under 50 and Total 34 49 64 65+ 50 Older ----- ----- ----- ----- ----- ----- ------ Jeb Bush 3% N/A N/A N/A N/A N/A 1% Ben Carson 10% N/A N/A N/A N/A N/A 11% Chris Christie 1% N/A N/A N/A N/A N/A 1% Ted Cruz 5% N/A N/A N/A N/A N/A 6% Carly Fiorina 4% N/A N/A N/A N/A N/A 4% Lindsey Graham * N/A N/A N/A N/A N/A * Mike Huckabee 1% N/A N/A N/A N/A N/A 1% Bobby Jindal * N/A N/A N/A N/A N/A * John Kasich * N/A N/A N/A N/A N/A 1% George Pataki * N/A N/A N/A N/A N/A * Rand Paul 3% N/A N/A N/A N/A N/A 3% Marco Rubio 4% N/A N/A N/A N/A N/A 6% Rick Santorum * N/A N/A N/A N/A N/A * Donald Trump 60% N/A N/A N/A N/A N/A 56% Jim Gilmore 1% N/A N/A N/A N/A N/A * Someone else 1% N/A N/A N/A N/A N/A 1% None/No one 5% N/A N/A N/A N/A N/A 8% No opinion 3% N/A N/A N/A N/A N/A 1% Sampling Error +/-6.0 +/-7.0 * percentage less than 1%

POLL -39- October 3-10, 2015
3
Nevada CNN/ORC International Poll -- October 3 to 10, 2015 Question RP4C Now I`m going to read you a few phrases which describe the candidates, and for each one, tell me which Republican candidate you think that phrase best describes, regardless of who you are voting for. Which Republican candidate do you think: C. Is most likely to change the way things work in Washington Base = Republican likely caucus goers Under $50K No Attended Sub- Total $50K or more College College Urban urban Rural ----- ----- ------- ------- -------- ----- ----- ----- Jeb Bush 3% N/A 3% N/A 2% 5% N/A N/A Ben Carson 10% N/A 11% N/A 12% 14% N/A N/A Chris Christie 1% N/A 1% N/A 2% 1% N/A N/A Ted Cruz 5% N/A 5% N/A 7% 4% N/A N/A Carly Fiorina 4% N/A 5% N/A 2% 4% N/A N/A Lindsey Graham * N/A * N/A * * N/A N/A Mike Huckabee 1% N/A 1% N/A 1% 1% N/A N/A Bobby Jindal * N/A * N/A * * N/A N/A John Kasich * N/A * N/A * * N/A N/A George Pataki * N/A * N/A * * N/A N/A Rand Paul 3% N/A 3% N/A 3% 1% N/A N/A Marco Rubio 4% N/A 6% N/A 4% 4% N/A N/A Rick Santorum * N/A * N/A * * N/A N/A Donald Trump 60% N/A 56% N/A 60% 54% N/A N/A Jim Gilmore 1% N/A * N/A 1% * N/A N/A Someone else 1% N/A 1% N/A * * N/A N/A None/No one 5% N/A 5% N/A 4% 7% N/A N/A No opinion 3% N/A 4% N/A 2% 4% N/A N/A Sampling Error +/-6.0 +/-7.5 +/-6.5 +/-8.5 Demo- Indep- Repub- Lib- Mod- Conser- Total crat endent lican eral erate vative ----- ----- ------ ------ ----- ----- ------- Jeb Bush 3% N/A N/A 4% N/A N/A 2% Ben Carson 10% N/A N/A 8% N/A N/A 12% Chris Christie 1% N/A N/A 1% N/A N/A 2% Ted Cruz 5% N/A N/A 5% N/A N/A 8% Carly Fiorina 4% N/A N/A 4% N/A N/A 5% Lindsey Graham * N/A N/A * N/A N/A * Mike Huckabee 1% N/A N/A 1% N/A N/A 1% Bobby Jindal * N/A N/A * N/A N/A * John Kasich * N/A N/A * N/A N/A * George Pataki * N/A N/A * N/A N/A * Rand Paul 3% N/A N/A 2% N/A N/A 1% Marco Rubio 4% N/A N/A 3% N/A N/A 7% Rick Santorum * N/A N/A * N/A N/A * Donald Trump 60% N/A N/A 62% N/A N/A 55% Jim Gilmore 1% N/A N/A * N/A N/A 1% Someone else 1% N/A N/A 1% N/A N/A * None/No one 5% N/A N/A 3% N/A N/A 1% No opinion 3% N/A N/A 4% N/A N/A 4% Sampling Error +/-6.0 +/-7.0 +/-7.0 * percentage less than 1%

POLL -40- October 3-10, 2015
3
Nevada CNN/ORC International Poll -- October 3 to 10, 2015 Question RP4C Now I`m going to read you a few phrases which describe the candidates, and for each one, tell me which Republican candidate you think that phrase best describes, regardless of who you are voting for. Which Republican candidate do you think: C. Is most likely to change the way things work in Washington Base = Republican likely caucus goers Rest Washoe Clark of Total County County state ----- ------ ------ ----- Jeb Bush 3% N/A 4% N/A Ben Carson 10% N/A 9% N/A Chris Christie 1% N/A 1% N/A Ted Cruz 5% N/A 6% N/A Carly Fiorina 4% N/A 4% N/A Lindsey Graham * N/A * N/A Mike Huckabee 1% N/A 1% N/A Bobby Jindal * N/A * N/A John Kasich * N/A * N/A George Pataki * N/A * N/A Rand Paul 3% N/A 3% N/A Marco Rubio 4% N/A 3% N/A Rick Santorum * N/A * N/A Donald Trump 60% N/A 60% N/A Jim Gilmore 1% N/A 1% N/A Someone else 1% N/A * N/A None/No one 5% N/A 4% N/A No opinion 3% N/A 3% N/A Sampling Error +/-6.0 +/-7.0 * percentage less than 1%

POLL -41- October 3-10, 2015
3
Nevada CNN/ORC International Poll -- October 3 to 10, 2015 Question RP4D Now I`m going to read you a few phrases which describe the candidates, and for each one, tell me which Republican candidate you think that phrase best describes, regardless of who you are voting for. Which Republican candidate do you think: D. Best understands the problems facing people like you Base = Republican likely caucus goers White White Total Men Women White Non-White Men Women ----- ----- ----- ----- --------- ------ ------ Jeb Bush 5% 4% N/A 5% N/A 3% N/A Ben Carson 20% 18% N/A 22% N/A 17% N/A Chris Christie 1% * N/A 1% N/A * N/A Ted Cruz 7% 8% N/A 6% N/A 9% N/A Carly Fiorina 5% 4% N/A 4% N/A 2% N/A Lindsey Graham * * N/A * N/A * N/A Mike Huckabee 4% 3% N/A 4% N/A 3% N/A Bobby Jindal * 1% N/A * N/A 1% N/A John Kasich 1% 2% N/A 2% N/A 3% N/A George Pataki * * N/A 1% N/A * N/A Rand Paul 4% 6% N/A 4% N/A 5% N/A Marco Rubio 10% 13% N/A 8% N/A 10% N/A Rick Santorum * * N/A * N/A * N/A Donald Trump 35% 35% N/A 34% N/A 39% N/A Jim Gilmore * * N/A * N/A * N/A Someone else * 1% N/A * N/A 1% N/A None/No one 3% 4% N/A 4% N/A 4% N/A No opinion 2% 2% N/A 3% N/A 2% N/A Sampling Error +/-6.0 +/-7.5 +/-6.5 +/-8.5 18- 35- 50- Under 50 and Total 34 49 64 65+ 50 Older ----- ----- ----- ----- ----- ----- ------ Jeb Bush 5% N/A N/A N/A N/A N/A 6% Ben Carson 20% N/A N/A N/A N/A N/A 18% Chris Christie 1% N/A N/A N/A N/A N/A 2% Ted Cruz 7% N/A N/A N/A N/A N/A 6% Carly Fiorina 5% N/A N/A N/A N/A N/A 6% Lindsey Graham * N/A N/A N/A N/A N/A * Mike Huckabee 4% N/A N/A N/A N/A N/A 4% Bobby Jindal * N/A N/A N/A N/A N/A * John Kasich 1% N/A N/A N/A N/A N/A 1% George Pataki * N/A N/A N/A N/A N/A * Rand Paul 4% N/A N/A N/A N/A N/A 2% Marco Rubio 10% N/A N/A N/A N/A N/A 11% Rick Santorum * N/A N/A N/A N/A N/A * Donald Trump 35% N/A N/A N/A N/A N/A 40% Jim Gilmore * N/A N/A N/A N/A N/A * Someone else * N/A N/A N/A N/A N/A * None/No one 3% N/A N/A N/A N/A N/A 3% No opinion 2% N/A N/A N/A N/A N/A 2% Sampling Error +/-6.0 +/-7.0 * percentage less than 1%
POLL -42- October 3-10, 2015
3
Nevada CNN/ORC International Poll -- October 3 to 10, 2015 Question RP4D Now I`m going to read you a few phrases which describe the candidates, and for each one, tell me which Republican candidate you think that phrase best describes, regardless of who you are voting for. Which Republican candidate do you think: D. Best understands the problems facing people like you Base = Republican likely caucus goers Under $50K No Attended Sub- Total $50K or more College College Urban urban Rural ----- ----- ------- ------- -------- ----- ----- ----- Jeb Bush 5% N/A 7% N/A 4% 9% N/A N/A Ben Carson 20% N/A 18% N/A 25% 16% N/A N/A Chris Christie 1% N/A * N/A 1% 2% N/A N/A Ted Cruz 7% N/A 7% N/A 6% 9% N/A N/A Carly Fiorina 5% N/A 6% N/A 2% 7% N/A N/A Lindsey Graham * N/A * N/A * 1% N/A N/A Mike Huckabee 4% N/A 3% N/A 4% 5% N/A N/A Bobby Jindal * N/A * N/A * 1% N/A N/A John Kasich 1% N/A * N/A 2% 1% N/A N/A George Pataki * N/A 1% N/A 1% 1% N/A N/A Rand Paul 4% N/A 4% N/A 5% 5% N/A N/A Marco Rubio 10% N/A 14% N/A 15% 7% N/A N/A Rick Santorum * N/A * N/A * * N/A N/A Donald Trump 35% N/A 34% N/A 28% 30% N/A N/A Jim Gilmore * N/A * N/A * * N/A N/A Someone else * N/A 1% N/A 1% * N/A N/A None/No one 3% N/A 2% N/A 5% 5% N/A N/A No opinion 2% N/A 1% N/A 1% 4% N/A N/A Sampling Error +/-6.0 +/-7.5 +/-6.5 +/-8.5 Demo- Indep- Repub- Lib- Mod- Conser- Total crat endent lican eral erate vative ----- ----- ------ ------ ----- ----- ------- Jeb Bush 5% N/A N/A 7% N/A N/A 6% Ben Carson 20% N/A N/A 20% N/A N/A 19% Chris Christie 1% N/A N/A 2% N/A N/A 2% Ted Cruz 7% N/A N/A 5% N/A N/A 9% Carly Fiorina 5% N/A N/A 6% N/A N/A 7% Lindsey Graham * N/A N/A * N/A N/A * Mike Huckabee 4% N/A N/A 4% N/A N/A 4% Bobby Jindal * N/A N/A * N/A N/A * John Kasich 1% N/A N/A 1% N/A N/A * George Pataki * N/A N/A 1% N/A N/A 1% Rand Paul 4% N/A N/A 2% N/A N/A 3% Marco Rubio 10% N/A N/A 10% N/A N/A 11% Rick Santorum * N/A N/A * N/A N/A * Donald Trump 35% N/A N/A 39% N/A N/A 33% Jim Gilmore * N/A N/A * N/A N/A * Someone else * N/A N/A * N/A N/A * None/No one 3% N/A N/A 1% N/A N/A 2% No opinion 2% N/A N/A 2% N/A N/A 1% Sampling Error +/-6.0 +/-7.0 +/-7.0 * percentage less than 1%

POLL -43- October 3-10, 2015
3
Nevada CNN/ORC International Poll -- October 3 to 10, 2015 Question RP4D Now I`m going to read you a few phrases which describe the candidates, and for each one, tell me which Republican candidate you think that phrase best describes, regardless of who you are voting for. Which Republican candidate do you think: D. Best understands the problems facing people like you Base = Republican likely caucus goers Rest Washoe Clark of Total County County state ----- ------ ------ ----- Jeb Bush 5% N/A 5% N/A Ben Carson 20% N/A 21% N/A Chris Christie 1% N/A 2% N/A Ted Cruz 7% N/A 8% N/A Carly Fiorina 5% N/A 5% N/A Lindsey Graham * N/A * N/A Mike Huckabee 4% N/A 4% N/A Bobby Jindal * N/A 1% N/A John Kasich 1% N/A 2% N/A George Pataki * N/A 1% N/A Rand Paul 4% N/A 3% N/A Marco Rubio 10% N/A 9% N/A Rick Santorum * N/A * N/A Donald Trump 35% N/A 34% N/A Jim Gilmore * N/A * N/A Someone else * N/A * N/A None/No one 3% N/A 4% N/A No opinion 2% N/A 2% N/A Sampling Error +/-6.0 +/-7.0 * percentage less than 1%

POLL -44- October 3-10, 2015
3
Nevada CNN/ORC International Poll -- October 3 to 10, 2015 Question 5 Which of the following issues will be MOST important to you when you decide how to vote for president? Base = Total Sample White White Total Men Women White Non-White Men Women ----- ----- ----- ----- --------- ------ ------ Foreign policy 7% 8% 6% 8% 6% 8% 6% Illegal immigration 11% 10% 13% 9% 14% 12% 7% Health care 13% 9% 16% 14% 12% 8% 19% Social issues 13% 11% 15% 12% 15% 10% 16% Terrorism 11% 12% 9% 11% 11% 14% 9% The economy 39% 42% 36% 41% 37% 42% 38% Other 3% 4% 2% 3% 3% 4% 2% No opinion 3% 4% 3% 3% 3% 3% 3% Sampling Error +/-3.0 +/-4.5 +/-4.5 +/-3.5 +/-6.0 +/-5.0 +/-5.0 18- 35- 50- Under 50 and Total 34 49 64 65+ 50 Older ----- ----- ----- ----- ----- ----- ------ Foreign policy 7% 4% 6% 12% 7% 5% 10% Illegal immigration 11% 13% 6% 11% 16% 10% 14% Health care 13% 11% 11% 16% 16% 11% 16% Social issues 13% 18% 14% 9% 9% 16% 9% Terrorism 11% 11% 8% 12% 13% 9% 13% The economy 39% 40% 50% 35% 29% 44% 32% Other 3% 2% 6% 2% 3% 4% 3% No opinion 3% 2% 1% 3% 6% 2% 4% Sampling Error +/-3.0 +/-8.0 +/-7.0 +/-6.0 +/-5.0 +/-5.5 +/-4.0 Under $50K No Attended Sub- Total $50K or more College College Urban urban Rural ----- ----- ------- ------- -------- ----- ----- ----- Foreign policy 7% 7% 10% 4% 9% 8% 7% N/A Illegal immigration 11% 7% 12% 10% 12% 10% 11% N/A Health care 13% 13% 8% 12% 14% 14% 13% N/A Social issues 13% 14% 11% 14% 12% 17% 9% N/A Terrorism 11% 11% 13% 15% 8% 10% 11% N/A The economy 39% 43% 42% 38% 40% 36% 40% N/A Other 3% 1% 3% 4% 3% 3% 5% N/A No opinion 3% 3% 1% 3% 3% 2% 4% N/A Sampling Error +/-3.0 +/-6.0 +/-5.5 +/-6.0 +/-3.5 +/-4.5 +/-5.0 Demo- Indep- Repub- Lib- Mod- Conser- Total crat endent lican eral erate vative ----- ----- ------ ------ ----- ----- ------- Foreign policy 7% 5% 6% 11% 4% 13% 8% Illegal immigration 11% 7% 12% 16% 6% 8% 17% Health care 13% 20% 12% 6% 18% 10% 6% Social issues 13% 16% 15% 7% 23% 11% 6% Terrorism 11% 7% 9% 19% 9% 12% 13% The economy 39% 41% 38% 38% 36% 42% 45% Other 3% 3% 5% 1% 4% 1% 1% No opinion 3% 2% 4% 4% * 1% 4% Sampling Error +/-3.0 +/-5.5 +/-5.0 +/-5.5 +/-8.0 +/-6.0 +/-6.0 Rest Washoe Clark of Total County County state ----- ------ ------ ----- Foreign policy 7% 10% 6% 5% Illegal immigration 11% 11% 10% 17% Health care 13% 13% 14% 7% Social issues 13% 18% 12% 12% Terrorism 11% 9% 10% 15% The economy 39% 36% 41% 35% Other 3% 1% 4% 2% No opinion 3% 3% 3% 6% Sampling Error +/-3.0 +/-7.0 +/-3.5 +/-8.5 * percentage less than 1%

POLL -45- October 3-10, 2015
3
Nevada CNN/ORC International Poll -- October 3 to 10, 2015 Question 5 Which of the following issues will be MOST important to you when you decide how to vote for president? Base = Republican likely caucus goers White White Total Men Women White Non-White Men Women ----- ----- ----- ----- --------- ------ ------ Foreign policy 12% 13% N/A 9% N/A 9% N/A Illegal immigration 14% 15% N/A 10% N/A 14% N/A Health care 3% 2% N/A 3% N/A 3% N/A Social issues 8% 8% N/A 8% N/A 6% N/A Terrorism 22% 22% N/A 24% N/A 25% N/A The economy 39% 38% N/A 44% N/A 43% N/A Other 1% * N/A 1% N/A * N/A No opinion 1% 1% N/A 1% N/A * N/A Sampling Error +/-6.0 +/-7.5 +/-6.5 +/-8.5 18- 35- 50- Under 50 and Total 34 49 64 65+ 50 Older ----- ----- ----- ----- ----- ----- ------ Foreign policy 12% N/A N/A N/A N/A N/A 13% Illegal immigration 14% N/A N/A N/A N/A N/A 17% Health care 3% N/A N/A N/A N/A N/A 2% Social issues 8% N/A N/A N/A N/A N/A 5% Terrorism 22% N/A N/A N/A N/A N/A 28% The economy 39% N/A N/A N/A N/A N/A 33% Other 1% N/A N/A N/A N/A N/A 1% No opinion 1% N/A N/A N/A N/A N/A 2% Sampling Error +/-6.0 +/-7.0 Under $50K No Attended Sub- Total $50K or more College College Urban urban Rural ----- ----- ------- ------- -------- ----- ----- ----- Foreign policy 12% N/A 12% N/A 16% 13% N/A N/A Illegal immigration 14% N/A 16% N/A 16% 13% N/A N/A Health care 3% N/A 2% N/A 2% 4% N/A N/A Social issues 8% N/A 11% N/A 5% 9% N/A N/A Terrorism 22% N/A 23% N/A 16% 18% N/A N/A The economy 39% N/A 35% N/A 44% 42% N/A N/A Other 1% N/A * N/A 1% * N/A N/A No opinion 1% N/A * N/A 1% 1% N/A N/A Sampling Error +/-6.0 +/-7.5 +/-6.5 +/-8.5 Demo- Indep- Repub- Lib- Mod- Conser- Total crat endent lican eral erate vative ----- ----- ------ ------ ----- ----- ------- Foreign policy 12% N/A N/A 12% N/A N/A 11% Illegal immigration 14% N/A N/A 13% N/A N/A 20% Health care 3% N/A N/A 4% N/A N/A 3% Social issues 8% N/A N/A 7% N/A N/A 5% Terrorism 22% N/A N/A 25% N/A N/A 20% The economy 39% N/A N/A 37% N/A N/A 38% Other 1% N/A N/A 1% N/A N/A 1% No opinion 1% N/A N/A 1% N/A N/A 2% Sampling Error +/-6.0 +/-7.0 +/-7.0 Rest Washoe Clark of Total County County state ----- ------ ------ ----- Foreign policy 12% N/A 13% N/A Illegal immigration 14% N/A 11% N/A Health care 3% N/A 4% N/A Social issues 8% N/A 7% N/A Terrorism 22% N/A 23% N/A The economy 39% N/A 40% N/A Other 1% N/A 1% N/A No opinion 1% N/A 1% N/A Sampling Error +/-6.0 +/-7.0 * percentage less than 1%
POLL -46- October 3-10, 2015
3
South Carolina CNN/ORC International Poll -- October 3 to 10, 2015 Question RP1 If the Republican presidential primary in South Carolina were held today, please tell me which of the following people you would be most likely to support. Base = Republican likely voters White White Total Men Women White Non-White Men Women ----- ----- ----- ----- --------- ------ ------ Jeb Bush 6% 6% 6% 6% N/A 6% 6% Ben Carson 18% 15% 21% 18% N/A 13% 24% Chris Christie 2% 2% 1% 2% N/A 2% 1% Ted Cruz 5% 5% 5% 5% N/A 5% 5% Carly Fiorina 7% 6% 7% 7% N/A 7% 8% Lindsey Graham 5% 5% 5% 4% N/A 5% 2% Mike Huckabee 3% 4% 2% 3% N/A 4% 2% Bobby Jindal * * * * N/A * * John Kasich 1% 2% * 1% N/A 2% * George Pataki * * * * N/A * * Rand Paul 4% 5% 3% 4% N/A 5% 4% Marco Rubio 9% 9% 9% 9% N/A 9% 10% Rick Santorum 1% * 1% 1% N/A * 1% Donald Trump 36% 35% 37% 35% N/A 36% 34% Jim Gilmore * * * * N/A * * Someone else * * * * N/A * * None/No one 1% * 1% 1% N/A * 1% No opinion 4% 6% 2% 4% N/A 6% 2% Sampling Error +/-4.5 +/-6.0 +/-6.5 +/-4.5 +/-6.0 +/-6.5 18- 35- 50- Under 50 and Total 34 49 64 65+ 50 Older ----- ----- ----- ----- ----- ----- ------ Jeb Bush 6% N/A N/A 5% 10% N/A 7% Ben Carson 18% N/A N/A 15% 11% N/A 13% Chris Christie 2% N/A N/A * 3% N/A 2% Ted Cruz 5% N/A N/A 3% 6% N/A 4% Carly Fiorina 7% N/A N/A 12% 7% N/A 10% Lindsey Graham 5% N/A N/A 10% 5% N/A 7% Mike Huckabee 3% N/A N/A 3% 1% N/A 2% Bobby Jindal * N/A N/A 1% * N/A * John Kasich 1% N/A N/A 2% 2% N/A 2% George Pataki * N/A N/A * * N/A * Rand Paul 4% N/A N/A 2% 1% N/A 2% Marco Rubio 9% N/A N/A 13% 13% N/A 13% Rick Santorum 1% N/A N/A * * N/A * Donald Trump 36% N/A N/A 32% 35% N/A 34% Jim Gilmore * N/A N/A * * N/A * Someone else * N/A N/A * * N/A * None/No one 1% N/A N/A * 1% N/A * No opinion 4% N/A N/A 3% 4% N/A 3% Sampling Error +/-4.5 +/-8.0 +/-6.0 +/-5.0 * percentage less than 1%

POLL -47- October 3-10, 2015
3
South Carolina CNN/ORC International Poll -- October 3 to 10, 2015 Question RP1 If the Republican presidential primary in South Carolina were held today, please tell me which of the following people you would be most likely to support. Base = Republican likely voters Under $50K No Attended Sub- Total $50K or more College College Urban urban Rural ----- ----- ------- ------- -------- ----- ----- ----- Jeb Bush 6% 8% 5% 6% 6% N/A 5% 7% Ben Carson 18% 12% 27% 13% 22% N/A 20% 18% Chris Christie 2% 2% 1% 1% 2% N/A 1% 2% Ted Cruz 5% 5% 4% 2% 7% N/A 5% 7% Carly Fiorina 7% 3% 11% 1% 11% N/A 7% 9% Lindsey Graham 5% 9% 2% 11% 2% N/A 5% 1% Mike Huckabee 3% 4% 2% 4% 2% N/A 4% 4% Bobby Jindal * * * * * N/A * 1% John Kasich 1% * 1% * 1% N/A 1% * George Pataki * * * * * N/A * * Rand Paul 4% 5% 2% 3% 5% N/A 1% 8% Marco Rubio 9% 5% 12% 7% 9% N/A 12% 4% Rick Santorum 1% 1% * * 1% N/A * * Donald Trump 36% 41% 26% 49% 27% N/A 36% 38% Jim Gilmore * * * * * N/A * * Someone else * * * * * N/A * * None/No one 1% * 2% * 1% N/A * * No opinion 4% 4% 3% 3% 4% N/A 3% 2% Sampling Error +/-4.5 +/-7.5 +/-6.0 +/-8.0 +/-5.0 +/-6.0 +/-8.0 Demo- Indep- Repub- Lib- Mod- Conser- Total crat endent lican eral erate vative ----- ----- ------ ------ ----- ----- ------- Jeb Bush 6% N/A 3% 8% N/A 9% 5% Ben Carson 18% N/A 13% 22% N/A 13% 21% Chris Christie 2% N/A 3% 1% N/A 1% 1% Ted Cruz 5% N/A 8% 3% N/A 1% 7% Carly Fiorina 7% N/A 10% 5% N/A 13% 5% Lindsey Graham 5% N/A 5% 2% N/A 6% 4% Mike Huckabee 3% N/A 2% 3% N/A * 4% Bobby Jindal * N/A 1% * N/A * * John Kasich 1% N/A 2% * N/A 1% 1% George Pataki * N/A * * N/A * * Rand Paul 4% N/A 9% 1% N/A 5% 4% Marco Rubio 9% N/A 6% 11% N/A 9% 9% Rick Santorum 1% N/A * 1% N/A 2% * Donald Trump 36% N/A 32% 39% N/A 37% 34% Jim Gilmore * N/A * * N/A * * Someone else * N/A * * N/A * * None/No one 1% N/A 1% 1% N/A * 1% No opinion 4% N/A 6% 2% N/A 3% 4% Sampling Error +/-4.5 +/-7.5 +/-5.5 +/-8.0 +/-5.5 * percentage less than 1%

POLL -48- October 3-10, 2015
3
South Carolina CNN/ORC International Poll -- October 3 to 10, 2015 Question RP1 If the Republican presidential primary in South Carolina were held today, please tell me which of the following people you would be most likely to support. Base = Republican likely voters Pee Dee/ Low Total Upcountry Piedmont Central Waccamaw Country ----- --------- -------- ------- -------- ------- Jeb Bush 6% 3% N/A 4% N/A N/A Ben Carson 18% 19% N/A 20% N/A N/A Chris Christie 2% 1% N/A 3% N/A N/A Ted Cruz 5% 3% N/A 4% N/A N/A Carly Fiorina 7% 7% N/A 8% N/A N/A Lindsey Graham 5% 2% N/A 10% N/A N/A Mike Huckabee 3% 6% N/A 2% N/A N/A Bobby Jindal * * N/A * N/A N/A John Kasich 1% 1% N/A 2% N/A N/A George Pataki * * N/A * N/A N/A Rand Paul 4% 2% N/A 5% N/A N/A Marco Rubio 9% 9% N/A 9% N/A N/A Rick Santorum 1% * N/A 2% N/A N/A Donald Trump 36% 41% N/A 27% N/A N/A Jim Gilmore * * N/A * N/A N/A Someone else * * N/A * N/A N/A None/No one 1% * N/A 2% N/A N/A No opinion 4% 6% N/A 2% N/A N/A Sampling Error +/-4.5 +/-8.0 +/-8.5 * percentage less than 1%

POLL -49- October 3-10, 2015
3
South Carolina CNN/ORC International Poll -- October 3 to 10, 2015 Question RP2 Have you definitely decided who you will support in the South Carolina Republican primary, are you leaning toward someone, or have you considered some candidates but are still trying to decide? Base = Republican likely voters White White Total Men Women White Non-White Men Women ----- ----- ----- ----- --------- ------ ------ Definitely decided 19% 21% 16% 18% N/A 22% 15% Leaning toward someone 21% 25% 16% 20% N/A 23% 16% Still trying to decide 60% 53% 68% 62% N/A 54% 69% No opinion * 1% * * N/A 1% * Sampling Error +/-4.5 +/-6.0 +/-6.5 +/-4.5 +/-6.0 +/-6.5 18- 35- 50- Under 50 and Total 34 49 64 65+ 50 Older ----- ----- ----- ----- ----- ----- ------ Definitely decided 19% N/A N/A 14% 23% N/A 18% Leaning toward someone 21% N/A N/A 25% 17% N/A 21% Still trying to decide 60% N/A N/A 61% 59% N/A 60% No opinion * N/A N/A * 1% N/A 1% Sampling Error +/-4.5 +/-8.0 +/-6.0 +/-5.0 Under $50K No Attended Sub- Total $50K or more College College Urban urban Rural ----- ----- ------- ------- -------- ----- ----- ----- Definitely decided 19% 18% 19% 17% 20% N/A 21% 16% Leaning toward someone 21% 15% 27% 16% 23% N/A 26% 20% Still trying to decide 60% 67% 54% 67% 56% N/A 53% 64% No opinion * * * * * N/A * * Sampling Error +/-4.5 +/-7.5 +/-6.0 +/-8.0 +/-5.0 +/-6.0 +/-8.0 Demo- Indep- Repub- Lib- Mod- Conser- Total crat endent lican eral erate vative ----- ----- ------ ------ ----- ----- ------- Definitely decided 19% N/A 19% 18% N/A 10% 22% Leaning toward someone 21% N/A 23% 19% N/A 15% 22% Still trying to decide 60% N/A 57% 62% N/A 73% 56% No opinion * N/A * * N/A 1% * Sampling Error +/-4.5 +/-7.5 +/-5.5 +/-8.0 +/-5.5 Pee Dee/ Low Total Upcountry Piedmont Central Waccamaw Country ----- --------- -------- ------- -------- ------- Definitely decided 19% 16% N/A 16% N/A N/A Leaning toward someone 21% 25% N/A 20% N/A N/A Still trying to decide 60% 59% N/A 64% N/A N/A No opinion * * N/A 1% N/A N/A Sampling Error +/-4.5 +/-8.0 +/-8.5 * percentage less than 1%

POLL -50- October 3-10, 2015
3
South Carolina CNN/ORC International Poll -- October 3 to 10, 2015 Question RP3A Now I'm going to mention a few issues and for each one, please tell me which Republican candidate you think would best handle that issue if he or she were elected President. Please feel free to name a candidate even if you may not be voting for that person. Which Republican candidate do you think would do the best job handling: A. The economy Base = Republican likely voters White White Total Men Women White Non-White Men Women ----- ----- ----- ----- --------- ------ ------ Jeb Bush 7% 9% 6% 8% N/A 9% 6% Ben Carson 7% 8% 6% 8% N/A 8% 7% Chris Christie 1% 1% 1% 1% N/A 2% 1% Ted Cruz 3% 3% 3% 3% N/A 3% 3% Carly Fiorina 6% 7% 6% 7% N/A 7% 6% Lindsey Graham 3% 2% 4% 2% N/A 1% 4% Mike Huckabee * * * * N/A * * Bobby Jindal * 1% * * N/A 1% * John Kasich 1% 2% 1% 1% N/A 2% 1% George Pataki * * * * N/A * * Rand Paul 5% 3% 6% 5% N/A 3% 7% Marco Rubio 3% 2% 4% 3% N/A 2% 4% Rick Santorum * * * * N/A * * Donald Trump 59% 60% 58% 57% N/A 59% 56% Jim Gilmore * * * * N/A * * Someone else * * * * N/A * * None/No one 1% 1% 1% 1% N/A 1% 2% No opinion 3% 1% 4% 3% N/A 1% 4% Sampling Error +/-4.5 +/-6.0 +/-6.5 +/-4.5 +/-6.0 +/-6.5 18- 35- 50- Under 50 and Total 34 49 64 65+ 50 Older ----- ----- ----- ----- ----- ----- ------ Jeb Bush 7% N/A N/A 7% 12% N/A 9% Ben Carson 7% N/A N/A 10% 4% N/A 7% Chris Christie 1% N/A N/A * 2% N/A 1% Ted Cruz 3% N/A N/A * 2% N/A 1% Carly Fiorina 6% N/A N/A 12% 7% N/A 9% Lindsey Graham 3% N/A N/A 3% 2% N/A 3% Mike Huckabee * N/A N/A * 1% N/A 1% Bobby Jindal * N/A N/A * * N/A * John Kasich 1% N/A N/A 1% 3% N/A 2% George Pataki * N/A N/A * * N/A * Rand Paul 5% N/A N/A 2% 2% N/A 2% Marco Rubio 3% N/A N/A 3% 8% N/A 5% Rick Santorum * N/A N/A * * N/A * Donald Trump 59% N/A N/A 58% 51% N/A 55% Jim Gilmore * N/A N/A * * N/A * Someone else * N/A N/A * * N/A * None/No one 1% N/A N/A 1% 1% N/A 1% No opinion 3% N/A N/A 3% 4% N/A 3% Sampling Error +/-4.5 +/-8.0 +/-6.0 +/-5.0 * percentage less than 1%

POLL -51- October 3-10, 2015
3
South Carolina CNN/ORC International Poll -- October 3 to 10, 2015 Question RP3A Now I'm going to mention a few issues and for each one, please tell me which Republican candidate you think would best handle that issue if he or she were elected President. Please feel free to name a candidate even if you may not be voting for that person. Which Republican candidate do you think would do the best job handling: A. The economy Base = Republican likely voters Under $50K No Attended Sub- Total $50K or more College College Urban urban Rural ----- ----- ------- ------- -------- ----- ----- ----- Jeb Bush 7% 9% 6% 7% 8% N/A 8% 10% Ben Carson 7% 3% 12% 3% 9% N/A 5% 10% Chris Christie 1% 1% 1% * 1% N/A 1% * Ted Cruz 3% 2% 2% 3% 3% N/A 2% 7% Carly Fiorina 6% 4% 10% 2% 9% N/A 7% 6% Lindsey Graham 3% 2% 4% 4% 2% N/A 3% 3% Mike Huckabee * * * 1% * N/A * * Bobby Jindal * * 1% * 1% N/A 1% * John Kasich 1% * 2% * 2% N/A 2% * George Pataki * * * * * N/A * * Rand Paul 5% 7% 1% 1% 7% N/A 1% 7% Marco Rubio 3% 1% 5% 3% 3% N/A 3% 2% Rick Santorum * * * * * N/A * * Donald Trump 59% 66% 53% 75% 49% N/A 66% 52% Jim Gilmore * * * * * N/A * * Someone else * * * * * N/A * * None/No one 1% 2% * * 2% N/A 1% 1% No opinion 3% 2% 2% 1% 4% N/A 2% 2% Sampling Error +/-4.5 +/-7.5 +/-6.0 +/-8.0 +/-5.0 +/-6.0 +/-8.0 Demo- Indep- Repub- Lib- Mod- Conser- Total crat endent lican eral erate vative ----- ----- ------ ------ ----- ----- ------- Jeb Bush 7% N/A 5% 9% N/A 8% 8% Ben Carson 7% N/A 5% 8% N/A 4% 9% Chris Christie 1% N/A 1% 1% N/A * 1% Ted Cruz 3% N/A 4% 3% N/A * 5% Carly Fiorina 6% N/A 9% 4% N/A 12% 4% Lindsey Graham 3% N/A 3% 2% N/A 3% 2% Mike Huckabee * N/A * * N/A * * Bobby Jindal * N/A * 1% N/A * 1% John Kasich 1% N/A 2% * N/A 2% 1% George Pataki * N/A * * N/A * * Rand Paul 5% N/A 11% * N/A 7% 4% Marco Rubio 3% N/A 3% 3% N/A 4% 3% Rick Santorum * N/A * * N/A * * Donald Trump 59% N/A 55% 62% N/A 53% 61% Jim Gilmore * N/A * * N/A * * Someone else * N/A * * N/A * * None/No one 1% N/A 1% 2% N/A 3% 1% No opinion 3% N/A 1% 4% N/A 5% 1% Sampling Error +/-4.5 +/-7.5 +/-5.5 +/-8.0 +/-5.5 * percentage less than 1%
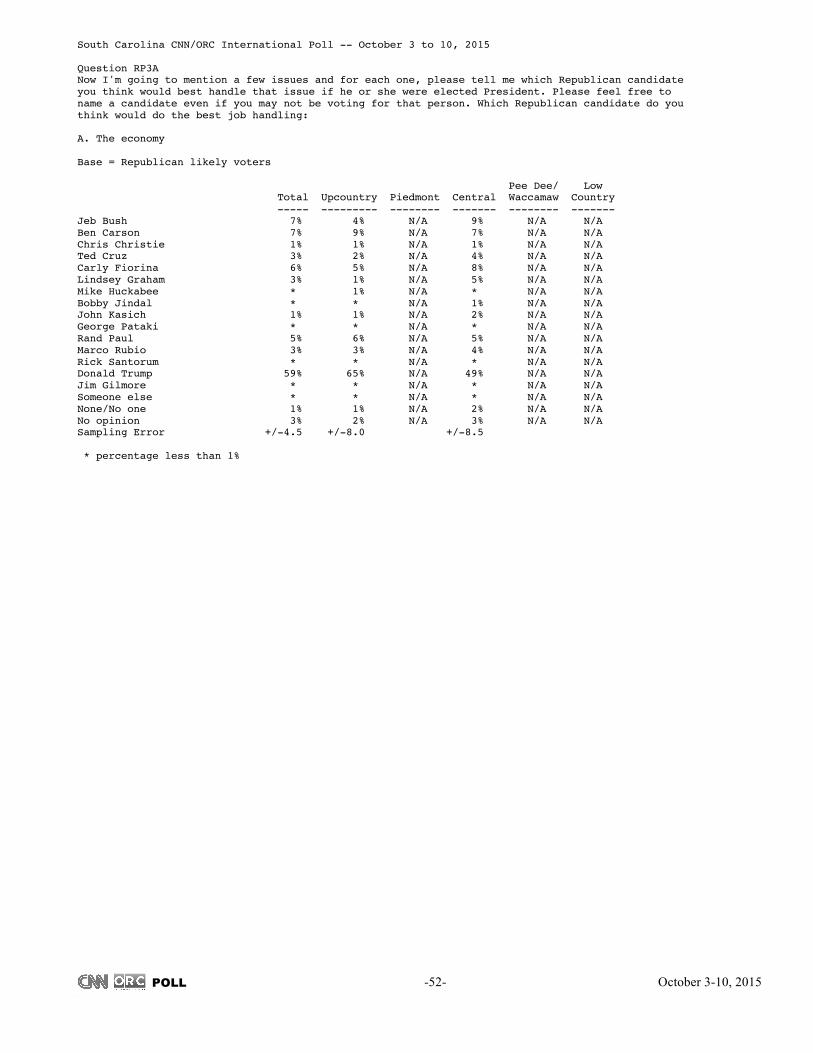
POLL -52- October 3-10, 2015
3
South Carolina CNN/ORC International Poll -- October 3 to 10, 2015 Question RP3A Now I'm going to mention a few issues and for each one, please tell me which Republican candidate you think would best handle that issue if he or she were elected President. Please feel free to name a candidate even if you may not be voting for that person. Which Republican candidate do you think would do the best job handling: A. The economy Base = Republican likely voters Pee Dee/ Low Total Upcountry Piedmont Central Waccamaw Country ----- --------- -------- ------- -------- ------- Jeb Bush 7% 4% N/A 9% N/A N/A Ben Carson 7% 9% N/A 7% N/A N/A Chris Christie 1% 1% N/A 1% N/A N/A Ted Cruz 3% 2% N/A 4% N/A N/A Carly Fiorina 6% 5% N/A 8% N/A N/A Lindsey Graham 3% 1% N/A 5% N/A N/A Mike Huckabee * 1% N/A * N/A N/A Bobby Jindal * * N/A 1% N/A N/A John Kasich 1% 1% N/A 2% N/A N/A George Pataki * * N/A * N/A N/A Rand Paul 5% 6% N/A 5% N/A N/A Marco Rubio 3% 3% N/A 4% N/A N/A Rick Santorum * * N/A * N/A N/A Donald Trump 59% 65% N/A 49% N/A N/A Jim Gilmore * * N/A * N/A N/A Someone else * * N/A * N/A N/A None/No one 1% 1% N/A 2% N/A N/A No opinion 3% 2% N/A 3% N/A N/A Sampling Error +/-4.5 +/-8.0 +/-8.5 * percentage less than 1%

POLL -53- October 3-10, 2015
3
South Carolina CNN/ORC International Poll -- October 3 to 10, 2015 Question RP3B Now I'm going to mention a few issues and for each one, please tell me which Republican candidate you think would best handle that issue if he or she were elected President. Please feel free to name a candidate even if you may not be voting for that person. Which Republican candidate do you think would do the best job handling: B. Illegal immigration Base = Republican likely voters White White Total Men Women White Non-White Men Women ----- ----- ----- ----- --------- ------ ------ Jeb Bush 8% 6% 10% 8% N/A 7% 9% Ben Carson 7% 8% 6% 7% N/A 7% 6% Chris Christie 2% 1% 2% 2% N/A 2% 3% Ted Cruz 7% 9% 5% 7% N/A 8% 5% Carly Fiorina 1% 1% 2% 1% N/A 1% 2% Lindsey Graham 3% 3% 4% 2% N/A 2% 1% Mike Huckabee * 1% * 1% N/A 1% * Bobby Jindal * * * * N/A * * John Kasich * 1% * * N/A 1% * George Pataki * * * * N/A * * Rand Paul 3% 2% 3% 3% N/A 3% 3% Marco Rubio 11% 8% 15% 12% N/A 8% 17% Rick Santorum * * * * N/A * * Donald Trump 51% 56% 45% 50% N/A 56% 44% Jim Gilmore * * * * N/A * * Someone else 1% * 2% 1% N/A * 2% None/No one 2% 3% 1% 2% N/A 3% 2% No opinion 4% 3% 4% 4% N/A 3% 5% Sampling Error +/-4.5 +/-6.0 +/-6.5 +/-4.5 +/-6.0 +/-6.5 18- 35- 50- Under 50 and Total 34 49 64 65+ 50 Older ----- ----- ----- ----- ----- ----- ------ Jeb Bush 8% N/A N/A 8% 9% N/A 9% Ben Carson 7% N/A N/A 7% 4% N/A 6% Chris Christie 2% N/A N/A * 5% N/A 2% Ted Cruz 7% N/A N/A 4% 5% N/A 4% Carly Fiorina 1% N/A N/A 1% 1% N/A 1% Lindsey Graham 3% N/A N/A 5% 2% N/A 4% Mike Huckabee * N/A N/A 1% 1% N/A 1% Bobby Jindal * N/A N/A * * N/A * John Kasich * N/A N/A * 1% N/A 1% George Pataki * N/A N/A * * N/A * Rand Paul 3% N/A N/A 1% 1% N/A 1% Marco Rubio 11% N/A N/A 15% 14% N/A 15% Rick Santorum * N/A N/A * * N/A * Donald Trump 51% N/A N/A 49% 52% N/A 50% Jim Gilmore * N/A N/A * * N/A * Someone else 1% N/A N/A * * N/A * None/No one 2% N/A N/A 4% 1% N/A 3% No opinion 4% N/A N/A 3% 4% N/A 4% Sampling Error +/-4.5 +/-8.0 +/-6.0 +/-5.0 * percentage less than 1%

POLL -54- October 3-10, 2015
3
South Carolina CNN/ORC International Poll -- October 3 to 10, 2015 Question RP3B Now I'm going to mention a few issues and for each one, please tell me which Republican candidate you think would best handle that issue if he or she were elected President. Please feel free to name a candidate even if you may not be voting for that person. Which Republican candidate do you think would do the best job handling: B. Illegal immigration Base = Republican likely voters Under $50K No Attended Sub- Total $50K or more College College Urban urban Rural ----- ----- ------- ------- -------- ----- ----- ----- Jeb Bush 8% 6% 9% 2% 11% N/A 6% 10% Ben Carson 7% 5% 10% 7% 7% N/A 6% 9% Chris Christie 2% 2% 2% 2% 2% N/A 1% 2% Ted Cruz 7% 7% 7% 3% 9% N/A 5% 10% Carly Fiorina 1% * 3% 2% 1% N/A 3% * Lindsey Graham 3% 5% 1% 7% 1% N/A 2% 1% Mike Huckabee * 1% * 1% * N/A 1% * Bobby Jindal * * * * * N/A * * John Kasich * * 1% * 1% N/A 1% * George Pataki * * * * * N/A * * Rand Paul 3% 2% 2% 1% 4% N/A 1% 4% Marco Rubio 11% 9% 15% 9% 13% N/A 14% 7% Rick Santorum * * * * * N/A * * Donald Trump 51% 50% 48% 63% 43% N/A 56% 54% Jim Gilmore * * * * * N/A * * Someone else 1% 2% * * 2% N/A * * None/No one 2% 4% * 3% 2% N/A * 1% No opinion 4% 5% 2% 1% 5% N/A 3% 2% Sampling Error +/-4.5 +/-7.5 +/-6.0 +/-8.0 +/-5.0 +/-6.0 +/-8.0 Demo- Indep- Repub- Lib- Mod- Conser- Total crat endent lican eral erate vative ----- ----- ------ ------ ----- ----- ------- Jeb Bush 8% N/A 8% 8% N/A 10% 7% Ben Carson 7% N/A 7% 7% N/A 9% 6% Chris Christie 2% N/A 3% 1% N/A 3% 1% Ted Cruz 7% N/A 9% 5% N/A 1% 10% Carly Fiorina 1% N/A 1% 2% N/A 4% * Lindsey Graham 3% N/A 2% 2% N/A 5% 2% Mike Huckabee * N/A 1% * N/A * 1% Bobby Jindal * N/A * * N/A * * John Kasich * N/A 1% * N/A 1% * George Pataki * N/A * * N/A * * Rand Paul 3% N/A 6% * N/A 5% 2% Marco Rubio 11% N/A 9% 13% N/A 10% 13% Rick Santorum * N/A * * N/A * * Donald Trump 51% N/A 46% 55% N/A 40% 55% Jim Gilmore * N/A * * N/A * * Someone else 1% N/A 2% * N/A 3% * None/No one 2% N/A 3% 1% N/A 3% 2% No opinion 4% N/A 3% 4% N/A 6% 2% Sampling Error +/-4.5 +/-7.5 +/-5.5 +/-8.0 +/-5.5 * percentage less than 1%

POLL -55- October 3-10, 2015
3
South Carolina CNN/ORC International Poll -- October 3 to 10, 2015 Question RP3B Now I'm going to mention a few issues and for each one, please tell me which Republican candidate you think would best handle that issue if he or she were elected President. Please feel free to name a candidate even if you may not be voting for that person. Which Republican candidate do you think would do the best job handling: B. Illegal immigration Base = Republican likely voters Pee Dee/ Low Total Upcountry Piedmont Central Waccamaw Country ----- --------- -------- ------- -------- ------- Jeb Bush 8% 6% N/A 10% N/A N/A Ben Carson 7% 7% N/A 4% N/A N/A Chris Christie 2% 1% N/A 3% N/A N/A Ted Cruz 7% 7% N/A 6% N/A N/A Carly Fiorina 1% 1% N/A 1% N/A N/A Lindsey Graham 3% 1% N/A 5% N/A N/A Mike Huckabee * 1% N/A * N/A N/A Bobby Jindal * * N/A * N/A N/A John Kasich * 2% N/A * N/A N/A George Pataki * * N/A * N/A N/A Rand Paul 3% 1% N/A 6% N/A N/A Marco Rubio 11% 9% N/A 12% N/A N/A Rick Santorum * * N/A * N/A N/A Donald Trump 51% 57% N/A 46% N/A N/A Jim Gilmore * * N/A * N/A N/A Someone else 1% 4% N/A * N/A N/A None/No one 2% 1% N/A 4% N/A N/A No opinion 4% 3% N/A 3% N/A N/A Sampling Error +/-4.5 +/-8.0 +/-8.5 * percentage less than 1%

POLL -56- October 3-10, 2015
3
South Carolina CNN/ORC International Poll -- October 3 to 10, 2015 Question RP3C Now I'm going to mention a few issues and for each one, please tell me which Republican candidate you think would best handle that issue if he or she were elected President. Please feel free to name a candidate even if you may not be voting for that person. Which Republican candidate do you think would do the best job handling: C. Foreign policy Base = Republican likely voters White White Total Men Women White Non-White Men Women ----- ----- ----- ----- --------- ------ ------ Jeb Bush 14% 14% 13% 15% N/A 16% 14% Ben Carson 9% 10% 8% 9% N/A 10% 8% Chris Christie 2% 1% 3% 2% N/A 1% 2% Ted Cruz 5% 7% 3% 5% N/A 7% 4% Carly Fiorina 5% 6% 4% 5% N/A 6% 4% Lindsey Graham 10% 8% 11% 9% N/A 8% 10% Mike Huckabee 1% 1% 1% 1% N/A 1% 1% Bobby Jindal * 1% * 1% N/A 1% * John Kasich * * * * N/A * * George Pataki * * * * N/A * * Rand Paul 6% 5% 6% 5% N/A 4% 7% Marco Rubio 13% 13% 12% 13% N/A 13% 13% Rick Santorum * 1% * * N/A 1% * Donald Trump 27% 26% 28% 25% N/A 25% 26% Jim Gilmore 1% 1% * 1% N/A 1% * Someone else 1% * 2% 1% N/A * 2% None/No one 2% 2% 1% 1% N/A 1% 2% No opinion 6% 5% 7% 6% N/A 5% 7% Sampling Error +/-4.5 +/-6.0 +/-6.5 +/-4.5 +/-6.0 +/-6.5 18- 35- 50- Under 50 and Total 34 49 64 65+ 50 Older ----- ----- ----- ----- ----- ----- ------ Jeb Bush 14% N/A N/A 12% 15% N/A 14% Ben Carson 9% N/A N/A 11% 4% N/A 7% Chris Christie 2% N/A N/A * 2% N/A 1% Ted Cruz 5% N/A N/A 4% 4% N/A 4% Carly Fiorina 5% N/A N/A 8% 5% N/A 7% Lindsey Graham 10% N/A N/A 11% 11% N/A 11% Mike Huckabee 1% N/A N/A 2% 1% N/A 2% Bobby Jindal * N/A N/A * 2% N/A 1% John Kasich * N/A N/A * 1% N/A * George Pataki * N/A N/A * * N/A * Rand Paul 6% N/A N/A 4% 2% N/A 3% Marco Rubio 13% N/A N/A 17% 20% N/A 19% Rick Santorum * N/A N/A * * N/A * Donald Trump 27% N/A N/A 21% 27% N/A 24% Jim Gilmore 1% N/A N/A * * N/A * Someone else 1% N/A N/A * * N/A * None/No one 2% N/A N/A 1% 2% N/A 1% No opinion 6% N/A N/A 9% 4% N/A 6% Sampling Error +/-4.5 +/-8.0 +/-6.0 +/-5.0 * percentage less than 1%

POLL -57- October 3-10, 2015
3
South Carolina CNN/ORC International Poll -- October 3 to 10, 2015 Question RP3C Now I'm going to mention a few issues and for each one, please tell me which Republican candidate you think would best handle that issue if he or she were elected President. Please feel free to name a candidate even if you may not be voting for that person. Which Republican candidate do you think would do the best job handling: C. Foreign policy Base = Republican likely voters Under $50K No Attended Sub- Total $50K or more College College Urban urban Rural ----- ----- ------- ------- -------- ----- ----- ----- Jeb Bush 14% 19% 11% 14% 14% N/A 13% 16% Ben Carson 9% 6% 13% 7% 10% N/A 10% 8% Chris Christie 2% 1% 2% 3% 1% N/A 1% * Ted Cruz 5% 2% 7% 3% 6% N/A 6% 4% Carly Fiorina 5% * 10% 2% 7% N/A 4% 7% Lindsey Graham 10% 10% 10% 11% 9% N/A 9% 10% Mike Huckabee 1% 2% * 1% 1% N/A 1% 1% Bobby Jindal * * * * 1% N/A 1% * John Kasich * * * * * N/A * * George Pataki * * * * * N/A * * Rand Paul 6% 8% 2% 4% 7% N/A 1% 11% Marco Rubio 13% 6% 18% 6% 16% N/A 15% 8% Rick Santorum * * 1% * * N/A * * Donald Trump 27% 31% 19% 43% 17% N/A 30% 30% Jim Gilmore 1% * 1% * 1% N/A * * Someone else 1% 2% * * 2% N/A * * None/No one 2% 1% 2% * 2% N/A 3% 1% No opinion 6% 10% 3% 6% 6% N/A 4% 3% Sampling Error +/-4.5 +/-7.5 +/-6.0 +/-8.0 +/-5.0 +/-6.0 +/-8.0 Demo- Indep- Repub- Lib- Mod- Conser- Total crat endent lican eral erate vative ----- ----- ------ ------ ----- ----- ------- Jeb Bush 14% N/A 12% 16% N/A 15% 14% Ben Carson 9% N/A 6% 10% N/A 8% 10% Chris Christie 2% N/A 1% 2% N/A * 1% Ted Cruz 5% N/A 5% 5% N/A * 7% Carly Fiorina 5% N/A 7% 3% N/A 6% 5% Lindsey Graham 10% N/A 5% 11% N/A 13% 8% Mike Huckabee 1% N/A 1% 1% N/A * 1% Bobby Jindal * N/A * 1% N/A * 1% John Kasich * N/A * * N/A 1% * George Pataki * N/A * * N/A * * Rand Paul 6% N/A 12% 1% N/A 5% 6% Marco Rubio 13% N/A 15% 12% N/A 10% 14% Rick Santorum * N/A * * N/A * * Donald Trump 27% N/A 25% 29% N/A 26% 28% Jim Gilmore 1% N/A 1% * N/A * * Someone else 1% N/A 2% * N/A 3% * None/No one 2% N/A 2% 1% N/A 2% 1% No opinion 6% N/A 5% 6% N/A 10% 4% Sampling Error +/-4.5 +/-7.5 +/-5.5 +/-8.0 +/-5.5 * percentage less than 1%
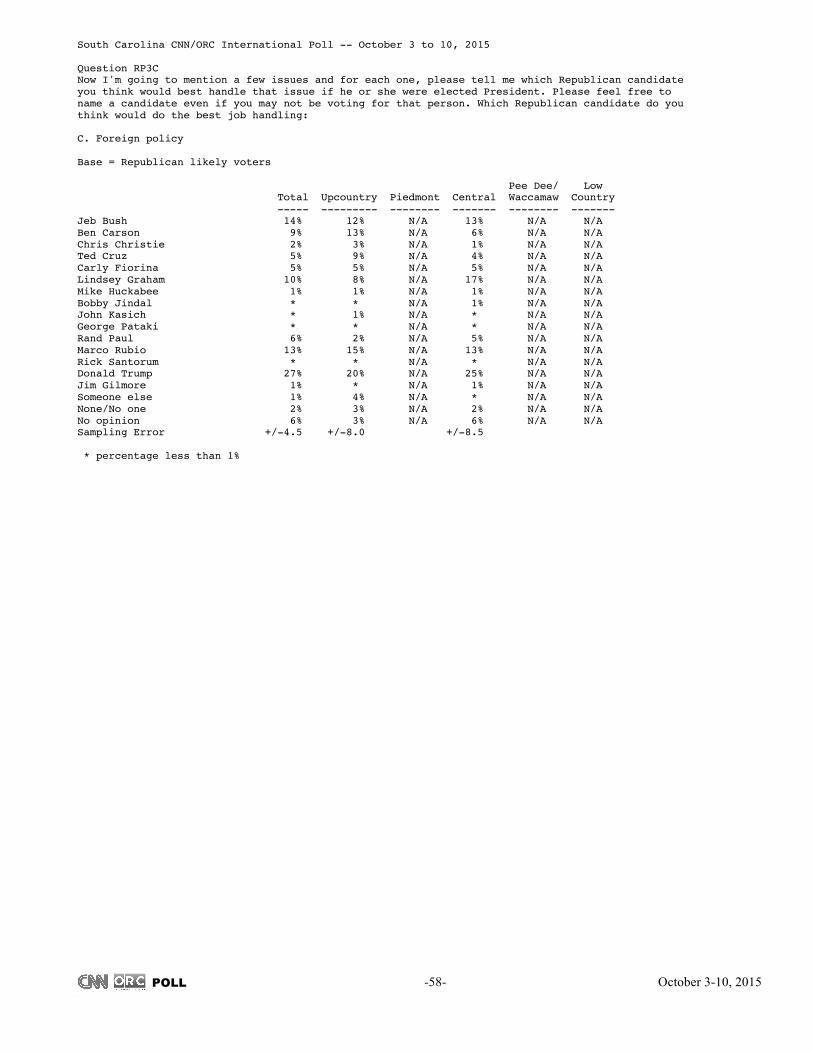
POLL -58- October 3-10, 2015
3
South Carolina CNN/ORC International Poll -- October 3 to 10, 2015 Question RP3C Now I'm going to mention a few issues and for each one, please tell me which Republican candidate you think would best handle that issue if he or she were elected President. Please feel free to name a candidate even if you may not be voting for that person. Which Republican candidate do you think would do the best job handling: C. Foreign policy Base = Republican likely voters Pee Dee/ Low Total Upcountry Piedmont Central Waccamaw Country ----- --------- -------- ------- -------- ------- Jeb Bush 14% 12% N/A 13% N/A N/A Ben Carson 9% 13% N/A 6% N/A N/A Chris Christie 2% 3% N/A 1% N/A N/A Ted Cruz 5% 9% N/A 4% N/A N/A Carly Fiorina 5% 5% N/A 5% N/A N/A Lindsey Graham 10% 8% N/A 17% N/A N/A Mike Huckabee 1% 1% N/A 1% N/A N/A Bobby Jindal * * N/A 1% N/A N/A John Kasich * 1% N/A * N/A N/A George Pataki * * N/A * N/A N/A Rand Paul 6% 2% N/A 5% N/A N/A Marco Rubio 13% 15% N/A 13% N/A N/A Rick Santorum * * N/A * N/A N/A Donald Trump 27% 20% N/A 25% N/A N/A Jim Gilmore 1% * N/A 1% N/A N/A Someone else 1% 4% N/A * N/A N/A None/No one 2% 3% N/A 2% N/A N/A No opinion 6% 3% N/A 6% N/A N/A Sampling Error +/-4.5 +/-8.0 +/-8.5 * percentage less than 1%

POLL -59- October 3-10, 2015
3
South Carolina CNN/ORC International Poll -- October 3 to 10, 2015 Question RP3D Now I'm going to mention a few issues and for each one, please tell me which Republican candidate you think would best handle that issue if he or she were elected President. Please feel free to name a candidate even if you may not be voting for that person. Which Republican candidate do you think would do the best job handling: D. Social issues, such as abortion and same-sex marriage Base = Republican likely voters White White Total Men Women White Non-White Men Women ----- ----- ----- ----- --------- ------ ------ Jeb Bush 6% 8% 5% 7% N/A 8% 5% Ben Carson 26% 24% 28% 27% N/A 23% 31% Chris Christie 2% 2% 3% 2% N/A 2% 3% Ted Cruz 5% 5% 6% 6% N/A 5% 7% Carly Fiorina 7% 6% 8% 8% N/A 7% 9% Lindsey Graham 2% 3% 2% 2% N/A 3% 1% Mike Huckabee 7% 8% 5% 7% N/A 9% 5% Bobby Jindal * * * * N/A * * John Kasich 2% 2% 2% 1% N/A 2% 1% George Pataki * * * * N/A * * Rand Paul 4% 4% 3% 4% N/A 4% 3% Marco Rubio 5% 6% 4% 5% N/A 6% 5% Rick Santorum 1% 1% 1% 1% N/A 1% * Donald Trump 22% 23% 21% 22% N/A 24% 19% Jim Gilmore * * * * N/A * * Someone else * 1% * * N/A 1% * None/No one 1% 1% 1% 1% N/A 1% 1% No opinion 8% 6% 10% 8% N/A 5% 11% Sampling Error +/-4.5 +/-6.0 +/-6.5 +/-4.5 +/-6.0 +/-6.5 18- 35- 50- Under 50 and Total 34 49 64 65+ 50 Older ----- ----- ----- ----- ----- ----- ------ Jeb Bush 6% N/A N/A 4% 11% N/A 8% Ben Carson 26% N/A N/A 22% 21% N/A 21% Chris Christie 2% N/A N/A 1% 3% N/A 2% Ted Cruz 5% N/A N/A 5% 5% N/A 5% Carly Fiorina 7% N/A N/A 8% 9% N/A 9% Lindsey Graham 2% N/A N/A 1% 3% N/A 2% Mike Huckabee 7% N/A N/A 9% 12% N/A 10% Bobby Jindal * N/A N/A * * N/A * John Kasich 2% N/A N/A 6% * N/A 3% George Pataki * N/A N/A * * N/A * Rand Paul 4% N/A N/A 5% 1% N/A 3% Marco Rubio 5% N/A N/A 5% 6% N/A 6% Rick Santorum 1% N/A N/A 1% * N/A 1% Donald Trump 22% N/A N/A 22% 20% N/A 21% Jim Gilmore * N/A N/A * * N/A * Someone else * N/A N/A * * N/A * None/No one 1% N/A N/A * 1% N/A 1% No opinion 8% N/A N/A 10% 7% N/A 9% Sampling Error +/-4.5 +/-8.0 +/-6.0 +/-5.0 * percentage less than 1%

POLL -60- October 3-10, 2015
3
South Carolina CNN/ORC International Poll -- October 3 to 10, 2015 Question RP3D Now I'm going to mention a few issues and for each one, please tell me which Republican candidate you think would best handle that issue if he or she were elected President. Please feel free to name a candidate even if you may not be voting for that person. Which Republican candidate do you think would do the best job handling: D. Social issues, such as abortion and same-sex marriage Base = Republican likely voters Under $50K No Attended Sub- Total $50K or more College College Urban urban Rural ----- ----- ------- ------- -------- ----- ----- ----- Jeb Bush 6% 8% 5% 1% 9% N/A 5% 8% Ben Carson 26% 19% 35% 19% 30% N/A 26% 28% Chris Christie 2% 3% 2% 2% 3% N/A 1% 3% Ted Cruz 5% 5% 5% 2% 8% N/A 6% 8% Carly Fiorina 7% 4% 11% 3% 10% N/A 7% 6% Lindsey Graham 2% 4% 1% 4% 1% N/A 3% 1% Mike Huckabee 7% 7% 6% 8% 6% N/A 11% 4% Bobby Jindal * * * * * N/A * * John Kasich 2% * 4% 3% 2% N/A 1% 4% George Pataki * * * * * N/A * * Rand Paul 4% 3% 3% 1% 5% N/A 1% 7% Marco Rubio 5% 5% 5% 5% 5% N/A 7% 3% Rick Santorum 1% * 1% 1% 1% N/A 1% 1% Donald Trump 22% 27% 15% 39% 12% N/A 25% 20% Jim Gilmore * * * * * N/A * * Someone else * * 1% * 1% N/A * 1% None/No one 1% 1% 1% 1% 1% N/A * * No opinion 8% 13% 4% 11% 6% N/A 5% 8% Sampling Error +/-4.5 +/-7.5 +/-6.0 +/-8.0 +/-5.0 +/-6.0 +/-8.0 Demo- Indep- Repub- Lib- Mod- Conser- Total crat endent lican eral erate vative ----- ----- ------ ------ ----- ----- ------- Jeb Bush 6% N/A 4% 8% N/A 5% 7% Ben Carson 26% N/A 24% 28% N/A 22% 30% Chris Christie 2% N/A 4% 1% N/A 3% 1% Ted Cruz 5% N/A 8% 3% N/A 1% 8% Carly Fiorina 7% N/A 7% 8% N/A 12% 5% Lindsey Graham 2% N/A 3% 2% N/A 1% 3% Mike Huckabee 7% N/A 7% 7% N/A 3% 9% Bobby Jindal * N/A * * N/A * * John Kasich 2% N/A 4% * N/A 6% * George Pataki * N/A * * N/A * * Rand Paul 4% N/A 9% * N/A 7% 2% Marco Rubio 5% N/A 5% 6% N/A 5% 5% Rick Santorum 1% N/A 2% * N/A 2% * Donald Trump 22% N/A 13% 27% N/A 19% 23% Jim Gilmore * N/A * * N/A * * Someone else * N/A * 1% N/A * 1% None/No one 1% N/A 1% 1% N/A 1% 1% No opinion 8% N/A 9% 7% N/A 12% 5% Sampling Error +/-4.5 +/-7.5 +/-5.5 +/-8.0 +/-5.5 * percentage less than 1%

POLL -61- October 3-10, 2015
3
South Carolina CNN/ORC International Poll -- October 3 to 10, 2015 Question RP3D Now I'm going to mention a few issues and for each one, please tell me which Republican candidate you think would best handle that issue if he or she were elected President. Please feel free to name a candidate even if you may not be voting for that person. Which Republican candidate do you think would do the best job handling: D. Social issues, such as abortion and same-sex marriage Base = Republican likely voters Pee Dee/ Low Total Upcountry Piedmont Central Waccamaw Country ----- --------- -------- ------- -------- ------- Jeb Bush 6% 1% N/A 8% N/A N/A Ben Carson 26% 31% N/A 25% N/A N/A Chris Christie 2% 1% N/A 3% N/A N/A Ted Cruz 5% 4% N/A 6% N/A N/A Carly Fiorina 7% 10% N/A 5% N/A N/A Lindsey Graham 2% 3% N/A 1% N/A N/A Mike Huckabee 7% 10% N/A 6% N/A N/A Bobby Jindal * * N/A * N/A N/A John Kasich 2% * N/A 2% N/A N/A George Pataki * * N/A * N/A N/A Rand Paul 4% 1% N/A 7% N/A N/A Marco Rubio 5% 7% N/A 3% N/A N/A Rick Santorum 1% 2% N/A 1% N/A N/A Donald Trump 22% 23% N/A 25% N/A N/A Jim Gilmore * * N/A * N/A N/A Someone else * * N/A 1% N/A N/A None/No one 1% 1% N/A 1% N/A N/A No opinion 8% 5% N/A 6% N/A N/A Sampling Error +/-4.5 +/-8.0 +/-8.5 * percentage less than 1%

POLL -62- October 3-10, 2015
3
South Carolina CNN/ORC International Poll -- October 3 to 10, 2015 Question RP3E Now I'm going to mention a few issues and for each one, please tell me which Republican candidate you think would best handle that issue if he or she were elected President. Please feel free to name a candidate even if you may not be voting for that person. Which Republican candidate do you think would do the best job handling: E. ISIS Base = Republican likely voters White White Total Men Women White Non-White Men Women ----- ----- ----- ----- --------- ------ ------ Jeb Bush 8% 11% 6% 9% N/A 12% 6% Ben Carson 8% 7% 10% 9% N/A 7% 11% Chris Christie 2% 1% 2% 2% N/A 2% 2% Ted Cruz 3% 4% 2% 3% N/A 4% 3% Carly Fiorina 5% 7% 4% 5% N/A 7% 3% Lindsey Graham 10% 10% 10% 10% N/A 10% 10% Mike Huckabee 2% 3% 2% 3% N/A 3% 2% Bobby Jindal * * * * N/A * * John Kasich * * * * N/A * * George Pataki * * * * N/A * * Rand Paul 6% 5% 7% 7% N/A 5% 8% Marco Rubio 6% 6% 5% 6% N/A 7% 6% Rick Santorum 1% * 1% 1% N/A * 1% Donald Trump 37% 39% 36% 34% N/A 36% 31% Jim Gilmore * * 1% * N/A * 1% Someone else * * * * N/A * * None/No one 3% 4% 3% 3% N/A 3% 3% No opinion 7% 3% 10% 7% N/A 3% 11% Sampling Error +/-4.5 +/-6.0 +/-6.5 +/-4.5 +/-6.0 +/-6.5 18- 35- 50- Under 50 and Total 34 49 64 65+ 50 Older ----- ----- ----- ----- ----- ----- ------ Jeb Bush 8% N/A N/A 9% 6% N/A 8% Ben Carson 8% N/A N/A 10% 4% N/A 7% Chris Christie 2% N/A N/A 1% 2% N/A 1% Ted Cruz 3% N/A N/A 3% 3% N/A 3% Carly Fiorina 5% N/A N/A 8% 6% N/A 7% Lindsey Graham 10% N/A N/A 5% 17% N/A 11% Mike Huckabee 2% N/A N/A 3% 2% N/A 3% Bobby Jindal * N/A N/A 1% * N/A * John Kasich * N/A N/A * * N/A * George Pataki * N/A N/A * * N/A * Rand Paul 6% N/A N/A 1% 2% N/A 1% Marco Rubio 6% N/A N/A 11% 9% N/A 10% Rick Santorum 1% N/A N/A * * N/A * Donald Trump 37% N/A N/A 38% 40% N/A 39% Jim Gilmore * N/A N/A * 1% N/A 1% Someone else * N/A N/A * 1% N/A * None/No one 3% N/A N/A 6% 2% N/A 4% No opinion 7% N/A N/A 4% 5% N/A 4% Sampling Error +/-4.5 +/-8.0 +/-6.0 +/-5.0 * percentage less than 1%
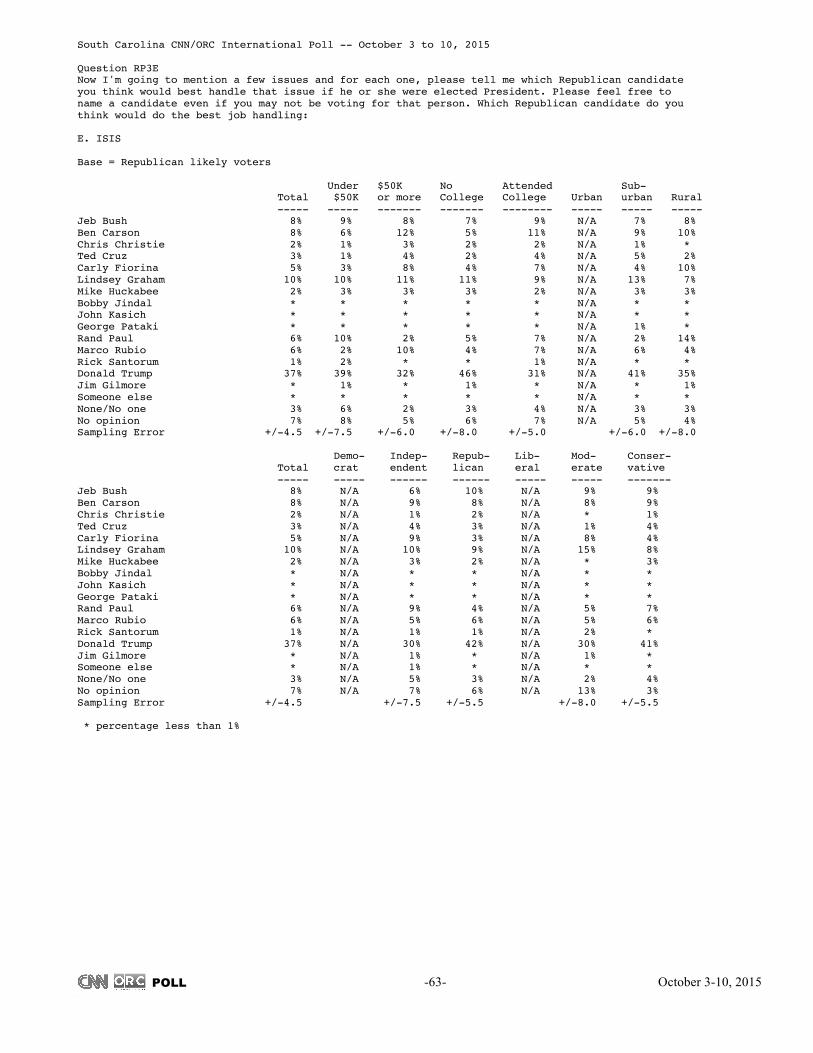
POLL -63- October 3-10, 2015
3
South Carolina CNN/ORC International Poll -- October 3 to 10, 2015 Question RP3E Now I'm going to mention a few issues and for each one, please tell me which Republican candidate you think would best handle that issue if he or she were elected President. Please feel free to name a candidate even if you may not be voting for that person. Which Republican candidate do you think would do the best job handling: E. ISIS Base = Republican likely voters Under $50K No Attended Sub- Total $50K or more College College Urban urban Rural ----- ----- ------- ------- -------- ----- ----- ----- Jeb Bush 8% 9% 8% 7% 9% N/A 7% 8% Ben Carson 8% 6% 12% 5% 11% N/A 9% 10% Chris Christie 2% 1% 3% 2% 2% N/A 1% * Ted Cruz 3% 1% 4% 2% 4% N/A 5% 2% Carly Fiorina 5% 3% 8% 4% 7% N/A 4% 10% Lindsey Graham 10% 10% 11% 11% 9% N/A 13% 7% Mike Huckabee 2% 3% 3% 3% 2% N/A 3% 3% Bobby Jindal * * * * * N/A * * John Kasich * * * * * N/A * * George Pataki * * * * * N/A 1% * Rand Paul 6% 10% 2% 5% 7% N/A 2% 14% Marco Rubio 6% 2% 10% 4% 7% N/A 6% 4% Rick Santorum 1% 2% * * 1% N/A * * Donald Trump 37% 39% 32% 46% 31% N/A 41% 35% Jim Gilmore * 1% * 1% * N/A * 1% Someone else * * * * * N/A * * None/No one 3% 6% 2% 3% 4% N/A 3% 3% No opinion 7% 8% 5% 6% 7% N/A 5% 4% Sampling Error +/-4.5 +/-7.5 +/-6.0 +/-8.0 +/-5.0 +/-6.0 +/-8.0 Demo- Indep- Repub- Lib- Mod- Conser- Total crat endent lican eral erate vative ----- ----- ------ ------ ----- ----- ------- Jeb Bush 8% N/A 6% 10% N/A 9% 9% Ben Carson 8% N/A 9% 8% N/A 8% 9% Chris Christie 2% N/A 1% 2% N/A * 1% Ted Cruz 3% N/A 4% 3% N/A 1% 4% Carly Fiorina 5% N/A 9% 3% N/A 8% 4% Lindsey Graham 10% N/A 10% 9% N/A 15% 8% Mike Huckabee 2% N/A 3% 2% N/A * 3% Bobby Jindal * N/A * * N/A * * John Kasich * N/A * * N/A * * George Pataki * N/A * * N/A * * Rand Paul 6% N/A 9% 4% N/A 5% 7% Marco Rubio 6% N/A 5% 6% N/A 5% 6% Rick Santorum 1% N/A 1% 1% N/A 2% * Donald Trump 37% N/A 30% 42% N/A 30% 41% Jim Gilmore * N/A 1% * N/A 1% * Someone else * N/A 1% * N/A * * None/No one 3% N/A 5% 3% N/A 2% 4% No opinion 7% N/A 7% 6% N/A 13% 3% Sampling Error +/-4.5 +/-7.5 +/-5.5 +/-8.0 +/-5.5 * percentage less than 1%

POLL -64- October 3-10, 2015
3
South Carolina CNN/ORC International Poll -- October 3 to 10, 2015 Question RP3E Now I'm going to mention a few issues and for each one, please tell me which Republican candidate you think would best handle that issue if he or she were elected President. Please feel free to name a candidate even if you may not be voting for that person. Which Republican candidate do you think would do the best job handling: E. ISIS Base = Republican likely voters Pee Dee/ Low Total Upcountry Piedmont Central Waccamaw Country ----- --------- -------- ------- -------- ------- Jeb Bush 8% 7% N/A 5% N/A N/A Ben Carson 8% 8% N/A 6% N/A N/A Chris Christie 2% 1% N/A 1% N/A N/A Ted Cruz 3% 5% N/A 2% N/A N/A Carly Fiorina 5% 4% N/A 5% N/A N/A Lindsey Graham 10% 8% N/A 15% N/A N/A Mike Huckabee 2% 4% N/A 3% N/A N/A Bobby Jindal * * N/A * N/A N/A John Kasich * * N/A * N/A N/A George Pataki * * N/A * N/A N/A Rand Paul 6% 2% N/A 8% N/A N/A Marco Rubio 6% 6% N/A 6% N/A N/A Rick Santorum 1% 1% N/A 2% N/A N/A Donald Trump 37% 36% N/A 39% N/A N/A Jim Gilmore * * N/A * N/A N/A Someone else * * N/A 1% N/A N/A None/No one 3% 3% N/A 6% N/A N/A No opinion 7% 13% N/A 2% N/A N/A Sampling Error +/-4.5 +/-8.0 +/-8.5 * percentage less than 1%

POLL -65- October 3-10, 2015
3
South Carolina CNN/ORC International Poll -- October 3 to 10, 2015 Question RP4A Now I`m going to read you a few phrases which describe the candidates, and for each one, tell me which Republican candidate you think that phrase best describes, regardless of who you are voting for. Which Republican candidate do you think: A. Best represents the values of Republicans like yourself Base = Republican likely voters White White Total Men Women White Non-White Men Women ----- ----- ----- ----- --------- ------ ------ Jeb Bush 10% 10% 10% 10% N/A 10% 10% Ben Carson 19% 16% 22% 19% N/A 15% 23% Chris Christie 3% 2% 3% 3% N/A 2% 4% Ted Cruz 6% 7% 5% 7% N/A 8% 6% Carly Fiorina 5% 4% 5% 5% N/A 4% 5% Lindsey Graham 7% 6% 9% 6% N/A 6% 6% Mike Huckabee 5% 6% 4% 5% N/A 6% 4% Bobby Jindal * 1% * * N/A 1% * John Kasich 1% 1% * 1% N/A 1% * George Pataki * * * * N/A * * Rand Paul 4% 7% 2% 5% N/A 7% 2% Marco Rubio 8% 7% 9% 8% N/A 6% 10% Rick Santorum 1% 2% * * N/A * * Donald Trump 25% 26% 25% 24% N/A 27% 23% Jim Gilmore * * * * N/A * * Someone else * * * * N/A * * None/No one 2% 3% 1% 2% N/A 3% 1% No opinion 4% 3% 4% 4% N/A 3% 4% Sampling Error +/-4.5 +/-6.0 +/-6.5 +/-4.5 +/-6.0 +/-6.5 18- 35- 50- Under 50 and Total 34 49 64 65+ 50 Older ----- ----- ----- ----- ----- ----- ------ Jeb Bush 10% N/A N/A 6% 10% N/A 8% Ben Carson 19% N/A N/A 22% 13% N/A 18% Chris Christie 3% N/A N/A * 3% N/A 2% Ted Cruz 6% N/A N/A 5% 6% N/A 5% Carly Fiorina 5% N/A N/A 5% 7% N/A 6% Lindsey Graham 7% N/A N/A 6% 8% N/A 7% Mike Huckabee 5% N/A N/A 4% 7% N/A 5% Bobby Jindal * N/A N/A * 2% N/A 1% John Kasich 1% N/A N/A 1% 2% N/A 1% George Pataki * N/A N/A * * N/A * Rand Paul 4% N/A N/A 6% 1% N/A 4% Marco Rubio 8% N/A N/A 9% 10% N/A 10% Rick Santorum 1% N/A N/A 1% * N/A 1% Donald Trump 25% N/A N/A 27% 23% N/A 25% Jim Gilmore * N/A N/A * * N/A * Someone else * N/A N/A * * N/A * None/No one 2% N/A N/A 4% 1% N/A 3% No opinion 4% N/A N/A 2% 7% N/A 5% Sampling Error +/-4.5 +/-8.0 +/-6.0 +/-5.0 * percentage less than 1%

POLL -66- October 3-10, 2015
3
South Carolina CNN/ORC International Poll -- October 3 to 10, 2015 Question RP4A Now I`m going to read you a few phrases which describe the candidates, and for each one, tell me which Republican candidate you think that phrase best describes, regardless of who you are voting for. Which Republican candidate do you think: A. Best represents the values of Republicans like yourself Base = Republican likely voters Under $50K No Attended Sub- Total $50K or more College College Urban urban Rural ----- ----- ------- ------- -------- ----- ----- ----- Jeb Bush 10% 15% 6% 3% 14% N/A 4% 12% Ben Carson 19% 14% 26% 13% 23% N/A 21% 17% Chris Christie 3% 1% 4% 2% 3% N/A 3% * Ted Cruz 6% 5% 7% 3% 9% N/A 8% 8% Carly Fiorina 5% 3% 6% 1% 7% N/A 4% 3% Lindsey Graham 7% 10% 5% 12% 4% N/A 8% 5% Mike Huckabee 5% 9% 1% 8% 3% N/A 6% 6% Bobby Jindal * * * * 1% N/A 1% * John Kasich 1% * 1% * 1% N/A 1% * George Pataki * * * * * N/A * * Rand Paul 4% 2% 6% 1% 6% N/A 2% 8% Marco Rubio 8% 6% 7% 8% 7% N/A 10% 6% Rick Santorum 1% 1% 2% 3% * N/A 2% * Donald Trump 25% 26% 23% 40% 16% N/A 26% 31% Jim Gilmore * * * * * N/A * * Someone else * * * * * N/A * * None/No one 2% 2% 2% 3% 2% N/A 1% 1% No opinion 4% 4% 2% 3% 4% N/A 2% 3% Sampling Error +/-4.5 +/-7.5 +/-6.0 +/-8.0 +/-5.0 +/-6.0 +/-8.0 Demo- Indep- Repub- Lib- Mod- Conser- Total crat endent lican eral erate vative ----- ----- ------ ------ ----- ----- ------- Jeb Bush 10% N/A 10% 10% N/A 13% 9% Ben Carson 19% N/A 19% 19% N/A 19% 20% Chris Christie 3% N/A 4% 2% N/A 4% * Ted Cruz 6% N/A 10% 4% N/A 1% 9% Carly Fiorina 5% N/A 4% 5% N/A 6% 4% Lindsey Graham 7% N/A 4% 7% N/A 12% 4% Mike Huckabee 5% N/A 5% 5% N/A 1% 7% Bobby Jindal * N/A * 1% N/A * 1% John Kasich 1% N/A 1% * N/A 1% 1% George Pataki * N/A * * N/A * * Rand Paul 4% N/A 10% 1% N/A 9% 3% Marco Rubio 8% N/A 6% 9% N/A 9% 7% Rick Santorum 1% N/A 1% 1% N/A * 1% Donald Trump 25% N/A 19% 30% N/A 20% 28% Jim Gilmore * N/A * * N/A * * Someone else * N/A * * N/A * * None/No one 2% N/A 4% * N/A 1% 3% No opinion 4% N/A 2% 5% N/A 3% 3% Sampling Error +/-4.5 +/-7.5 +/-5.5 +/-8.0 +/-5.5 * percentage less than 1%

POLL -67- October 3-10, 2015
3
South Carolina CNN/ORC International Poll -- October 3 to 10, 2015 Question RP4A Now I`m going to read you a few phrases which describe the candidates, and for each one, tell me which Republican candidate you think that phrase best describes, regardless of who you are voting for. Which Republican candidate do you think: A. Best represents the values of Republicans like yourself Base = Republican likely voters Pee Dee/ Low Total Upcountry Piedmont Central Waccamaw Country ----- --------- -------- ------- -------- ------- Jeb Bush 10% 12% N/A 8% N/A N/A Ben Carson 19% 23% N/A 17% N/A N/A Chris Christie 3% 3% N/A 3% N/A N/A Ted Cruz 6% 6% N/A 6% N/A N/A Carly Fiorina 5% 6% N/A 5% N/A N/A Lindsey Graham 7% 6% N/A 12% N/A N/A Mike Huckabee 5% 9% N/A 3% N/A N/A Bobby Jindal * * N/A 1% N/A N/A John Kasich 1% 1% N/A 1% N/A N/A George Pataki * * N/A * N/A N/A Rand Paul 4% 3% N/A 7% N/A N/A Marco Rubio 8% 7% N/A 6% N/A N/A Rick Santorum 1% 1% N/A 2% N/A N/A Donald Trump 25% 23% N/A 21% N/A N/A Jim Gilmore * * N/A * N/A N/A Someone else * * N/A * N/A N/A None/No one 2% * N/A 4% N/A N/A No opinion 4% 1% N/A 3% N/A N/A Sampling Error +/-4.5 +/-8.0 +/-8.5 * percentage less than 1%

POLL -68- October 3-10, 2015
3
South Carolina CNN/ORC International Poll -- October 3 to 10, 2015 Question RP4B Now I`m going to read you a few phrases which describe the candidates, and for each one, tell me which Republican candidate you think that phrase best describes, regardless of who you are voting for. Which Republican candidate do you think: B. Has the best chance of winning the general election next November Base = Republican likely voters White White Total Men Women White Non-White Men Women ----- ----- ----- ----- --------- ------ ------ Jeb Bush 7% 9% 5% 7% N/A 10% 5% Ben Carson 17% 17% 16% 18% N/A 18% 18% Chris Christie 1% 2% * 1% N/A 2% * Ted Cruz 2% 1% 3% 2% N/A 1% 4% Carly Fiorina 5% 7% 4% 5% N/A 7% 3% Lindsey Graham 1% 1% 1% 1% N/A 1% 1% Mike Huckabee 1% 1% 1% 1% N/A 1% 1% Bobby Jindal * * * * N/A * * John Kasich 1% 2% * 1% N/A 2% * George Pataki * * * * N/A * * Rand Paul 2% 1% 3% 2% N/A 1% 3% Marco Rubio 9% 10% 7% 9% N/A 10% 8% Rick Santorum * * * * N/A * * Donald Trump 44% 40% 48% 41% N/A 38% 45% Jim Gilmore * * * * N/A * * Someone else * * * * N/A * * None/No one 3% 3% 2% 3% N/A 4% 2% No opinion 7% 5% 9% 7% N/A 5% 10% Sampling Error +/-4.5 +/-6.0 +/-6.5 +/-4.5 +/-6.0 +/-6.5 18- 35- 50- Under 50 and Total 34 49 64 65+ 50 Older ----- ----- ----- ----- ----- ----- ------ Jeb Bush 7% N/A N/A 8% 12% N/A 10% Ben Carson 17% N/A N/A 20% 11% N/A 15% Chris Christie 1% N/A N/A * 1% N/A 1% Ted Cruz 2% N/A N/A 1% 3% N/A 2% Carly Fiorina 5% N/A N/A 8% 6% N/A 7% Lindsey Graham 1% N/A N/A 1% 2% N/A 2% Mike Huckabee 1% N/A N/A * 3% N/A 2% Bobby Jindal * N/A N/A * * N/A * John Kasich 1% N/A N/A 2% 2% N/A 2% George Pataki * N/A N/A 1% * N/A * Rand Paul 2% N/A N/A * 2% N/A 1% Marco Rubio 9% N/A N/A 10% 13% N/A 11% Rick Santorum * N/A N/A * * N/A * Donald Trump 44% N/A N/A 37% 35% N/A 36% Jim Gilmore * N/A N/A * * N/A * Someone else * N/A N/A * * N/A * None/No one 3% N/A N/A 4% 1% N/A 3% No opinion 7% N/A N/A 8% 8% N/A 8% Sampling Error +/-4.5 +/-8.0 +/-6.0 +/-5.0 * percentage less than 1%

POLL -69- October 3-10, 2015
3
South Carolina CNN/ORC International Poll -- October 3 to 10, 2015 Question RP4B Now I`m going to read you a few phrases which describe the candidates, and for each one, tell me which Republican candidate you think that phrase best describes, regardless of who you are voting for. Which Republican candidate do you think: B. Has the best chance of winning the general election next November Base = Republican likely voters Under $50K No Attended Sub- Total $50K or more College College Urban urban Rural ----- ----- ------- ------- -------- ----- ----- ----- Jeb Bush 7% 6% 7% 7% 7% N/A 7% 7% Ben Carson 17% 14% 22% 10% 21% N/A 15% 25% Chris Christie 1% 2% * 3% * N/A 1% 3% Ted Cruz 2% 3% 2% 1% 3% N/A 2% 5% Carly Fiorina 5% 3% 9% 1% 8% N/A 5% 8% Lindsey Graham 1% 2% 1% 2% 1% N/A 2% 1% Mike Huckabee 1% 1% 1% 1% 1% N/A 1% 1% Bobby Jindal * * * * * N/A * * John Kasich 1% * 2% * 2% N/A 1% * George Pataki * * * * * N/A * * Rand Paul 2% 1% 1% * 3% N/A 1% 1% Marco Rubio 9% 4% 13% 5% 11% N/A 8% 5% Rick Santorum * * * * * N/A * * Donald Trump 44% 51% 36% 63% 32% N/A 49% 39% Jim Gilmore * * * * * N/A * * Someone else * * * * * N/A * * None/No one 3% 4% 2% 3% 3% N/A 2% * No opinion 7% 8% 4% 5% 8% N/A 7% 6% Sampling Error +/-4.5 +/-7.5 +/-6.0 +/-8.0 +/-5.0 +/-6.0 +/-8.0 Demo- Indep- Repub- Lib- Mod- Conser- Total crat endent lican eral erate vative ----- ----- ------ ------ ----- ----- ------- Jeb Bush 7% N/A 4% 9% N/A 8% 7% Ben Carson 17% N/A 17% 17% N/A 14% 20% Chris Christie 1% N/A 2% 1% N/A 3% * Ted Cruz 2% N/A 4% 1% N/A 1% 3% Carly Fiorina 5% N/A 8% 3% N/A 7% 5% Lindsey Graham 1% N/A 2% * N/A 1% 1% Mike Huckabee 1% N/A 1% 1% N/A 1% 1% Bobby Jindal * N/A * * N/A * * John Kasich 1% N/A 2% * N/A 2% 1% George Pataki * N/A * * N/A * * Rand Paul 2% N/A 5% * N/A 3% 2% Marco Rubio 9% N/A 8% 10% N/A 6% 9% Rick Santorum * N/A * * N/A * * Donald Trump 44% N/A 36% 48% N/A 40% 44% Jim Gilmore * N/A * * N/A * * Someone else * N/A * * N/A * * None/No one 3% N/A 4% 1% N/A 4% 2% No opinion 7% N/A 4% 9% N/A 9% 5% Sampling Error +/-4.5 +/-7.5 +/-5.5 +/-8.0 +/-5.5 * percentage less than 1%
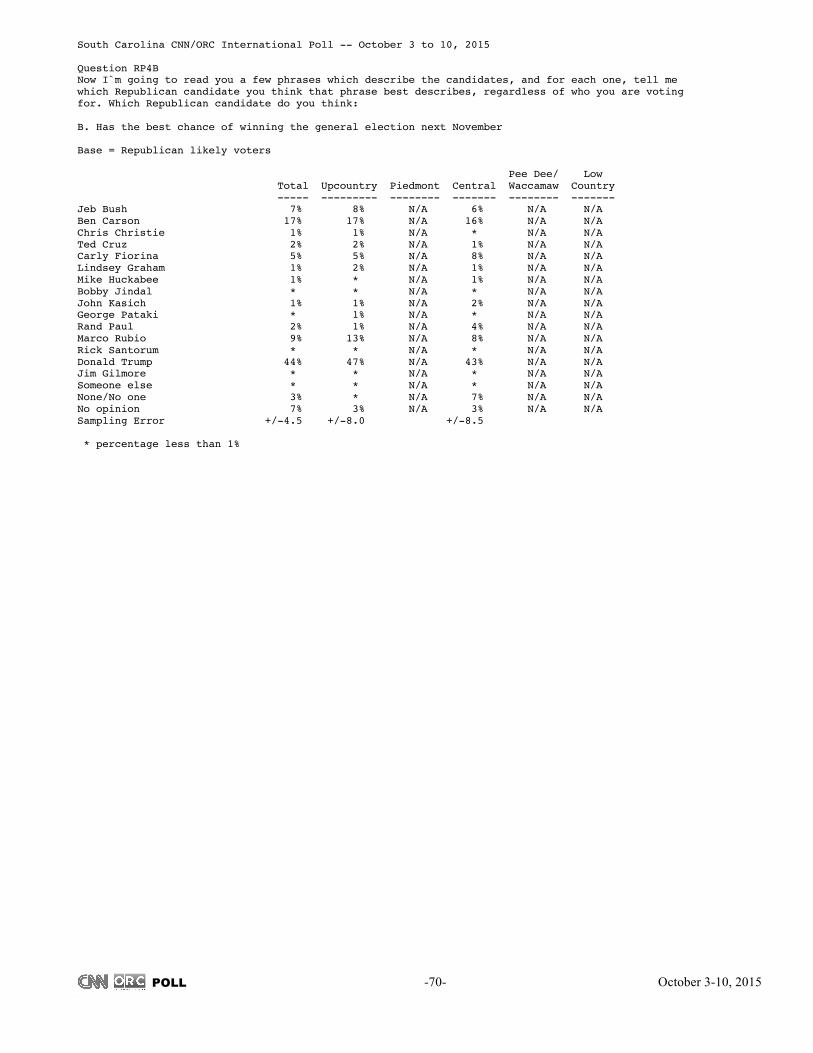
POLL -70- October 3-10, 2015
3
South Carolina CNN/ORC International Poll -- October 3 to 10, 2015 Question RP4B Now I`m going to read you a few phrases which describe the candidates, and for each one, tell me which Republican candidate you think that phrase best describes, regardless of who you are voting for. Which Republican candidate do you think: B. Has the best chance of winning the general election next November Base = Republican likely voters Pee Dee/ Low Total Upcountry Piedmont Central Waccamaw Country ----- --------- -------- ------- -------- ------- Jeb Bush 7% 8% N/A 6% N/A N/A Ben Carson 17% 17% N/A 16% N/A N/A Chris Christie 1% 1% N/A * N/A N/A Ted Cruz 2% 2% N/A 1% N/A N/A Carly Fiorina 5% 5% N/A 8% N/A N/A Lindsey Graham 1% 2% N/A 1% N/A N/A Mike Huckabee 1% * N/A 1% N/A N/A Bobby Jindal * * N/A * N/A N/A John Kasich 1% 1% N/A 2% N/A N/A George Pataki * 1% N/A * N/A N/A Rand Paul 2% 1% N/A 4% N/A N/A Marco Rubio 9% 13% N/A 8% N/A N/A Rick Santorum * * N/A * N/A N/A Donald Trump 44% 47% N/A 43% N/A N/A Jim Gilmore * * N/A * N/A N/A Someone else * * N/A * N/A N/A None/No one 3% * N/A 7% N/A N/A No opinion 7% 3% N/A 3% N/A N/A Sampling Error +/-4.5 +/-8.0 +/-8.5 * percentage less than 1%
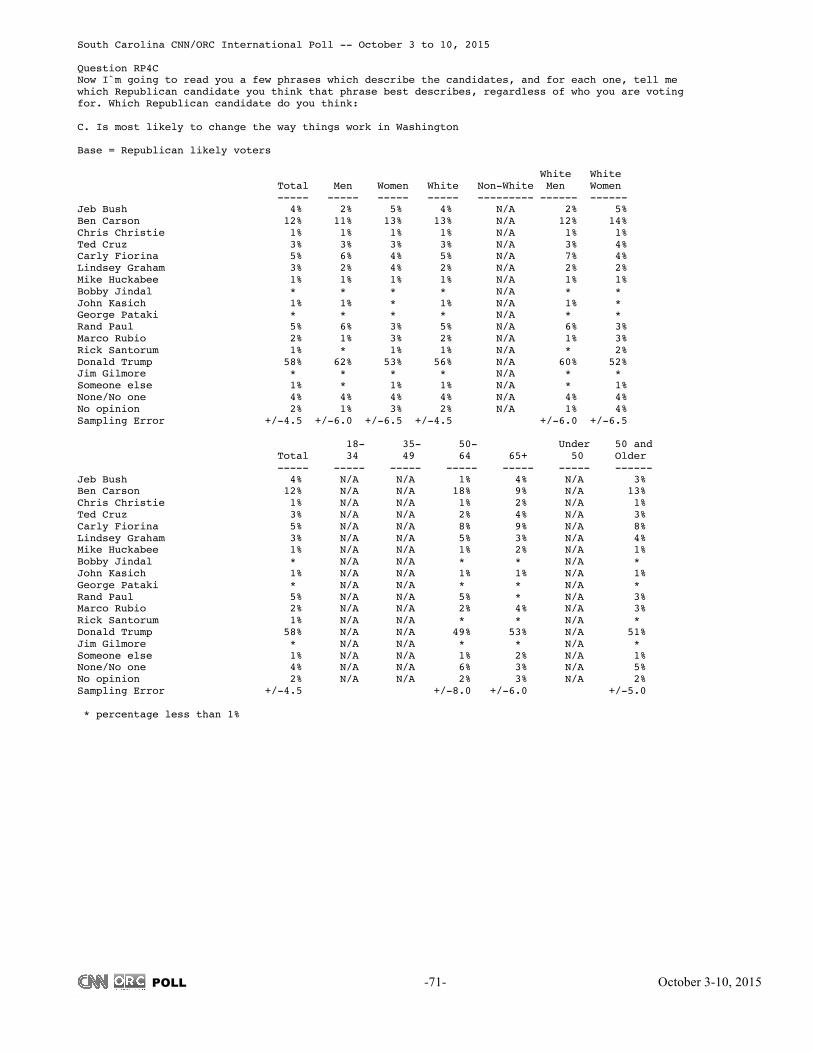
POLL -71- October 3-10, 2015
3
South Carolina CNN/ORC International Poll -- October 3 to 10, 2015 Question RP4C Now I`m going to read you a few phrases which describe the candidates, and for each one, tell me which Republican candidate you think that phrase best describes, regardless of who you are voting for. Which Republican candidate do you think: C. Is most likely to change the way things work in Washington Base = Republican likely voters White White Total Men Women White Non-White Men Women ----- ----- ----- ----- --------- ------ ------ Jeb Bush 4% 2% 5% 4% N/A 2% 5% Ben Carson 12% 11% 13% 13% N/A 12% 14% Chris Christie 1% 1% 1% 1% N/A 1% 1% Ted Cruz 3% 3% 3% 3% N/A 3% 4% Carly Fiorina 5% 6% 4% 5% N/A 7% 4% Lindsey Graham 3% 2% 4% 2% N/A 2% 2% Mike Huckabee 1% 1% 1% 1% N/A 1% 1% Bobby Jindal * * * * N/A * * John Kasich 1% 1% * 1% N/A 1% * George Pataki * * * * N/A * * Rand Paul 5% 6% 3% 5% N/A 6% 3% Marco Rubio 2% 1% 3% 2% N/A 1% 3% Rick Santorum 1% * 1% 1% N/A * 2% Donald Trump 58% 62% 53% 56% N/A 60% 52% Jim Gilmore * * * * N/A * * Someone else 1% * 1% 1% N/A * 1% None/No one 4% 4% 4% 4% N/A 4% 4% No opinion 2% 1% 3% 2% N/A 1% 4% Sampling Error +/-4.5 +/-6.0 +/-6.5 +/-4.5 +/-6.0 +/-6.5 18- 35- 50- Under 50 and Total 34 49 64 65+ 50 Older ----- ----- ----- ----- ----- ----- ------ Jeb Bush 4% N/A N/A 1% 4% N/A 3% Ben Carson 12% N/A N/A 18% 9% N/A 13% Chris Christie 1% N/A N/A 1% 2% N/A 1% Ted Cruz 3% N/A N/A 2% 4% N/A 3% Carly Fiorina 5% N/A N/A 8% 9% N/A 8% Lindsey Graham 3% N/A N/A 5% 3% N/A 4% Mike Huckabee 1% N/A N/A 1% 2% N/A 1% Bobby Jindal * N/A N/A * * N/A * John Kasich 1% N/A N/A 1% 1% N/A 1% George Pataki * N/A N/A * * N/A * Rand Paul 5% N/A N/A 5% * N/A 3% Marco Rubio 2% N/A N/A 2% 4% N/A 3% Rick Santorum 1% N/A N/A * * N/A * Donald Trump 58% N/A N/A 49% 53% N/A 51% Jim Gilmore * N/A N/A * * N/A * Someone else 1% N/A N/A 1% 2% N/A 1% None/No one 4% N/A N/A 6% 3% N/A 5% No opinion 2% N/A N/A 2% 3% N/A 2% Sampling Error +/-4.5 +/-8.0 +/-6.0 +/-5.0 * percentage less than 1%

POLL -72- October 3-10, 2015
3
South Carolina CNN/ORC International Poll -- October 3 to 10, 2015 Question RP4C Now I`m going to read you a few phrases which describe the candidates, and for each one, tell me which Republican candidate you think that phrase best describes, regardless of who you are voting for. Which Republican candidate do you think: C. Is most likely to change the way things work in Washington Base = Republican likely voters Under $50K No Attended Sub- Total $50K or more College College Urban urban Rural ----- ----- ------- ------- -------- ----- ----- ----- Jeb Bush 4% 6% 1% 2% 5% N/A 2% 4% Ben Carson 12% 12% 14% 7% 15% N/A 11% 16% Chris Christie 1% 1% 1% 1% 1% N/A * 1% Ted Cruz 3% 3% 2% 1% 4% N/A 3% 5% Carly Fiorina 5% 3% 7% 2% 8% N/A 5% 6% Lindsey Graham 3% 5% 2% 6% 1% N/A 2% 1% Mike Huckabee 1% 1% * 1% 1% N/A 1% * Bobby Jindal * * * * * N/A * * John Kasich 1% * 1% * 1% N/A 1% * George Pataki * * * * * N/A * * Rand Paul 5% 3% 5% 4% 5% N/A 1% 9% Marco Rubio 2% 1% 2% 3% 1% N/A 3% 1% Rick Santorum 1% 1% * * 1% N/A * * Donald Trump 58% 54% 59% 69% 50% N/A 66% 52% Jim Gilmore * * * * * N/A * * Someone else 1% 1% 1% 1% * N/A * * None/No one 4% 4% 4% 3% 4% N/A 3% 3% No opinion 2% 1% 3% 1% 3% N/A * 3% Sampling Error +/-4.5 +/-7.5 +/-6.0 +/-8.0 +/-5.0 +/-6.0 +/-8.0 Demo- Indep- Repub- Lib- Mod- Conser- Total crat endent lican eral erate vative ----- ----- ------ ------ ----- ----- ------- Jeb Bush 4% N/A 4% 3% N/A 5% 3% Ben Carson 12% N/A 11% 13% N/A 9% 14% Chris Christie 1% N/A * 1% N/A * 1% Ted Cruz 3% N/A 6% 1% N/A * 5% Carly Fiorina 5% N/A 5% 5% N/A 6% 5% Lindsey Graham 3% N/A 2% 1% N/A 7% 1% Mike Huckabee 1% N/A 1% 1% N/A * 1% Bobby Jindal * N/A * * N/A * * John Kasich 1% N/A 1% * N/A 2% * George Pataki * N/A * * N/A * * Rand Paul 5% N/A 9% 2% N/A 7% 4% Marco Rubio 2% N/A * 3% N/A 1% 2% Rick Santorum 1% N/A * 1% N/A 2% * Donald Trump 58% N/A 51% 64% N/A 50% 59% Jim Gilmore * N/A * * N/A * * Someone else 1% N/A 1% 1% N/A * 1% None/No one 4% N/A 7% 1% N/A 6% 3% No opinion 2% N/A 1% 3% N/A 5% * Sampling Error +/-4.5 +/-7.5 +/-5.5 +/-8.0 +/-5.5 * percentage less than 1%

POLL -73- October 3-10, 2015
3
South Carolina CNN/ORC International Poll -- October 3 to 10, 2015 Question RP4C Now I`m going to read you a few phrases which describe the candidates, and for each one, tell me which Republican candidate you think that phrase best describes, regardless of who you are voting for. Which Republican candidate do you think: C. Is most likely to change the way things work in Washington Base = Republican likely voters Pee Dee/ Low Total Upcountry Piedmont Central Waccamaw Country ----- --------- -------- ------- -------- ------- Jeb Bush 4% 5% N/A 1% N/A N/A Ben Carson 12% 12% N/A 14% N/A N/A Chris Christie 1% 1% N/A * N/A N/A Ted Cruz 3% 2% N/A 3% N/A N/A Carly Fiorina 5% 4% N/A 5% N/A N/A Lindsey Graham 3% 1% N/A 6% N/A N/A Mike Huckabee 1% 1% N/A * N/A N/A Bobby Jindal * * N/A * N/A N/A John Kasich 1% 2% N/A * N/A N/A George Pataki * * N/A * N/A N/A Rand Paul 5% 1% N/A 7% N/A N/A Marco Rubio 2% 1% N/A 2% N/A N/A Rick Santorum 1% * N/A 1% N/A N/A Donald Trump 58% 65% N/A 52% N/A N/A Jim Gilmore * * N/A * N/A N/A Someone else 1% 1% N/A 1% N/A N/A None/No one 4% 2% N/A 5% N/A N/A No opinion 2% 1% N/A 1% N/A N/A Sampling Error +/-4.5 +/-8.0 +/-8.5 * percentage less than 1%

POLL -74- October 3-10, 2015
3
South Carolina CNN/ORC International Poll -- October 3 to 10, 2015 Question RP4D Now I`m going to read you a few phrases which describe the candidates, and for each one, tell me which Republican candidate you think that phrase best describes, regardless of who you are voting for. Which Republican candidate do you think: D. Best understands the problems facing people like you Base = Republican likely voters White White Total Men Women White Non-White Men Women ----- ----- ----- ----- --------- ------ ------ Jeb Bush 6% 6% 6% 6% N/A 6% 5% Ben Carson 21% 18% 23% 22% N/A 18% 25% Chris Christie 3% 4% 2% 3% N/A 4% 2% Ted Cruz 3% 3% 2% 3% N/A 3% 3% Carly Fiorina 3% 3% 3% 3% N/A 3% 4% Lindsey Graham 7% 8% 6% 6% N/A 7% 4% Mike Huckabee 4% 4% 3% 4% N/A 4% 4% Bobby Jindal * * * * N/A * * John Kasich 3% 5% 2% 3% N/A 5% 2% George Pataki * * * * N/A * * Rand Paul 5% 6% 4% 5% N/A 5% 4% Marco Rubio 9% 10% 8% 8% N/A 10% 8% Rick Santorum 1% 2% * * N/A * * Donald Trump 28% 26% 31% 29% N/A 27% 29% Jim Gilmore * * * * N/A * * Someone else * * * * N/A * * None/No one 2% 1% 4% 2% N/A 1% 3% No opinion 6% 6% 6% 6% N/A 6% 6% Sampling Error +/-4.5 +/-6.0 +/-6.5 +/-4.5 +/-6.0 +/-6.5 18- 35- 50- Under 50 and Total 34 49 64 65+ 50 Older ----- ----- ----- ----- ----- ----- ------ Jeb Bush 6% N/A N/A 6% 8% N/A 7% Ben Carson 21% N/A N/A 24% 12% N/A 18% Chris Christie 3% N/A N/A 1% 3% N/A 2% Ted Cruz 3% N/A N/A 2% 3% N/A 2% Carly Fiorina 3% N/A N/A 5% 4% N/A 4% Lindsey Graham 7% N/A N/A 10% 5% N/A 8% Mike Huckabee 4% N/A N/A 2% 7% N/A 5% Bobby Jindal * N/A N/A * * N/A * John Kasich 3% N/A N/A 5% 3% N/A 4% George Pataki * N/A N/A * * N/A * Rand Paul 5% N/A N/A 2% 3% N/A 2% Marco Rubio 9% N/A N/A 11% 13% N/A 12% Rick Santorum 1% N/A N/A 1% * N/A * Donald Trump 28% N/A N/A 23% 31% N/A 27% Jim Gilmore * N/A N/A * * N/A * Someone else * N/A N/A * * N/A * None/No one 2% N/A N/A 1% 3% N/A 2% No opinion 6% N/A N/A 8% 4% N/A 6% Sampling Error +/-4.5 +/-8.0 +/-6.0 +/-5.0 * percentage less than 1%

POLL -75- October 3-10, 2015
3
South Carolina CNN/ORC International Poll -- October 3 to 10, 2015 Question RP4D Now I`m going to read you a few phrases which describe the candidates, and for each one, tell me which Republican candidate you think that phrase best describes, regardless of who you are voting for. Which Republican candidate do you think: D. Best understands the problems facing people like you Base = Republican likely voters Under $50K No Attended Sub- Total $50K or more College College Urban urban Rural ----- ----- ------- ------- -------- ----- ----- ----- Jeb Bush 6% 7% 5% 5% 6% N/A 4% 8% Ben Carson 21% 19% 26% 10% 28% N/A 18% 30% Chris Christie 3% 4% 2% 3% 3% N/A 2% 3% Ted Cruz 3% 2% 3% 2% 3% N/A 3% 3% Carly Fiorina 3% 1% 5% 2% 4% N/A 3% 3% Lindsey Graham 7% 11% 5% 13% 4% N/A 6% 1% Mike Huckabee 4% 5% 3% 6% 2% N/A 5% 3% Bobby Jindal * * * * * N/A * * John Kasich 3% 1% 5% * 5% N/A 3% 5% George Pataki * * * * * N/A * * Rand Paul 5% 5% 4% 3% 6% N/A 1% 8% Marco Rubio 9% 6% 11% 7% 9% N/A 12% 4% Rick Santorum 1% * 2% 2% * N/A 2% * Donald Trump 28% 32% 22% 41% 21% N/A 30% 29% Jim Gilmore * * * * * N/A * * Someone else * * * * * N/A * * None/No one 2% 2% 2% * 3% N/A 4% * No opinion 6% 4% 6% 7% 5% N/A 6% 3% Sampling Error +/-4.5 +/-7.5 +/-6.0 +/-8.0 +/-5.0 +/-6.0 +/-8.0 Demo- Indep- Repub- Lib- Mod- Conser- Total crat endent lican eral erate vative ----- ----- ------ ------ ----- ----- ------- Jeb Bush 6% N/A 3% 8% N/A 9% 5% Ben Carson 21% N/A 17% 24% N/A 13% 25% Chris Christie 3% N/A 5% 2% N/A 5% 1% Ted Cruz 3% N/A 4% 2% N/A * 4% Carly Fiorina 3% N/A 4% 3% N/A 4% 3% Lindsey Graham 7% N/A 8% 4% N/A 9% 6% Mike Huckabee 4% N/A 6% 2% N/A 3% 4% Bobby Jindal * N/A * * N/A * * John Kasich 3% N/A 7% * N/A 9% 1% George Pataki * N/A * * N/A * * Rand Paul 5% N/A 10% 1% N/A 6% 5% Marco Rubio 9% N/A 7% 10% N/A 9% 9% Rick Santorum 1% N/A * 1% N/A * 1% Donald Trump 28% N/A 23% 33% N/A 21% 31% Jim Gilmore * N/A * * N/A * * Someone else * N/A * * N/A * * None/No one 2% N/A 3% 2% N/A 4% 2% No opinion 6% N/A 2% 8% N/A 9% 4% Sampling Error +/-4.5 +/-7.5 +/-5.5 +/-8.0 +/-5.5 * percentage less than 1%
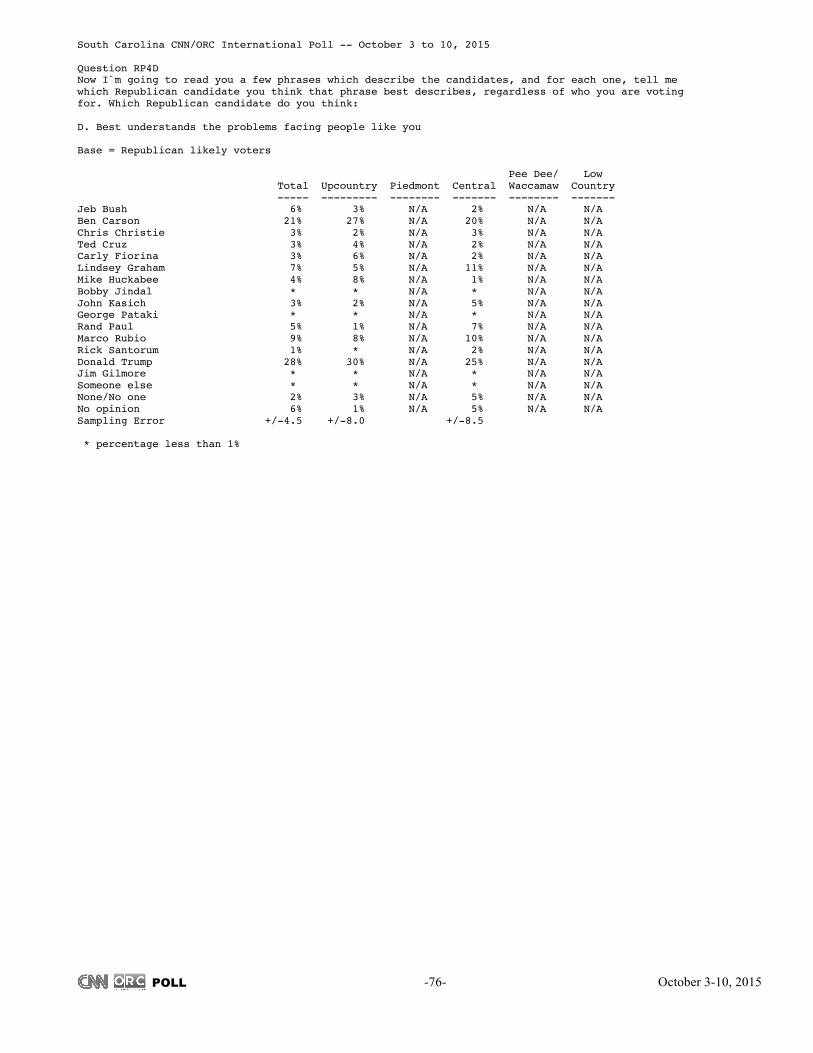
POLL -76- October 3-10, 2015
3
South Carolina CNN/ORC International Poll -- October 3 to 10, 2015 Question RP4D Now I`m going to read you a few phrases which describe the candidates, and for each one, tell me which Republican candidate you think that phrase best describes, regardless of who you are voting for. Which Republican candidate do you think: D. Best understands the problems facing people like you Base = Republican likely voters Pee Dee/ Low Total Upcountry Piedmont Central Waccamaw Country ----- --------- -------- ------- -------- ------- Jeb Bush 6% 3% N/A 2% N/A N/A Ben Carson 21% 27% N/A 20% N/A N/A Chris Christie 3% 2% N/A 3% N/A N/A Ted Cruz 3% 4% N/A 2% N/A N/A Carly Fiorina 3% 6% N/A 2% N/A N/A Lindsey Graham 7% 5% N/A 11% N/A N/A Mike Huckabee 4% 8% N/A 1% N/A N/A Bobby Jindal * * N/A * N/A N/A John Kasich 3% 2% N/A 5% N/A N/A George Pataki * * N/A * N/A N/A Rand Paul 5% 1% N/A 7% N/A N/A Marco Rubio 9% 8% N/A 10% N/A N/A Rick Santorum 1% * N/A 2% N/A N/A Donald Trump 28% 30% N/A 25% N/A N/A Jim Gilmore * * N/A * N/A N/A Someone else * * N/A * N/A N/A None/No one 2% 3% N/A 5% N/A N/A No opinion 6% 1% N/A 5% N/A N/A Sampling Error +/-4.5 +/-8.0 +/-8.5 * percentage less than 1%

POLL -77- October 3-10, 2015
3
South Carolina CNN/ORC International Poll -- October 3 to 10, 2015 Question 5 Which of the following issues will be MOST important to you when you decide how to vote for president? Base = Total Sample White White Total Men Women White Non-White Men Women ----- ----- ----- ----- --------- ------ ------ Foreign policy 11% 16% 7% 14% 6% 18% 10% Illegal immigration 6% 8% 4% 7% 3% 8% 6% Health care 19% 14% 23% 15% 27% 10% 20% Social issues 10% 10% 10% 9% 11% 9% 9% Terrorism 11% 11% 10% 12% 10% 14% 10% The economy 38% 36% 40% 39% 39% 36% 41% Other 1% 2% 1% 2% 1% 3% 2% No opinion 4% 3% 5% 2% 3% 2% 3% Sampling Error +/-3.0 +/-4.5 +/-4.5 +/-3.5 +/-6.0 +/-5.0 +/-5.0 18- 35- 50- Under 50 and Total 34 49 64 65+ 50 Older ----- ----- ----- ----- ----- ----- ------ Foreign policy 11% N/A 9% 13% 13% 9% 13% Illegal immigration 6% N/A 5% 5% 9% 5% 7% Health care 19% N/A 19% 16% 19% 21% 17% Social issues 10% N/A 9% 6% 11% 12% 8% Terrorism 11% N/A 7% 12% 12% 10% 12% The economy 38% N/A 47% 43% 29% 40% 37% Other 1% N/A 1% 2% 2% 1% 2% No opinion 4% N/A 3% 3% 5% 2% 4% Sampling Error +/-3.0 +/-8.0 +/-5.5 +/-5.0 +/-6.0 +/-3.5 Under $50K No Attended Sub- Total $50K or more College College Urban urban Rural ----- ----- ------- ------- -------- ----- ----- ----- Foreign policy 11% 13% 11% 10% 12% 13% 11% 11% Illegal immigration 6% 4% 6% 7% 5% 5% 7% 5% Health care 19% 21% 15% 22% 16% 21% 20% 15% Social issues 10% 8% 10% 11% 9% 7% 10% 13% Terrorism 11% 11% 9% 14% 9% 10% 12% 9% The economy 38% 40% 45% 32% 44% 39% 35% 42% Other 1% 1% 2% 1% 2% 1% 2% 1% No opinion 4% 2% 1% 3% 3% 3% 5% 4% Sampling Error +/-3.0 +/-5.0 +/-5.0 +/-5.0 +/-4.0 +/-7.0 +/-4.5 +/-6.0 Demo- Indep- Repub- Lib- Mod- Conser- Total crat endent lican eral erate vative ----- ----- ------ ------ ----- ----- ------- Foreign policy 11% 5% 11% 16% N/A 8% 15% Illegal immigration 6% 1% 7% 8% N/A 2% 8% Health care 19% 29% 18% 11% N/A 18% 14% Social issues 10% 13% 9% 7% N/A 9% 8% Terrorism 11% 8% 8% 18% N/A 11% 13% The economy 38% 41% 37% 37% N/A 50% 37% Other 1% 1% 2% 1% N/A 1% 1% No opinion 4% 2% 7% 2% N/A 2% 2% Sampling Error +/-3.0 +/-6.0 +/-5.0 +/-5.0 +/-5.5 +/-4.5 Pee Dee/ Low Total Upcountry Piedmont Central Waccamaw Country ----- --------- -------- ------- -------- ------- Foreign policy 11% 11% 5% 14% 10% 10% Illegal immigration 6% 9% 6% 3% 10% 6% Health care 19% 25% 17% 18% 16% 17% Social issues 10% 10% 11% 8% 13% 9% Terrorism 11% 11% 13% 12% 3% 13% The economy 38% 25% 44% 42% 38% 43% Other 1% 3% * 1% 4% * No opinion 4% 6% 3% 4% 7% 1% Sampling Error +/-3.0 +/-6.5 +/-8.0 +/-6.0 +/-8.0 +/-7.0 * percentage less than 1%

POLL -78- October 3-10, 2015
3
South Carolina CNN/ORC International Poll -- October 3 to 10, 2015 Question 5 Which of the following issues will be MOST important to you when you decide how to vote for president? Base = Republican likely voters White White Total Men Women White Non-White Men Women ----- ----- ----- ----- --------- ------ ------ Foreign policy 16% 21% 9% 16% N/A 22% 10% Illegal immigration 8% 9% 6% 8% N/A 9% 6% Health care 9% 6% 13% 9% N/A 6% 14% Social issues 8% 8% 8% 8% N/A 8% 9% Terrorism 16% 15% 17% 15% N/A 16% 13% The economy 41% 38% 44% 41% N/A 37% 45% Other 1% 2% 1% 2% N/A 2% 1% No opinion 2% 2% 2% 1% N/A * 2% Sampling Error +/-4.5 +/-6.0 +/-6.5 +/-4.5 +/-6.0 +/-6.5 18- 35- 50- Under 50 and Total 34 49 64 65+ 50 Older ----- ----- ----- ----- ----- ----- ------ Foreign policy 16% N/A N/A 21% 17% N/A 19% Illegal immigration 8% N/A N/A 6% 12% N/A 9% Health care 9% N/A N/A 5% 10% N/A 8% Social issues 8% N/A N/A 5% 10% N/A 8% Terrorism 16% N/A N/A 18% 17% N/A 18% The economy 41% N/A N/A 42% 28% N/A 35% Other 1% N/A N/A 2% 2% N/A 2% No opinion 2% N/A N/A * 3% N/A 2% Sampling Error +/-4.5 +/-8.0 +/-6.0 +/-5.0 Under $50K No Attended Sub- Total $50K or more College College Urban urban Rural ----- ----- ------- ------- -------- ----- ----- ----- Foreign policy 16% 19% 14% 16% 16% N/A 16% 15% Illegal immigration 8% 4% 10% 10% 6% N/A 9% 5% Health care 9% 13% 7% 10% 9% N/A 8% 9% Social issues 8% 7% 9% 8% 8% N/A 6% 14% Terrorism 16% 16% 12% 20% 13% N/A 19% 13% The economy 41% 38% 45% 32% 45% N/A 37% 44% Other 1% 1% 2% 1% 2% N/A 2% * No opinion 2% 2% 2% 4% * N/A 3% * Sampling Error +/-4.5 +/-7.5 +/-6.0 +/-8.0 +/-5.0 +/-6.0 +/-8.0 Demo- Indep- Repub- Lib- Mod- Conser- Total crat endent lican eral erate vative ----- ----- ------ ------ ----- ----- ------- Foreign policy 16% N/A 16% 16% N/A 11% 18% Illegal immigration 8% N/A 7% 9% N/A 3% 8% Health care 9% N/A 11% 8% N/A 11% 8% Social issues 8% N/A 11% 6% N/A 6% 9% Terrorism 16% N/A 9% 19% N/A 15% 16% The economy 41% N/A 45% 38% N/A 51% 37% Other 1% N/A 2% 1% N/A 1% 2% No opinion 2% N/A 1% 2% N/A 1% 2% Sampling Error +/-4.5 +/-7.5 +/-5.5 +/-8.0 +/-5.5 Pee Dee/ Low Total Upcountry Piedmont Central Waccamaw Country ----- --------- -------- ------- -------- ------- Foreign policy 16% 16% N/A 20% N/A N/A Illegal immigration 8% 12% N/A 5% N/A N/A Health care 9% 14% N/A 7% N/A N/A Social issues 8% 8% N/A 4% N/A N/A Terrorism 16% 11% N/A 20% N/A N/A The economy 41% 36% N/A 41% N/A N/A Other 1% 2% N/A 1% N/A N/A No opinion 2% 1% N/A 3% N/A N/A Sampling Error +/-4.5 +/-8.0 +/-8.5 * percentage less than 1%