orange unified school district -...
TRANSCRIPT

Joel D. MonteroChief Executive Officer
Orange Unified School District
Fiscal ReviewMarch 9, 2009


FCMATJoel D. Montero, Chief Executive O�cer
1300 17th Street - CITY CENTRE, Bakers�eld, CA 93301-4533 . Telephone 661-636-4611 . Fax 661-636-4647422 Petaluma Blvd North, Suite. C, Petaluma, CA 94952 . Telephone: 707-775-2850 . Fax: 707-775-2854 . www.fcmat.org
Administrative Agent: Larry E. Reider - O�ce of Kern County Superintendent of Schools
March 9, 2009
Dr. Renae Dreier, SuperintendentOrange Unified School District1401 North HandyOrange CA 92867
Dear Superintendent Dreier:
In December 2008, the Orange Unified School District entered into an agreement with the Fiscal Crisis and Management Assistance Team (FCMAT) for a study to perform the following:
The district requests that the team provide an in-depth financial review of all funds 1. included in the 2008-09 adopted budget or first interim financial report utilizing the Fiscal Health and Risk Analysis tool created by FCMAT. A copy of the Fiscal Health and Risk Analysis is attached to the agreement and referenced as exhibit “A”.
The district requests that the team create an independent multiyear financial 2. projection for 2009-10 and 2010-11 using FCMAT’s Budget Explorer software, after validating revenue and expenditure allocations included in the district’s 2008-09 first interim general fund budget.
The base year of the team’s projection will be 2008-09 and the variables used by FCMAT will be consistent with the most current School Services of California Dartboard and any mid-year reductions that are completed and signed by the Governor as of the time of this review.
FCMAT conducted fieldwork at the district to interview employees, review documents and collect information. This report is the result of those activities. Thank you for allowing us to serve you, and please give our regards to all the employees of the Orange Unified School District.
Sincerely,
Joel D. MonteroChief Executive Officer


TABLE OF CONTENTS i
Table of Contents
Foreword ...........................................................................iii
Introduction ...................................................................... 1
Executive Summary ......................................................... 3
Findings and Recommendations ................................... 7Fiscal Health Risk Analysis .............................................................................................................. 7
Multiyear Financial Projections ...................................................................................................21
Appendices ......................................................................49


Orange Unified School District
FOREWORD iii
Foreword - FCMAT BackgroundThe Fiscal Crisis and Management Assistance Team (FCMAT) was created by legislation in accordance with Assembly Bill 1200 in 1992 as a service to assist local educational agencies (LEAs) in complying with fiscal accountability standards.
AB 1200 was established from a need to ensure that LEAs throughout California were adequately prepared to meet and sustain their financial obligations. AB 1200 is also a statewide plan for county offices of education and school districts to work together on a local level to improve fiscal procedures and accountability standards. The legislation expanded the role of the county office in monitoring school districts under certain fiscal constraints to ensure these dis-tricts could meet their financial commitments on a multiyear basis. AB 2756 provides specific responsibilities to FCMAT with regard to districts that have received emergency state loans. These include comprehensive assessments in five major operational areas and periodic reports that identify the district’s progress on the improvement plans.
In January 2006, SB 430 (charter schools) and AB 1366 (community colleges) became law and expanded FCMAT’s services to those types of LEAs.
Since 1992, FCMAT has been engaged to perform nearly 750 reviews for local educational agencies, including school districts, county offices of education, charter schools and community colleges. Services range from fiscal crisis intervention to management review and assistance. FCMAT also provides professional development training. The Kern County Superintendent of Schools is the administrative agent for FCMAT. The agency is guided under the leadership of Joel D. Montero, Chief Executive Officer, with funding derived through appropriations in the state budget and a modest fee schedule for charges to requesting agencies.
Management Assistance ........ 705 (94.886%)Fiscal Crisis/Emergency ..........38 (5.114%)
Note: Some districts had multiple studies. Districts (7) that have received emergency loans from the state. (Rev. 1/22/09)
Total Number of Studies..........743Total Number of Districts in CA 982
92/93 93/94 94/95 95/96 96/97 97/98 98/99 99/00 00/01 01/02 02/03 03/04 04/05 05/06 06/07 07/08 08/09
Projected
80
70
60
50
40
30
20
10
0
Study Agreements by Fiscal Year
Nu
mb
er o
f Stu
die
s

Fiscal Crisis & Management Assistance Team

Orange Unified School District
1INTRODuCTION
IntroductionLocated in Southern California the Orange Unified School District serves several communities in Orange County, including Orange and Villa Park, the unincorporated land of Silverado, and parts of Anaheim, Garden Grove and Santa Ana. The district is comprised of 29 elementary schools, five middle schools, four high schools, a continuation high school, a K-8 math and science magnet school and two schools that serve students with special needs. Two of its middle schools are charter schools.
Nineteen of the district’s schools have been recognized as California Distinguished Schools. Three high schools are consistently listed among Newsweek’s 1,000 Best Public High Schools in America. Some elementary and middle schools in the district also continue to achieve above average standardized test scores and have obtained national distinctions, while others are state-designated underperforming schools under the No Child Left Behind Act.
The district has experienced declining student enrollment since the 2004-05 school year. This has reduced funding, forcing continued program and expenditure reductions. The district has also been challenged to maintain competitive compensation that compares with all other school districts in Orange County.
Some of the districts facilities are aging and in need of repair. Facility needs have been funded in the past through a variety of resources including bonds, developer fees, state facility program grants and certificates of participation. However, these sources will not be available at prior year levels, resulting in continued challenges to meet the districts facility needs.
In August 2008, the district hired a new Superintendent. The administration and the school board decided to use this opportunity to evaluate the district’s fiscal position with an independent third-party analysis. As a result, the Fiscal Crisis and Management Assistance Team (FCMAT) was hired to conduct a study to perform the following.
The district requests that the team provide an in-depth financial review of all 1. funds included in the 2008-09 adopted budget or first interim financial report utilizing the Fiscal Health and Risk Analysis tool created by FCMAT. A copy of the Fiscal Health and Risk Analysis is attached to the agreement and referenced as exhibit “A”.
The district requests that the team create an independent multiyear financial 2. projection for 2009-10 and 2010-11 using FCMAT’s Budget Explorer software, after validating revenue and expenditure allocations included in the district’s 2008-09 first interim general fund budget.

Fiscal Crisis & Management Assistance Team
2 INTRODuCTION
The base year of the team’s projection will be 2008-09 and the variables used by FCMAT will be consistent with the most current School Services of California Dartboard and any mid-year reductions that are completed and signed by the Governor as of the time of this review.
Study TeamJim Cerreta Margaret RosalesFCMAT Fiscal Intervention Specialist FCMAT ConsultantBakersfield, CA Kingsburg, CA
Deborah Deal Leonel MartínezFCMAT Fiscal Intervention Specialist FCMAT Public Information SpecialistLos Angeles, CA Bakersfield, CA
Study GuidelinesFCMAT visited the district January 7-9, 2009 to conduct interviews, collect data and review documents. This report is the result of those activities and is divided into the following sections:
Executive SummaryI. Fiscal Health Risk Analysis II. Multiyear Financial ProjectionsIII.

Orange Unified School District
3ExECuTIvE SummARy
Executive SummaryAlong with many other school districts in the state, the Orange Unified School District is entering a period of financial instability. FCMAT developed a Fiscal Health Risk Analysis that indicates the district is not in need of immediate fiscal intervention. However, this analysis did not take into consideration FCMAT’s multiyear financial projection, which included the impact of the Governor’s funding reduction proposals. When considering this information, it is clear that future financial trends will differ significantly from those in the past. As a result, without significant expenditure reductions or revenue enhancements, the district will require fiscal intervention by the state including the appointment of a state administrator.
The district’s most recent budget was submitted to the Orange County Department of Education with a positive certification, indicating the district will be able to meet its financial obligations in the current and subsequent two years. Since then, the Governor has proposed massive cuts in public education funding in response to the growing economic crisis, which would significantly deteriorate the district’s financial position. FCMAT’s multiyear financial projection indicates the district will close the 2008-09 fiscal year with a general fund balance of $7 million and the 2009-10 year with negative $19 million after accounting for the impact of the Governor’s proposals. This could change the district’s certification status from positive to negative in the next district budget, meaning the district will not be able to meet its financial obligations in the current or subsequent year. If this certification is necessary, the Orange County Department of Education could implement provisions of the Education Code that would result in fiscal intervention.
The most effective means of avoiding intervention is to implement a new financial plan that addresses the Governor’s proposed funding reductions by identifying revenue enhancements or expenditure reductions. Since nearly 90% of the district’s unrestricted general fund budget is comprised of salary and benefits for staff, any solution will likely include some form of staffing reductions. Therefore, the district should prepare to notify staff of pending layoffs as soon as possible to ensure it meets the required statutory deadlines.
The district developed budget reductions for the 2008-09 first interim budget report without details. FCMAT has been advised by the district staff that specific budget reductions were being developed at the time of this report. The district should develop specific identified budget reductions and/or revenue enhancements to address those reductions as well as the additional amounts necessary to respond to the state budget crisis.

Fiscal Crisis & Management Assistance Team
4 ExECuTIvE SummARy
To address issues regarding competitive staff compensation, the district negotiated salary increases that exceeded available funding sources, requiring budget reductions to accommodate increased costs. This practice will be difficult to continue given the state’s budget crisis and the district’s fiscal condition.
During the 2007-08 fiscal year, the district significantly increased its long-term debt, issuing $111 million in new debt for capital leases, retiree benefit program funding bonds and an early retirement plan. Nearly all the new debt service is to be funded from the district’s general fund.
In May 2008, the district issued $94.7 million in retirement health benefits funding bonds, otherwise known as OPEB bonds. The bonds were issued to refinance a portion of the district’s retiree benefits obligation for eligible current and former employees pursuant to employment contracts. However, the market value of the investment portfolio has decreased as a result of last year’s economic downturn. The district should seek advice from an independent third party investment advisor regarding strategies to address the decline in asset value to restore the plan to its original structure and viability.
The district implemented a Supplementary Retirement Plan, or SRP, in June 2008. The plan requires annual payments of approximately $2 million for five years from the district’s general fund. The first payment is due in the 2008-09 year.
Until recently, the district considered issuing additional certifications of participation (COPs) to finance facility modernization projects. The district should postpone consideration of any additional debt issuance until the state budget is decided, final funding amounts are identified, and district cash-flow needs are clearer.
The district allocated $741,000 of its $850,000 budgeted revenues of capital facilities fund No. 25 to fund Facilities Department positions. This fund is utilized to account for impact fees on local commercial, industrial and residential development, otherwise known as developer fees. The district should develop a contingency plan for these positions in case the capital facilities fund revenues and ending balance prove insufficient to continue funding these positions.
The Governor has proposed cash deferrals that will decrease the district’s general fund cash balances. The district staff projects Orange Unified’s cash balance to be $11 million at June 30, 2009. The district should revisit its cash projections and exercise options that are necessary and appropriate to continue to meet its payroll, vendor and other cash demands.
Below is a summary of FCMAT’s multiyear financial projection for the Orange Unified School District

Orange Unified School District
5ExECuTIvE SummARy
General Fund – Combined FCMAT Multiyear Financial ProjectionDescription FCMAT
Adjusted 2008-09Year 1
2009-10Year 2
2010-11Total Revenues 227,544,232 218,600,763 216,166,223
Total Expenditures 249,762,058 243,854,962 247,511,896Excess (Deficiency) -22,217,826 -25,254,199 -31,345,673
Total Other Sources/Uses -83,660 -1,208,110 -1,208,110Net Increase/Decrease -22,301,486 -26,462,309 -32,553,783
Beginning Balance 29,517,256 7,215,770 -19,246,539Ending Balance 7,215,770 -19,246,539 -51,800,322
3% Reserve 7,529,105 7,351,892 7,461,600Other designated 3,153,719 280,345 285,716
UndesignatedNegative Shortfall -3,467,054 -26,878,776 -59,547,638

Fiscal Crisis & Management Assistance Team
6 ExECuTIvE SummARy

Orange Unified School District
7FISCAL hEALTh RISk ANALySIS
Findings and Recommendations
Fiscal health Risk AnalysisFCMAT developed the Fiscal Health and Risk Analysis to evaluate key fiscal indicators that help a school district measure its financial solvency for the current and two subsequent fiscal years as recommended by AB 1200. The presence of any single criteria is not necessarily an indication of a district in fiscal crisis. However, districts exceeding the risk threshold of six or more “No” responses may have cause for concern and require some level of fiscal intervention. Diligent planning will enable a district to better understand its financial objectives and strategies to sustain its financial solvency. A district must continually update its budget as new information becomes available.The Fiscal Health and Risk Analysis includes 17 components of key fiscal indicators to measure a district’s potential risk. Below are the results of FCMAT’s analysis by indicator. “N/A” denotes an indicator that is not applicable to the Orange Unified School District.
Deficit SpendingIs the district avoiding deficit spending in the current year? • NoIs the district avoiding deficit spending in the two subsequent fiscal years? • NoHas the district controlled deficit spending over the past two fiscal years? • NoIs the issue of deficit spending addressed by fund balance, ongoing revenues, or •expenditure reductions? NoHas the board approved a plan to eliminate deficit spending? • NoRating: No
The district experienced a deficit of $1,559,930 in the general fund in 2006-07, but had a surplus of $2,784,840 in 2007-08. As of the 2008-2009 first interim financial report, the district is projected to experience a deficit of $14,014,301.
The fund balance will decrease by $3,751,187, a net change of $11,035,751, as a result of assumed budget adjustments according to the district’s 2008-09 first interim financial report multiyear financial projection. Of these adjustments, $10,200,000 is for unidentified unrestricted expenditures and $400,000 for unrestricted certificated substitute reductions. The balance represents $435,751 in budgeted restricted certificated salaries carried over from 2008-09, which were removed in 2009-10. Without these adjustments, the deficit would be $14,786,940 in 2009-10.

Fiscal Crisis & Management Assistance Team
8 FISCAL hEALTh RISk ANALySIS
The 2010-11 fiscal year fund balance is projected to decrease by $2,057,405, which is net of the unidentified unrestricted budget adjustments of $10,200,000 from the previous year. Without these adjustments, the deficit would be $12,257,405 in 2010-11.
In addition to the budget adjustments assumed in the 2008-09 first interim report, the district will need to make budget cuts based on the current year state funding reductions imposed through the emergency legislation and/or identify revenue enhancements.
The following table provides a summary of the impact of these deficits on the general fund ending balance, decreasing the balance from $29 million to $9 million over three years.
Table 1 - General Fund Ending Balance - 2008-09 Orange USD First Interim Report
FiscalYear
BeginningFund
Balance
General Fund
DeficitSpending
EndingFund
Balance2008-2009 $29,517,256 -$14,014,301 $15,502,9552009-2010 $15,502,955 -$3,751,187 $11,751,7682010-2011 $11,751,768 -$2,057,405 $9,694,363
Fund BalanceIs the district’s fund balance at or consistently above the recommended reserve for •economic uncertainty? YesIs the fund balance stable or increasing due to ongoing revenues and/or •expenditure reductions? NoDoes the fund balance include any designated reserves for unfunded liabilities or •one-time costs above the recommended reserve level? Yes Rating: No
The district’s fund balance is at or above the recommended reserve for economic uncertainty and therefore, the district will be able to meet its state recommended reserves of 3% in the current fiscal year. However, the district must make significant budget adjustments of $11,035,751 in the subsequent fiscal year to maintain the reserve level.
Additionally, the district will need to make other identified budget reductions for the proposed mid-year budget cuts in 2008-09, which include the elimination of cost-of-living adjustments, deficits on the revenue limit and reductions in categorical funding.

Orange Unified School District
9FISCAL hEALTh RISk ANALySIS
The fund balance will be significantly affected by these additional mid-year budget cuts imposed through emergency legislation; therefore, the district exceeds the risk threshold for this item.
Reserve for Economic UncertaintyIs the district able to maintain its reserve for economic uncertainty in the current •and two subsequent years based on current revenue and expenditure trends? YesDoes the district have additional reserves in fund 17, special reserve for noncapital •projects? NoIf not, is there a plan to restore the reserve for economic uncertainties in the •district’s multiyear financial projection? No
Rating: No
The district will be unable to maintain its reserve for economic uncertainty in the subsequent two fiscal years unless the Governing Board approves ongoing budget adjustments as described above. To date, the district’s multiyear financial projection includes reductions without any details. The district staff advised that planning for budget reductions was well underway at the time of FCMAT’s fieldwork.
The district does not have additional reserves in a special reserve fund for noncapital projects.
EnrollmentHas the district’s enrollment been increasing or stable for multiple years? • NoIs the district’s enrollment projection updated at least semiannually? • YesAre staffing adjustments for certificated and classified employee groups consistent •with the enrollment trends? YesDoes the district analyze enrollment and ADA data? • YesDoes the district track historical data to establish future trends between P-1 and •P-2 for projection purposes? YesHas the district implemented any attendance programs to increase ADA? • NoHave approved charter schools had little or no impact on the district’s student •enrollment? YesDoes the district have a board policy that attempts to reduce the effect that •transfers out of the district have on the district’s enrollment? Yes
Rating: Yes

Fiscal Crisis & Management Assistance Team
10 FISCAL hEALTh RISk ANALySIS
The district’s enrollment has declined by 3.72% over the last five years with a net loss of 1,087 students. Enrollment in the current year; however, has increased by 258 students based on September enrollment counts. Enrollment projections are updated during the first and second interim reporting periods. It is critical to monitor ADA trends in a district that is experiencing declining enrollment. The district monitors enrollment and ADA trends monthly and has records dating to the 1991-92 school year.
Unified districts generally average 93 to 94% ADA to enrollment. In prior years, the Orange Unified has been consistently at or above 96%.
The district does not have a process to share actual enrollment and ADA information with school administrators. The district should share enrollment to ADA data with school site administrators and compare the current year data with prior years monthly. Any variances should be investigated.
The district has taken a proactive approach to declining enrollment by eliminating transfers from the district to neighboring districts and improving attendance rates by initiating Saturday school.
Staffing adjustments are commensurate with enrollment calculations.
Two in-district charter schools serve middle school students. The charter schools’ enrollment has increased slightly over time. The charter schools operate within their allocated revenue streams along with donations from parents without affecting the district’s general fund.
Interfund Borrowing Can the district manage its cash flow in all funds without interfund borrowing? •NoIs the district repaying the funds within the statutory period in accordance with •Education Code Section 42603? Yes
Rating: Yes
The district is unable to sustain adequate cash in the general fund without issuing Tax Revenue Anticipation Notes (TRANs) or borrowing from other funds. The first interim budget report for 2008-2009 indicates that the general fund has borrowed $24,303,293 from other funds. TRANs have not been implemented in the current or prior fiscal years, yielding a savings of issuance and interest costs to the general fund. The district plans to repay the loans within the statutory period in accordance with Education Code 42603.

Orange Unified School District
11FISCAL hEALTh RISk ANALySIS
The district updates and prepares its cash flow at interim reporting periods. As the state experiences cash flow issues, districts will need to stay current with apportionment deferrals and properly plan and manage district cash flow needs.
Bargaining AgreementsHas the district settled the total cost of the bargaining agreements at or under •COLA during the current and past three years? NoDid the district conduct a presettlement analysis identifying an ongoing revenue •source to support the agreement? YesDid the district correctly identify the related costs above the COLA, (i.e. statutory •benefits, step and column)? YesDid the district address budget reductions necessary to sustain the total •compensation increase including a board-adopted plan? YesDid the superintendent and CBO certify the agreement prior to ratification? • YesIs the governing board’s action consistent with the superintendent’s/CBO’s •certification? YesDid the district submit to the county office of education the AB 1200\2756 full •disclosure as required? Yes
Rating: Yes
The district has not settled negotiations with any of the bargaining units for the 2008-09 fiscal year.
Prior tentative agreements have been properly submitted to the county office under AB1200 and AB2756 disclosure guidelines with the appropriate superintendent and CBO certifications.
During the last seven years, the district has settled the total cost of bargaining agreements at a level that is 1.09% to 11.01% higher than the cost-of-living adjustments (COLA) received from the state. The district’s administration has identified ongoing budget adjustments necessary to support the agreements in each year to sustain the total compensation increases above COLA.
The district pays the contribution to the PERS retirement system for all classified employees, and these totaled $2.7 million in the current fiscal year. This amount has not been reflected in the total related cost of benefits as described above.
General Fund Is the percentage of the district’s general fund unrestricted budget allocated to •salaries and benefits at or under the statewide average? Yes

Fiscal Crisis & Management Assistance Team
12 FISCAL hEALTh RISk ANALySIS
Is the district making sure that only ongoing restricted dollars pay for permanent •staff? YesDoes the budget include reductions in expenditures proportionate to one-time •revenue sources, such as parcel taxes, that will terminate in the current or two subsequent fiscal years? YesIf the district receives redevelopment revenue that is subject to AB 1290 and SB •617, has it made the required offset to the revenue limit? YesRating: Yes
As the following data shows, the district’s unrestricted salary and benefit cost as a percentage of all general fund expenditures is lower than the statewide average for unified school districts. The following table provides a summary of the comparison for the 2005-06 and 2006-07 years (statewide averages for 2007-08 have not been certified by the state).
Table 2 - Salary and Benefits as a Percentage of Total Expenditures - Unrestricted2005-06 2006-07
Orange USD 88.7% 89.5%Statewide Average 91.4% 90.3%
Source: Ed Data Web page
Only ongoing dollars from restricted funding sources should pay for permanent staff compensation. All onetime revenues and expenditures have been denoted in the budget and sunset within the proper fiscal year. All redevelopment revenues have been properly reported.
EncroachmentIs the district aware of the contributions to restricted programs in the current •year? (Identify cost, programs and funds) YesDoes the district have a reasonable plan to address increased encroachment •trends? YesDoes the district manage encroachment from other funds such as adult, cafeteria, •child development, etc.? Yes
Rating: Yes
The district administration requires all restricted program expenditure allocations (except special education and home-to-school transportation) to be within the related revenue sources. Exceptions may be submitted to the Superintendent for special consideration. To date, encroachments have been approved for the community day school $258k, Professional Development Block Grant $176k and Targeted Instructional Improvement Grant (TIIG) for $455k.

Orange Unified School District
13FISCAL hEALTh RISk ANALySIS
Other funds such as the adult education, child development and cafeteria funds are self-contained programs that do not require a subsidy from the general fund. The cafeteria fund, however, pays approximately half the allowable indirect cost rate for general fund services.
Management Information SystemsIs the district’s financial data accurate and timely? • YesAre the county and state reports filed in a timely manner? • YesAre key fiscal reports readily available and understandable? • YesIs the district on the same financial system as the county? • NoIf the district is on a separate financial system, is there an automated interface •with the financial system maintained by the county? Yes
Rating: Yes
The district utilizes the Quintessential School Systems (QSS) financial software program. This is a fully integrated software application that includes position control, budget development, purchasing and general ledger modules. The Orange County Department of Education (OCDE) uses Bi-Tech for its financial transaction processing. The two systems are integrated electronically and reconciled monthly at the major object code level. The county office processes commercial and payroll warrants for the district.
The district utilizes the QSS budget development module, downloading into Excel for preparation of multiyear financial projections.
Position ControlDoes the district maintain a reliable position control system? • YesIs position control integrated with payroll? • NoDoes the district control unauthorized hiring? • YesAre the appropriate levels of internal controls in place between the business and •personnel departments to prevent fraudulent activity? YesDoes the district use position control data for budget development? • YesIs position control reconciled against the budget during the fiscal year? • Yes
Rating: Yes
The district utilizes the QSS position control module to track authorized positions. The position control module is not integrated with the payroll system, but adequate internal controls are in place to ensure that only authorized positions are paid through the payroll system. The Personnel Department prepares a Personnel Action Request (PAR) which is sent to the Budget Department. The Budget Department verifies that the position is vacant and available in the position control system. Once fully approved, the PAR is sent to payroll for input.

Fiscal Crisis & Management Assistance Team
14 FISCAL hEALTh RISk ANALySIS
The business office periodically audits to ensure that the budgeted positions agree with those authorized in position control. During fieldwork, FCMAT reviewed proper internal control procedures between the budget, position control and actual payroll recorded. The district staff does audits three to four times a year to ensure that the amounts paid in the payroll system agree with either position control or budgeted positions.
The district has established adequate internal controls between the Business and Personnel departments to prevent or detect fraudulent activity.
Budget MonitoringAre budget revisions completed in a timely manner? • YesDoes the district openly discuss the impact of budget revisions at the board level? •YesAre budget revisions made or confirmed by the board at the same time the •collective bargaining agreement is ratified? YesHas the district’s long-term debt decreased from the prior fiscal year? • NoHas the district identified the repayment sources for long-term debt or nonvoter-•approved debt, i.e. certificates of participation, capital leases? YesDoes the district’s financial system have a hard-coded warning regarding •insufficient funds for requisitions and purchase orders? YesDoes the district encumber salaries and benefits? • No
Rating: Yes
The district utilizes the QSS financial management system. The business office has a periodic system to monitor the budget. Salaries and benefits are not encumbered in the financial system. This valuable budget monitoring feature should be implemented. The district’s financial system has a hard-code warning that appears when requisitions or purchase orders are submitted, and insufficient funds are budgeted.
Budget revisions should be updated and reported to the Governing Board monthly, especially since the district is experiencing fiscal distress and declining enrollment. It is essential to keep the board and senior management informed regarding the district’s budget.
The district issued $53 million in certificates of participation (COPs) dated May 1, 2003. The proceeds were used to provide funds to refinance the district’s 1994 COPs, and finance construction of additional educational facilities as well as an equipment lease. Debt service is funded via redevelopment agency proceeds.

Orange Unified School District
15FISCAL hEALTh RISk ANALySIS
The district Public Financing Authority issued four special tax revenue bonds to fund the construction of district facilities. As of June 30, 2008, the principal balance outstanding on the bonds was $22,375,000.
In May 2008, the district issued OPEB bonds totaling $94.7 million to fund retirement, health and other benefits for eligible and former employees pursuant to negotiated contractual agreements. The bonds were originally structured so that general fund contributions and interest earnings would generate sufficient funds to satisfy the annual debt payment. The narrative on retiree health benefits below includes additional information.
In June 2008, the district issued a Supplemental Employee Retirement Plan (SERP), and 156 employees elected to retiree early in exchange for supplementary retirement benefits. Annual payments to the plan are approximately $2 million over five years beginning in fiscal year 2008-09. Funding for these payments is provided in the general fund through employee cost savings realized from program implementation.
Retiree Health Benefits Has the district completed an actuarial valuation to determine the unfunded •liability under GASB 45 requirements? YesDoes the district have a plan for addressing the retiree benefits liabilities? • YesHas the district conducted a re-enrollment process to identify eligible retirees? • No
Rating: Yes, with reservations
In July 2004, the Governmental Accounting Standards Board released GASB Statement No. 45, Accounting and Financial Reporting by Employers for Other Postemployment Benefits (OPEB). School districts generally utilize a pay-as-you-go method to fund their OPEB contributions, but this method fails to measure or recognize the cost of OPEB during the working career of employees rendering services. The district has complied with the implementation period for GASB Statements No. 43 and 45 by having an actuarial study prepared to estimate the district’s liability and financial disclosure requirements for OPEB. These include postemployment health benefits, life insurance, disability and long-term care benefits.
In May 2008, the district issued OPEB bonds totaling $94.7 million to pay retirement health and other benefits to eligible and former employees pursuant to negotiated contractual agreements. Proceeds from the OPEB bonds were deposited in the retiree benefits fund. It was estimated that the general fund contribution and interest earnings would generate sufficient funds to satisfy the annual debt payment.

Fiscal Crisis & Management Assistance Team
16 FISCAL hEALTh RISk ANALySIS
Because of decline in investment markets, the current market value of the original investment portfolio decreased by approximately $14 million as of the date of FCMAT fieldwork. The district is in the process of determining its investment options and projecting the long-term effects of the current devaluation. A determination should be made of how to support future payments from other sources if the market values of the investments fail to rebound. This “yes” rating appears with reservations because of that issue.
The district has not conducted re-enrollment to identify eligible dependents or retirees past age 65.
Leadership/Stability Does the district have a superintendent and/or CBO that has been with the district •more than two years? NoDoes the governing board adopt clear and timely policies and support the •administration in their implementation? Yes
Rating: No
The district has had two superintendents in the last four years, the one new starting in the current year. The CBO has been with the district for less than two fiscal years. The Governing Board recognizes the importance of updating board policies that are consistent with new laws and regulations. Board policies are updated on a periodic schedule based on priority.
Charter SchoolsHas the district identified a specific employee or department to be responsible for •oversight of the charter? YesHas the charter school submitted the required financial reports? • YesHas the charter school commissioned an independent audit? • YesDoes the audit reflect findings that will not impact the fiscal certification of the •authorizing agency? YesIs the district monitoring and reporting the current status to the board to ensure •that an informed decision can be made regarding the reauthorization of the charter? Yes
Rating: Yes
The district has two charter schools for middle school students, and these schools were formed pursuant to Education Code 47605. The charters were conversion schools and are operated by the district. One charter school’s financial activities are presented in the general fund for reporting purposes while the other is funded directly by the state.

Orange Unified School District
17FISCAL hEALTh RISk ANALySIS
Audit ReportDid the district receive an audit report without material findings? • YesCan the audit findings be addressed without impacting the district’s fiscal health? •YesHas the audit report been completed and presented within the statutory time line? •YesAre audit findings and recommendations reviewed with the board? • YesDid the audit report meet both GAAP and GASB standards? • Yes
Rating: Yes
The district’s audit report for fiscal year 2007-2008 showed no findings representing significant deficiencies or material weaknesses. There were no instances of noncompliance related to the financial statements that were required to be reported in accordance with Governmental Auditing Standards or OMB Circular A-133.
The district audit report included one finding.
FacilitiesHas the district passed a general obligation bond? • NoHas the district met the audit and reporting requirements of Proposition 39? • N/AIs the district participating in the state’s School Facilities Program? • YesDoes the district have sufficient personnel to properly track and account for •facility-related projects? YesHas the district met the reporting requirements of the Williams Act? • YesIs the district properly accounting for the 3% routine repair and maintenance •account requirement at the time of budget adoption? YesIf needed, does the district have surplus property that may be sold or used for •lease revenues? YesIf needed, are there other potential statutory options? • No
Joint Use: Can the district enter into a joint use agreement with some entities without declaring the property surplus and without bidding?Joint Occupancy: Is there opportunity for a joint venture that can authorize private development of district property that will result in some educational use?
Does the district have a facilities master plan that was completed or updated in the •last two years? No
Rating: Yes
The district attempted to pass two general obligation bonds (GO bonds) in 2004, but both failed to achieve the necessary majority of votes.

Fiscal Crisis & Management Assistance Team
18 FISCAL hEALTh RISk ANALySIS
The district participates in the state’s School Facilities Program. Participation in this program requires that the district properly account for a 3% routine repair and maintenance account in the general fund at the time of budget adoption. The audit for the fiscal year ended June 30, 2008 indicated that the district had met its required reserve.
COPs are long-term, tax-exempt debt instruments used to fund capital outlay projects. Because of the favorable tax treatment, COPS are usually issued to investors at or below current market rates. The district issued $53 million in COPs dated May 1, 2003. The proceeds were used to refinance the district’s 1994 COPs, finance construction of additional educational facilities and finance an equipment lease.
The Orange Unified School District Public Financing Authority has issued four Special Tax Revenue Bonds to fund the construction of district facilities. As of June 30, 2008, the principal balance outstanding on the bonds was $22,375,000.
The district has four surplus properties. The first is used for recreational programs and after school tutoring through a joint use agreement with the city of Orange. The second is used for nontraditional school programs including preschool, infant care, community day school and regional occupational programs. The last two properties generate $190,000 annually under lease agreements with private businesses.
The district updated its master plan four years ago. The master plan should be updated every two years.
General LedgerHas the district closed the general ledger (books) within the time prescribed by the •county office of education? YesDoes the district follow a year-end closing schedule? • YesHave beginning balances in the new fiscal year been recorded correctly for each •fund from the prior fiscal year? YesDoes the district adjust prior year accruals if the amounts actually received (A/R) •or paid (A/P) are greater or less than the amounts accrued? YesDoes the district reconcile all payroll suspense accounts at the close of the fiscal •year? Yes
Rating: Yes
The district has met all the time lines established by the county office for annual closing activities. District administration follows an extensive closing schedule that corresponds with county time lines.

Orange Unified School District
19FISCAL hEALTh RISk ANALySIS
Beginning balances have been recorded properly for each fund. Accounts receivables and payables are adjusted to reflect actual receipts or payments. Receipts or disbursements differing from the amounts accrued are properly recorded to offset accounts.
The district reconciles all payroll suspense accounts following the close of the fiscal year.
Total “No” Responses: 4KeyLow Risk: 0-4 “No” ResponsesModerate Risk: 5-9 “No” Responses.High Risk: 10-14 “No” ResponsesExtremely High Risk: 15-17 “No” Responses
ConclusionAs noted earlier, a rating with six or more “no” responses indicates a district that may be in need of fiscal intervention. The number of “no” responses places the district at the higher end of the low-risk category. This analysis was prepared based on the district’s 2008-09 first interim budget report, which did not consider the reductions included in the Governor’s 2009 proposed budget for public education. The impact of these funding reductions, without offsetting revenue enhancements or expenditure reductions by the district, would result in the need for outside fiscal intervention. If the district effectively addressed issues concerning budget deficits, projected reserves for economic uncertainties and negative fund balances, it could avoid outside fiscal intervention.
RecommendationsThe district should:
Analyze and update cash-flow projections at least monthly. 1.
Include the contribution to the PERS retirement system for all classified 2. employees in its calculations of the total cost of compensation.
Continue to ensure that only ongoing dollars from restricted funding sources pay 3. for permanent staff compensation.
Be cautious in allowing restricted programs to encroach on the unrestricted 4. general fund, especially during times of difficult fiscal challenges.
Expand its audit of budgeted positions and those authorized in position control to 5. include more frequent review and comparison of the payroll to position control and budget.

Fiscal Crisis & Management Assistance Team
20 FISCAL hEALTh RISk ANALySIS
Determine how to support future payments from other sources if the market 6. values of the investments fail to rebound.
Immediately conduct a re-enrollment to ensure that only eligible retirees and 7. dependents are enrolled in the health and other benefit plans.
Update its master plan every two years.8.

Orange Unified School District
21muLTIyEAR FINANCIAL pROjECTIONS
multiyear Financial projectionsFCMAT validated revenue and expenditure allocations included in the Orange Unified School District’s 2008-09 first interim general fund budget and developed an independent multiyear financial projection (MYFP) for 2009-10 and 2010-11 using FCMAT’s Budget Explorer software. The base year of the projection is 2008-09, and the variables used by FCMAT are consistent with the most current School Services of California Dartboard and any mid-year reductions that are completed and signed by the Governor as of the time of this review.
Multiyear financial projections are required by Assembly Bill (AB)1200 and AB 2756 and are a part of the adoption budget and interim reporting process. In June 2004, AB 2756 (Daucher) was passed and signed into law on an urgency basis. This legislation made substantive changes to the financial accountability and oversight processes used to monitor the fiscal position of school districts and county offices of education. Among other things, AB 2756 strengthened the roles of the Superintendent of Public Instruction (SPI), the County Office of Education and FCMAT and their ability to intervene during fiscal crises.
There are inherent limitations with any forecast of financial data because calculations are based on certain assumptions and criteria that include enrollment trends, projected cost-of-living increases, projections for deferrals, forecasts for utilities, fuel and other consumables as well as economic conditions at the state, federal and local levels. Therefore, the budget forecasting model is based on certain criteria and assumptions rather than a prediction of exact numbers. Multiyear financial projections facilitate more informed decision-making and provide the ability to forecast the fiscal impact of current decisions, but these projections should be updated at least during each interim financial reporting period and in preparation for negotiations.
To evaluate a multiyear projection, attention is focused on the district’s ability to meet its reserve requirement demonstrating a positive unappropriated fund balance. FCMAT has analyzed deficit spending trends that demonstrate the need for the district to make adjustments either to increase revenue or decrease expenditures, or both, to maintain a positive unappropriated fund balance. When the unappropriated fund balance is negative, the deficit balance is the amount by which the budgeted expenditures must be reduced to meet the reserve requirements under AB1200 guidelines.
If a district is unable to meet its financial obligations for the current or two subsequent fiscal years, or has a qualified or negative budget certification, the county superintendent of schools is required notify the governing board of the district and the SPI. The county office of education must follow Education Code section 42127.6 when assisting a school district in this situation. In the case of a district that does not meet its required reserve levels, the intent of the MYFP is to assist the county and the district in formulating a plan to regain fiscal solvency and restore the required ending fund balance reserves levels.

Fiscal Crisis & Management Assistance Team
22 muLTIyEAR FINANCIAL pROjECTIONS
FCMAT reviewed the district’s records, interviewed staff members and examined financial reports to gather the information needed for the multiyear financial projection. FCMAT’s multiyear financial projection indicates that the district will not meet its reserve requirement in the current and two subsequent fiscal years without a detailed plan to increase revenue and/or reduce expenditures and cease deficit spending. FCMAT’s review of the district’s finances, including preparation of a multiyear financial projection using FCMAT’s Budget Explorer program, indicates that the district’s fiscal condition may deteriorate far more than projected by the district during the first interim budget report. The most significant factor contributing to this situation is the impact of the growing state budget crisis.
Sources of InformationIn addition to staff interviews, the FCMAT team utilized several district documents to develop a baseline and future assumptions for the MYFP including:
Approval letters from the county office regarding the adopted budget and interim •reports2008-09 SACS electronic dat. file for the first interim budget report•Financial system budget and actual reports •Unaudited actuals reports from 2004-05 through 2007-08 for all funds and •supporting schedulesRevenue limit worksheets including all supporting schedules for 2007-08 and •2008-09 Historical enrollment information for the current year and prior five fiscal years •and projections for the subsequent two yearsData regarding interfund transfers for 2007-08 and 2008-09•P1, P2 and P3 attendance reports and CBEDS data for the district from 2005-06 •through 2008-09An analysis of supplemental revenue sources such as redevelopment funds, •general obligation bonds, etc.An analysis of any one-time revenues or expenditures included in the 2008-09 •budgetPosition control spreadsheets identifying approved positions, account code, FTE, •salary and benefit placementActual payroll registers for the 2008-09 fiscal year•Salary schedules and salary placement information for all employee groups•Staffing allocations formulas by site for classified and certificated personnel•District and departmental organization charts•General fund cash flow statements for 2008-09 •Long-term debt schedules, 2007-08 and 2008-09•District-calculated multiyear projections prepared outside the SACS multiyear •format for 2008-09Collective bargaining agreements for all employee groups•

Orange Unified School District
23muLTIyEAR FINANCIAL pROjECTIONS
AB1200 disclosure documents for the most recent salary settlements for all •employee groupsCurrent salary proposals by both the district and the bargaining units•Actuarial reports for health and welfare retiree benefits as required by GASB 45•Historical information on the health and welfare rates for the prior four years•Independent audit reports, 2004-05 through 2007-08•COP agreements•A SRP program cost/savings analysis•An OPEB bond fiscal consultant analysis and official statement •Board minutes for the 2007-08 and 2008-09 fiscal years•
Significant AssumptionsFCMAT prepared its MYFPs without salary schedule increases to the staff through the entire projection period. Changes in the salary schedule are subject to negotiations. FCMAT included the impact of the Governor’s budget proposals for the 2008-09 and 2009-10 fiscal years, which include a significant mid-year state funding reduction in the current fiscal year as well as additional reductions in the budget year. Other significant assumptions include continued declining enrollment and related ADA, and no staffing reductions.
Also included in the projection are the following:
The average cost of step-and-column movement for all contracted salaries and the •associated cost of employer-paid statutory benefits of the following:
2.3% for the certificated bargaining unit staff2.0% for the classified bargaining unit staff1.2% for the management/confidential/supervisory staff, referred to by the district as the leadership group
No increases for health and welfare costs.•Increases in general operating expenditures based on the California Consumer •Price Index and other economic indicators.
The document attached as Appendix A to this report provides a complete list of all assumptions utilized in the MYFP.
Reconciliation of MYFP to District Budget FCMAT developed its projection utilizing a different set of assumptions than those assumed by the district in its 2008-09 first interim budget report. The following table provides a reconciliation of the changes.

Fiscal Crisis & Management Assistance Team
24 muLTIyEAR FINANCIAL pROjECTIONS
Table 3 - Reconciliation of FCMAT Projection to District Budget 2008-09FCMAT Orange USD Difference
Beginning Fund Balance $29,517,256 $29,517,256 $0Revenues $227,544,232 $236,057,774 -$8,513,542Expenditures -$249,762,058 -$249,988,415 $226,357Transfers In/Other Sources $1,124,450 $1,124,450 $0Transfers Out/Other Uses -$1,208,110 -$1,208,110 $0Ending Fund Balance $7,215,770 $15,502,955 -$8,287,185Detail of Ending Fund Balance:
Reserve for Econ Uncertainty $7,529,105 $7,535,896 -$6,791Other Reserves $275,000 $275,000 $0Board Designated $2,878,719 $2,878,719 $0Undesignated and Available -$3,467,054 $4,813,340 -$8,280,394
The district assumed a 5.66% COLA for its revenue limit funding reduced by a 4.713% deficit, which were the industry standards at the time the budget was prepared. FCMAT utilized the Governor’s budget mid-year funding reduction proposal, which provides a 5.66% COLA, but applies a 9.68% deficit. This decreased projected revenues by more than $8.3 million in the 2008-09 year.
FCMAT projects that the district’s 2008-09 P2 ADA will be 92 greater than projected by the district, increasing revenues by $562,000. The difference in ADA is driven by projected actual attendance factors. FCMAT utilized the district’s historical average of 95.4%, and the district utilized 95%.
Title I revenues were reduced by $47,000 to the amount allocated to the district in the California Department of Education (CDE) apportionment schedule.
Lottery revenues were reduced by $376,000 and $231,000 for the unrestricted and restricted resources, respectively, to reflect actual prior year annual ADA counts and the most recent lottery funding estimate from School Services of California’s 2009 Governor’s Budget Proposal Financial Dartboard.
Other adjustments reducing revenues by $105,000 accounted for the balance of the difference between FCMAT and district projections.
Regarding expenditures, books and supplies were reduced $231,000 to balance the reduction in restricted lottery funds and $47,000 to balance Title I funding adjustments as noted above. Other adjustments adding $41,000 accounted for the balance of the difference in expenditures.
The net impact of all changes was to decrease the district’s ending fund balance by $8.3 million from $15.5 million to $7.2 million. The reduced expenditures resulted in a slightly lower reserve for economic uncertainties. All these adjustments created a general fund shortfall of $3.4 million.

Orange Unified School District
25muLTIyEAR FINANCIAL pROjECTIONS
FCMAT also included the following significant assumptions for the m MYFP’s 2009-10 and 2010-11 fiscal years.
FCMAT’s projection indicates district enrollment will decline by 552 and 594 1. students in the 2009-10 and 2010-11 fiscal years, respectively. The district projected enrollment will remain stable through this same period. FCMAT utilized the cohort survival technique, which indicates the general pattern of declining enrollment over the past several years will continue through the MYFP period. The section of this report titled “Declining Enrollment” includes more information.
The district’s 2008-09 first interim budget report MYFP includes $10.2 million 2. in unspecified unrestricted expenditure reductions. FCMAT did not assume these reductions in its MYFP because the specifics have yet to be developed, although the district staff and the school board had begun to identify these reductions as of the writing of this report. The cumulative impact of this assumption is to reduce the general fund ending fund balance by $20.4 million by the end of the 2010-11 fiscal year relative to the district’s first interim MYFP.
The district did not provide for workers compensation insurance premiums in the 3. 2008-09 fiscal year budget since it plans to draw on the fund 68 self-insurance pool residual from its workers compensation self-insured program. The district converted from a self-insured to a fully insured program in the 2008-09 fiscal year, leaving a surplus of $8.6 million in fund 68. FCMAT and the district assumed funding for workers compensation premiums will again be included in the general fund budget beginning with the 2009-10 fiscal year.
The district’s MYFP projected 16.8% and 3.3% increases in the general fund 4. contribution to restricted programs for the 2009-10 and 2010-11 fiscal years, respectively. FCMAT’s MYFP includes increases of 10.9% and 4.2% respectively reflecting differing assumptions regarding the carryover of restricted program resources.
A detailed report of the FCMAT MYFP is attached as Appendix B to this report.
Deficit SpendingThe district experienced general fund surpluses in recent years. However, the district began deficit spending in the general fund beginning in the 2008-09 fiscal year, and FCMAT projects that this will continue through the 2010-11 year unless new and significant budget reductions or revenue enhancements are implemented.
Fiscal Crisis & Management Assistance Team
26 muLTIyEAR FINANCIAL pROjECTIONS
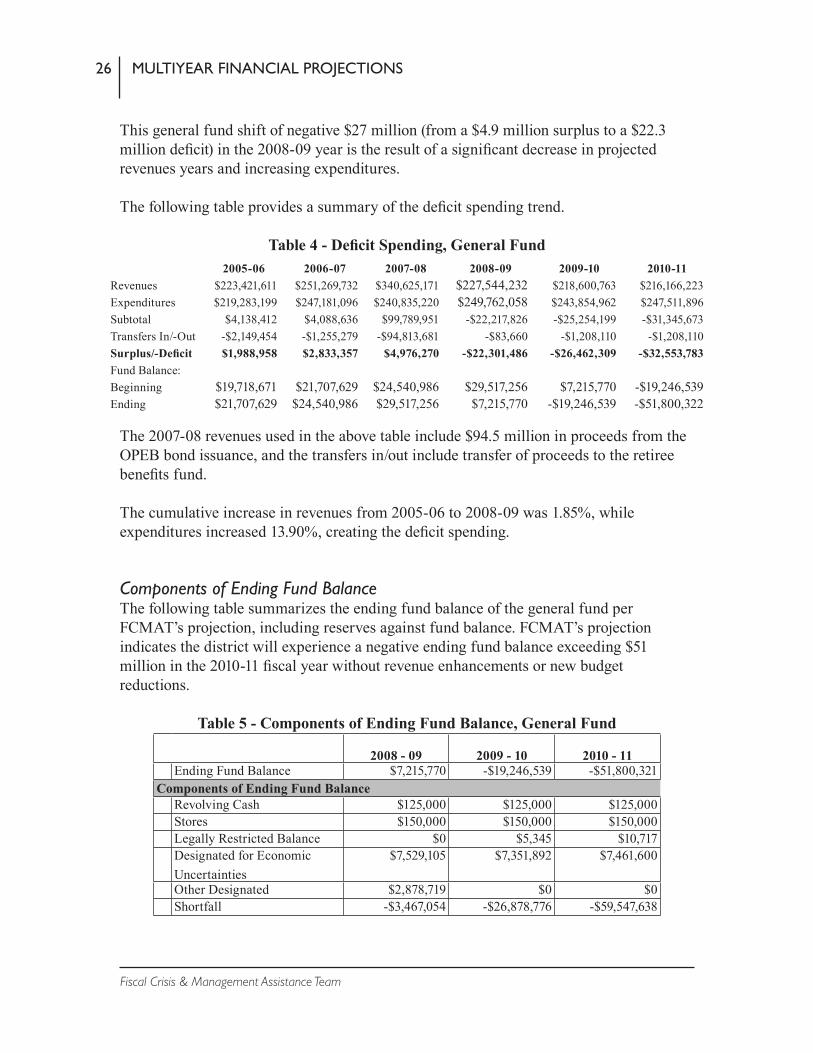
This general fund shift of negative $27 million (from a $4.9 million surplus to a $22.3 million deficit) in the 2008-09 year is the result of a significant decrease in projected revenues years and increasing expenditures.
The following table provides a summary of the deficit spending trend.
Table 4 - Deficit Spending, General Fund2005-06 2006-07 2007-08 2008-09 2009-10 2010-11
Revenues $223,421,611 $251,269,732 $340,625,171 $227,544,232 $218,600,763 $216,166,223Expenditures $219,283,199 $247,181,096 $240,835,220 $249,762,058 $243,854,962 $247,511,896Subtotal $4,138,412 $4,088,636 $99,789,951 -$22,217,826 -$25,254,199 -$31,345,673Transfers In/-Out -$2,149,454 -$1,255,279 -$94,813,681 -$83,660 -$1,208,110 -$1,208,110Surplus/-Deficit $1,988,958 $2,833,357 $4,976,270 -$22,301,486 -$26,462,309 -$32,553,783Fund Balance:Beginning $19,718,671 $21,707,629 $24,540,986 $29,517,256 $7,215,770 -$19,246,539Ending $21,707,629 $24,540,986 $29,517,256 $7,215,770 -$19,246,539 -$51,800,322
The 2007-08 revenues used in the above table include $94.5 million in proceeds from the OPEB bond issuance, and the transfers in/out include transfer of proceeds to the retiree benefits fund.
The cumulative increase in revenues from 2005-06 to 2008-09 was 1.85%, while expenditures increased 13.90%, creating the deficit spending.
Components of Ending Fund BalanceThe following table summarizes the ending fund balance of the general fund per FCMAT’s projection, including reserves against fund balance. FCMAT’s projection indicates the district will experience a negative ending fund balance exceeding $51 million in the 2010-11 fiscal year without revenue enhancements or new budget reductions.
Table 5 - Components of Ending Fund Balance, General Fund
2008 - 09 2009 - 10 2010 - 11 Ending Fund Balance $7,215,770 -$19,246,539 -$51,800,321Components of Ending Fund Balance Revolving Cash $125,000 $125,000 $125,000 Stores $150,000 $150,000 $150,000 Legally Restricted Balance $0 $5,345 $10,717 Designated for Economic
Uncertainties$7,529,105 $7,351,892 $7,461,600
Other Designated $2,878,719 $0 $0 Shortfall -$3,467,054 -$26,878,776 -$59,547,638

Orange Unified School District
27muLTIyEAR FINANCIAL pROjECTIONS
ShortfallThe projected deficits created ending fund balance shortfalls of $3.4 million, $26.8 million and $59.5 million in 2008-09, 2009-10 and 2010-11 of respectively. A shortfall is the difference between the minimum 3% state recommended reserve for economic uncertainties plus all other required and designated reserves and the projected ending fund balance. FCMAT’s projected shortfalls are compared to the unappropriated ending fund balance in the district’s multiyear financial projection in the following table.
Table 6 - Reconciliation of FCMAT Projection of Shortfall2008-09 2009-10 2010-11
Shortfall, Ending Fund Balance:FCMAT - Projected -$3,467,054 -$26,878,776 -$59,547,638Orange USD - Budgeted $4,813,340 $4,000,641 $1,799,874Difference -$8,280,394 -$30,879,417 -$61,347,512
State Budget Crisis The Governor declared a fiscal emergency and invoked the provisions of Proposition 58 in response to California’s rapidly deteriorating economic situation and its effect on state revenues. Proposition 58 prohibits the state from acting on any other legislation until legislation to address the fiscal crisis is signed by the Governor. The legislature has met since November 2008 to develop a new state budget, but none has been finalized.
Both sides acknowledge that the solution will require significant funding reductions for public education. School Services of California (SSC) and FCMAT concur that school districts should assume the Governor’s proposals in their financial planning.
SSC calculated new deficits for school district revenue limits to reflect the Governor’s proposals. These new deficits are as follows:
2008-09 = 9.69%2009-10 and 2010-11 = 16.16%
These projected deficits are projected to decrease district funding by $8.3 million in 2008-09, $10 million in 2009-10 and $9.3 million in 2010-11. The cumulative impact of $27.6 million for these funding reductions over three years would be devastating to the district’s financial position.
Categorical Program FlexibilityThe Governor’s budget proposal would allow school districts to use their state-funded categorical program allocations for virtually any purpose subject to a public hearing process. FCMAT did not incorporate any of these flexibility provisions into the MYFP since the decision on how this funding would be utilized belongs to the school board. FCMAT cannot assume any particular categorically restricted program would be terminated.
Fiscal Crisis & Management Assistance Team
28 muLTIyEAR FINANCIAL pROjECTIONS
Declining Enrollment Proper enrollment tracking and analysis of ADA are essential to providing a solid foundation for budget planning. When enrollment and related ADA are declining, the district must exercise extreme caution regarding significant budgetary impacts such as negotiations with collective bargaining units, staffing ratios and deficit spending to avoid fiscal insolvency. Diligent planning will enable the district to better understand its financial objectives and strategies to sustain future financial stability.FCMAT reviewed the district’s enrollment and ADA trends for 2003-04 through 2008-09. The review compared the October California Basic Educational Data System (CBEDS) student enrollment counts to the April P-2 ADA actual data.
The district has experienced declining enrollment for several years, and FCMAT projects this trend will continue during the multiyear financial projection period. District California Basic Educational Data System (CBEDS) enrollment excluding charter schools has declined from 29,797 in 2003-04 to 28,040 in 2008-09, a cumulative decrease of 5.9%. While enrollment increased by 120 students in the 2008-09 year, FCMAT projects enrollment will again decline to 26,893 in 2010-11, a loss of another 1,147 students.
MethodologyThe method utilized to project district enrollment is the traditional cohort-survival technique, which groups students by grade level upon entry and tracks them annually. This method evaluates the longitudinal relationship of the number of students passing from one grade to the next in the subsequent year. In doing so, it more closely accounts for retention and student transfer to and from the district on a grade-by-grade basis. Although other enrollment forecasting techniques are available, the cohort-survival method is usually the best choice for school districts because of its sensitivity to incremental changes in several key variables.
Percentages are calculated from historical enrollment data to determine a reliable percentage of increase or decrease in enrollment between any two grades. For example, if 100 students enrolled in first grade in 2006-07 and that number increased to 104 students in second grade in 2007-08, the percentage of survival would have been 104% or a ratio of 1.04. These ratios are calculated between each pair of grades or years in school districts over several recent years. The ratios used are the key factors in the reliability of the projections given the validity of the data at the starting point. The strength of the ratios lies in the fact that each ratio encompasses collectively the variables that could possibly account for an increase or decrease in the size of a grade cohort as it moves to the next grade level.

Orange Unified School District
29muLTIyEAR FINANCIAL pROjECTIONS
Enrollment variables include the following:
Birth rates and trends•Historical ratio of enrollment progression between grade levels•Changes in educational programs•Inter-district transfers•Migration patterns in\out of schools•Changes in local and regional demographics•Industry changes – new industry coming to, or existing industry moving from the •areaResidential housing starts and the correlation of housing starts with local, state or •national economics
FCMAT projected kindergarten enrollments utilizing a birthrate analysis that averaged the previous five years ratios of kindergarten enrollments with Orange County birth counts five years prior. This calculation blends the most current five-year enrollment ratio with kindergarten-eligible students for the upcoming school year.
The following table reflects the data and methodology utilized for the kindergarten enrollment projection.
Table 7: Kindergarten Enrollment ProjectionsCalendar Year 1998 1999 2000 2001 2002Number of Live Births 46,189 46,509 46,980 45,492 44,796School Year 2003-04 2004-05 2005-06 2006-07 2007-08Kindergarten Class 2,146 2,175 2,097 2,048 2,109% of Enrollment / Births 4.65% 4.68% 4.46% 4.50% 4.71%Average 4.60%
Source: Department of Health Services Statistical Data
FCMAT then used an average of the previous two years utilizing CBEDS historical enrollment information and applying the cohort-survival technique to project enrollment for grades one through 12.
The following tables reflect the historical and projected enrollment. The table excludes the district’s two charter middle school enrollment counts.

Fiscal Crisis & Management Assistance Team
30 muLTIyEAR FINANCIAL pROjECTIONS
Table 8: Historical Enrollment Data 2003/04 CBEDS
2004/05 CBEDS
2005/06 CBEDS
2006/07 CBEDS
2007/08 CBEDS
2008/09 CBEDS
Kindergarten 2,146 2,175 2,097 2,048 2,109 2,085 1st Grade 2,440 2,247 2,553 2,324 2,206 2,185 2nd Grade 2,448 2,358 2,185 2,309 2,231 2,171 3rd Grade 2,598 2,390 2,321 2,114 2,230 2,262 Total 1-3 7,486 6,995 7,059 6,747 6,667 6,618 4th Grade 2,651 2,510 2,348 2,249 2,105 2,289 5th Grade 2,506 2,609 2,430 2,272 2,211 2,124 6th Grade 2,582 2,462 2,575 2,430 2,260 2,244 Total 4-6 7,739 7,581 7,353 6,951 6,576 6,657 7th Grade 1,431 1,483 1,311 1,391 1,333 1,258 8th Grade 1,495 1,378 1,421 1,260 1,369 1,346 Total 7-8 2,926 2,861 2,732 2,651 2,702 2,604 9th Grade 2,520 2,637 2,535 2,486 2,429 2,571 10th Grade 2,518 2,401 2,515 2,494 2,492 2,456 11th Grade 2,223 2,340 2,271 2,465 2,487 2,516 12th Grade 2,239 2,176 2,193 2,295 2,458 2,533 Total 9-12 9,500 9,554 9,514 9,740 9,866 10,076 Total CBEDS 29,797 29,166 28,755 28,137 27,920 28,040 Enrollment Change (631) (411) (618) (217) 120
Table 9: Projected Enrollment DataKindergarten 2,072 2,026 1st Grade 2,269 2,255 2nd Grade 2,092 2,173 3rd Grade 2,131 2,053 Total 1-3 6,492 6,481 4th Grade 2,235 2,105 5th Grade 2,249 2,195 6th Grade 2,115 2,239 Total 4-6 6,599 6,539 7th Grade 1,235 1,164 8th Grade 1,227 1,205 Total 7-8 2,462 2,369 9th Grade 2,466 2,247 10th Grade 2,522 2,418 11th Grade 2,388 2,452 12th Grade 2,487 2,361 Total 9-12 9,862 9,478 Total CBEDS 27,488 26,893 Enrollment Change (552) (594)

Orange Unified School District
31muLTIyEAR FINANCIAL pROjECTIONS
Average Daily AttendanceTo calculate the district’s revenue limit, state aid is calculated on the greater of current or prior year period two (P-2) reports for ADA. Because the district is in declining enrollment, the multiyear projection will use the prior-year ADA to calculate the state apportionment.
To project ADA, FCMAT applied the average of the previous five year’s actual attendance rate factors to project P2 ADA in the multiyear financial projection years. That average was 95.4%, which is higher than the industry standard of 94%.
Since ADA is the primary source of funding for the general fund, the district must apply the appropriate time and resources necessary to manage and monitor these projections. The ADA projections will change over time and should be adjusted frequently, at least during the adoption of the district’s budget and during the interim budget report filing periods. Monthly adjustments that calculate the difference between the projected ADA and the actual ADA reported would provide the district with the most up to date information and allow management to react to changes in trends. Historical and future trends require careful analysis that considers a variety of factors, including charter schools, county office and district special education programs, nonpublic school attendance, and prior-year adjustments.
Revenues FCMAT’s revenue projections were developed as noted below.
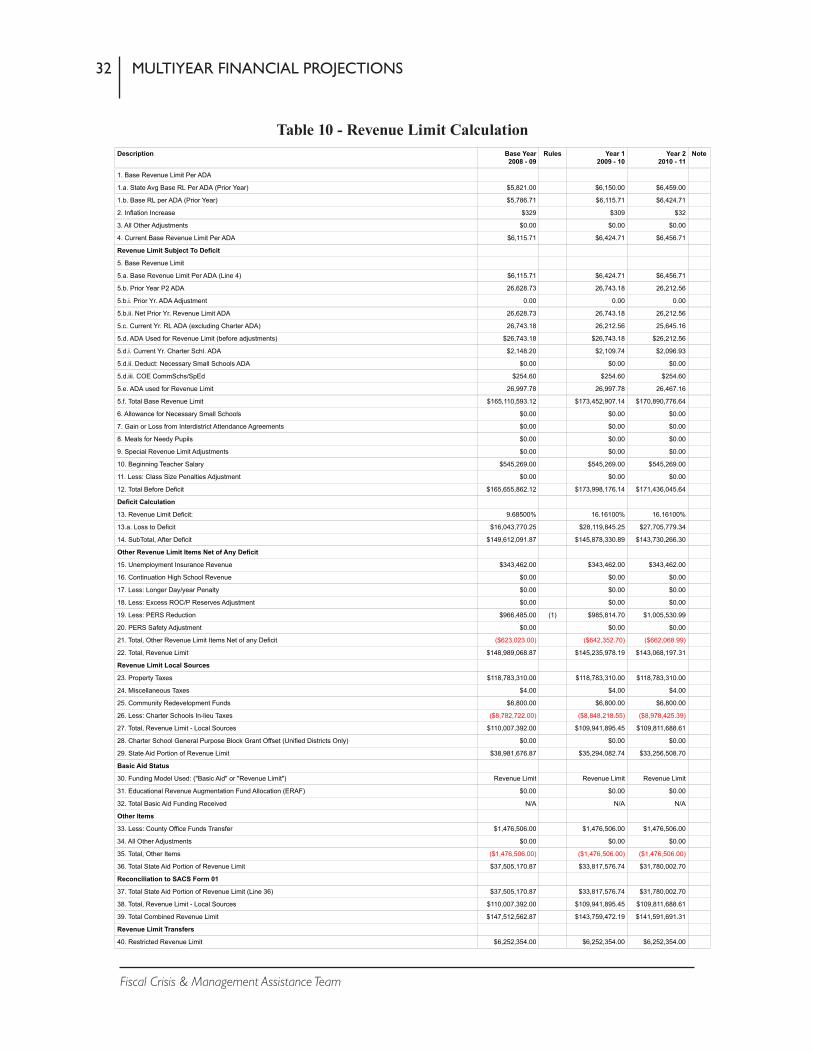
Revenue Limit Sources - FCMAT’s calculations of revenue limit funding for the entire projection period are based on School Services of California (SSC) 2009 Financial Projection Dartboard - Governor’s Budget Proposal assumptions and FCMAT’s projection of ADA. The following table provides the details of this calculation.
Fiscal Crisis & Management Assistance Team
32 muLTIyEAR FINANCIAL pROjECTIONS
Table 10 - Revenue Limit CalculationRevenue Limit
Page 1 of 2
LEA: Orange UnifiedProjection: Orange Unified School District - 2008-09 1st Interim
Description Base Year2008 - 09
Rules Year 12009 - 10
Year 22010 - 11
Note
Printed by: Jim Cerreta Print date: 2/6/2009 4:12 PM
1. Base Revenue Limit Per ADA
1.a. State Avg Base RL Per ADA (Prior Year) $5,821.00 $6,150.00 $6,459.00
1.b. Base RL per ADA (Prior Year) $5,786.71 $6,115.71 $6,424.71
2. Inflation Increase $329 $309 $32
3. All Other Adjustments $0.00 $0.00 $0.00
4. Current Base Revenue Limit Per ADA $6,115.71 $6,424.71 $6,456.71
Revenue Limit Subject To Deficit
5. Base Revenue Limit
5.a. Base Revenue Limit Per ADA (Line 4) $6,115.71 $6,424.71 $6,456.71
5.b. Prior Year P2 ADA 26,628.73 26,743.18 26,212.56
5.b.i. Prior Yr. ADA Adjustment 0.00 0.00 0.00
5.b.ii. Net Prior Yr. Revenue Limit ADA 26,628.73 26,743.18 26,212.56
5.c. Current Yr. RL ADA (excluding Charter ADA) 26,743.18 26,212.56 25,645.16
5.d. ADA Used for Revenue Limit (before adjustments) $26,743.18 $26,743.18 $26,212.56
5.d.i. Current Yr. Charter Schl. ADA $2,148.20 $2,109.74 $2,096.93
5.d.ii. Deduct: Necessary Small Schools ADA $0.00 $0.00 $0.00
5.d.iii. COE CommSchs/SpEd $254.60 $254.60 $254.60
5.e. ADA used for Revenue Limit 26,997.78 26,997.78 26,467.16
5.f. Total Base Revenue Limit $165,110,593.12 $173,452,907.14 $170,890,776.64
6. Allowance for Necessary Small Schools $0.00 $0.00 $0.00
7. Gain or Loss from Interdistrict Attendance Agreements $0.00 $0.00 $0.00
8. Meals for Needy Pupils $0.00 $0.00 $0.00
9. Special Revenue Limit Adjustments $0.00 $0.00 $0.00
10. Beginning Teacher Salary $545,269.00 $545,269.00 $545,269.00
11. Less: Class Size Penalties Adjustment $0.00 $0.00 $0.00
12. Total Before Deficit $165,655,862.12 $173,998,176.14 $171,436,045.64
Deficit Calculation
13. Revenue Limit Deficit: 9.68500% 16.16100% 16.16100%
13.a. Loss to Deficit $16,043,770.25 $28,119,845.25 $27,705,779.34
14. SubTotal, After Deficit $149,612,091.87 $145,878,330.89 $143,730,266.30
Other Revenue Limit Items Net of Any Deficit
15. Unemployment Insurance Revenue $343,462.00 $343,462.00 $343,462.00
16. Continuation High School Revenue $0.00 $0.00 $0.00
17. Less: Longer Day/year Penalty $0.00 $0.00 $0.00
18. Less: Excess ROC/P Reserves Adjustment $0.00 $0.00 $0.00
19. Less: PERS Reduction $966,485.00 (1) $985,814.70 $1,005,530.99
20. PERS Safety Adjustment $0.00 $0.00 $0.00
21. Total, Other Revenue Limit Items Net of any Deficit ($623,023.00) ($642,352.70) ($662,068.99)
22. Total, Revenue Limit $148,989,068.87 $145,235,978.19 $143,068,197.31
Revenue Limit Local Sources
23. Property Taxes $118,783,310.00 $118,783,310.00 $118,783,310.00
24. Miscellaneous Taxes $4.00 $4.00 $4.00
25. Community Redevelopment Funds $6,800.00 $6,800.00 $6,800.00
26. Less: Charter Schools In-lieu Taxes ($8,782,722.00) ($8,848,218.55) ($8,978,425.39)
27. Total, Revenue Limit - Local Sources $110,007,392.00 $109,941,895.45 $109,811,688.61
28. Charter School General Purpose Block Grant Offset (Unified Districts Only) $0.00 $0.00 $0.00
29. State Aid Portion of Revenue Limit $38,981,676.87 $35,294,082.74 $33,256,508.70
Basic Aid Status
30. Funding Model Used: ("Basic Aid" or "Revenue Limit") Revenue Limit Revenue Limit Revenue Limit
31. Educational Revenue Augmentation Fund Allocation (ERAF) $0.00 $0.00 $0.00
32. Total Basic Aid Funding Received N/A N/A N/A
Other Items
33. Less: County Office Funds Transfer $1,476,506.00 $1,476,506.00 $1,476,506.00
34. All Other Adjustments $0.00 $0.00 $0.00
35. Total, Other Items ($1,476,506.00) ($1,476,506.00) ($1,476,506.00)
36. Total State Aid Portion of Revenue Limit $37,505,170.87 $33,817,576.74 $31,780,002.70
Reconciliation to SACS Form 01
37. Total State Aid Portion of Revenue Limit (Line 36) $37,505,170.87 $33,817,576.74 $31,780,002.70
38. Total, Revenue Limit - Local Sources $110,007,392.00 $109,941,895.45 $109,811,688.61
39. Total Combined Revenue Limit $147,512,562.87 $143,759,472.19 $141,591,691.31
Revenue Limit Transfers
40. Restricted Revenue Limit $6,252,354.00 $6,252,354.00 $6,252,354.00

Orange Unified School District
33muLTIyEAR FINANCIAL pROjECTIONS
For 2008-09, the district assumed a 5.66% revenue limit COLA reduced by a 4.713% deficit, which were the industry standards when the budget was prepared. FCMAT utilized the Governor’s budget mid-year funding reduction proposal, which provides a 5.66% COLA but applies a 9.68% deficit. This decreased revenues by $8.3 million in the 2008-09 year.
For 2009-10 and 2010-11, the district prepared its revenue limit projections assuming COLAs of 5.60% and 3.50% respectively, with deficits projected at 10.31% for both years. FCMAT’s projection utilizes a 5.02% and .50% COLA for the two years, with deficits at 16.16% for both years. This resulted in a decrease in revenue limit funding of $10 million in 2009-10 and $9.3 million in 2010-11 relative to the district’s 2008-09 first interim budget report multiyear financial projection. Cumulatively over the current and two subsequent years, the FCMAT revenue limit projection is $27.6 million less than the districts’ projection as a result of the increased deficit.
Federal/Other State/Other Local Revenues - For the 2008-09 fiscal year, FCMAT projected federal, other state and local revenues at the same amounts as those included in the district’s 2008-09 first interim budget report, with the following exceptions:
Title I revenues were reduced by $47,000 to the amount allocated to the district per the CDE’s apportionment schedule.
Lottery revenues were reduced by $376,000 and $231,000 for the unrestricted and restricted resources, respectively, to reflect actual prior year annual ADA counts and the most recent lottery funding estimate per SSC’s 2009 Governor’s Budget Proposal Financial Dartboard.
For the 2009-10 and 2010-11 FCMAT assumed flat funding levels for federal programs and a minimal .5% cost-of-living adjustment for state programs in 2010-11 only consistent with the SSC Dartboard.
Locally funded program revenues were also projected to remain at current levels.
Revenue Limit
Rules:
Page 2 of 2
LEA: Orange UnifiedProjection: Orange Unified School District - 2008-09 1st Interim
Description Base Year2008 - 09
Rules Year 12009 - 10
Year 22010 - 11
Note
Printed by: Jim Cerreta Print date: 2/6/2009 4:12 PM
Reconciliation of Total Revenue Limit Sources
41. Revenue Limit State Aid - Prior Year $0.00 $0.00 $0.00
42. PERS Revenue Limit Reduction (Line 19) $966,485.00 $985,814.70 $1,005,530.99
43. Total Unrestricted Revenue Limit Sources $142,226,693.87 $138,492,932.89 $136,344,868.30
OTHER NON REVENUE LIMIT ITEMS
44. Core Academic Program $0.00 $0.00 $0.00
45. California High School Exit Exam $0.00 $0.00 $0.00
46. Pupil Promotion and Retention, and Low STAR Score Program $0.00 $0.00 $0.00
47. Apprenticeship Funding $0.00 $0.00 $0.00
48. Community Day School Additional Funding $0.00 $0.00 $0.00
49. Other State Apportionments-Current Year $0.00 $0.00 $0.00
50. Total Other Non Revenue Limit Items $0.00 $0.00 $0.00
(1) Rules applied: ClasStep%, ClassCOLA

Fiscal Crisis & Management Assistance Team
34 muLTIyEAR FINANCIAL pROjECTIONS
Federal Economic Stimulus Bill - the U.S. Congress and the new presidential administration recently passed an economic stimulus package that provides additional funding for public schools and may benefit Orange Unified for the 2009-10 and 2010-11 fiscal years. However, the full effects of the legislation remain unclear. The district should continue to balance its budget and assume these funds will be unavailable. Adjustments can be made when the legislation’s full effects are known.
All Other Financing Sources - FCMAT’s MYFP for 2008-09 includes $1.1 million in proceeds from capital leases. These proceeds are recognized at the inception of the lease and are offset in the budget by a balancing entry to capital outlay. This amount is eliminated in the 2009-10 and 2010-11 years of the projection, consistent with the district’s 2008-09 first interim MYFP.
Interfund Borrowing - Internal borrowing between district funds is authorized by Education Code Section 42603, which allows school districts to borrow temporarily between funds to address cash flow shortages. This type of borrowing has several limitations. No more than 75% of the money held in any fund during the current fiscal year may be transferred. In addition, if the transfer is completed prior to the last 120 days of the fiscal year, the funds must be repaid by June 30 of the same fiscal year. If funds are transferred within the last 120 days of the fiscal year, repayment must be made prior to June 30 of the subsequent fiscal year.
The district plans to borrow $24.3 million from various funds to supplant general fund cash flow. TRANs have not been implemented in the current or prior fiscal years, yielding a savings of issuance and interest costs to the general fund. The district plans to repay the loans within the statutory period in accordance with Education Code 42603. The district should consider a mid-year TRANs if the district’s cash-flow position deteriorates as a result of the state budget crisis. More information is available in the section of this report titled “Cash Flow and Proposed Cash Deferrals.”
Staffing LevelsFCMAT did not assume any changes to district staffing levels or formulas in its multiyear financial projection.
Staff Compensation AdjustmentsFCMAT’s MYFP includes step-and-column movement across all salary schedules at the following rates:
2.3% for certificated bargaining unit staff•
2.0% for classified bargaining unit staff•

Orange Unified School District
35muLTIyEAR FINANCIAL pROjECTIONS
1.2% for management/confidential/supervisory staff, referred to by the district as •the leadership group
FCMAT’s projection was prepared assuming no adjustments (either increases or decreases) would be implemented for all district staff for the entire projection period. Negotiations with all district bargaining units for the 2008-09 fiscal year remain unsettled.
The district estimates the cost of 1% is as follows:
Certificated nonmanagement staff $1,169,158Classified nonmanagement staff $ 418,346Management/supervisory/confidential staff $ 175,692TOTAL $1,763,196
Employee BenefitsStatutorily provided employer-paid benefit programs were increased proportionately to increases in the salaries they are based upon. These benefits are as follows:
State Teachers Retirement SystemPublic Employees Retirement SystemSocial Security and MedicareState Unemployment InsurancePERS Revenue Limit Reduction
FCMAT did not assume any rate changes for any of the above programs.
Health and welfare benefits that are contractually required for active employees and retirees were not increased consistent with the district’s collective bargaining agreements. The contract provides for a district contribution to the premiums for these programs, and FCMAT did not assume any change in these contributions.
The district did not provide for workers compensation insurance premiums in the 2008-09 fiscal year budget since it plans to draw on the fund 68 self-insurance pool residual from its workers compensation self-insured program. The district converted from a self-insured to a fully insured program in the 2008-09 fiscal year, leaving a surplus of nearly $8.7 million in fund 68 as of July 1, 2008. The staff estimated the fund would be reduced by $1.5 million during the 2008-09 year, leaving a projected fund balance of $7.2 million on June 30, 2009. The district’s actuarial report indicates $4.5 million should be maintained in the fund to achieve an 80% confidence level that estimated claim costs will be funded over time.

Fiscal Crisis & Management Assistance Team
36 muLTIyEAR FINANCIAL pROjECTIONS
Since the conversion to a fully-insured plan, the district staff learned that actual premiums and other plan costs could exceed original estimates by $1.3 million for the 2008-09 fiscal year. Staff members indicated they will recommend to the school board that the district fund this amount from the fund 68 ending balance, reducing it to an estimated $5.9 million as of June 30, 2009. The staff also will also recommend that the district consider alternatives to funding this program for the 2009-10 fiscal year, including returning to a self-funded program.
FCMAT and the district assumed funding for workers compensation premiums will again be included in the general fund budget beginning with the 2009-10 fiscal year at a cost similar to that the district experienced when operating a self-insured program.
Supplementary Retirement Plan - The district implemented a Supplementary Retirement Plan (SRP) in June 2008. The program, administered by Public Agency Retirement Services (PARS), provided 156 district employees with supplementary retiree benefits in exchange for early retirement. The plan requires annual payments of approximately $2 million for five years from the district’s general fund, and the first payment is due in the 2008-09 year. FCMAT’s MYFP includes the cost of funding this plan in the district’s general fund.
Other Post-Employment Benefits (OPEB) Governmental Accounting Standards Board (GASB) statement number 43 required school districts the size of Orange Unified to implement new accounting standards regarding (OPEB) in the 2006-07 fiscal year. These standards required new accounting procedures for the liability of these benefits for both current retirees as well as future retirees.
The district administers a defined benefit postemployment plan, where plan assets may be used only for the payment of benefits to the members of that plan. The plan assets are accounted for in the retiree benefits fund, which is an irrevocable trust. Since plan assets are held in an irrevocable trust, investments of plan assets may include investments in equity securities or mutual funds and are not subject to the same limitation on eligible securities that apply to other district funds as per Government Code Section 16430 and California Education Code Section 41001.
The retiree benefits fund is a single-employer defined benefit postemployment health-care plan that covers eligible retired employees of the district. The fund provides health insurance benefits to eligible retirees and their spouses. As of October 1, 2007, the date of the latest actuarial valuation, the plan covered 917 retirees and their beneficiaries, as well as 1,719 active employees.

Orange Unified School District
37muLTIyEAR FINANCIAL pROjECTIONS
Retired plan members and beneficiaries currently receiving benefits are required to contribute specified amounts annually toward the cost of health insurance premiums. Plan members are required to contribute $150 annually for two-party coverage and $300 for family coverage if dependent coverage is elected. The district is required to contribute the balance of the current premium cost.
Per the 2007-08 district audit report, the funded status of the plan as of the most recent actuarial valuation date was as follows:
Actuarial Actuarial Accrued Unfunded Valuation Value of Liability AAL Funded Date Assets (AAL) (UAAL) Ratio_ 10/1/2007 2,171,175 167,391,481 165,220,306 1%
In May 2008, the district issued $94.7 million in OPEB bonds to partially fund its retiree benefit obligation (information is available in the “OPEB Bonds” section of this report), significantly increasing the assets of the retiree benefits plan. The following table shows the elements of the district’s annual OPEB cost for the year, the amount actually paid on behalf of the plan, and changes in the district’s net OPEB asset to the plan for the year ended June 30, 2008:
Table 11 - Annual OPEB Costs for 2007-08
Annual required contribution (ARC) $13,531,444Interest on net OPEB obligation --Adjustment to ARC --Annual OPEB cost $13,531,444Contributions made: Contributions from General Fund to Retiree Benefits Fund 1,876,518 Transfer of proceeds of retiree health Benefits funding bonds to Retiree Benefit Fund 93,763,635 Total contributions made 95,640,153 Increase in net OPEB asset 82,108,709 Net OPEB asset – July 1, 2007 -- Net OPEB asset – June 30, 2008 $82,108,709 Source - Orange Unified School District 2007-08 Audit Report
The value of the OPEB assets has decreased to $81 million as a result of the recent economic downturn and its effects on the plan’s fixed income and equity investments. This reduction in value has decreased the above net OPEB asset value by $12 million to approximately $70 million as of January 8, 2009.

Fiscal Crisis & Management Assistance Team
38 muLTIyEAR FINANCIAL pROjECTIONS
Books and Supplies, Services and Other Operating Costs and Capital OutlayFCMAT assumed that all books and supply and services and other operating costs line items would increase each year by the California consumer price index (CPI). Books and supplies were reduced by $231,000 to balance the reduction in restricted lottery funds and $47,000 to balance Title I funding adjustments as noted above.
Capital outlay was reduced to $0 in resource 8150, routine restricted maintenance, in the 2009-10 and 2010-11 years of the projection consistent with the district’s 2008-09 first interim budget report multiyear financial projection assumptions. All other capital outlay amounts were included in FCMAT’s MYFP.
Other Outgo, Direct and Indirect Support Costs and Debt ServiceOther Outgo - Other outgo is primarily transfers to the Orange County Department of Education of special education apportionments and expenditures.
Direct and Indirect Support Costs - District budgets for direct and indirect support cost charges to restricted programs and grants were not changed in the FCMAT projection.
Debt Service - FCMAT’s projection includes the same debt service obligations as the district’s first interim projection for the entire MYFP period.
Interfund Transfers OutThe district budget includes a transfer from the general fund to the deferred maintenance fund as a match for the state’s contribution to the deferred maintenance program. FCMAT’s multiyear financial projection includes these same transfers.
Contributions to Restricted ProgramsThe district is projected to contribute to the following restricted programs in the current and subsequent two years. The following table provides a summary of these contributions.
.

Orange Unified School District
39muLTIyEAR FINANCIAL pROjECTIONS
Table 12 - Contributions to Restricted ProgramsContributions (8980 - 8999)
Page 1 of 2
LEA: Orange UnifiedProjection: Orange Unified School District - 2008-09 1st Interim
Name Resource Code Base Year2008 - 09
Year 12009 - 10
Year 22010 - 11
Printed by: Jim Cerreta Print date: 2/6/2009 4:22 PM
Unrestricted Resources
Unrestricted 0000 ($20,110,919.00) ($22,206,678.51) ($23,123,032.49)
El Rancho Charter MS 0900 ($72,036.00) ($72,036.00) ($72,036.00)
Lottery: Unrestricted 1100 $0.00 $0.00 $0.00
Class Size Reduction Operations, Grades K-3 1300 $0.00 $0.00 $0.00
Total Unrestricted ($20,182,955.00) ($22,278,714.51) ($23,195,068.49)
Restricted Resources
Community Day Schools 2430 $258,211.00 $277,772.71 $288,342.58
NCLB-Title I, Part A, Basic Grants Low Income and Neglected 3010 $0.00 $0.00 $0.00
NCLB-Title I Part B, Reading First Program 3030 $0.00 $0.00 $0.00
Special Ed: IDEA Basic Local Assistance Entitlement, Part B, Sec 611 (formerly P 3310 $0.00 $139,756.62 $226,015.79
Special Ed: IDEA Preschool Grants, Part B, Sec 619 3315 $0.00 $0.00 $0.00
Special Ed: IDEA Preschool Local Entitlement, Part B, Sec 611 3320 $0.00 $0.00 $0.00
Special Ed: IDEA Preschool Staff Development, Part B, Sec 619 3345 $0.00 $0.00 $0.00
Special Ed: IDEA Early Intervention Grants 3385 $0.00 $70.12 $395.45
Vocational Programs: Voc & Applied Tech Prep Programs, Title II, Sec 203 (Carl P 3510 $0.00 $0.00 $0.00
Vocational Programs: Voc & Appl Tech Secondary II C, Sec 131 (Carl Perkins Act) 3550 $0.00 $0.00 $0.00
NCLB: Title IV, Part A, Drug Free Schools 3710 $0.00 $0.00 $0.00
NCLB: Title II, Part A, Teacher Quality 4035 $0.00 $0.00 $0.00
NCLB: Title II, Part D, Enhancing Education Through Technology, Formula Grants 4045 $0.00 $0.00 $0.00
NCLB: Title II, Part D, Enhancing Education Through Technology, Competitive Gran 4046 $0.00 $0.00 $100,955.55
NCLB: Title III, Limited English Proficiency (LEP) Student Program 4203 $0.00 $0.00 $0.00
Indian Education 4510 $0.00 $0.00 $0.00
Medi-Cal Billing Option 5640 $0.00 $0.00 $0.00
Other Federal 5810 $0.00 $0.00 $0.00
After-School Learning & Safe Neighborhood Partnerships 6010 $0.00 $0.00 $0.00
Emergency Repair Program - Williams Case 6225 $0.00 $0.00 $0.00
Teacher Recruitment and Student Support 6275 $0.00 $0.00 $0.00
Community-Based English Tutoring 6285 $0.00 $2,055.50 $3,929.55
English Language Acquisition Program, Teacher Training & Student Assistance 6286 $0.00 $0.00 $0.00
Lottery: Instructional Materials 6300 $0.00 $0.00 $0.00
Career Technical Education Equipment and Supplies 6377 $0.00 $0.00 $0.00
School Safety & Violence Prevention, Grades 8-12 6405 $0.00 $34,136.35 $39,310.52
Special Education 6500 $8,124,449.00 $8,958,528.21 $9,407,620.66
Special Education-Project Workability (97/98) 6520 $0.00 $6,558.93 $10,972.36
Special Ed-Preschool Low Incidence (97/98) 6530 $0.00 $0.00 $0.00
Special Education - IDEA 6535 $0.00 $0.00 $0.00
Tobacco-Use Prevention Education: Elementary Grades 4-8 6660 $0.00 $0.00 $0.00
Arts and Music Block Grant 6760 $0.00 $0.00 $6,128.23
Arts, Music, and Physical Education Supplies and Equipment 6761 $0.00 $0.00 $0.00
Agricultural Vocational Incentive Grants 7010 $0.00 $0.00 $0.00
California Instructional School Garden 7026 $0.00 $0.00 $0.00
CAHSEE Intensive Instruction and Services 7055 $0.00 $7,309.66 $11,834.94
CAHSEE Individual Intervention Materials 7056 $0.00 $0.00 $0.00
Supplemental School Counseling Program 7080 $0.00 $59,961.82 $74,995.03
Economic Impact Aid: Limited English 7091 $0.00 $0.00 $0.00
Gifted & Talented Education (GATE) 7140 ($23,335.00) ($23,335.00) ($23,335.00)
Instructional Materials Realignment, IMFRP (AB 1781) 7156 $0.00 $0.00 $0.00
Instructional Materials: English Language Learners 7157 $0.00 $0.00 $0.00
Instructional Materials Williams Case 7158 $0.00 $0.00 $0.00
Partnership Academies Program 7220 $0.00 $0.00 $0.00
Transportation: Home to School 7230 $2,204,692.00 $2,337,559.57 $2,416,188.66
Transportation: Special Education (Severely Disabled/Orthopedically Impaired) 7240 $2,272,794.00 $2,261,493.70 $2,294,760.52
High Priority Schools Grants Program 7258 $0.00 $0.00 $0.00
California Peer Assistance & Review Program for Teacher (CPARP) 7271 ($12,342.00) $11,084.40 $13,227.19
Certificated Staff Mentoring Program 7276 $0.00 $1,146.48 $1,709.67
International Baccalaureate (IB) Program: Staff Development & Startup 7286 $0.00 $0.00 $0.00
Staff Development: Mathematics and Reading (AB 466) 7294 $0.00 $0.00 $0.00
Staff Development: Administrator Training 7325 $0.00 $0.00 $0.00
Supplementary Programs-Specialized Secondary 7370 $0.00 $0.00 $0.00
Pupil Retention Block Grant 7390 $0.00 $4,494.71 $5,897.68
Teacher Credentialing 7392 $0.00 $176,346.19 $181,136.65

Fiscal Crisis & Management Assistance Team
40 muLTIyEAR FINANCIAL pROjECTIONS
As indicated above, the district contributes to several restricted programs. These encroachments are projected to increase in future years. The district should review the encroachment in all programs and make adjustments as necessary to reverse the increas-ing trend.
Other FundsThe scope of FCMAT’s review did not include a review of the district’s other funds. While FCMAT utilized data from some of these funds budgets to develop its general fund projection, the team did not prepare a multiyear financial projection for them. These funds are as follows:
Fund 11 - Adult education fundFund 12 - Child development fundFund 13 - Cafeteria fundFund 14 - Deferred maintenance fundFund 25 - Capital facilities fundFund 35 - County school facilities fundFund 40 - Special reserve fund for capital outlay projectsFund 49 - Capital project fund for blended component unitsFund 52 - Debt service fund for blended component unitsFund 56 - Debt service fundFund 68 - Self insurance fundFund 71 - Retiree benefits fund
Long-Term DebtAccording to the district’s 2007-08 audit report, long-term debt increased from $83 million to $193 million during the 2007-08 fiscal year, a 132% increase. New debt issuances included $7 million in capital leases, $94 million in OPEB bonds and $10 million for an early retirement program known as a SRP. As a result, debt service funded via the general fund increased by 138% during the same time frame.
Contributions (8980 - 8999)
Page 2 of 2
LEA: Orange UnifiedProjection: Orange Unified School District - 2008-09 1st Interim
Name Resource Code Base Year2008 - 09
Year 12009 - 10
Year 22010 - 11
Printed by: Jim Cerreta Print date: 2/6/2009 4:22 PM
Professional Development Block Grant 7393 ($51,422.00) $4,611.17 $32,008.97
Targeted Instructional Improvement Block Grant 7394 $668,227.00 $668,227.00 $668,227.00
School and Library Improvement Block Grant 7395 ($316,826.00) ($316,826.00) ($316,826.00)
Discretionary Block Grant School Site 7396 $0.00 $0.00 $0.00
Discretionary Block Grant School District 7397 ($190,155.00) $0.00 $0.00
Instructional Materials, Library Materials and Education Technology 7398 $0.00 $0.00 $0.00
Quality Education Investment Act 7400 $0.00 $0.00 $0.00
Ongoing & Major Maintenance Account (RMA: Education Code Section 17070.75) 8150 $7,248,662.00 $7,667,762.37 $7,751,572.49
Other Local 9010 $0.00 $0.00 $0.00
Total Restricted $20,182,955.00 $22,278,714.51 $23,195,068.49
Balance $0.00 $0.00 $0.00

Orange Unified School District
41muLTIyEAR FINANCIAL pROjECTIONS
OPEB Bonds - In May 2008, the district issued $94,765,000 in retirement health benefits funding bonds, otherwise known as OPEB bonds. The bonds were issued to refinance a portion of the district’s retiree benefits obligation for eligible current and former employees pursuant to employment contracts. Proceeds of the bond were deposited in the district’s retiree benefits fund 71, an irrevocable trust, and invested in both fixed income and equity securities. Future debt service on the bonds will be funded from the district’s general fund, requiring annual payments ranging from $1.7 to $6.1 million each year through 2043.
The bonds bear interest at defined index rates. The index rate is the lesser of the annual London Interbank Offered Rate (LIBOR), a standard financial index used in US capital markets, as of the index rate determination date or the highest rate allowed by law, plus an index margin of 85 basis points, per the Series A bond issuance official statement. Indexed interest rates have decreased from 3.5620% in June 2008 to 1.2975% in January 2009, which has lowered bond interest costs relative to original projections.
The retiree benefit financing plan anticipated that the bond proceeds and interest earnings would satisfy the “pay-as-you-go” requirement of the district’s retiree benefit obligations, while the district’s general fund would fund the debt service requirements of the OPEB bonds. Consultants estimated the district would enjoy a cost savings of $98 million through the year 2054.
However, the district staff indicated that the market value of the investment portfolio has decreased as a result of the economic downturn of the last year. Account statements dated January 8, 2009 indicate the values declined by more than $17 million from their original cost, or 17.8%; fixed income securities have declined nearly 8% while equities declined more than 31%. The following table provides a summary of these valuations:
Table 13 - OPEB Bond Proceeds Asset Valuation
Market Valueas of 1/08/09 Cost Change % Change
Short term investment fundCash & equivalents $5 $5 $0 0.0%Fixed Income Securities $12,440,007 $13,491,641 -$1,051,634 -7.8%
Long term investment fundCash & equivalents $125,614 $125,614 $0 0.0%Fixed Income Securities $39,447,432 $42,827,024 -$3,379,592 -7.9%Equities $29,036,822 $42,165,264 -$13,128,442 -31.1%
Total $81,049,880 $98,609,548 -$17,559,668 -17.8%

Fiscal Crisis & Management Assistance Team
42 muLTIyEAR FINANCIAL pROjECTIONS
The short-term risk of the devaluation of the bond proceeds is somewhat limited in that the district has the first two years retiree benefit obligations funded with fixed securities in the short-term investment fund. The ultimate risk is that the long-term investment fund assets will not recover their value sufficiently to meet the district’s retiree benefit obligations in a timely manner, forcing any excess cost to be funded from the district’s general fund.
The district should seek advice from an independent third-party investment advisor regarding strategies to address the decline in asset value that will restore the plan to its original structure and viability.
Certificates of Participation - The district maintains a financing agreement with the Orange Schools Financing Corporation regarding the issuance of $53 million in Certificates of Participation (COPs) in 2003. The corporation is a separate legal entity formed for the sole purpose of financing equipment and other capital outlay items and leasing these to the district. COPs are long-term debt instruments that are tax exempt. Because of the favorable tax treatment, COPs are usually issued at or below current market rates to investors.
The district is scheduled to make lease payments to the corporation until 2029. The primary funding source for district lease payments is redevelopment revenues. Transactions for the COPs are included in district fund 40, special reserve fund for capital outlay projects, and fund 56, debt service fund.
The staff indicated that the district recently considered issuing additional COPs to finance facility modernization projects. The district should postpone consideration of any additional debt issuance until the state budget has been stabilized, final funding amounts are identified and district cash-flow needs more clearly known.
Supplementary Retirement Program (SRP) - The Supplementary Retirement Plan implemented in June 2008 requires annual payments of approximately $2 million for five years from the district’s general fund. The first payment is due in the 2008-09 year. FCMAT’s MYFP includes the cost of funding this plan in the district’s general fund. Special Tax Revenue Bonds – The Orange Unified School District Public Financing Authority issued four special tax revenue bonds to fund the construction of district facilities via four community facilities districts. As of June 30, 2008, the principal balance outstanding on the bonds was $22,375,000. Bond debt service is provided via the special tax levied for these purposes against homeowners of the four districts, and no allocations are required from the district’s general fund. Transactions of all the community facilities districts are included in district fund 49, capital project fund for blended component units, and fund 52, debt service fund for blended component units.

Orange Unified School District
43muLTIyEAR FINANCIAL pROjECTIONS
Capital Facilities FundThe district allocated $741,000 of its $850,000 budgeted revenues of the capital facilities fund No. 25 to fund facilities department positions. This fund is utilized to account for impact fees on local commercial, industrial and residential development, otherwise known as developer fees.
FCMAT’s MYFP was prepared under the assumption that these positions will continue to be funded from fund No. 25 throughout the projection period. The district should develop a contingency plan for these positions if the capital facilities fund revenues and ending balance prove insufficient to continue funding these positions.
The Government Code limits the amount of administrative costs chargeable to the capital facilities fund to 3% of development fees collected. The district should consult with legal counsel to determine whether the cost of these positions is within the 3% limitation of the code and develop a contingency plan if the district is found to be noncompliant. Carryover of Restricted FundsFCMAT’s multiyear projection was prepared utilizing the district’s 2008-09 first interim budget report. This report contained carryover of unspent restricted categorical funds from the 2007-08 year that was included in the 2008-09 budget. While FCMAT adjusted many of these amounts back out of the budget for the 2009-10 year, some amounts were left intact. These amounts are immaterial to the projection and do not affect the conclusions, findings or recommendations in FCMAT’s report.
Financial Projection ToolsThe district has historically developed multiyear financial projections using Excel spreadsheets and other tools other than the district’s QSS software program. The district should use FCMAT’s free Web-based Budget Explorer financial program as a planning tool to develop multiyear financial projections. This will improve the effectiveness of these projections and help guide the district’s financial planning.
FCMAT’s Fiscal Health Risk AnalysisFCMAT’s Fiscal Health Risk Analysis concluded the district is not in need of immediate fiscal intervention. This risk analysis did not consider FCMAT’s multiyear financial projection for Orange Unified, which indicates that future financial trends will differ significantly from past experience, causing FCMAT to revisit the conclusion drawn from the Fiscal Health Risk Analysis. Without significant budget reductions or revenue enhancements, the district will require fiscal intervention up to and including the assignment of a state administrator.

Fiscal Crisis & Management Assistance Team
44 muLTIyEAR FINANCIAL pROjECTIONS
Cash Flow and Proposed Cash DeferralsThe early release of the Governor’s 2009-10 budget proposal emphasizes the severity of the state’s budget and cash crisis. This is the most challenging budget in the state’s history, and the governor’s proposal uses several solutions to address this crisis, including cash management strategies such as deferrals. Because of the number of apportionment deferrals included in the budget language, the state’s cash flow crisis has been transferred to all local school districts.
On January 15, 2009, the governor’s office acknowledged that it is proposing an additional apportionment deferral of $2.7 billion from July and August 2009 to September 2009. This proposed deferral would be in addition to legislation previously enacted that would delay from February 2009 to April 2009 the payment of $2.6 billion in revenue limit and class-size reduction (CSR) funding. The January proposal would also be in addition to the Governor’s 2008-09 mid-year proposal, which was introduced with the 2009-10 budget proposal and includes a deferral from April to July 2009. Although the latest proposed deferral has not been part of any budget documents released to date, the proposal was confirmed by the Department of Finance and the Legislative Analyst’s Office.
Compounding this crisis is the recent notification from the State Allocation Board that the funding of construction apportionments for districts and county offices of education, many of which were anticipating funding through the Office of Public School Construction (OPSC), has been suspended.
According to Government Code Section 53854, a school district may issue a tax and revenue anticipation note (TRAN) payable up to 15 months after the date of issuance. Such a note is payable only from revenue received or accrued during the fiscal year in which it was issued. Because the Governor’s January budget proposal includes deferral language, the district should update its current cash flow projections and review the need to issue mid-year or interim TRANs to meet any cash flow deficiencies for the balance of the fiscal year.
The purpose of a cash flow statement is to project the timing of receipts and expenditures so that a district can understand and meet its cash requirements on an ongoing basis, whether that is monthly or daily. The cash flow statement should indicate the district’s liquidity and its ability to meet payroll and other current financial obligations. Because it excludes transactions that do not directly affect cash receipts and payments, the cash flow analysis is an analytical tool that should not be confused with the district’s budget and fund balance.
As the state struggles with its own cash flow crisis, district apportionments will be directly affected in the 2008-09 and 2009-10 fiscal years. Two deferrals have already been enacted in legislation, one through the 2008-09 Budget Act, AB 1781, and the other through emergency legislation ABX3 4. Further, the current budget proposal includes one

Orange Unified School District
45muLTIyEAR FINANCIAL pROjECTIONS
additional deferral of the principle apportionment and CSR allocations as noted above, and a subsequent proposal to defer the 2009-10 July and August apportionments.
The district should immediately review and evaluate its cash flow requirements and update cash flow projections for all funds in light of the deferral schedule provided in the table below. The following table is an estimate based on discussions with the California Department of Education (CDE) and analysis of the governor’s budget proposals.
Table 14 - Principal Apportionment Deferral SchedulePrincipal Apportionment July 2008 Sept. 2008 Feb. 2009 April 2009 June 2009 July 2009 Aug. 2009 Sept. 2009
Enacted from emergency legislation ABX3 4 (100%) 100% of July 2008 paid in September 2008
2008-09 Budget Act AB 1781 (50%) 50% of February 2009 paid in April 2009
Governor’s January budget proposal – no exceptions (50%) 50% of Apr. 2009 paid in July 2009
P2 shift enacted in legislation 2002-03 – no exceptions (100%) 100% of June 2009 paid in July 2009
Proposed – no exceptions (100% ) 100% of July 2009 to Sept 2009
Proposed – no exceptions (100%) 100% of August 2009 paid in Sept 2009
Other Cash Management Strategies and Time Lines - Internal borrowing can provide a simple cash management solution, but only if cash is available in the district’s other funds. External borrowing may require additional time. Options for cash management include the following:
Internal borrowing between district funds is authorized by Education Code •Section 42603, which allows districts to borrow temporarily between funds to address cash flow shortages. This situation will need to be assessed at least monthly and will depend on the district’s spending patterns during the last four months of the fiscal year. This is the most common method used by districts; however, it works only if there is cash available in other funds.
This type of borrowing has several limitations. No more than 75% of the money •held in any fund during the current fiscal year may be trans ferred. In addition, if the transfer is completed prior to the last 120 days of the fiscal year, the funds must be repaid by June 30 of the same fiscal year. If funds are transferred within the last 120 days of the fiscal year, repayment must be made prior to June 30 of the subsequent fiscal year.
The district has developed an internal borrowing plan that complies with the •requirements of Education Code section 42603.

Fiscal Crisis & Management Assistance Team
46 muLTIyEAR FINANCIAL pROjECTIONS
Districts may borrow from the county office of education in accordance with •Education Code sections 42621 and 42622. However, this option depends on the county office being willing and able to provide funds. Based on the current economic outlook, this may not be an option because county offices of education are monitoring their own cash balances and are often unable to accommodate these types of requests.
Education Code Section 42620 also allows districts to borrow from the county •treasurer. Under Article XVI, Section 6 of the California Constitution, the county treasurer must provide funds to a district if the district is not able to meet its obligations. However, the county treasurer cannot loan districts money after the last Monday in April of the current fiscal year. In addition, this type of borrowing requires the approval of the governing board by formal resolution. The loan cannot exceed 85% of the amount of money, which will accrue to the school district or county school service fund during the fiscal year, and repayment must be made from the first monies received by the district before any other obligation is paid. The advantage of having the county treasurer provide the funds is that the treasurer is able to take repayment directly from receipts prior to any distribution to the district.
RecommendationsThe district should:
Develop a plan to address deficit spending and the ending balance shortfall 1. through revenue enhancements and/or expenditure reductions.
Utilize the Governor’s 2009 proposed budget as the basis for budget planning, 2. with the exception of categorical program flexibility. The district should not assume it will receive any funds from the federal economic stimulus package until more is known about this legislation.
Use FCMAT’s free Budget Explorer software program to develop multiyear 3. financial projections.
Revise cash flow projections as soon as possible to include the proposed state 4. apportionment deferrals and take appropriate action to ensure the district has sufficient cash to meet its financial obligations.
Analyze and update cash flow projections at least monthly.5.
Consider a mid-year TRANs should the district’s cash flow position deteriorate as 6. a result of the state budget crisis.

Orange Unified School District
47muLTIyEAR FINANCIAL pROjECTIONS
Share enrollment to ADA data with school site administrators and compare 7. the current year data with prior years on a monthly basis and investigate any variances.
Include the district payment of employee contributions to PERS in its calculations 8. of the total cost of compensation.
Be cautious in allowing restricted programs to encroach upon the unrestricted 9. general fund especially during these times of difficult fiscal challenges.
Charge the cafeteria fund 100% of the allowable indirect cost rate for general fund 10. services.
Expand internal auditing to more frequently include a periodic review and 11. comparison of the actual payroll to position control and budget.
Immediately conduct a re-enrollment process to ensure that only eligible retirees 12. and dependents are enrolled in the retiree health and other benefit plans.
Seek advice from an independent third party investment advisor regarding 13. strategies to address the decline in OPEB bond program asset value that will restore the plan to its original structure and viability.
Postpone consideration of any additional debt issuance until such time as the state 14. budget has been stabilized, final funding amounts are identified and district cash flow needs more clearly known.
Develop a contingency plan for an alternative funding source for positions in the 15. Capital Facilities Fund should said funds fee revenues and ending balance become insufficient.
Consult with legal counsel to determine if the cost of the positions funded via the 16. Capital Facilities Fund is within the 3% limitation of the government code and develop a contingency plan should the district be found to be noncompliant.
Update the facility master plan at least every two years.17.

Fiscal Crisis & Management Assistance Team
48 muLTIyEAR FINANCIAL pROjECTIONS
Orange Unified School District
49AppENDICES
Appendices
A: FCMAT Multiyear Financial Projection Rules
B: FCMAT Multiyear Projection
C: Study Agreement

Fiscal Crisis & Management Assistance Team
50 AppENDICES

Orange Unified School District
51AppENDICES
Projection Rules
Page 1 of 2
LEA: Orange UnifiedProjection: Orange Unified School District - 2008-09 1st Interim
Rule Description Base Year2008 - 09
Year 12009 - 10
Year 22010 - 11
Note
Printed by: Jim Cerreta Print date: 2/6/2009 4:12 PM
CertCOLA Certificated COLA % 0.00% 0.00% 0.00%
ClassCOLA Classified COLA % 0.00% 0.00% 0.00%
CertColumn% Certificated Staff Column Increase % 0.00% 0.00% 0.00%
CertStep% Certificated Staff Step Increase % 0.00% 2.30% 2.30%
ClasStep% Classified Staff Step Increase % 0.00% 2.00% 2.00%
CPI California CPI (SSC) 2.90% 1.70% 2.70% (1)
LOT-Res California Lottery Restricted (SSC) $11.50 $11.50 $11.50 (2)
LOT-Unr California Lottery Unrestricted (SSC) $109.50 $109.50 $109.50 (3)
INT Interest Rate Trend for 10 Year Treasuries (SSC) 3.33% 3.55% 4.44% (4)
NetCOLA Net Funded Revenue Limit COLA (SSC) 5.66% 0.00% 3.50% (5)
RLDef Revenue Limit Deficit: K-12 (SSC) 9.69% 16.16% 16.16% (6)
SpEdDef Special Education Base Deficit (SSC) 0.00% 0.00% 0.50% (7)
CatCOLA State Categorical COLA (SSC) 0.00% 0.00% 0.50% (8)
StCOLA Statutory COLA (SSC) 5.66% 5.02% 0.50% (9)
HW% Health & Welfare Benefit Increase 0.00% 0.00% 0.00%
CustAmt Custom Amount $0.00 $0.00 $0.00
Cust% Custom Percent 0.00% 0.00% 0.00%
Cust1Amt Custom One Time Amount $0.00 $0.00 $0.00
Cust1% Custom One Time Percent 0.00% 0.00% 0.00%
ManInput Manual Input $0.00 $0.00 $0.00
PRO Proportional 0.00% 0.00% 0.00%
Zap Zero Out $0.00 $0.00 $0.00
Enr Year-to-Year Change in Enrollment 0.43% -1.97% -2.16%
RL-ADA Year-to-Year Change in RL ADA 0.00% -1.98% -2.16%
TchrStfg Year-to-Year Change in Teacher Staffing 0.00% 0.00% 0.00%
SalFrcstr Salary Forecaster $0.00 $0.00 $0.00
P2ADA P2-ADA/ PRIOR YEAR ANNUAL ESTIMATE 0.00 26,743.18 26,212.56
BasicGrant Title I Part A (Resource 3010) 3.20% 0.00% 0.00% (10)
SpecEduc Special Education (Resource 3310) 1.40% 0.00% 0.00% (11)
TeachQual Title II Part A (Resource 4035) 0.70% 0.00% 0.00% (12)
RLDefCOE County Office Revenue Limit Deficit 0.00% 5.36% 5.36% (13)
EnEducTech Title II Part D (Resource 4045) -6.90% 0.00% 0.00% (14)
LangAcqu Title III Language (Resource 4203) 4.70% 0.00% 0.00% (15)
SafeDrugFree Title V Safe and Drug (Resource 3710) -15.40% 0.00% 0.00% (16)
InnProg Title V Part A (Resource 4110) -100.00% 0.00% 0.00% (17)
21CLC (IV) Title V now IV Part B (Resource 4124) 3.40% 0.00% 0.00% (18)
ReadFirst Title I Part B (Resource 3030) -64.30% 0.00% 0.00% (19)
EvenStart Title I Part B, Even Start (Resource 3105) -24.10% 0.00% 0.00% (20)
CTechEdGrant Career and Technical Ed Grants -2.60% 0.00% 0.00% (21)
SSC CSR SSC-CSR/ SSC CSR $0.00 $0.00 $0.00
K3 CSR K3-CSR/ K3 CSR $0.00 $0.00 $0.00
AutoBal Autobalance Rule $0.00 $0.00 $0.00 (22)
FedCOLA Federal COLA 0.00% 0.00% 0.00% (23)
IndirectRate Indirect Rate 0.00% 0.00% 0.00% (24)
Leadership Step Leadership Step/Column 0.00% 1.20% 1.20% (25)
(1) California CPI
(2) The forecast for Lottery funding per ADA includes only the amount restricted by Proposition 20 (2000) for instructional materials. Lottery funding is based on prior year annual ADA times thestatewide average excused absence factor of 1.04446.
(3) The forecast for Lottery funding per ADA includes only the base (unrestricted) funding. Lottery funding is based on prior year annual ADA times the statewide average excused absence factor of1.04446.
(4) Interest Rate for 10-year Treasuries
(5) Net Funded Revenue Limit Change
(6) Revenue Limit Deficits K-12
(7) Special Education Base Deficit
(8) State Categorial COLA (including adult ed, ROC/P)
(9) Statutory COLA (use for K-12 and COE Revenue Limits and Special Education)
(10) Title I, Part A (Basic Grant) Resource 3010
(11) Special Education Resource 3310
(12) Title II, Part A (Teacher Quality)
(13) County Office Revenue Limit Deficit
(14) Title II, Part D (Enhancing Education through Technology) Resource 4045
(15) Title III (Language Acquisition) Resource 4203
(16) Title IV (Safe and Drug Free Schools) Resource 3710
Fiscal Crisis & Management Assistance Team
52 AppENDICES
Projection Rules
Page 2 of 2
LEA: Orange UnifiedProjection: Orange Unified School District - 2008-09 1st Interim
Rule Description Base Year2008 - 09
Year 12009 - 10
Year 22010 - 11
Note
Printed by: Jim Cerreta Print date: 2/6/2009 4:12 PM
(17) Title V, Part A (Innovative Programs) Resource 4110
(18) Title IV Part B (21st Century Learning Centers) Resource 4124
(19) Title I, Part B, Subpart 1 (Reading First) Resource 3030
(20) Title I, Part B, Subpart 3 (Even Start) Resource 3105
(21) Career and Technical Ed Grants
(22) Autobalance Rule
(23) Federal COLA
(24) Indirect Rate
(25) User Rule

Orange Unified School District
53AppENDICES
General Fund/County School Service FundUnrestricted and Restricted Resources
Revenues, Expenditures, and Changes in the Fund Balance
Page 1 of 1
LEA: Orange UnifiedProjection: Orange Unified School District - 2008-09 1st Interim
Printed by: Jim Cerreta Print date: 2/6/2009 4:22 PM
Name Object Code Base Year2008 - 09
Year 12009 - 10
Year 22010 - 11
Revenues
Revenue Limit Sources 8010 - 8099 $154,800,748.87 $151,042,720.05 $148,866,465.69
Federal Revenues 8100 - 8299 $14,711,535.00 $12,315,461.00 $12,082,319.00
Other State Revenues 8300 - 8599 $49,466,422.00 $48,084,662.21 $48,078,406.97
Other Local Revenues 8600 - 8799 $8,565,526.00 $7,157,920.15 $7,139,031.75
Total Revenues $227,544,231.87 $218,600,763.41 $216,166,223.41
Expenditures
Certificated Salaries 1000 - 1999 $118,091,674.00 $119,769,727.88 $122,158,361.14
Classified Salaries 2000 - 2999 $38,748,696.00 $39,459,438.52 $40,191,153.25
Employee Benefits 3000 - 3999 $40,644,265.00 $43,538,293.28 $43,993,755.49
Books and Supplies 4000 - 4999 $15,930,425.37 $8,134,629.91 $7,971,671.03
Services and Other Operating Expenditures 5000 - 5999 $26,837,590.63 $24,137,666.28 $24,225,238.13
Capital Outlay 6000 - 6900 $1,588,386.00 $215,649.00 $215,649.00
Other Outgo 7000 - 7299 $2,168,010.00 $2,156,177.00 $2,156,177.00
Direct Support/Indirect Cost 7300 - 7399 ($121,250.00) ($212,866.00) ($218,964.00)
Debt Service 7430 - 7439 $5,874,261.00 $6,656,246.00 $6,818,855.00
Total Expenditures $249,762,058.00 $243,854,961.87 $247,511,896.04
Excess (Deficiency) of Revenues Over Expenditures ($22,217,826.13) ($25,254,198.46) ($31,345,672.63)
Other Financing Sources\Uses
Interfund Transfers In 8900 - 8929 $0.00 $0.00 $0.00
Interfund Transfers Out 7600 - 7629 $1,208,110.00 $1,208,110.00 $1,208,110.00
All Other Financing Sources 8930 - 8979 $1,124,450.00 $0.00 $0.00
All Other Financing Uses 7630 - 7699 $0.00 $0.00 $0.00
Contributions 8980 - 8999 $0.00 $0.00 $0.00
Total Other Financing Sources\Uses ($83,660.00) ($1,208,110.00) ($1,208,110.00)
Net Increase (Decrease) in Fund Balance ($22,301,486.13) ($26,462,308.46) ($32,553,782.63)
Fund Balance
Beginning Fund Balance 9791 $29,517,255.86 $7,215,769.73 ($19,246,538.73)
Audit Adjustments 9793 $0.00 $0.00 $0.00
Other Restatements 9795 $0.00 $0.00 $0.00
Adjusted Beginning Fund Balance $29,517,255.86 $7,215,769.73 ($19,246,538.73)
Ending Fund Balance $7,215,769.73 ($19,246,538.73) ($51,800,321.36)
Components of Ending Fund Balance
Reserved Balances 9700 $0.00 $0.00 $0.00
Revolving Cash 9711 $125,000.00 $125,000.00 $125,000.00
Stores 9712 $150,000.00 $150,000.00 $150,000.00
Prepaid Expenditures 9713 $0.00 $0.00 $0.00
Other Prepay 9719 $0.00 $0.00 $0.00
General Reserve 9730 $0.00 $0.00 $0.00
Legally Restricted Balance 9740 - 9759 $0.00 $5,345.41 $10,716.56
Economic Uncertainties Percentage 3.00% 3.00% 3.00%
Designated for Economic Uncertainties 9770 $7,529,105.04 $7,351,892.16 $7,461,600.18
Designated for the Unrealized Gains of Investments and Cash in County Treasury 9775 $0.00 $0.00 $0.00
Other Designated 9780 $2,878,719.00 $0.00 $0.00
Undesignated/Unappropriated 9790 $0.00 $0.00 $0.00
Negative Shortfall 9790 ($3,467,054.31) ($26,878,776.30) ($59,547,638.10)

Fiscal Crisis & Management Assistance Team
54 AppENDICES

Orange Unified School District
55AppENDICES

Fiscal Crisis & Management Assistance Team
56 AppENDICES
Orange Unified School District
57AppENDICES

Fiscal Crisis & Management Assistance Team
58 AppENDICES