orange data outcomes njask and hspa october 2013 1
TRANSCRIPT

1
Orange Data Outcomes
NJASK and HSPAOctober 2013

2
Grade 3 Mathematics2013
Cleveland Forest Heywood Lincoln Oakwood Park RPCCS0
10
20
30
40
50
60
70
80
90
100
5450
56 52.7 53
76.3
40
20092010201120122013

3
Grade 3 Language Arts2013
Cleveland Forest Heywood Lincoln Oakwood Park RPCCS0
10
20
30
40
50
60
70
80
90
100
5445.5
40
63.6
38.2
73
33.3
20092010201120122013

4
Grade 4 Mathematics2013
Cleveland Forest Heywood Lincoln Oakwood Park RPCCS0
10
20
30
40
50
60
70
80
90
100
6556.3
62.5
46.8
36.7
60.5
49.520092010201120122013

5
Grade 4 Language Arts2013
Cleve-land
Forest Heywood Lincoln Oakwood Park Rosa Parks
0
10
20
30
40
50
60
70
35.9
43.737.5
24.2
13.3
47.6
23.2
20092010201120122013

6
Grade 4 Science2013
Cleveland Forest Heywood Lincoln Oakwood Park RPCCS0
10
20
30
40
50
60
70
80
90
100
85
65.6
76.8 75.8
50
77.369.3
2010201120122013

7
Grade 5 Mathematics2013
Cleveland Forest Heywood Lincoln Oakwood Park RPCCS0
10
20
30
40
50
60
70
80
90
100
66.6 68.5
52.8 54.5 52 54.261.4
20092010201120122013

8
Grade 5 Language Arts2013
Cleveland Forest Heywood Lincoln Oakwood Park RPCCS0
10
20
30
40
50
60
70
80
90
100
44.539.4
43.436.7
12
25.430
20092010201120122013

9
Grade 6 Mathematics2013
Cleveland Forest Heywood Lincoln Oakwood Park RPCCS0
10
20
30
40
50
60
70
80
90
100
62.9 64.9
54.4 55.4
68.9
58.963.3
20092010201120122013

10
Grade 6 Language Arts2013
Cleveland Forest Heywood Lincoln Oakwood Park RPCCS0
10
20
30
40
50
60
70
80
90
100
46.2
62.2
45.7 43.537.9 40
5020092010201120122013

11
Grade 7 Mathematics2013
Cleveland Forest Heywood Lincoln Oakwood Park RPCCS0
10
20
30
40
50
60
70
80
90
100
48.6
34.1 35 37.1
10.3
36.532.6
201120122013

12
Grade 7 Language Arts2013
Cleveland Forest Heywood Lincoln Oakwood Park RPCCS0
10
20
30
40
50
60
70
80
90
100
47.4 46.4
32.538.7
24.8
37.343.1
201120122013

13
Grade 82013
ELA Math Science0
10
20
30
40
50
60
70
54.6
29
41.4
200220032004200520062007200820092010201120122013

14
Grade 11 Mathematics2013
Mathematics0
10
20
30
40
50
60
70
80
90
100
25.730.9
45.9 48.82010201120122013

15
Grade 11 Language Arts2013
Language Arts0
10
20
30
40
50
60
70
80
57.664
75.569.8
2010201120122013
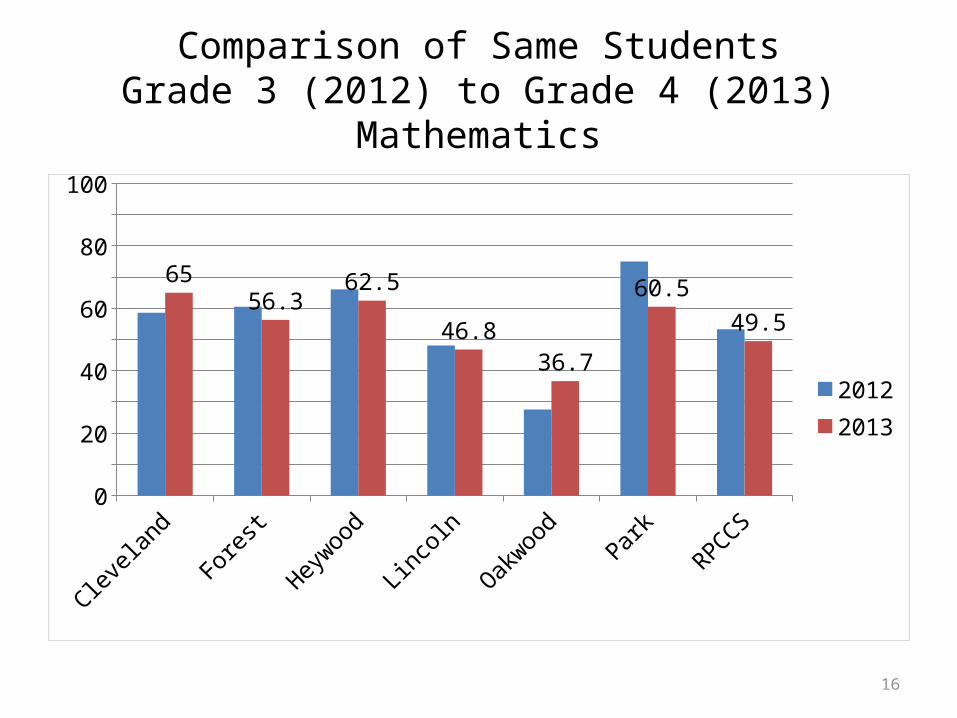
16
Comparison of Same StudentsGrade 3 (2012) to Grade 4 (2013)
Mathematics
Cleveland Forest Heywood Lincoln Oakwood Park RPCCS0
10
20
30
40
50
60
70
80
90
100
6556.3
62.5
46.8
36.7
60.5
49.5 20122013

17
Comparison of Same StudentsGrade 3 (2012) to Grade 4 (2013)
Language Arts
Cleve-land
Forest Heywood Lincoln Oakwood Park RPCCS0
10
20
30
40
50
60
70
80
35.9
43.737.5
24.2
13.3
47.6
23.2
20122013

18
Comparison of Same StudentsGrade 4 (2012) to Grade 5 (2013)
Mathematics
Cleveland Forest Heywood Lincoln Oakwood Park RPCCS0
10
20
30
40
50
60
70
80
90
100
66.6 68.5
52.8 54.5 52 54.261.4
20122013
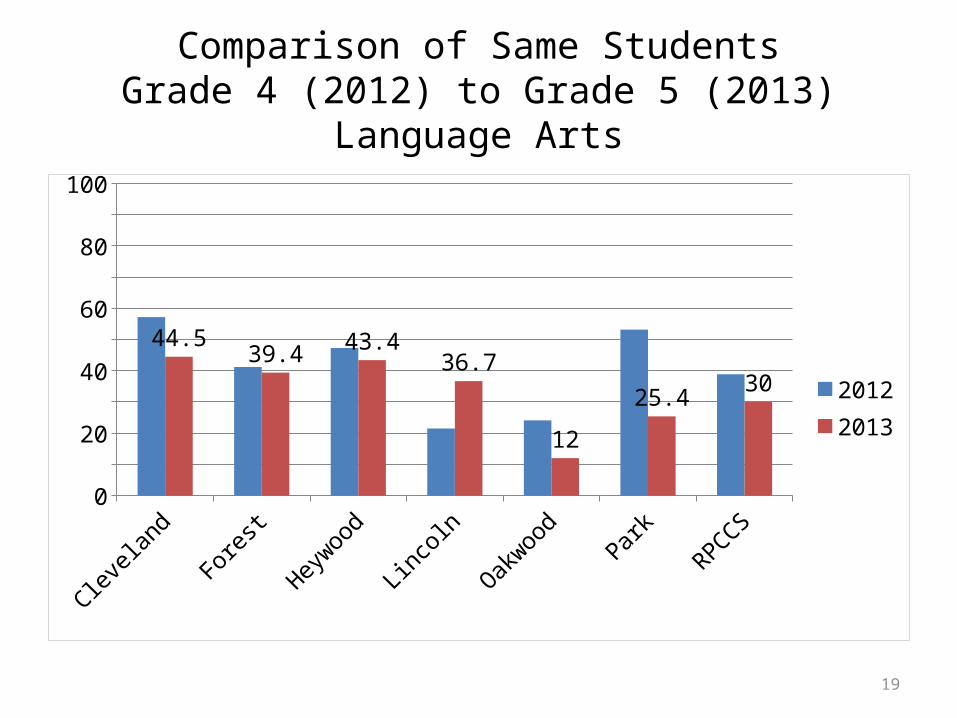
19
Comparison of Same StudentsGrade 4 (2012) to Grade 5 (2013)
Language Arts
Cleveland Forest Heywood Lincoln Oakwood Park RPCCS0
10
20
30
40
50
60
70
80
90
100
44.539.4
43.436.7
12
25.430
20122013
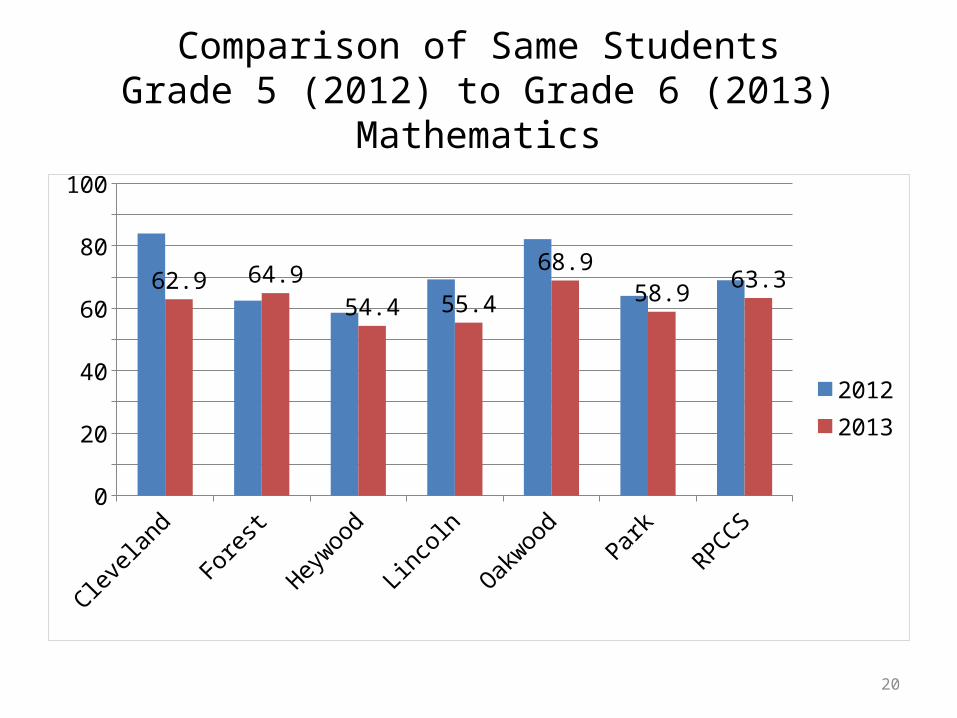
20
Comparison of Same StudentsGrade 5 (2012) to Grade 6 (2013)
Mathematics
Cleveland Forest Heywood Lincoln Oakwood Park RPCCS0
10
20
30
40
50
60
70
80
90
100
62.9 64.9
54.4 55.4
68.9
58.963.3
20122013

21
Comparison of Same StudentsGrade 5 (2012) to Grade 6 (2013)
Language Arts
Cleveland Forest Heywood Lincoln Oakwood Park RPCCS0
10
20
30
40
50
60
70
80
90
100
46.2
62.2
45.7 43.537.9 40
50 20122013
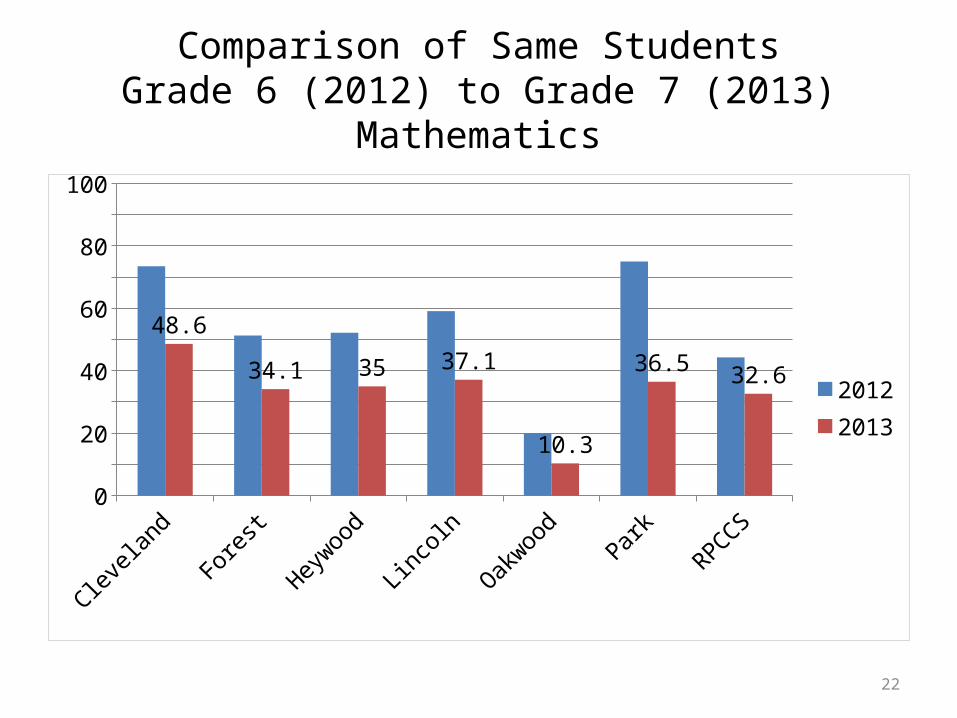
22
Comparison of Same StudentsGrade 6 (2012) to Grade 7 (2013)
Mathematics
Cleveland Forest Heywood Lincoln Oakwood Park RPCCS0
10
20
30
40
50
60
70
80
90
100
48.6
34.1 35 37.1
10.3
36.532.6
20122013

23
Comparison of Same StudentsGrade 6 (2012) to Grade 7 (2013)
Language Arts
Cleveland Forest Heywood Lincoln Oakwood Park RPCCS0
10
20
30
40
50
60
70
80
90
100
47.4 46.4
32.538.7
24.8
37.343.1
20122013

24
Comparison of Same StudentsGrade 7 (2012) to Grade 8 (2013)
Mathematics
Cleveland Forest Heywood Lincoln Oakwood Park RPCCS OPA0
10
20
30
40
50
60
70
80
90
100
34.4
13.5
52.1
31.925
35.128.8 29
20122013

25
Comparison of Same StudentsGrade 7 (2012) to Grade 8 (2013)
Language Arts
Cleveland Forest Heywood Lincoln Oakwood Park RPCCS OPA0
10
20
30
40
50
60
70
80
90
100
21.9 21.6
46.8
35.3 33.3 30.4 33.8
54.620122013
26
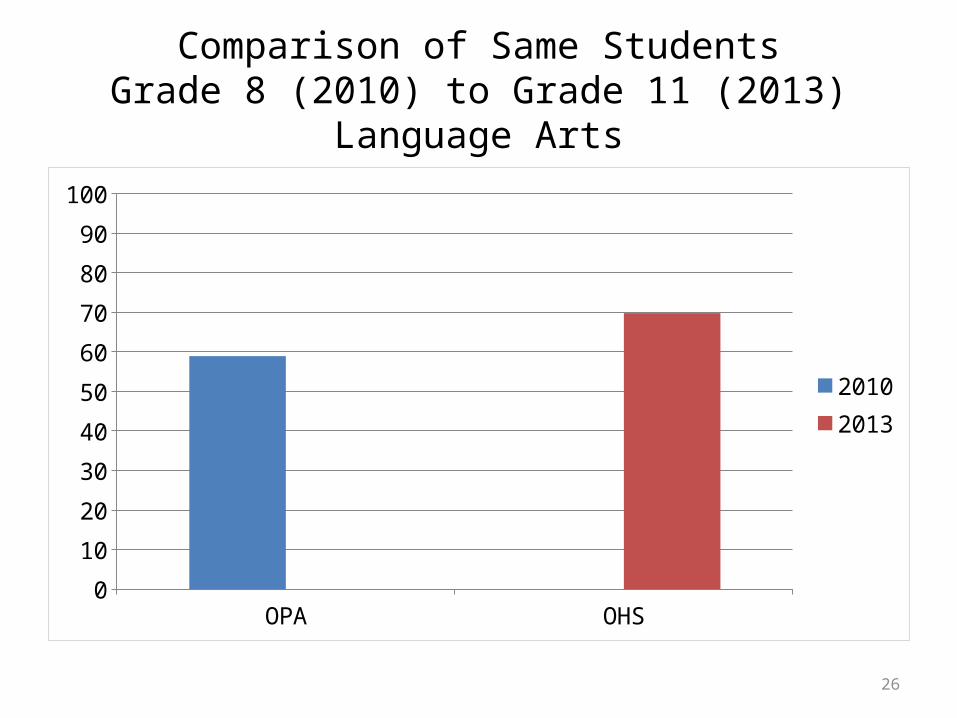
Comparison of Same StudentsGrade 8 (2010) to Grade 11 (2013)
Language Arts
OPA OHS0
10
20
30
40
50
60
70
80
90
100
20102013

27
Comparison of Same StudentsGrade 8 (2010) to Grade 11 (2013)
Mathematics
OPA OHS0
10
20
30
40
50
60
70
80
90
100
41.848.8 2010
2013