oral and poster as - c.ymcdn.com magnetic resonance in atlanta, ga, ... radiolabeled microspheres,...
TRANSCRIPT
Journal of Cardiovascular Magnetic Resonance, 1( l), 65-109 (1999)
ABSTRACTS
Oral and Poster Abstracts were presented at the first annual meeting of the Society for Cardiovascular Magnetic Resonance in Atlanta, GA, January 30-Feb- ruary 1, 1998.
NC100150 Injection: A New Intravascular M R Contrast Agent for Morphological and Functional Assessment of the Heart Kirk S. Tarlo,' Michael Jerosch-Herold? Abdul Mansoor: Shoto Gurchumelidze.2 Myra Unress.2 Ymei Huang.2 Ed McFalls? Norbert Wilke? INycomed Inc., Wayne, PA: 2Universify of Minnesota, Dept. of Radiology, Center for MR Research; 'VA Medical Cenfer, MN
NC100150 injection is a highly intravascular, superparamagnetic iron oxide contrast agent intended for MR angiography and perfusion im- aging. It has the advantage of a long blood half-life with minimal toxic- ity. The agent is completely cleared from blood by tissues in the reticu- loendothelial system. After administration at the clinical imaging dose, NC100150 injection has not been shown to induce symptoms of acute or chronic toxicity. The purpose of this study was to demonstrate the preclinical efficacy of NC100150 injection in cardiac imaging. Using a pig model, artificial coronary stenoses were induced at the LAD. Mul- tiple intravenous injections of NC1001.50 injection (final dosages of 0.5, 1, 2, 3. 4, 5, and 6 mg Felkg) were administered to four pigs. The pigs (30-45 kg) were imaged using T1-weighted, quantitative MR first- pass perfusion imaging (TR/TE W.7) with retrospective gating and navigator echoes on a VISION 1.5 T (Siemens) scanner equipped with phased array coils. Similarly treated pigs were evaluated by x-ray angi- ography, radiolabeled microspheres, and PET imaging. Inductively coupled plasma atomic emission spectroscopy measurements were ob- tained to correlate iron oxide blood levels to T1 signal changes. At a bolus dosage of 0.5 mg Felkg, absolute quantification of the MR perfu- sion data yields a correlation of r = 0.96 when compared with micro- spheres. A dosage of 1-2 mg Felkg (TE dependent) was necessary for optimal signal enhancement during CA equilibrium measurements and coronary angiography. Coronary stenoses of >65% can be detected and signal enhancement increased significantly (p < 0.001) postcontrast. For gradient-echo cine MR images (TE 4.8 ms), the optimal blood pool signal enhancement for better endocardial border definition was achieved using a dosage 5 4 mg Felkg. Larger dosages showed signal decrease. NC100150 injection clearly enhances cardiovascular MR im- aging using standard sequences. Absolute quantification of myocardial blood flow and volume is possible. These preliminary preclinical data suggest NC100150 injection is useful and should be further evaluated in clinical trials of the functional and morphological assessment of the heart.
Assessment of Dynamic Cardiomyoplasty Mechanics Using MRI with Tissue Tagging A.S. Blom, J. Pilla, L. Dougherty, H.J. Patel, S.V. Pusca, Q. Yuan, V.A. Ferrari, M.A. Acker, L. Axel. Philadelphia, P A
nique, values for principal strains can be calculated, which much more directly reflect regional function than other methods, such as echocardi- ography and hemodynamics. Prior studies using tagged MRI to assess CMP have examined only global tag displacements (2). In this study, we used tagged MRI to assess regional strain and displacement in a canine model of CMF'.
Three mongrel dogs were rapid ventricular paced (RVP) (230 bpm) for 10 weeks; after 4 weeks of RVP, a left anterior CMP was performed. The muscle wrap was dynamically stimulated for 1 year after RVP, allowing ventricular function to reapproach baseline values. The dogs were then imaged in a 1.5 T whole body clinical MRI system (GEMS). High-resolution images were acquired using the following parameters: TR/TE 8.8/2.1 ms; FOV 16-18 cm; tag spacing 4-5 mm; 256 X 128 acquisition matrix interpolated to 256 X 256. Images were acquired during unstimulated and stimulated states using a custom MRI stimulat- ing system. Quantitative 2-D regional image analysis was performed with a custom program, SPAMMW (3). The heart was divided into four regions: anterior, posterior, septal, and lateral. Maximal and mini- mal principal strains (A, and h2) and displacement (D) were determined and pooled for each region.
h, and h2 were unchanged in any of the regions between unstimu- lated and stimulated states ( p = NS). Values for D did not change for the septal region ( p = NS); D increased significantly in the other three regions (posteroseptal, posterolateral, and anterolateral; p < 0.05).
We showed no significant strain changes associated with dynamic stimulation in CMP. Therefore, the stimulation seems to result primar- ily in global translation of the heart rather than augmented Eontraction.
References 1. Axel L, Dougherty L. MR imaging of motion with spatial modula- tion of magnetization. Radiology, 1989; 171:841-845. 2. Cho PW, Levin HR, et al. New method for mechanistic studies of cardiomyoplasty: three-dimensional MRI reconstructions. Ann Thonc Surg, 1994; 57:1605-1611. 3. Axel L, Bloomgarden DC, et al. SPAMMVU: a program for analysis of dynamic tagged MRI. Proceedings of the Society of Magnetic Reso- nance in Medicine, 1993, p. 724.
Measurement of Regional and Transmural Variation in Left Ventricular Myocardial Motion Using 3D Velocity- Encoded Cine MR Imaging R.J. van der Geest, H.W.M. Kayser, E.E. van der Wall, A. de Roos, J.H.C. Reiber. Leiden, The Netherlands
Three-dimensional velocity-encoded cine MRI (3D VEC-MRI) was used to study the left ventricular (LV) wall motion patterns in different anatomical regions and transmural locations in a population of 12 healthy volunteers (mean age 34; one female). In a midventricular short-axis slice, VEC-MRI was performed using velocity encoding in three orthogonal directions with a venc of 30 cmls. The field of view was 300 mm, the slice thickness 8 mrn, the flip angle 20", whereas the scan matrix of 128 X 256 was reconstructed to an image matrix of 256 X 256. Retrospective gating was used to acquire 29 phases over the complete cardiac cycle.
The LV myocardium was divided into three equally sized anatomi- The beneficial effects of dynamic cardiomyoplasty (CMP) on left ven- tricular function in congestive heart failure remain incompletely under- stood, in particular, the relative roles of c o n a t i o n augmentation and limitation of ventricular dilatation. MRI with tissue tagging (1) cannon- invasively assess regional mechanical cardiac function. Using this tech-
cal regions. For each pixel within the myocardium, velocity was mea- sured in radial (RAD), circumferential (CIRC), and through-plane di- rection (Z), whereas the anatomical region and transmural location (on a scale of 0-1; 0 at epicardial and 1.0 at the endocardial margin) of the pixel were recorded. Results were averaged per individual cardiac
65
66
2 2 .
1998 SCMR Annual Meeting
- Pre-arntrast .v. P o s t - w ~ s t
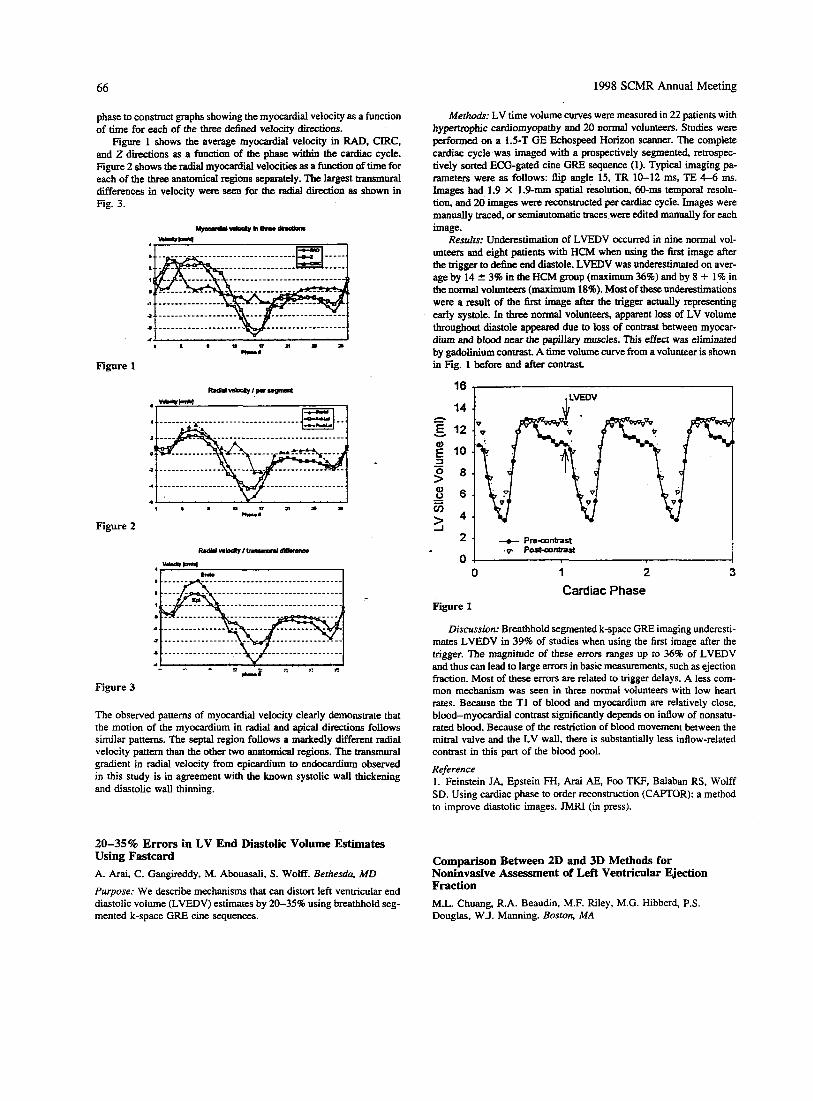
phase to construct graphs showing the myocardial velocity as a function of time for each of the three defined velocity directions.
Figure 1 shows the average myocardial velocity in RAD. CIRC, and 2 directions as a function of the phase within the cardiac cycle. Figure 2 shows the radial myocardial velocities as a function of time for each of the three anatomical regions separately. The largest transmural differences in velocity were seen for the radial direction as shown in Fig. 3.
Figure 1
Figure 2
Figure 3
The observed patterns of myocardial velocity clearly demonstrate that the motion of the myocardium in radial and apical directions follows similar patterns. The septai region follows a markedly different radial velocity pattern than the other two anatomical regions. The transmural gradient in radial velocity from epicardium to endocardium observed in this study is in agreement with the known systolic wall thickening and diastolic wall thinning.
20-35% Errors in LV End Diastolic Volume Estimates Using Fastcard A. Arai, C. Gangireddy, M. Abouasali, S . WOW. Bethesda, MD
Purpose: We describe mechanisms that can distort left ventricular end diastolic volume (LVEDV) estimates by 20-35% using breathhold seg- mented k-space GRE cine sequences.
Methods: LV time volume curves were measured in 22 patients with hypemphic cardiomyopathy and 20 normal volunteers. Studies were performed on a 1.5-T GE Echospeed Horizon scanner. The complete cardiac cycle was imaged with a prospectively segmented, retrospec- tively sorted ECG-gated cine GRE sequence (1). Typical imaging pa- rameters were as follows: f i p angle 15, TR 10-12 ms, TE 4-6 ms. Images had 1.9 X 1.9-mm spatial resolution, 60-ms temporal resolu- tion, and 20 images were reconstructed per cardiac cycle. Images were manually traced, or semiautomatic traces were edited manually for each image.
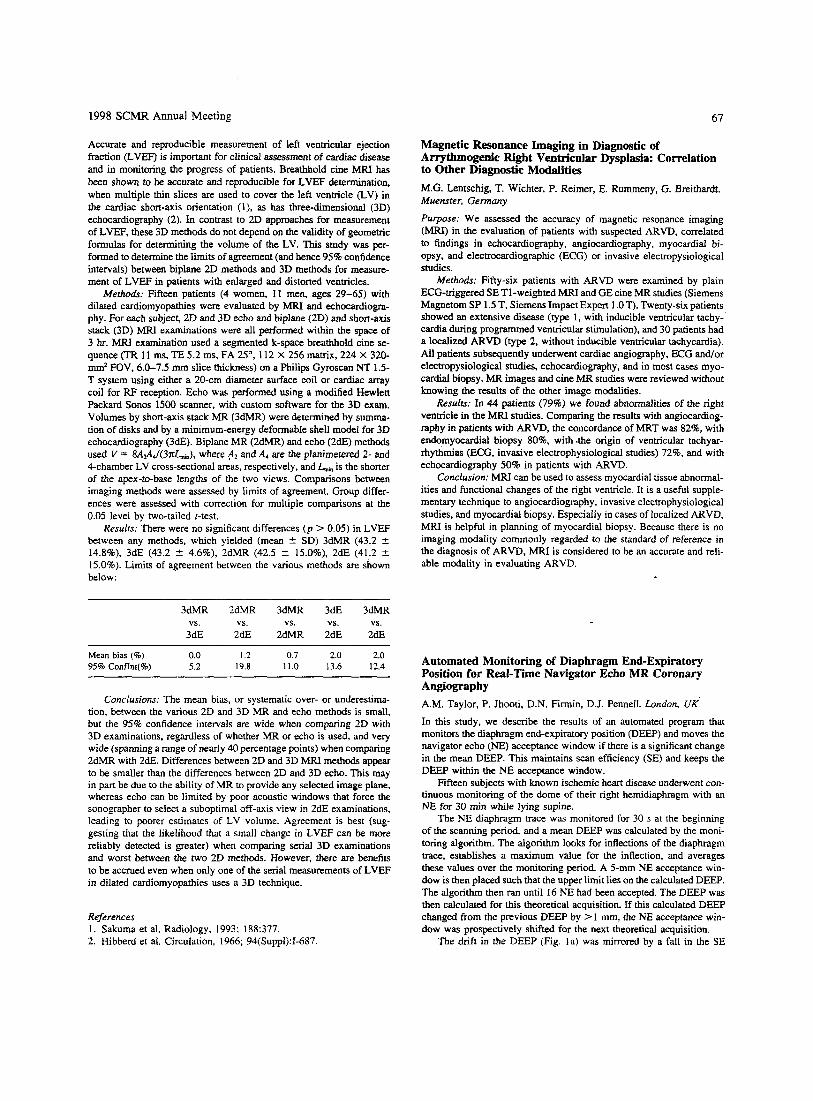
Results: Underestimation of LVEDV occurred in nine normal vol- unteers and eight patients with HCM when using the first image after the trigger to define end diastole. LVEDV was underestimated on aver- age by 14 2 3% in the HCM group (maximum 36%) and by 8 + 1% in the normal volunteers (maximum 18%). Most of these underestimations were a result of the first image after the trigger actually representing early systole. In three normal volunteers, apparent loss of LV volume throughout diastole appeared due to loss of contrast between myocar- dium and blood mar the papillary muscles. This effect was eliminated by gadolinium contrast. A time volume curve from a volunteer is shown in Fig. 1 before and after contrast.
h - E v
z
16
14
12
10
8
6
4
1 , LVEDV I
Comparison Between 2D and 3D Methods for Noninvasive Assessment of Left Ventricular Ejection Fraction M.L. Chuang, R.A. Beaudin, M.F. Riley, M.G. Hibberd, P.S. Douglas, W.J. Manning. Boston, MA
1998 SCMR Annual Meeting 67
Accurate and reproducible measurement of left ventricular ejection fraction (LVEF) is important for clinical assessment of cardiac disease and in monitoring the progress of patients. Breathhold cine MRI has been shown to be accurate and reproducible for LVEF determination, when multiple thin slices are used to cover the left ventricle (LV) in the cardiac short-axis orientation (l), as has three-dimensional (3D) echocardiography (2). In contrast to 2D approaches for measurement of LVEF, these 3D methods do not depend on the validity of geometric formulas for determining the volume of the LV. This study was per- formed to determine the limits of agreement (and hence 95% confidence intervals) between biplane 2D methods and 3D methods for measure- ment of LVEF in patients with enlarged and distorted ventricles.
Methods: Fifteen patients (4 women, 11 men, ages 29-65) with dilated cardiomyopathies were evaluated by MRI and echocardiogra- phy. For each subject, 2D and 3D echo and biplane (2D) and short-axis stack (3D) MRI examinations were all performed within the space of 3 hr. MRI examination used a segmented k-space breathhold cine se- quence (TR l l ms, TE 5.2 ms, FA 25". 112 X 256 matrix, 224 X 320- mm2 FOV, 6.0-7.5 mrn slice thickness) on a Philips Gyroscan NT 1.5- T system using either a 20-cm diameter surface coil or cardiac array coil for RF reception. Echo was performed using a modified Hewlett Packard Sonos 1500 scanner, with custom software for the 3D exam. Volumes by short-axis stack MR (3dMR) were determined by summa- tion of disks and by a minimum-energy deformable shell model for 3D echocardiography (3dE). Biplane MR (2dMR) and echo (2dE) methods used V = 8Agi4/(3&3, where A2 and A4 are the planimetered 2- and 4-chamber LV cross-sectional areas, respectively, and L,, is the shorter of the apex-to-base lengths of the two views. Comparisons between imaging methods were assessed by limits of agreement. Group differ- ences were assessed with correction for multiple comparisons at the 0.05 level by two-tailed t-test.
Resulrs: There were no significant differences (p > 0.05) in LVEF between any methods, which yielded (mean 2 SD) 3dMR (43.2 2 14.84). 3dE (43.2 -+ 4.6%). 2dMR (42.5 2 15.0%). 2dE (41.2 2 15.0%). Limits of agreement between the various methods are shown below:
3dMR 2dMR 3dMR 3dE 3dMR
3dE 2dE 2dMR 2dE 2dE vs. vs. vs. vs. vs.
Mean bias (C) 0.0 I .2 0.7 2.0 2.0 95% Conffnt(C) 5.2 19.8 11.0 13.6 12.4
Conclusions: The mean bias, or systematic over- or underestima- tion, between the various 2D and 3D MR and echo methods is small, but the 95% confidence intervals are wide when comparing 2D with 3D examinations, regardless of whether MR or echo is used, and very wide (spanning a range of nearly 40 percentage points) when comparing 2dMR with 2dE. Differences between 2D and 3D MRI methods appear to be smaller than the differences between 2D and 3D echo. This may in part be due to the ability of MR to provide any selected image plane, whereas echo can be limited by poor acoustic windows that force the sonographer to select a suboptimal off-axis view in 2dE examinations, leading to poorer estimates of LV volume. Agreement is best (sug- gesting that the likelihood that a small change in LVEF can be more reliably detected is greater) when comparing serial 3D examinations and worst between the two 2D methods. However, there are benefits to be accrued even when only one of the serial measurements of LVEF in dilated wdiomyopathies uses a 3D technique.
References 1. Sakuma et al. Radiology, 1993; 188:377. 2. Hibberd et al. Circulation, 1966; 94(Suppl):I-687.
Magnetic Resonance Imaging in Diagnostic of Arrythmogenic Rigbt Ventricular Dysplasia: Cnrrelation to Other Diagnostic Modalities M.G. Lentschig, T. Wichter, P. Reimer, E. Rumrneny, G. Breithardt. Muenster, Germany
Purpose: We assessed the accuracy of magnetic resonance imaging (MRI) in the evaluation of patients with suspected ARVD, correlated to findings in echocardiography, angiocardiography, myocardial bi- opsy, and electrocardiographic (ECG) or invasive electropysiological studies.
Methods: Fifty-six patients with ARVD were examined by plain ECG-triggered SE T1-weighted MRT and GE cine MR studies (Siemens Magnetom SP 1.5 T, Siemens Impact Expert 1 .O T). Twenty-six patients showed an extensive disease (type 1, with inducible ventricular tachy- cardia during programmed ventricular stimulation), and 30 patients had a localized ARVD (type 2, without inducible ventricular tachycardia). All patients subsequently underwent cardiac angiography, ECG and/or electropysiological studies, echocardiography, and in most cases myo- cardial biopsy. M R images and cine MR studies were reviewed without knowing the results of the other image modalities.
Results: In 44 patients (79%) we found abnormalities of the right ventricle in the MRI studies. Comparing the results with angiocardiog- raphy in patients with ARVD, the concordance of MRT was 8 2 8 , with endomyocardial biopsy 80%. with .the origin of ventricular tachyar- rhythmias (ECG, invasive electrophysiological studies) 7 2 8 , and with echocardiography 50% in patients with ARVD.
Conclusion: MRI can be used to assess myocardial tissue abnormal- ities and functional changes of the right ventricle. It is a useful supple- mentary technique to angiocardiography, invasive electrophysiological studies, and myocardial biopsy. Especially in cases of localized ARVD, MRI is helpful in planning of myocardial biopsy. Because there is no imaging modality commonly regarded to the standard of reference in the diagnosis of ARVD, MRI is considered to be an accurate and reli- able modality in evaluating ARVD.
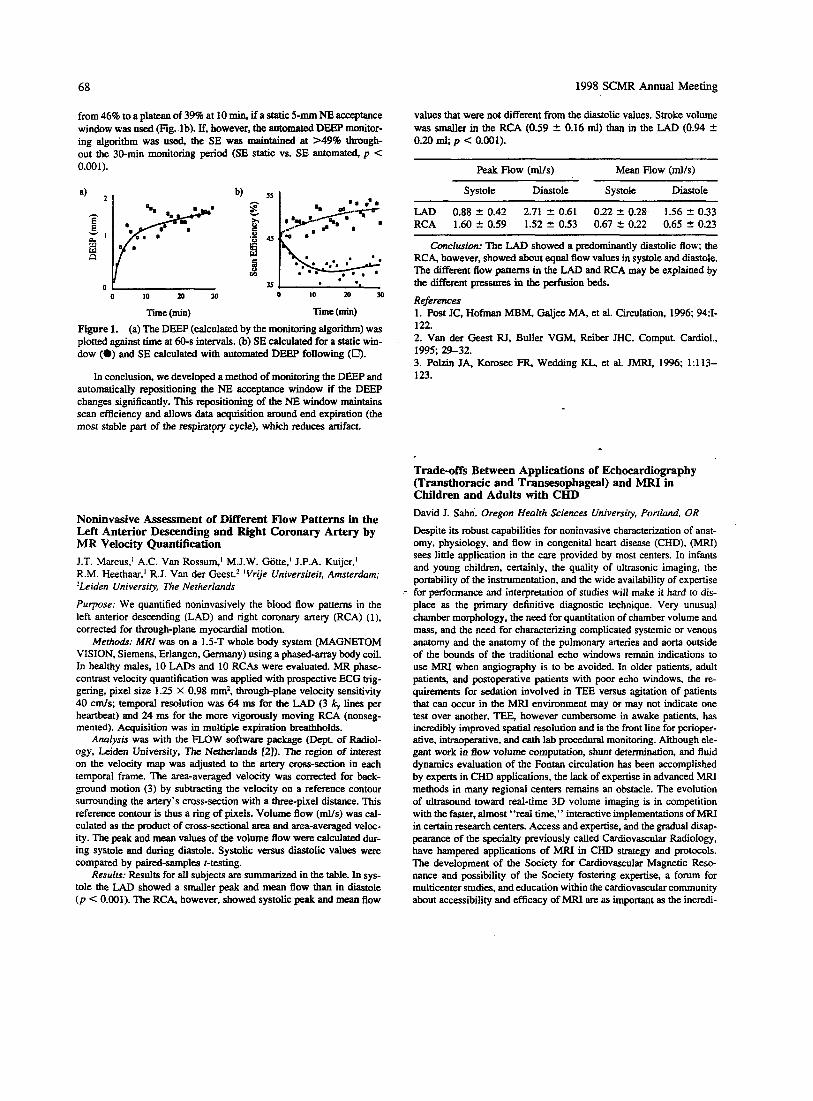
Automated Monitoring of Diaphragm End-Expiratory Position for Red-Time Navigator Echo MR Coronary Angiography A.M. Taylor, P. Jhooti, D.N. Firmin, D.J. Pennell. London. UK In this study, we describe the results of an automated program that monitors the diaphragm end-expiratory position (DEEP) and moves the navigator echo (NE) acceptance window if there is a significant change in the mean DEEP. This maintains scan efficiency (SE) and keeps the DEEP within the NE acceptance window.
Fifteen subjects with known ischemic heart disease underwent con- tinuous monitoring of the dome of their right hemidiaphragm with an NE for 30 min while lying supine.
The NE diaphragm trace was monitored for 30 s at the beginning of the scanning period, and a mean DEEP was calculated by the moni- toring algorithm. The algorithm looks for inflections of the diaphragm trace, establishes a maximum value for the inflection, and averages these values over the monitoring period. A 5-mm NE acceptance win- dow is then placed such that the upper limit lies on the calculated DEEP. The algorithm then ran until 16 NE had been accepted. The DEEP was then calculated for this theoretical acquisition. If this calculated DEEP changed from the previous DEEP by > 1 mm, the NE acceptance win- dow was prospectively shifted for the next theoretical acquisition.
The drift in the DEEP (Fig. la) was mirrored by a fall in the SE
68 1998 SCMR Annual Meeting
values that were not different from the diastolic values. Stroke volume was smaller in the RCA (0.59 -C 0.16 mi) than in the LAD (0.94 2 0.20 ml; p c 0.001).
from 46% to a plateau of 39% at 10 min, i fa static 5-mm NE acceptance window was used (Fig. lb). If, however, the a u t o m a t e d DEEP monitor- ing algorithm was used, the SE was maintained at >49% through- out the 30-min monitoring period (SE static vs. SE automated, p < 0.001).
. . . 35 O I O ~ X I
o r 0 1 0 2 0 3 0
Time (min) Tune (min)
Figure 1. (a) The DEEP (calculated by the monitoring algorithm) was plotted against time at 60-s intervals. (b) SE calculated for a static win- dow (0) and SE calculated with automated DEEP following (0).
In conclusion. we developed a method of monitoring the DEEP and automatically repositioning the NE acceptance window if the DEEP changes significantly. This repositioning of the NE window maintains scan efficiency and allows data acquisition around end expiration (the most stable part of the respiratpry cycle), which reduces artifact.
Noninvasive Assessment of Dinerent Flow Patterns in the Left Anterior Descending and Right Coronary Artery by MR Velocity Quantification J.T. Marcus,' A.C. Van Rossum,' M.J.W. Gotte,' J.P.A. Kuijer,' R.M. Heethaar,' R.J. Van der Geest.' 'Vrije Universiteit, Amsterdam; ?Leiden University, The Netherlands
Purpose: We quantified noninvasively the blood flow patterns in the left anterior descending (LAD) and right coronary artery (RCA) (1). corrected for through-plane myocardial motion.
Merhods: MRI was on a 1.5-T whole body system (MAGNETOM VISION, Siemens, Erlangen, Germany) using a phased-array body coil. In healthy males, 10 LADS and 10 RCAs were evaluated. MR phase- contrast velocity quantification was applied with prospective ECG trig- gering, pixel size 1.25 X 0.98 mm2, through-plane velocity sensitivity 40 cm/s; temporal resolution was 64 ms for the LAD (3 k, lines per heartbeat) and 24 ms for the more vigorously moving RCA (nonseg- mented). Acquisition was in multiple expiration breathholds.
Analysis was with the FLOW software package (Dept of Radiol- ogy, Leiden University, The Netherlands 121). The region of interest on the velocity map was adjusted to the artery cross-section in each temporal frame. The area-averaged velocity was corrected for back- ground motion (3) by subtracting the velocity on a reference contour surrounding the artery's cross-section with a three-pixel distance. This reference contour is thus a ring of pixels. Volume flow (ml/s) was cal- culated as the product of cross-sectional area and area-averaged veloc- ity. The peak and mean values of the volume flow were calculated dur- ing systole and during diastole. Systolic versus diastolic values were compared by paired-samples r-testing.
Results: Results for all subjects are summarized in the table. In sys- tole the LAD showed a smaller peak and mean flow than in diastole ( p C 0.001). The RCA, however, showed systolic peak and mean flow
Peak Flow (ml/s) Mean Flow (ml/s)
Systole Diastole Systole Diastole
LAD 0.88 2 0.42 2.71 2 0.61 0.22 'c 0.28 1.56 2 0.33 RCA 1.60 +- 0.59 1.52 2 0.53 0.67 'c 0.22 0.65 2 0.23
Conclusion. The LAD showed a predominantly diastolic flow; the RCA. however, showed about equal flow values in systole and diastole. The different flow patterns in the LAD and RCA may be explained by the different pressures in the perfusion beds.
References 1 . Post JC. H o b MBM. Galjee MA, et al. Circulation. 1996; 941- 122. 2. Van der Geest RJ, Buller VGM, Reiber JHC. Comput. Cardiol., 1995; 29-32. 3. Polzin JA, Korosec FR, Wedding KL, et al. JMRI, 1996; 1:113- 123.
-
Trade-offs Between Applications of Echocardiography (Transthoracic and Transesophageal) and MRI in Children and Adults with CEID David I. Sahn. Oregon Health Sciences University, Portland, OR
Despite its robust capabilities for noninvasive characterization of anat- omy, physiology, and flow in congenital heart disease (CHD), (MU) sees little application in the care provided by most centers. In infants and young children, certainly. the quality of ultrasonic imaging, the portability of the instrumentation, and the wide availability of expertise
- for performance and interpretation of studies will make it hard to dis- place as the primary definitive diagnostic technique. Very unusual chamber morphology, the need for quantitation of chamber volume and mass, and the need for characterizing complicated systemic or venous anatomy and the anatomy of the pulmonary arteries and aorta outside of the bounds of the traditional echo windows remain indications to use MRI when angiography is to be avoided. In older patients, adult patients, and postoperative patients with poor echo windows, the re- quirements for sedation involved in TEE versus agitation of patients that can occur in the MRI environment may or may not indicate one test over another. TEE, however cumbersome in awake patients, has incredibly improved spatial resolution and is the front line for perioper- ative, intraoperative, and cath lab procedural monitoring. Although ele- gant work in flow volume computation, shunt determination, and fluid dynamics evaluation of the Fontan circulation has been accomplished by experts in CHD applications, the lack of expertise in advanced MRI methods in many regional centers remains an obstacle. The evolution of ultrasound toward real-time 3D volume imaging is in competition with the faster, almost "real time," interactive implementations of MRI in certain research centers. Access and expertise, and the gradual disap- pearance of the specialty previously called Cardiovascular Radiology, have hampered applications of MRI in CHD strategy and protocols. The development of the Society for Cardiovascular Magnetic Reso- nance and possibility of the Society fostering expertise, a forum for multicenter studies, and education within the cardiovascular community about accessibility and efficacy of MRI are as important as the incredi-
1998 SCMR Annual Meeting 69
ble pace of advances in MRI methods to its wider application in the CHD population.
Conclusion: This study shows that PVM can accurately quantify the regurgitant volume in AR with the slice close to the valve. Because of the complex perimitral flow field, a CV approach may be needed for M R in multivalvular lesions where biventricular stroke volume dif- ferences cannot be used.
Quantification of Heart Valve Regurgiation with Velocity- Encoded Magnetic Resonance Imaging G.P. Chatzimavroudis,' J.N. Oshinski,' P.G. Walker? R.H. Franch,' A.P. Yoganathan,' R.I. Pettigrew.' 'Atlanta, GA; 2L.eeds, UK
Purpose and Methoa's: The aim of this study was to determine the p tential of magnetic resonance phase velocity mapping (PVM) to diag- nose aortic and mitral regurgitation (AR and MR) by measuring the aortic and mitral regurgitant volumes (ARV and MRV). The accuracy of measuring the ARV from single-slice PVM measurements in the ascending aorta during diastole was tested experimentally. A compliant aortic model with a porcine valve and coronary arteries was studied under steady and pulsatile flow conditions (AR flow rate, 0.1-5.5 I/ min; ARV, 8-75 mllbeat) in a 1.5-T Philips MRI scanner. Gradient echo velocity-encoding acquisitions (TRITEla = 30 6/35) provided the velocity profiles across the aorta. To eliminate the effects of aortic compliance and coronary flow, the slice was placed between the valve and the coronary ostia. In vivo, .19 AR patients were studied with the slice placed as close to the aortic valve as possible. just above a signal loss region (due to flow acceleration) located proximal to the valve. Because of the interaction between the regurgitant flow field and the aortic outflow field in the left ventricle (LV), the single-slice method is not reliable in MR. The great advantage of PVM to measure all three velocity components in a slice is a control volume (CV) approach. By placing a number of slices at the mitral valve and measuring all three velocity components of blood flow, a CV can be selected encompassing the valve. Becuase of mass conservation, all net inflow through the faces of the CV during systole should be equal to the regurgitant flow. This method was studied experimentally using a Plexiglas LV model and mitral regurgitant orifices under steady and pulsatile flow condi- tions (MR flow rate, 1-7 t h i n ; MRV, 10-55 mllbeat). Five contiguous slices using gradient echo sequences were acquired with velocity en- coding in all three directions in space. In AR, integration of the velocity over the aortic cross-sectional area and over diastole provided the ARV. In MR, the size of the CV was selected and integration of the velocity over the area of all faces of the CV and over systole provided the MRV.
Resulrs and Discussion: In AR, the PVM-measured and the actual regurgitant flow rates agreed very well (3 = 0.99). The same accuracy was found in the pulsatile flow results (error of 2 t 3%). In vivo. the measured ARV correlated well with clinical AR grading data. There was a general distinction between grades even in mild cases (p < 0.05). In MR, results showed that the CV method has the potential to accu- rately quantify the MRV without effects from the aortic outflow (p > 0.2) or the regurgitant orifice shape ( p > 0.4). The CV should be large enough for its boundaries to exclude the distorted signal region too close to the valve. The single-slice method provides accurate results in AR, whereas the CV method appears promising in MR, particularly when there are multiple regurgitant or shunt lesions so that a biventricu- lar stroke volume comparison is inaccurate. This study shows that the PVM CV method has some major advantages over another recent CV method, the Doppler ultrasound proximal isovelocity surface area (PISA) method. The PVM CV method is not affected by the presence of aortic outflow in contrast to PISA. In addition, the accuracy of PISA depends on the assumption made for the shape of the CV, whereas PVM, allowing all three velocity components to be measured, does not require such assumptions.
Effect of Revascularization on Left Ventricular Geometry as Assessed by MRI in Advanced Coronary Artery Disease F. Roder,' S. Nekolla,' J. Neverve,' J. StollfuE,' F. Haas? H. Meissner? M. Schwaiger.' 'Nuklearmedizinische Klinik, Klinikum Rechts der Isar, TU Miinchen, Miinchen, Germany; 2Deutsches Heruentnun, Miinchen, Germany
Introduction: Revascularization has been shown to improve regional wall motion and ejection fraction (EF) in patients with coronary artery disease (CAD). The purpose of this study was to evaluate left venmcu- lar function before and after revascularisation with cine-MRI.
Methods: Eighteen patients (17 male, 60 2 10 yr) with advanced CAD and impaired left ventricular- function were investigated before and after (4.5 ? 0.8 month) revascularization by coronary bypass grafts. Gradient-echo-cine images in 12 heart phases and 10-12 slices were acquired at 1.5 T (Philips PCS2). Images were acquired in short axes view with slice thickness of approximately 10 mm (depending on heart size). TE was 9.4 ms (flow compensated), two averages, matrix size 128. MR data were transferred to UNK workstations. Endo- and epi- cardial contours were semiautomatically traced using MASS software (University Leiden) (1.2). Based on these contours, left ventricular mass (M), end-diastolic (ED) and end-systolic (ES) left ventricular volumes (EDV, ESV), wall thickness (WT), wall thickening (WTg), and wall motion (WMo) are calculated. To accotint for different numbers of us- able slices, a volume index is calculated (EDV index). The wall parame- ters (WT, WTg, WMo) are stored with 100 values (chords) per slice. For a regional analysis, $e wall parameters are averaged for standard- vessel territories (LAD, LCX, RCA) for each patient.
Results: Patients were divided into two groups based on preopera- tive EDV index. Group 1 consisted of seven patients with enlarged LV (EDV index > 90). whereas group I1 included 11 patients with normal EDV index (c. 90). Group I shows significantly greater reduction in volume than group 11 (see table). Regions with ED wall thickness of more than 11 mm show significantly greater improvement of wall mo- tion (AWMo = 1.78 5 2.33 mm) than those with less than 1 mm ED- WT ( A W o = -0.78 ? 2.03 mm. p = O.ooO1).
Change of parameters pre- and postrevascularization for groups I and I1
I 7 135 5.1 -31.1 -26.3 -8.3 I1 11 70 3.4 5.0 -1.1 18.4 P 0.72 0.002 . 0.007 0.05
p denotes significance between groups (Student t-test).
Conclusion: Revascularization in patients with advanced CAD and dilated LV lead to significant decreases of EDV, ESV, and LV-Mass, suggesting beneficial hemodynamic effects independent of changes in
70 1998 SCMR Annual Meeting
LV ejection fraction. Regional preoperative WT was associated with functional recovery. MRI provides quantitative means to monitor LV remodeling after revascularizatim in ischemic heart disease. References 1. Buller VGM, van der Geest RJ, Kool MD, Reiber JHC. Comp.
2. van der Geest RJ, Jansen E, Buller VGM, Reiber JHC. Comp. Cardiol., 1994; 33-36.
Cardiol., 1995; 245-248.
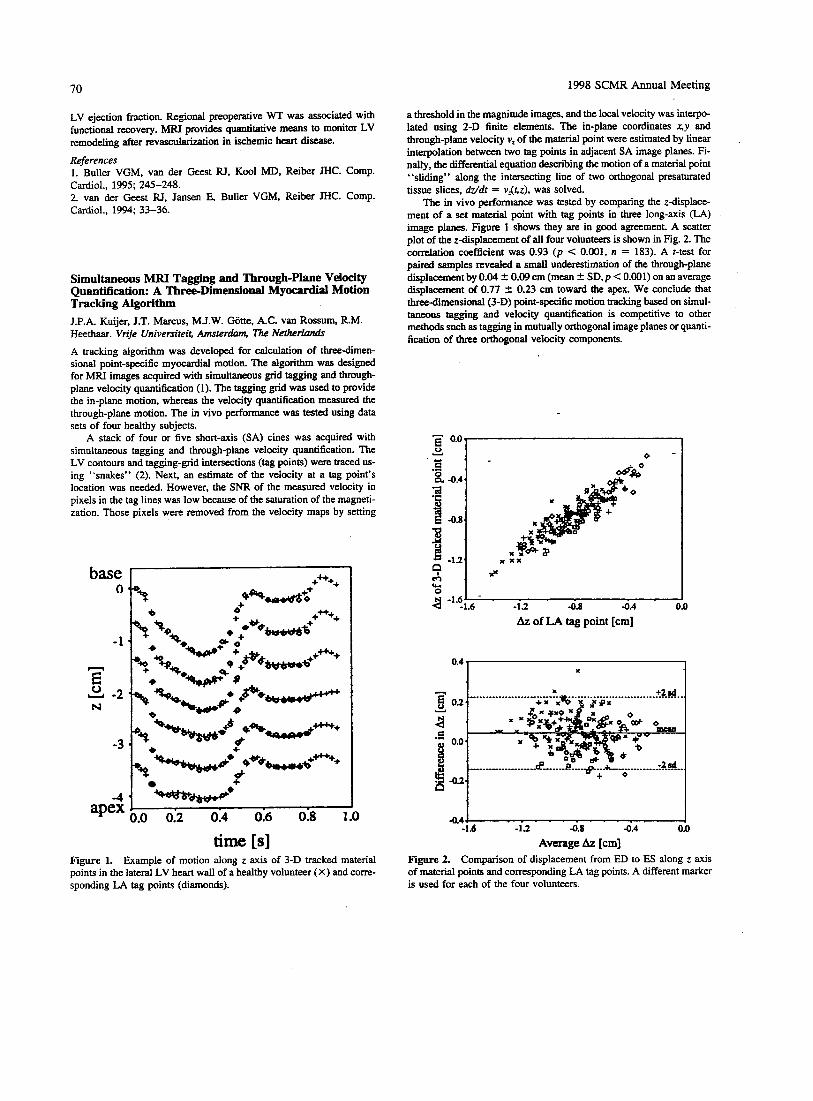
Simultaneous MRI Tagging and Through-Plane VeloCiQ Quantification: A Three-Dimensional Myocardial Motion Tracking Algorithm J.P.A. Kuijer, J.T. Marcus, M.J.W. Gotte, A.C. van Rossum, RM. Heethaar. Vrije Universiteit, Amsterdam Tke Netherlands
A tracking algorithm was developed for calculation of three-dimen- sional point-specific myocardial motion. The algorithm was designed for MRI images acquired with simultaneous grid tagging and through- plane velocity quantification (1). The tagging grid was used to provide the in-plane motion, whereas the velocity quantification measured the through-plane motion. The in vivo performance was tested using data sets of four healthy subjects.
A stack of four or five short-axis (SA) cines was acquired with simultaneous tagging and through-plane velocity quantification. The LV contours and tagging-grid intersections (tag points) were traced us- ing “snakes” (2). Next, an estimate of the velocity at a tag point’s location was needed. However, the SNR of the measured velocity in pixels in the tag lines was low because of the saturation of the magneti- zation. Those pixels were removed from the velocity maps by setting
I 0.0 0.2 0.4 0.6 0.8 1.0
time [s] Figure 1. Example of motion along z axis of 3-D tracked material points in the lateral LV heart wall of a healthy volunteer (X) and corre- sponding LA tag points (diamonds).
a threshold in the magnitude images, and the local velocity was interpo- lated using 2-D finite elements. The in-plane coordinates x,y and through-plane velocity v, of the material point were estimated by linear interpolation between two tag points in adjacent SA image planes. Fi- nally, the differential equation describing the motion of a material point “sliding” along the intersecting line of two orthogonal presaturated tissue slices, M d t = vr(r,z), was solved.
The in vivo performance was tested by comparing the z-displace- ment of a set material point with tag points in three long-axis (LA) image planes. Figure 1 shows they are in good agreement. A scatter plot of the z-displacement of all four volunteers is shown in Fig. 2. The correlation coefficient was 0.93 ( p < 0.001. n = 183). A r-test for paired samples revealed a small underestimation of the through-plane displacement by 0.04 2 0.09 cm (mean 2 SD,p < 0.001) on an average displacement of 0.77 2 0.23 cm toward the apex. We conclude that three-dimensional (3-D) point-specific motion tracking based on simul- taneous tagging and velocity quantification is competitive to other methods such as tagging in mutually orthogonal image planes or quanti- fication of three orthogonal velocity components.
- OD Y S ]
4 -1.6’ - . -1.6 -13 -0.a -0.4
Az of LA tag point [cm]
4 . 4 4 -1.6 -13 0 . 8 -0.4 0.0
Average Az [cm] Figure 2. Comparison of displacement from ED to ES along z axis of material points and corresponding LA tag points. A different marker is used for each of the four volunteers.
1998 SCMR Annual Meeting 71
References 1. Perman WH, Cresswell LL, Wyers SG, Moulton MJ, Pasque MK. JMRI, 1995; 5:lOl. 2. Young AA, Kraitchman DL, Dougherty L, Axel L. IEEE Trans. Med. h a g . , 1995; 14:413.
Image Artifact Correction in Real-Time Interactive MRI J.M. Pauly.’ A.B. Kerr,’ W.F. Block,’ C.H. Meyer,’ B.S. H u , ~ P h l Yang: D.G. Nishimura,’ A. Macovsky.’ Departments of ‘Electrical Engineering and ’Cardiovascular Medicine, Stmford University, Stanford CA
Real-time interactive magnetic resonance imaging (RTI-h4RI) will be an important component of cardiac MRI systems. Efficient k-space tra- jectories are required to image the heart continuously without gating. Two acquisition methods are spirals and EPI. Each has well-known characteristics with respect to flow and off-resonance. Spiral has better flow response but produces image blumng off-resonance. EPI is more tolerant to off-resonance but produces more flow artifacts. Here we con- sider another aspect of these sequences, implementation in an RTI-MRI system. The major issue is the reconstruction of high-fidelity images in the presence of eddy currents and gradient delays, which can differ on different axes. Correction must be performed continuously, follow- ing the interactive positioning of the scan plane. For EPI, gradient de- lays and eddy currents both produce image ghosts. Typically, these ef- fects are corrected using a calibration scan. This takes time and can be unreliable when a large part of the signal in the image is flowing blood. We take the approach of modeling these effects and then predicting and correcting them in acquisition and reconstruction. The corrections result in non-Cartesian EPI data, so we use a gridding reconstruction as we do for spirals. For spirals, most of these effects are relatively benign. Gradient delays primarily produce an image rotation. BO eddy currents produce an image shift. These effects can also be corrected in reconstruction, but the correction is much less critical. We use a spec- tral-spatial pulse for lipid suppression in both EPI and spirals. This uses an EPI k-space trajectory, so the concerns are similar to EPI acquisi- tions. The delay must be accurate, particularly when offsetting the slice. In addition, BO eddy currents can significantly degrade lipid suppres- sion for some types of spectral-spatial pulses. The corrections are the same as for EPI acquisition but are applied to the RF waveform. By applying these approaches, high-fidelity images can be continuously acquired and reconstructed at any scan plane orientation. This will be important for responsive RTI-MRI for cardiac applications.
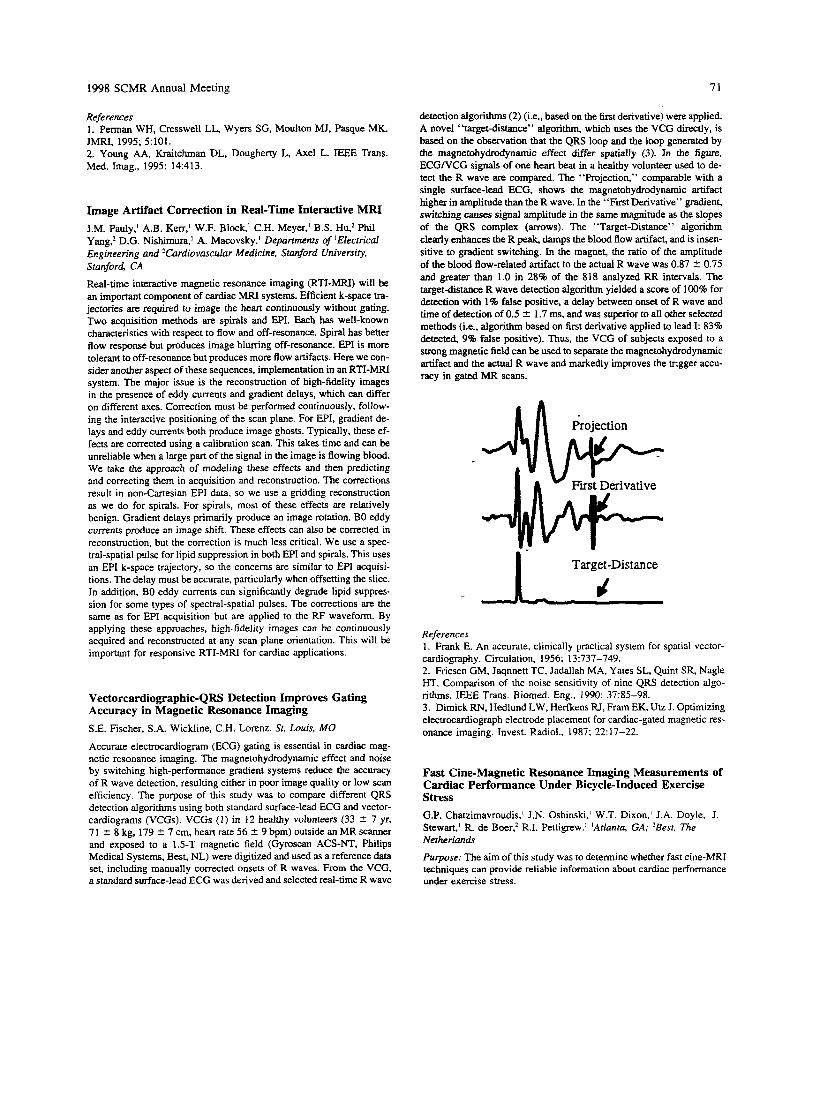
Vectorcardiographic-QRS Detection Improves Gating Accuracy in Magnetic Resonance Imaging S.E. Fischer, S.A. Wickline, C.H. Lorenz. St. Louis. MO Accurate electrocardiogram (ECG) gating is essential in cardiac mag- netic resonance imaging. The magnetohydrodynamic effect and noise by switching high-performance gradient systems reduce the accuracy of R wave detection, resulting either in poor image quality or low scan efficiency. The purpose of this study was to compare different QRS detection algorithms using both standard surface-lead ECG and vector- cardiograms (VCGs). VCGs (1) in 12 healthy volunteers (33 2 7 yr, 7 1 2 8 kg, 179 2 7 cm, heart rate 56 2 9 bpm) outside an MR scanner and exposed to a 1.5-T magnetic field (Gyroscan ACS-NT, Philips Medical Systems, Best, NL) were digitized and used as a reference data set, including manually corrected onsets of R waves. From the VCG, a standard surface-lead ECG was derived and selected real-time R wave
detection algorithms (2) (i.e., based on the first derivative) were applied. A novel “targetdistance” algorithm, which uses the VCG directly, is based on the observation that the QRS loop and the loop generated by the magnetohydrodynamic effect differ spatially (3). In the figure, ECGIVCG signals of one heart beat in a healthy volunteer used to de- tect the R wave are compared. The “Projection,” comparable with a single surface-lead ECG, shows the magnetohydrodynamic artifact higher in amplitude than the R wave. In the “First Derivative” gradient, switching causes signal amplitude in the same magnitude as the slopes of the QRS complex (arrows). The “Target-Distance” algorithm clearly enhances the R peak, damps the blood flow artifact, and is insen- sitive to gradient switching. In the magnet, the ratio of the amplitude of the blood flow-related artifact to the actual R wave was 0.87 -C 0.75 and greater than 1.0 in 28% of the 818 analyzed RR intervals. The targetdistance R wave detection algorithm yielded a score of 100% for detection with 1% false positive, a delay between onset of R wave and time of detection of 0.5 2 1.7 ms, and was superior to all other selected methods (i.e., algorithm based on first derivative applied to lead 1: 83% detected, 9% false positive). Thus, the VCG of subjects exposed to a strong magnetic field can be used to separate the magnetohydrodynamic artifact and the actual R wave and markedly improves the trigger accu- racy in gated MR scans.
Projection
Target-Distance
References 1. Frank E. An accurate, clinically practical system for spatial vector- cardiography. Circulation, 1956; 13:737-749. 2. Friesen GM, Jaqnnett TC, Jadallah MA, Yates SL, Quint SR, Nagle HT. Comparison of the noise sensitivity of nine QRS detection algo- rithms. IEEE Trans. Biomed. Eng., 1990; 37:85-98. 3. Dimick RN, Hedlund LW, Herfkens FU, Fram EK, Utz J. Optimizing electrocardiograph electrode placement for cardiac-gated magnetic res- onance imaging. Invest. Radiol., 1987; 22: 17-22.
Fast Cine-Magnetic Resonance Imaging Measurements of Cardiac Performance Under Bicycle-Induced Exercise Stress G.P. Chatzimavroudis,’ J.N. Oshinski,’ W.T. Dixon,’ J.A. Doyle,’ J. S t e w a l R. de Boer: R.I. Pettigrew.’ ‘Atlanta, GA; ’Best, The Netherlands
Purpose: The aim of this study was to determine whether fast cine-MRI techniques can provide reliable information about cardiac performance under exercise stress.

72 1998 SCMR Annual Meeting
Merhodr: We studied nine healthy volunteers with a 1.5-T Gyroscan NT Philips MRI scanner. An MRI-compatible cycle exgometer was used to induce exercise stress. The bicycle allowed the subjects to re- cline and pedal with the heart positioned near the isocenter of the mag- net. The pedaling resistance of the cycle ergometex was controlled by a workload programmer (Lode, Groningen, the Netherlands). In five subjects ( p u p A), a set of three breathhold turbo field echo (TFE) left ventricular (LV) short-axis images (TlUTE/a = 11/6/35) were ob- tained to determine the ejection fraction (EF) at rest with seven to nine phases per beat collected, depending on heart rate. In the remaining four subjects (group B), a set of three slices were obtained in the LV short axis using a multishot segmented k-space breathhold echo planar (EPI) sequence (TEla 14/20) with 9-11 k-space lines per excitation to determine the EF at rest The temporal resolution per slice in this case was 16-20 phasesheat Subjects began pedaling at a negligible resistance, and the workload was increased by 25 W every 3 min. The target stress heart rate was 65% of the maximum heart rate (dehed as 220 minus age) in group A and 6545% of the maximum heart rate in group B. When the target heart rate was met, the subjects were asked to stop pedaling and hold their breath, during which a 4- to 6-s TFE acquisition -/a = 11/6/35) with 5-7 phasesmeat was obtained for group A and a 3- to Csec EPI acquisition p a 14/20) with 11- 20 phasedbeat was obtained for group B to determine the EF at stress. The subjects resumed pedaling and repeated the breathhold scan two more times at the target heart rate for two more slice acquisitions.
Results and Discussion: The EF increased between rest and stress in both groups, from 54.5 to 6l'.8% in group A and from 58.8 to 71.1% in group B. The higher increase in EF observed in group B (EFT) com- pared with group A (TFE) is due to the fact that group B included cases with higher target heart rate (85% of the maximum heart rate) than group A. The quality of the EPI acquisitions was generally better than that of the TFE. Although TFE provided adequate image quality for EF calculations, it did not permit distinct visual i ion of regional wall motion abnormalities. On the other hand, EPI acquisitions were of bet- ter quality and permitted wall thickening calculations. Mean normal thickening range was 75-1004b in the septum, 76-15096 in the anterior wall, 120-198% in the lateral wall, and 106-19756 in the inferior wall.
Conclusion: Fast cine-MRI acquisitions can provide reliable infor- mation for evaluation of cardiac function under exercise stress. EPI seems preferable because of better image quality and higher temporal resolution.
Cardiac Magnetic Resonance with a Pacemaker In Situ: Can It Be Done? D.J. Pennell. London, UK There are five cases of pacemaker-related death during MRI, and they are considered an absolute contraindication. However, some cases have been reported with successful outcomes (1). We report here our experi- ence of five scans with the pacemaker programmed for noncapture. Pa- tient l suffered five VF arrests despite polytherapy. A diagnosis of sar- coidosis was suggested by MR and proved by a Kveim test, after insertion of a cardioverterdefibrillator. Patient 2 underwent a piggy- back heart transplant and now had dyspnea. Native heart function was poor by echo, but the donor heart could not be visualized. For MRI, gating was only possible to the native heart, which showed near absent function. A second MRI using EPI showed excellent donor heart func- tion but limited cardiac output because the heart was from a 5-year-old donor. Invasive tests for possible rejection were subsequently deferred. Patient 3 had complex congenital heart disease with an urgent clinical need to visualize the pulmonary valve, which had failed with echo. MRI was requested but was abandoned because the pacemaker switched into fixed-rate pacing at full voltage in the magnet. Patient 4 had marked
exenional dyspnea and a prosthetic aortic valve with clinical regurgita- tion, but none found on echo. MR showed a regurgitant fraction of 58% and poor valve opening requixing surgery. Therefore, a pacemaker is not an absolute contraindication to cardiac MRI but should only be performed in experienced centers with pacing facilities. Cardiac moni- toring during the scan is mandatory. Preparation of the patient should clearly include an overriding clinical need for more information, a posi- tive risk-benefit assessment, nonpacemaker dependency, informed written consent with wimesses, full resuscitation facilities at the scan- ner, experienced cardiology assistance during scanning, slow introduc- tion into the magnet with monitoring, and graded scanning sequences starting with single-slice. low-resolution and progressing. The follow- ing pacing variables should be considered: OOO mode if available, or VOO. with minimum voltage and pulse width settings, bipolar lead con- figuration, and testing with a magnet to ensure that the pacemaker does not revert to full output mode during MR. Considerably more work needs to be perfonned in this area, but successful MR is possible in selected clinical circumstances where important diagnostic information is required. Reference 1. Gmbel JR, Johnson D, Levine PA, Wilkoff BL. Safe performance of magnetic resonance imaging on five patients with permanent cardiac pacemakers. PACE, 1996; 19913-919.
Improvements in the Spatial and Temporal Resolution of Cardiac MRI Using the SMASH Imaging Technique D.K. Sodickson, P.M. Jakob, M.A. Griswold, R.R. Edelman. W.J. Manning. Boston, MA
Background: A number of important applications of cardiac MRI are often hindered by competing constraints of spatial and temporal resolu- tion. To resolve small structures such as the coronary arteries, high spatial resolutions are required, but the long acquisition times associ- ated with high-resolution scans can lead to blurring from cardiac and respiratory motion. Although motion compensation schemes such as cardiac gating, breathholding, and navigator gating can adjust to some extent for the effects of physiologic motion, a technique that allowed simultaneous improvements in spatial and temporal resolution would be of substantial benefit for both the efficiency and the quality of cardiac MRI studies.
Purpose: We present preliminary results of cardiac studies using the newly introduced SMASH imaging technique (1). SMASH (SiMul- taneous Acquisition of Spatial Harmonics) uses a partially parallel ac- quisition strategy in which multiple lines of k-space are effectively ac- quired at once, using combinations of signals from an RF coil array. This approach may be used to multiply the speed of conventional im- aging sequences without sacrificing spatial resolution.
Metho&.- SMASH was implemented in conjunction with standard cardiac imaging protocols in healthy adult volunteers, using prototype coil arrays on two commercial imaging systems. The SMASH acquisi- tions were used to reduce the acquisition windows of segmented k-space images and therefore to improve temporal resolution while maintaining constant spatial resolution and total imaging time; to increase spatial resolution at constant temporal resolution in a fixed acquisition time; and to reduce breathhold times for constant spatial and temporal resolu- tion.
Results: Image quality was preserved in the accelerated SMASH images compared with conventional reference images. Increased spatial and/or temporal resolution in the SMASH images allowed improved visualization of coronary arteries and other cardiac structures.
Conclusions: SMASH imaging may be used to increase the achiev- able spatial and/or temporal resolution in cardiac MR images. Although
1998 SCMR Annual Meeting
120
h
8 90-- 2 E ."
60 L
a' g 30 o n
73
0 X
-
; ; ,a x 02+HV
X X
d 6
+ X Q A v A
--
-- ! ; A g r A
two- and threefold improvements were demonstrated in these studies, the maximum achievable accelerations are expected to scale up with the number of array elements, and work is underway to develop the hardware necessary for substantially greater improvements in cardiac imaging.
Reference 1. Sodickson DK, Manning WJ. Simultaneous acquisition of spatial harmonics (SMASH): fast imaging with radiofrequency coil arrays. Magn. Reson. Med., 1997; 38591-603.
Conchiom: HV in combination with brief periods of O2 supple- mentation HV significantly prolongs BH duration, as measured by RHD MR nav. These data have potential significance for clinical imaging of the cardiovascular system and other applications in which sustained BH is required.
Reference 1. Danias PG, et al. Radiology, 1997; 203:733-736.
Breathhold Duration: Navigator Echo Assessment of Supplemental Oxygen and Hyperventilation P.G. Danias, K.V. Kissinger, M. Stuber, M.L. Chuang, R.M. Botnar, W.J. Mannine. Boston. MA
Pediatric Aortic Pathology: Magnetic Resonance and Radiographic Imaging K Ahrar, M.S. McLeary. Loma Linda, CA
I
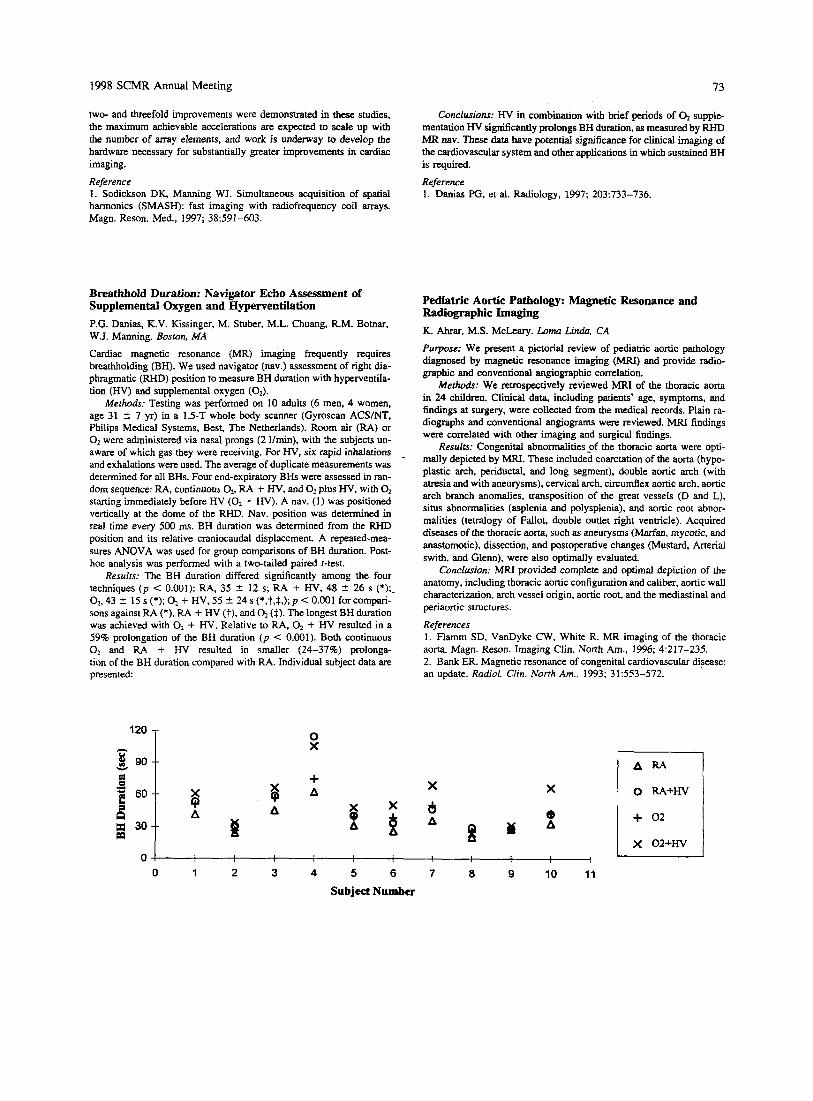
Cardiac magnetic resonance (MR) imaging frequently requires breathholding (BH). We used navigator (nav.) assessment of right dia- phragmatic (RHD) position to measure BH duration with hyperventila- tion (HV) and supplemental oxygen (0,).
Methods: Testing was performed on 10 adults (6 men, 4 women, age 31 f 7 yr) in a 1.5-T whole body scanner (Gyroscan ACS/NT, Philips Medical Systems, Besf The Netherlands). Room air (RA) or O2 were administered via nasal prongs (2 llmin), with the subjects un- aware of which gas they were receiving. For HV, six rapid inhalations and exhalations were used. The average of duplicate measurements was determined for all BHs. Four end-expiratory BHs were assessed in ran- dom sequence: RA, continuous Q, RA + H V , and O2 plus HV, with 0, starting immediately before HV (0, + HV). A nav. (1) was positioned vertically at the dome of the RHD. Nav. position was determined in real time every 500 ms. BH duration was determined from the RHD position and its relative craniocaudal displacement. A repeated-mea- sures ANOVA was used for group comparisons of BH duration. Post- hoc analysis was performed with a two-tailed paired t-test.
Resuits: The BH duration differed significantly among the four techniques (p < 0.001): RA, 35 5 12 s; RA + HV, 48 2 26 s (*);- 02. 43 5 15 s (*); O2 + HV, 55 5 24 s (*,?,$A p < 0.001 for compari- sons against RA (*), RA + HV (t), and O2 ($). The longest BH duration
Purpose: We present a pictorial review of pediatric aortic pathology diagnosed by magnetic resonance imaging (MRI) and provide radio- graphic and conventional angiographic correlation.
Merhodr: We retrospectively reviewed MRI of the thoracic aorta in 24 children. Clinical data, including patients' age, symptoms, and findings at surgery, were collected from the medical records. Plain ra- diographs and conventional angiograms were reviewed. MRI findings were correlated with other imaging and surgical findings.
Results: Congenital abnormalities-of the thoracic aorta were opti- mally depicted by MRI. These included coarctation of the aorta (hypo- plastic arch, periductal, and long segment), double aortic arch (with atresia and with aneurysms), cervical arch, circumflex aortic arch, aortic arch branch anomalies, transposition of the great vessels (D and L), situs abnormalities (asplenia and polysplenia), and aortic root abnor- malities (tetralogy of Fallot. double outlet right ventricle). Acquired diseases of the thoracic aorta, such as aneurysms (Marfan, mycotic, and anastomtic), dissection, and postoperative changes (Mustard, Arterial swith, and Glenn), were also optimally evaluated.
Conclusion: MRI provided complete and optimal depiction of the anatomy, including thoracic aortic configuration and caliber, aortic wall characterization, arch vessel origin, aortic root, and the mediastinal and periaortic structures.
was achieved with O2 + HV. Relative to RA, O2 + HV resulted in a 59% prolongation of the BH duration (p < 0.001). Both continuous O2 and RA + HV resulted in smaller (24-37%) prolongs- aorta. Magn. Reson. Imaging Clin. North Am., 1996; 4:217-235. tion of the BH duration compared with RA. Individual subject data are presented:
References 1. Ramm SD, VanDyke CW, White R. MR imaging of the thoracic
2. Bank ER. Magnetic resonance of congenital cardiovascular disease: an update. Radiol. Clin. North Am., 1993; 31:553-572.
74 1998 SCMR Annual Meeting
Assessment of Coronary Bypass Graft Patency by Conventional Magnetic Resonance Imaging Techniques F. Cameras. G. Pons-Llad6, X Bo&, J. Llauger, J. Palmer, A. Bay& de Luna. Barcelona, Spain
The purpose of the present study was to assess the usefulness of conven- tional widely available magnetic resonance imaging 0 sequences in the detection of patency of coronary bypass grafts. A series of 25 consecutive patients were studied accounting for a total of 64 grafts: 19 of the left internal mammary artery (MA) and 45 of saphenous vein, 13 to the left anterior descending (LAD) c o r o m artery or one of its branches, 14 to the left circumflex (LCx) or one of its branches, and 18 to the right coronary artery (RCA). AU patients were submitted to diagnostic invasive angiography, MRI studies being performed within 1 week of the catheterization. ECG-gated T1 spinecho and gradient- echo techniques were practiced on axial and sagittal thoracic planes. The number and type of grafts were known by the. observer performing MRI studies, the diagnosis of patency being made when a flow signal was detected at a location where a graft was known to be present and at least on two contiguous imaging slices in any of the studied planes. Results showed that 63 of 64 grafts could be successfully catheterized, 48 (76%) being patent, although 10 of them (20%) had a significant obstructive lesion (>70% stenosis). MRI studies were deemed as tech- nically adequate in all cases to establish graft patency or occlusion in at least one of the imaging planes. The global diagnostic accuracy of MRI for the assessment of graft patency was 90%. the figures corre- sponding to particular grafts d follows: IMA 90% LAD 922, LCx 9370, RCA 89%. The predictive value of MRI for graft patency was 98% and for graft occlusion, 74%. The presence of graft stenosis was not detected by MRI, a signal of graft patency being observed in all but one of the stenosed vessels. Axial spin-echo was the sequence that more frequently allowed the visualization of IMA and RCA grafts; for grafts to the LAD and LCx. both sagittal spin-echo and gradient-echo were equally useful. Artifacts due to surgical clips were particularly apparent in gradient-echo sequences, not infrequently preventing an ad- equate visualization of the flow signal of the vessel. In conclusion, con- ventional MRI spin-echo sequences on axial and sagittal thoracic planes are adequate to establish patency of IMA and venous coronary artery bypass grafts with a high degree of accuracy, although the presence of obstructive vessel lesions is not detected by this technique.
Early MRI Evaluation of Marfan Syndrome: Study of Thoracic Aorta and Dural Ectasia R. Fattor, E. Negrini, F. Celletti, P. Ambrosetto, G. Pepe,' G. Gensini, B. Descovich, G. Gavelli, Instime of Radiology and Neurology, University of Bologna, Italy; 'Institute of Internal Medicine, University of Florence, Italy
The diagnosis of Marfan syndrome is codified on the basis of clinical criteria, first presented in 3986. Over time, weakness has emerged in these criteria because of the wide phenotypic expression of the disease and of some overlaps with other connective tissue disorders. Dural ecta- sia (DE) constitutes one of five major criteria (1,2), but few studies analyzed its real incidence and time of appearance in Marfan patients (MP). The purpose of this study was to estimate the incidence of DE in MP. Furthermore, in an attempt to individualize the precocity of this sign, the presence of DE has been correlated to aortic dilation.
Methods: MRI of the thoracic aorta and neural canal was performed in 31 MP who fulfilled the diagnostic criteria (18 males and 13 females, 6-44 yr old). Thirty patients (17 males and 13 females, 25-39 yr old) underwent MRI study of the lumbar spine as the control group.
Results: Among MP, 9 were already undergoing ascending aorta and/or aortic arch replacement, 10 presented severe ascending aorta dilation, 6 moderate ascending aorta dilation, and 3 mild ascending
aorta dilation. Three patients presented normal aortic diameter. All pa- tients presented DE; the most severe alterations (meningocele) were observed in the 2 oldest patients.
Conclusions: An incidence of 100% of DE and of 90.3% of aortic dilation was found in MP, suggesting that in the previous study, the incidence of DE might have been underestimated. Furthermore, DE might appear before aortic dilation, and no correlation has been found between the severity of these two diagnostic criteria.
References 1. Stem WE. Dural ectasia and the Marfan syndrome. J. Neumurg.,
2. Pyeritz RE. Dural ectasia is a common feature of the Marfan syn- drome. Am. J. Hum. Genet., 1988; 43:726-732.
1988; 69221-227.
MRT Monitoring of Traumatic Aortic Rupture: Evolution of the Aortic Lesion in the Subacute Phase R Fattori, F. Celletti, B. Descovich, G. Napoli, P. Bertaccini, A. Pierangeli, G. Gavelli. Instifute of Radiology and Cardiac Surgery, Universiry of Bologna, I d y , Objectives: Recent surgical series documented that in traumatic aortic rupture, a surgical repair postponed until after treatment of associated lesions reduces operative and overall mortality (1). Nevertheless, some isolated cases may evolve to free rilpture (2). The aim of this study was to analyze the behavior of traumatic aortic ruptures in the subacute phase to detect the morphological characteristics of unstable posttrau- matic aneurysms.
Methoak: Twenty-seven consecutive patients affecied by traumatic aortic rupture (1 intimal hemorrhage, 21 partial lesions, and 5 circum- ferential lesions) were admitted to the department of Cardiac Surgery. MRI was the imaging modality used to confirm the diagnosis (3). No one was operated in the acute phase. Delayed surgery was carried out in 20 patients at 243 2 127 days, after the resolution of associated lesions. A scheduled MRI follow-up was performed at 7, 15, and 30 days and immediately before the operation. The parameters exami'ned were increase of posttraumatic aneurysm, increase of periaortic hema- toma, and modification of the thoracic-associated lesions.
Results: At 30 days, a 3.0 2 3.7-mm median increase of the aneu- rysm was observed, whereas in the subsequent period the lesion was substantially stable, resulting in a 4.4 t 3.6-mm increment at the end of the follow-up. The circumferential lesions presented a higher incre- ment with respect to the partial lesions. In three cases, an augmentation of 6.7, and 12 mm was detected, and surgical repair was anticipated. In 13 cases, a periadventitial hematoma surrounding the aortic aneurysm decreased through the time. One case of intimal hemorrhage healed spontaneously, with no aneurysm formation.
Conclusions: Despite the common knowledge considering trau- matic aortic rupture highly evolutive in the acute and subacute phase (4). this study demonstrated that this pathological entity is relatively stable if a proper pharmacological treatment is administrated. MRI fol- low-up is recommended to detect isolated cases of unstable aneurysm.
References 1. Stulz P, Reimond MA, Bertschmann W, Graedel E. Decision-mak- ing aspects in the timing of surgical intervention in aortic rupture. Eur. J. Cardiothorac. Surg., 1991; 5:623-627. 2. Pate JW, Fabian.TC, Walker W. Traumatic rupture of the aortic isthmus: an emergency? World J. Surg., 1995; 19:119-126. 3. Fattori R, Celleni F, Bertaccini P, Galli R, Pacini D, Pierangeli A, Gavelli G. Delayed surgery of traumatic aortic rupture: role of magnetic resonance imaging. Circulation, 1996; 942865-2870. 4. Duhaylongsod FG, Glower DD, Wolfe WW. Acute traumatic aortic aneurysm: the Duke experience from 1970 to 1990. J. Vasc. Surg., 1992; 15~331-343.
1998 SCMR Annual Meeting 75
n A C Assessment of Patency of Aortocoronary Grafts by Magnetic Resonance in Cabrol's Operation of Aorta L.J. Jimknez-Borreguero. I. Mati, J. Pereira, M. Mateos, I. Dago, J. Shchez. Madrid Spain
Cabrol's operation entails implantation of a valved prosthetic tube in the ascending aorta and the reconnection of coronary arteries via syn- thetic grafts in which occlusion is a serious complication. The purpose of this study was to evaluate the use of MRI for noninvasive diagnosis of occlusion of coronary grafts. Eight male patients were studied 45.2 & 35.5 months after Cabrol's operation, with a total of 16 coronary grafts, for aortic dilatation without previous coronary disease. MRI was performed on a 0.5-T system using a spinecho sequence (TE 40 ms, NEX 2, FOV 40 cm) with multiple 5-mm-thick contiguous cuts, parallel to the aortic prosthesis' plane and obtained in diastole. The MRI studies were evaluated by two observers who were unaware of the patients' clinical or investigative status. In four patients with clinical suspicion of graft occlusion, catheterization had already been performed, three of them 1.5 2 3.0 months previously and the other 45 months previously. The remaining four patients, without symptoms or findings suggestive of ischemic cardiopathy, were not studied invasively. The branches of the coronary grafts were considered to be patent when, in the expected position, an image signal void was identified in at least three successive tomographic cuts below the origin of the graft. They were interpreted as occluded when these criteria were not fulfilled.
Resulrs: The mechanical aortic prosthesis did not prevent interpreta- tion of the MRI images. MRI s td ies indicated occlusion of four grafts (three right and one left) and patency of the remaining eight grafts (four patients). These MRI findings coincided with those of catheterization for all eight grafts. In the remaining four patients, who showed no clini- cal evidence of myocardial ischemia, all grafts were found to be patent by MRI.
Conclusion: Initial experience indicates that MRI is a useful tech- nique for assessment of the patency of coronary artery grafts of Cabrol's operation.
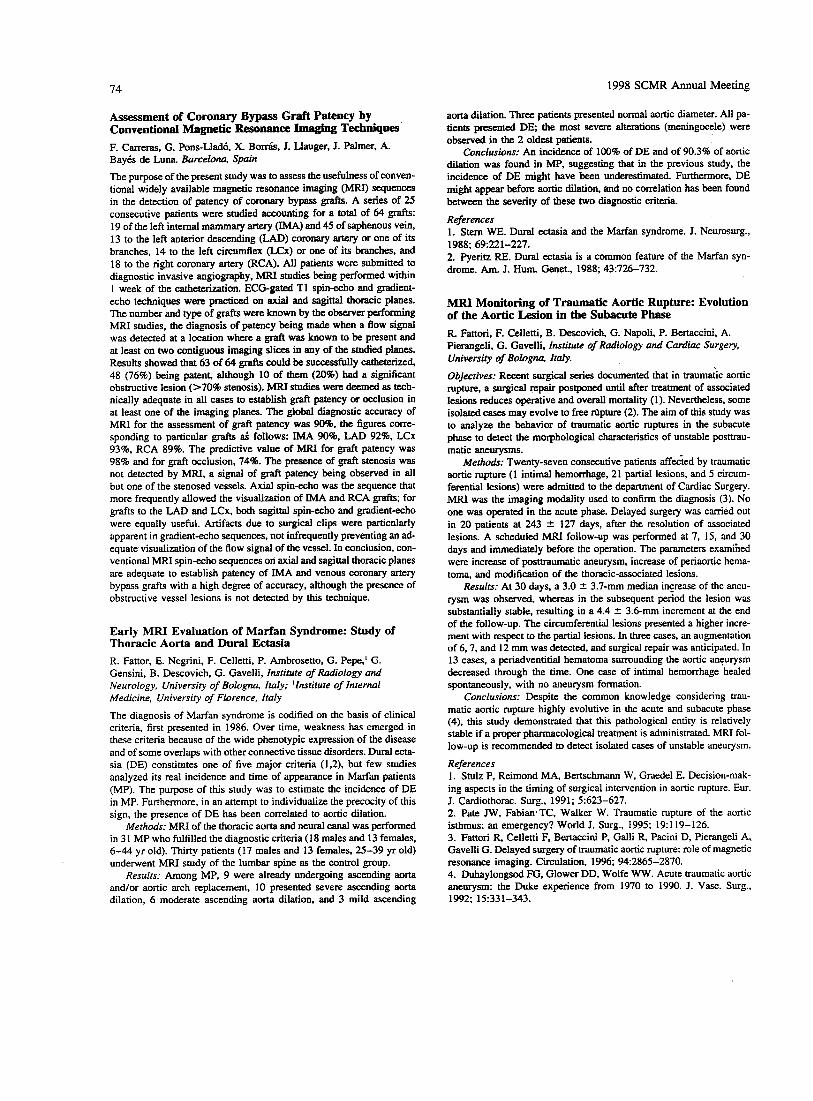
How Does T1 Reduction in Blood Affect Contrast- Enhanced Magnetic Resonance Coronary Angiography? L.O. Johansson, M.B.M. Hofman, S.E. Fischer, S.A. Wickline, C.H. Lorenz. Sf. Louis. MO Contrast agents have proven to improve magnetic resonance (MR) angi- ography of the abdominal and peripheral arteries. The imaging tech- niques for these anatomies usually use a steady-state acquisition, and the relationship between T1 in blood and the MR signal is well known. However, in ECG triggered angiography with limited acquisition win- dows, this relationship is more complex. Therefore, the purpose of this work was to study the relationship between the T1 in blood and the MR signal in 3D-magnetic resonance coronary angiography (3D- MRCA). In steady-state imaging, the maximum signal is achieved at the Ernst angle. The signal can be written as S = sina( 1 - e--')/[I - ~osa(e-"~ ' ) ] . In a triggered situation, as in 3D-MRCA. relaxation will occur between the excitation windows. To use the additional mag- netization, a flip-angle sweep is applied to maintain a constant maximal signal. The MR signal can be written as S(n) = [Mz(n - l)](e--') [cosa(n - l)] + (1 - e-TR"'')(M~)[sinaa(n)], where n = the number of excitations. Mz(n = 1 ) will depend on the heart rate because this determines the time for relaxation between the acquisition windows. In 3D-MRCA with targeted 3D volumes we can assume, however, that Mz( 1) = Mo because fresh blood has entered the volume between the acquisition windows. This means that the Mz is larger for blood than for static tissues. The M R signal for steady-state and triggered acquisi- tion with and without flow was calculated as a function of T1.
Y.7.J
0.4 4, Trig- fh
Trig- M) ROW 0.15 - 0.1
0.05 I
0 200 400 600 800 1000 1200
T1 (mn) Figure. Relative MR signal as a function of different Tl's for steady- state and triggered acquisitions without flow and with flow.
These simulations indicate that to use a contrast agent for 3D- MRCA, T1 should be below 200 ms to have any visible effect on the MR signal in a triggered acquisition with flow, whereas the same change in steady-state acquisition would increase the MR signal from blood by approximately 260%. To increase the M R signal by 50% in a triggered acquisition with flow, the T1 should change from 1,200 ms to approximately 50 ms. In conclusion, the effect of TI shortening in contrast-enhanced 3D-MRCA differs substantially from conventional contrast-enhanced MR angiography, because the triggered acquisition allows unsaturated blood to enter the volume between the acquisitions, thereby giving a muchhigher signal at long Tl's than steady-state ac- quisition.
An Algorithm for Automatic Tracking and Measurement of Coronary Arteries in 3D MR Datasets T.P. Kenvin, M.B.M. Hofman, S.E. Fischer, L.O.M. Johansson, C.H. Lorenz. St. Louis, MO An algorithm is described that automatically tracks the coronary arteries and measures their cross-sectional area as a function of distance along the vessel. The algorithm proceeds by iteratively reformatting the vol- ume at different angles and finding the view that points in the direction of the vessel's path through the volume. Once the user has defined a view where a vessel of interest is roughly centered, the x and y axis rotation angles are passed as parameters to a genetic optimization rou- tine (PGAPack David Levine. Argonne National Laboratory), which finds the optimal cross-section, perpendicular to the vessel's path through the volume. The fitness function used for optimization is the distance traversed in the positive and negative z direction without leav- ing the vessel. Reformatted images are created in the local x-y, z-y, and x-z planes, and a simple segmentation algorithm determines the cross-sectional area. Then a step is taken in the local z direction (perpen- dicular to the cross-sectional view), and the optimization procedure is repeated. This continues until the end of the vessel is reached or the view steps out of the volume. The output of the algorithm is a graph of cross-sectional area versus distance along the path of the vessel and a series of reformatted images from three perpendicular views at each step along the vessel, which can be concatenated into a movie. The algorithm requires less than a minute of user time (to find the vessels in the volume), after which its operation is completely automatic. Opti- mization of the cross-sectional view at each step takes about 30 s on a 200-MHz Pentium-running Linux.
76 1998 SCMR Annual Meeting
20". coronal slab 30-45 nun, 20-30 partitions) was used for the MRA study. Contrast injection was performed by means of automatic bolus injections with a MRcompatible power injector. Qualitative image analysis was performed by consensus of two blinded radiologists. Source images and maximum intensity projections were assessed to- gether for image quality.
Results: Of the 25 patients examined, 10 examinations were graded excellent, 9 were rated as good. 4 as moderate and diagnostically suffi- cient, and 2 as nondiagnostic. All patients unduwent minimally inva- sive coronary artery bypass grafting within 3 days, and the left internal mammarian artery could be used for bypass grafting in all cases.
Conclusion: 3D CE MRA can sufficiently depict the left internal mammarian artery and is a very useful noninvasive technique for preop- erative and possibly postoperative workup of patients with coronary disease of the LAD scheduled for MICABG and could be also useful in conventional bypass surgery.
Two-Dimensional Breathhold Coronary Magnetic Resonance Angiography M.G. Lentschig, A. Brinkmann, P. Reimer, S. Kerber, B. Tombach. E. Rummeny. Muenster, Germany
Purpose: We assessed image quality and diagnostic value of breathhold Frame from output movie.
User interface.
Contrast-Enhanced Magnetic Resonance Angiography of the Internal Mamman 'an Arteries: Preoperative Assessment Before Minimally Invasive Coronary Artery Bypass Grafting (MICABG) M.G. Lentschig, P. Reimer, A. Hoffmeier, R. Soeparwata, E. Rummeny, H. Scheld. Muenster, Germany
Purpose: The purpose of our study was to evaluate the value of 3D CE MRA in the preoperative assessment of the internal mammarian arteries before MICABG.
Methods: Twenty-five patients underwent breathhold 3D CE MRA at 1.5 T (Magnetom Vision, Siemens AG, Germany). To evaluate the individual contrast transit time, a test bolus of 1 ml Gd (Magnevist, Schering AG, Berlin. Germany) was injected intravenously and a Turbo-FLASH sequence (TR 8.5 ms, TE 4.0 ms, TI 100 ms, TD 84 ms, a loo) was used. A 3D FISP sequence (TR 7.3 ms. TE 2.8 ms, a
2D MRA in normal volunteers and patients with coronary vessel dis- ease.
Methods: Ten healthy volunteers and 20 patients with suspected ischemic heart disease and elective cardiac catheterization underwent breathhold 2D coronary MRA. Coronary MRA was performed with a fat-suppressed electrocardiographically gated breathhold gradient echo sequence (TR 800 ms, TE 7.4 ms, TD 300 ms, slice thickness 5 mm, FOV 280 6/8, matrix 154 X 256) with k-space segmentation at 1.0 T (Magnetom Expert, Siemens AG, Erlangen, Germany). Three indepen- dent readers evaluated the coronary MRAs. Visible vessel length and presence of stenoses were evaluated. Image quality was classified as good, medium, or poor.
Results: The length of the visible coronary artery segments was variable: good quality, RCA 3.55 cm 2 1.75, LCA 1.35 cm t 0.82, LAD 2.82 cm 2 1.48, LCX 1.10 cm 2 0.65; medium quality, RCA 5.07 t 1.61 cm, LCA 1.73 2 0.53 cm, LAD 3.92 2 1.15 cm, LCX 1.97 2 0.90 cm. The sensitivity of coronary MRA for detection of coronary stenoses varied between 76% for the RCA and 30% for the LCX. Insuf- ficient breathholding was the main reason for poor image quality (up to 45%).
Conclusion: Breathhold 2D coronary MRA can depict up to 76% of hemodynamically significant stenoses in the proximal parts of the coronary arterial tree. Best image quality was found for the RCA and the LAD, whereas the LCX had the worst quality. Image quality was disturbed by insufficient breathholding, ghost artifacts, and incomplete fat suppression. Diagnostic problems were caused by incomplete differ- entiation of the coronary arteries from veins and from the pericardial sac.
Magnetic Resonance Coronary Angiography Using Prospective Navigator Echo-Based Slice Following J.N. Oshinski,' W.T. Dixon,' P. Salverda.' L. Hofland,' R.I. Pettigrew.' 'Atlanta. GA; IBest, The Netherlands
Purpose and Methods: Navigator echo-gated MR coronary angiography allows a subject to breathe freely during image acquisition by obtaining data during only a portion of the respiratory cycle. The gate window determines the amount of the respiratory cycle used for imaging. Use
1998 SCMR Annual Meeting 77
of a large gating window causes residual motion artifacts, and use of a small gating window prolongs scan times. We implemented a pro- spective slice-following technique that uses the navigator echo-derived respiratory position of the heart to update the slice excitation position in real time. The effect is to excite the Same anatomical location of the heart despite respiratory movement of the coronary artery. To assess the effectiveness and potential clinical utility of the technique, we con- ducted studies on a coronary artery model, on volunteers, and on pa- tients with coronary artery disease.
Results: The slice-following technique was compared with simple navigator echo-gating using gating windows from 1 to 6 mm in a model of a 70% coronary artery stenosis that was undergoing 10 mrn of respi- ratory motion. The slice-following technique reduced blurring and im- proved visualization of the stenosis geometry as assessed by accurate depiction of stenosis severity. The model studies indicated that a gating window of 4-5 mm with slice following produced image quality equiv- alent to a simple gating window of 2 mm. Applying the prospective slice-following technique using a 5-mm window in 10 volunteers in- creased the gating efficiency (the percent of cardiac cycle accepted) from 29% to 63% as compared with a simple gating window of 2 mm. MR imaging was successful in 9 of 10 patients with coronary artery disease who had also undergone cardiac catheterization and x-ray angi- ography. In three patients with significnat lesions, MR correctly identi- fied an abnormality.
Conclusion: Prospective navigator echo-based slice following im- proves scan efficiency while preserving image quality. Preliminary re- sults suggest this technique shduld enhance the clinical utility of MR coronary angiography.
Correlation of Atherosclerotic Plaque by Magnetic Resonance Imaging and Clinical Presentation of Patients With Obstruction of the Carotid Artery Ibraim Pinto, Ricardo Pavanello, Rodrigo Barretto, Simone Barretto, Maria H. Abib, Enilton Egito, Amanda Sousa, J. Eduardo Sousa, Luiz C.B. Souza. Hospital do Corapio, ASS, SZo Paulo, SP, Brazil
Magnetic resonance imaging (MRI) has high spatial and contrast reso- lution. Some studies suggested that it might identify the main compo- nents of atherosclerotic plaques (AP), but there is little information re- garding a possible correlation of such findings at MFU and the clinical presentation of patients with carotid artery obstruction. The goal of this study was to evaluate the actual value of MRI in the analysis of AP. For such purpose, we selected 50 patients with carotid artery stenosis undertaken to MRI. Spin-echo series with high resolution, acquired with a surface coil, identified AP components according to the signal intensity so that lipids were light gray, calcium was very dark, fresh thrombus was bright, and fibrotic tissue was dark gray. Through the same acquisitions, we defined the artery reference diameter (RD), mini- mum lumen diameter (MLD), percent stenosis, and maximum wall thickness. We included 50 patients in this study, 38 male, all with a Doppler ultrasound study indicating the presence of a severe carotid stenosis. The mean RD was 8.4 2 3.9 mm. the mean MLD 1.7 IT 0.7 mm, and the percent stenosis 78 ir 9% and measured the maximum wall thickness as 7.2 t- 3.5 mm. MRI identified lipids as the main com- ponent of AP in 24 patients, fibrotic tissue in 19, and calcified plaques in 7. It also identified fresh thrombus in 12 patients. Of the 12 patients with signs of fresh thrombus in the carotid lesion, 9 had a history of a recent cerebrovascular accident, whereas the 26 patients with either fibrosis or calcium as the main AP component had a history of carotid murmur but no history of recent cerebrovascular accidents. All patients underwent surgery. The AP was excised during surgery and undertaken
to pathological study. The MRI results correlated well to the pathologi- cal evaluation, but MRI did notidentify calcium in four lesions where it was present. It correctly evaluated the existence of fresh thrombus. Quantitative analysis of the AP by pathology also confirmed the dimen- sions measured by h4RL We conclude that MRI may perform a detailed in-depth analysis of AP, estimating its composition, that correlates well to the clinical presentation of the patients and to the pathological findings.
References 1 . Toussaint JF, Southern JF, Fuster V, et al. T2 Contrast for NMR characterization of human atherosclerosis. Arterioscler. Thromb. Vasc. Biol., 1995; 151533-1542. 2. Toussaint JF, Southern IF, Fuster V, et al. Diffusion properties of human atherosclerosis and thrombosis measured by pulse field gradient NMFL Arterioscler. Thromb. Vasc. Biol., 1997; 17:542-546.
Early Diagnostic of Rupture of the Descending Aorta by Magnetic Resonance Imaging Rodrigo Barretto, S h o n e Barretto, Ricardo Pavanello, J. Eduardo Sousa, Amanda Sousa, Enilton Egjto, Edson Romano, Leopoldo Piegas, Ibraim Pinto, Luiz C.B. Souza Hospital do Corapio. ASS, SCo Paulo, SP, Brazil
There is controversy regarding the optimal therapy for patients with type B aortic dissection (AoD). One factor that may precipitate surgery for this population is the presence of aortic rupture. Sometimes though, this may represent a serious diagnostic challenge. Magnetic resonance imaging (MRI) has potential to be used in this set, but its utility early after the clinical suspicion is controversial. The aim of this study was to evaluate the utility of MRI as a diagnostic tool for evaluating patients with type B AoD. From 02/92 to 05/97, 120 patients with suspected type B AoD underwent MRI in a 1.5-T superconducting magnet. The scan included spin-echo images to evaluate anatomy, cine-MRI, and angio-MRI to evaluate blood flow. Blood in the thoracic cavity and suggestion of aorta rupture by cine- and angio-MRI defined aortic rup- ture. The diagnosis was confirmed in 90 patients, 42 within the first 48 hr and 48 within the first 72 hr after symptoms onset. There were 63 men, and their mean age was 63 2 38 yr. The mean aortic diameter was 56 2 42 mm (range, 42-130 mm); there was flow to the false lumen in 58, whereas some degree of thrombosis was present in the false lumen of 32 patients. MRI revealed hemothorax in 38 patients. The point of aortic rupture was near the left subclavian artery.in 12. in the middescending aorta in 9, and near the thoracic-abdominal transi- tion in 17. All patients underwent computed tomography that did not suggest the location of the point of rupture in 18 of 38 patients. Surgery was done in 32 patients with suspected aortic rupture and confirmed the presence of hemothorax in all the cases and pointed out aortic rupture in the 32 patients in whom MRI suggested the diagnosis. Of the six not taken to surgery, four died 12-20 hours after MRI and two were kept under clinical treatment and were discharged alive. We conclude that MRI is capable of accomplishing a precise diagnosis of type B AoD and correctly identifying the presence of blood in the thoracic cavity and the point of rupture. This may prove to be a useful tool to evaluate and plan the treatment of patients with suspected AoD.
References 1. Neubauer CA, Spielmann RP, von Rodolish Y, et al. Diagnosis of thoracic aortic dissection: Magnetic resonance imaging versus trans- esophageal echocardiography. Circulation, 1992; 85:434-447. 2. Kouchoukos NT, Dougenis D. Surgery of the thoracic aorta. N. Engl. J. Med., 1997; 336(26):1876-1888.
78 1998 SCMR Annual Meeting
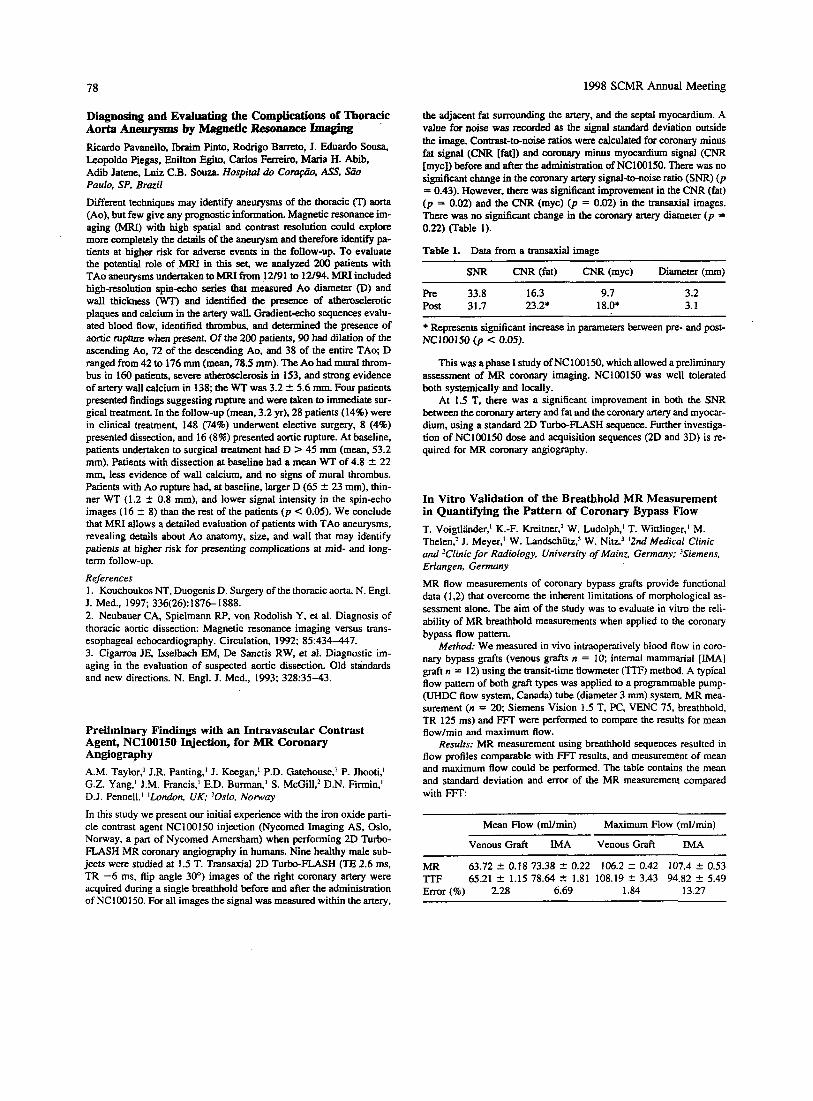
Diagnosing and Evaluating the Complications of Thoracic Aorta Aneurysms by Magnetic Resonance Imaging Ricardo Pavanello, lbraim Pinto, Rodrigo Barreto, J. Eduardo SOU= Leopoldo Piegas, Enilton Egito, Carlos FerreirO, Maria H. Abib, Adib Jatene, Luiz C.B. Souza Hospital do Cora@, MS. S6o Paulo, SP, Brazil
Different techniques may identify aneurysms of the thoracic (T) aorta (Ao), but few give any prognostic information. Magnetic resonance im- aging (MRI) with high spatial and contrast resolution could explore more completely the details of the aneurysm and therefore identify pa- tients at higher risk for adverse events in the follow-up. TO evaluate the potential role of MRI in this set, we analyzed 2.00 patients with TAo aneurysms undertaken to MRI from 12/91 to 12/94. included high-resolution spin-echo series that measured A0 diameter (D) and wall thickness (WT) and identified the presence of atherosclerotic plaques and calcium in the artery wall. Gradient-echo sequences evalu- ated blood flow, identified thrombus, and determined the presence of aortic rupture when present. Of the 200 patients, 90 had dilation of the ascending Ao, 72 of the descending Ao, and 38 of the entire TAo; D ranged from 42 to 176 mm (mean, 78.5 mm). The A0 had m u d throm- bus in 160 patients, severe atherosclerosis in 153, and strong evidence of artery wall calcium in 138; the WT was 3.2 2 5.6 mm. Four patients presented findings suggesting rupture and were taken to immediate sur- gical treatment In the follow-up (mean, 3.2 yr), 28 patients (14%) were in clinical treatment, 148 (74%) underwent elective surgery, 8 (4%) presented dissection, and 16 (8%) presented aortic rupture. At baseline, patients undertaken to surgical treatment had D > 45 mm (mean, 53.2 mm). Patients with dissection at baseline had a mean WT of 4.8 2 22 mm, less evidence of wall calcium, and no signs of mural thrombus. Patients with Ao rupture had, at baseline, larger D (65 2 23 mm), thin- ner WT (1.2 -C 0.8 mm), and lower signal intensity in the spin-echo images (16 2 8) than the rest of the patients (p < 0.05). We conclude that MRI allows a detailed evaluation of patients with TAo aneurysms, revealing details about Ao anatomy, size, and wall that may identify patients at higher risk for presenting complications at mid- and long- term follow-up. References 1. Kouchoukos NT, Duogenis D. Surgery of the thoracic aorta. N. Engl. J. Med., 1997; 336(26):1876-1888. 2. Neubauer CA, Spielmann RP, von Rodolish Y, et al. Diagnosis of thoracic aortic dissection: Magnetic resonance imaging versus trans- esophageal echocardiography. Circulation, 1992; 85:434-447. 3. Cigarroa JE. Isselbach EM, De Sanctis RW, et al. Diagnostic im- aging in the evaluation of suspected aortic dissection. Old standards and new directions. N. Engl. J. Med., 1993; 328:35-43.
Preliminary Findings with an Intravascular Contrast Agent, NC100150 Injection, for MR Coronary Angiograph y A.M. Taylor,' J.R. Panting,] J. Keegan,' P.D. Gatehouse,! P. Jhooti,' G.Z. Yang,l J.M. Francis,l E.D. Burman,' S. McGill.2 D.N. Firmin,' D.J. Pennell.' 'London, UK; 'Oslo. Norway
In this study we present our initial experience with the iron oxide parti- cle contrast agent NC100150 injection (Nycomed Imaging AS, Oslo, Norway, a part of Nycomed Amersham) when performing 2D Turbo- FLASH MR coronary angiography in humans. Nine healthy male sub- jects were studied at 1.5 T. Transaxial 2D TurbFLASH (TE 2.6 ms, TR -6 ms, flip angle 30") images of the right coronary artery were acquired during a single breathhold before and after the administration of NClOO150. For all images the signal was measured within the artery,
the adjacent fat surrounding the artery, and the septal myocardium. A value for noise was recorded as the signal standard deviation outside the image. Contrast-to-noise ratios were calculated for coronary minus fat signal (CNR [fat]) and coronary minus myocardium signal (CNR [myc]) Wore and after the administration of NC100150. There was no significant change in the coronary artery signal-to-noise ratio (SNR) (p = 0.43). However. there was significant improvement in the CNR (fat) (p = 0.02) and the CNR (myc) (p = 0.02) in the transaxial images. There was no significant change in the coronary artery diameter (p = 0.22) (Table 1).
Table 1. Data from a transaxial image
S N R CNR (fat) CNR (myc) Diameter (mm) ~ ~~~
Pre 33.8 16.3 9.1 3.2 Post 31.7 23.2* 18.0* 3.1
* Represents significant increase in parameters between pre- and post- NC100150 (p < 0.05).
This was a phase I study of NClOO150. which allowed a preliminary assessment of MR coronary imaging. NC100150 was well tolerated both systemically and locally.
At 1.5 T, there was a significant improvement in both the SNR between the coronary artery and fat and the coronary artery and myocar- dium. using a standard 2D Turbo-FLASH sequence. Further investiga- tion of NC100150 dose and acquisition sequences (2D and 3D) is re- quired for MR coronary angiography.
In Vitro Validation of the Breathhold MR Measurement in Quantifying the Pattern of Coronary Bypass Flow T. Voigtlinder,' K.-F. Kreitner.2 W. Ludolph.' T. Wittlinger,' M. Thelen,' J. Meyer,' W. bdschiitz," W. Nitz.' '2nd Medical Clinic and 'Clinic for RadioIogy. Universiry of Main& Germany: )Siemens, Erlangen, Germuny
MR flow measurements of coronary bypass grafts provide functional data (1.2) that overcome the inhetent limitations of morphological as- sessment alone. The aim of the study was to evaluate in vitro the reli- ability of MR breathhold measurements when applied to the coronary bypass flow pattern.
Method: We measured in vivo intraopentively blood flow in coro- nary bypass grafts (venous grafts n = 10; internal mammarial [MA] graft n = 12) using the transit-time flowmeter (lTF) method. A typical flow pattern of both graft types was applied to a programmable pump- (UHDC flow system, Canada) tube (diameter 3 mm) system. MR mea- surement (n = 20; Siemens Vision 1.5 T, PC, VENC 75, breathhold, TR 125 ms) and FFI' were performed to compare the results for mean flowlmin and maximum flow.
Resulrs: MR measurement using breathhold sequences resulted in flow profiles comparable with results, and measurement of mean and maximum flow could be performed. The table contains the mean and standard deviation and error of the MR measurement compared with FIT:
Mean Flow (ml/min) Maximum Flow (ml/min)
Venous Graft IMA Venous Graft IMA
MR 63.72 2 0.18 73.38 t 0.22 106.2 t 0.42 107.4 C 0.53 TIT 65.21 2 1.15 78.64 2 1.81 108.19 C 3.43 94.82 2 5.49 Emor (%) 2.28 6.69 1.84 13.27
1998 SCMR Annual Meeting
Conclusion: Mean flow for both graft types was slightly underestimated by MR breathhold measurement, but the error was acceptable. For the venous-type flow pattern, MR measurement of the maximum flow was very similar to the FFT measurement, whereas the maximum flow of the MA-type flow pattern was less reliably measured by MR. References 1. Debatin JF. MR characterization of blood flow in native and grafted internal mammary arteries. JMRI, 1993; 3A43-450. 2. Galjee MA. Value of MRI in assessing patency and function of coro- nary artery grafts. Circulation, 1996; 93:660-666.
79
Three-Dimensional Zonal Echo-Planar Coronary Imaging G.Z. Yang, P.D. Gatehouse, I. Keegan, R.H. Mohiaddin, D.N. Firmin. Magnetic Resonance Unit, Royal Brompton Hospital, London, UK
Despite the advances in magnetic resonance (MR) coronary imaging achieved in recent years, reliable and consistent imaging of the coronary arteries remains difficult because physiological motion coupled with the small size and tortuous nature of the coronary vessels present unusual challenges. The goal of this study was to develop a routine and clini- cally viable technique for acquiring 3D coronary images in a reasonably short imaging time by using a new zonal echo-planar imaging tech- nique. The method carries the robustness of gradient-echo sequences while maintaining the efficiency .of echo-planar techniques. The reli- ability of the described approach originates from the relatively short forward echo-only interleaves used for the segmented 3D k-space cov- erage. A reduction in imaging time was made possible by using 2D spatially selective radiofrequency (RF) excitation and a locally focused encoding scheme that minimizes the required phase-encoding steps. The sequence was implemented on a mobile 0.5-T whole body scanner with actively shielded magnetic field gradient coils delivering 20 mT/ m peak strength and 60 mTlmlms maximum slew rate. Sixteen asymp- tomatic volunteers (1 1 men and 6 women, aged 24-42 yr) underwent MR imaging with the proposed technique after they provided informed consent. The technique was evaluated using the right coronary artery (RCA) images of the volunteers, and the results were compared with those acquired from h e conventional 2D segmented FLASH sequence with navigator echoes. The image assessment reuslts for all 16 volun- teers are listed in the table, in which the length and diameter of the RCA were measured by two independent observers. The visibility of the origin of the RCA and the confidence of vessel following were scored using a grading system of 1 (poor) to 5 (excellent). Advantages of the technique include an improved signal-to-noise ratio, clearer de- piction of tortuous coronary vessels due to decreased partial volume effects, and reduced motion blumng by the use of a short echo-planar readout. The technique holds the potential for performing spatially se- lected motion-adaptive excitation and imaging and thus allows the de- velopment of a robust and clinically viable 3D MR coronary imaging method without breathholding.
Coronary Artery Imaging with the intravascular Contrast Agent MS-325 M. Stuber, R.M. Botnar, M.V. McConnell, P.G. Danias, K.V. Kissinger, R.R. Edelman, W.J. Manning. Boston, MA
Changes in heart rate primarily affect the duration of the diastolic por- tion of the cardiac cycle. Therefore, signal sampling at end systole is a promising approach to reduce heart motion-induced blurring of the coronary arteries in the images (1). However, a limitation of imaging at end systole is the relatively slow flow in the coronary arteries that reduces the inflow contrast in the images. The application of an intra- vascular contrast agent that lowers the T1 of blood together with an inversion prepulse (2) might help to overcome this problem and might lead to a considerable improvement of blood-muscle contrast in the images. In the present abstract, a method for end-systolic imaging of the coronary arteries with an intravascular contrast agent is presented. It is based on navigator gating and real-time navigator tracking.
Methods: In four patients, the Gd-based intravascular contrast agent MS-325 (EPIX Medical Inc., Cambridge, MA) was applied in a single- dose injection of 0.05 mmol/kg. Five minutes after the IV injection of the agent, imaging of the coronary arteries was started. Image acquisi- tion was performed using an ECG gated 3D TFE sequence on a 1.5- T Philips Gyroscan ACS/NT whole body system (Philips Medical Sys- tems, Best, NL.). A five-element cardiac synergy coil was used for signal acquisition. A nonselective 180" pcepulse preceded the 2D selective navigator. For excitation pulse, the navigator was used for gating and real-time tracking of the imaged volume. The imaging sequence was performed at end systole and the inversion delay of the prepulse was optimized for maximum blood-muscle contrast. The acquisition win- dow was 60 ms for maximum efficiency of the prepulse. Total imaging time was approximately 15 min.
Results: In general, the coronary vessels are enhanced even though the images were acquired at end systole where coronary flow is mark- edly reduced. The efficiency of the real-time navigator did not seem to be affected by the nonselective prepulse. By the application of the 180" inversion, muscle signal is reduced by the factor of 6 when compared with the signal of blood. The signals of the thoracic muscle and fat are suppressed in the images. The acquisition of the 3D dataset was finished 20 min after the injection of the contrast agent. Despite the relatively long acquisition time, the coronaries are enhanced, consistent with the intravascular localization of the agent.
Conclusions: Because MS-325 remains intravascular for long pe- riods, it is well suited for navigator-based techniques with high-resolu- tion imaging and an increased overall measurement time. Dose optimi- zation and optimal T1 remain to be. defined; however, the concept of end-systolic image acquisition and signal enhancement due to the appli- cation of an intravascular contrast agent opens a wide field for cardiac applications in the future.
References 1. Sodickson D, et al. Proc. ISMRM, 1997; 2910. 2. Hofmann M, et al. Proc. ISMRM, 1997; 1:442.
Segmented Hash 3D Zonal EPI
RCA Confidence Confidence Midsegment Origin of Vessel Midsegment RCA Origin of Vessel
Length (mm) Diameter (mm) Visibility Following Length (mm) Diameter (mm) Visibility Following
Range (min-max) 20.5-74.5 2.5-5.0 0-4 1-4 38.1-83.5 3.5-5.4 2-5 3-5 Mean 2 SD 47.4 2 13.9 4.0 2 .65 1.5 2 1.5 2.4 2 1.2 61.4 t 13.8 4.4 -+ .44 4.2 -+ 0.9 4.1 2 0.7
1 (0) 1 (0) 2 (1). 3 ( 2 ) 2 (O) , 3 (3) 2 (1). 3 (5)
4 5 (0) 4 (4). 5 (0) 4 (6). 5 (7) 4 (8). 5 ( 5 ) - -
1 (9) 1 ( 5 ) 2 (3), 3 (4) - Score (distribution) -
80 1998 SCMR Annual Meeting
Quantification of “No-Reflow” Zone with Gadomer-17- Enhanced MR lmnping During ATP-Induced Hsperemia K. Chung, T. Chung, H. Weinmann, T. Lim. B. Choi. Department of Radiology, Ajou Universi@, Sumon, Korea
Quantitication of myocardial ischemia in MR imaging has been limited by inadequate steady-state signal intensity (SI) differences. As in recent successful identification of viable myocardium using first-pass MR im- aging, implementation of the higher-molecular-weight intravascular contrast media combined with hy-peremic agent may intensify SI differ- entiation, leading to expedient quantification of the “no-reflow” zone throughout the steady-state transit of the contrast media.
Methods: The left anterior descending coronary artery in seven cats was occluded for 3 br followed by 30 min of reperfusion. Gadomer- 17 (0.1 mmolkg) was injected in bolus during ATP infusion. Series of postcontrast MR images were acquired on a 1.5-T unit using SE sequence 400/15 ms, matrix 256 X 128. field of view 120 mm, collimation 5 mm, and two excitations). The third transaxial image from the apex was selected to measure area of the no-reflow zone relative to the sectional myocardium, and the time course of the area and SI changes were monitored.
Results: Maximal SI for normal. periinfarct. and no-reflow zones were 1.65 2 0.09.2.26 ? 0.2, and 1.57 t 0.16, occurring, respectively, at postcontrast 5, 10, and 15 min. Maximal SI difference between the ischemic zones was 0.88 2 0.08 attained at postcontrast 10 min. How- ever, maximal area of no-reflow zone was 7.23 ? 1.65% attained within the first 5 min, and the initial steep rise was followed by a sharp drop to 3.36 -C 0.59% for 10 rnin followed by steady decrease to 0.64 2 0.29% for 45 min. The no-reflow zone was sharply defined as central low SI distinct from surrounding high SI periinfarct zone. The time course of the area change was highly related (r = 0.805, p C 0.05) with the time course of the SI difference, whereas maximal size of the area showed reverse correlation (r = 0.805, p < 0.05) with the time course of the SI difference, whereas maximal size of the area showed reverse correlation ( r = -0.7, p C 0.05) with the initial periinfarct SI at postcontrast 5 min.
Conclusion: Gadomer- 17-enhanced steady-state MR imaging dur- ing ATP-induced hyperemia displayed the no-reflow zone as a distinct low SI, leading to expedient quantification of the area that was closely related to time-dependent SI changes.
Value of Combining Rest and Stress Data in a MR Perfusion Analysis in the WISE Study M. Doyle, A. Fuisz. E. Kortright, E. Walsh. E. Martin, W. Rogers, G. Pohost, for the WISE investigators. Birmingham AL
It has been established that in first-pass MRI perfusion studies, a stress agent enhances differences between normally perfused and underper- fused temtories. However, the diagnostic value of the nonstress MRI perfusion images has not been established. As part of the NHLBI WISE study, 53 women were examined with MR first-pass perfusion imaging and cardiac catheterization. Two to three short-axis slices were obtained every or alternate heart beats during bolus injection of a gadolinium by peripheral IV. Rest and “stress” images were obtained (stress in- duced by administration of dipyridamole). Two groups emerged from a retrospective unblinded analysis: those with evidence of significantly increased rate of signal change with time postdipyridamole (53% of patients) and those without this finding. Sensitivity and specificity for the detection of the presence of a >70 stenosis by coronary angiography of the stress images were better in the group with increased response (IR) (75% and 81%. respectively) than in the remaining patients without the response (WR) (67% and 40%. respectively). The rest analysis yielded similar results (IR sensitivity and specificity of 67% and 75% versus WR, 47% and 50%). Using the rest images along with the stress
images in a combined analysis, the sensitivity and specificity for the IR group improved to 86% and 9 1%. respectively (1 8 paticnts, 34% of total). In the W R group, no improvement was seen. It appears that by combining rest and stress analysis, the diagnostic accuracy of MRI per- fusion imaging is improved in a substantial subgroup of patients. Inter- estingly, in patients in the IR group, resting differences in myocardial perfusion could be identified. Tbe enhanced accuracy of the IR group’s rest images may represent a fundamental difference between the two groups rather than merely reflecting the adequacy of stress.
Gadophrin-2, a Necrosis-Avid Magnetic Resonance Imaging Contrast Agent for Noninvasive Quantification of Myocardial Infarct S i S. Dymarkowski,’ Y. Ni,’ J. Bogam’ C. pislam,’ H. Bosmans,’ Y. Miao,’ F. Van de Werf,’ W. Semmler? G. Marchal.’ ‘Leuven, Belgium; ’Berlin, Germany
Buckground and Purpose: Paramagnetic metalloporphyrins can be used as necrosis-avid contrast agents for MRI. The present study was de- signed to evaluate whether a small dose of gadophrin-2 (bis-gadolinium mesoporphyrin) can serve as a diagnostic adjuvant to PTCA for assess- ment of myocardial viability.
Merhodr and Results: Twelve- closed-chest dogs underwent balloon occlusion of coronary artery for 20 or 180 min to induce reversible myocardial ischemia or irreversible acute myocardial infarction (AMI). Thirty minutes after reperfusion, 20 ml of diluted gadophrin-2 at 5 pmollkg was infused in the coronary artery for 10 min. In vivo ECG- gated TI-weighted turbo-FLASH and T2-weighted HASTE MRI and T1- and R-weighted spin-echo MRI of excised heart were performed 2-4 hr after infusion. Findings of MRI and TTC staining were planimet- rically correlated. In dogs with 20-min occlusion, part of the myocar- dium appeared hyperintense on T2-weighted images, but no contrast enhancement was detectable on the TI-weighted images. In dogs with 180-min occlusion, a strong (200-3008) and persistent enhancement was observed in TI-weighted images. The infarcts enhanced by ga- dophrin-2 correlated closely to TTC-negative areas (R’ = 0.994, slope = 1.004). whereas R-weighted MRI overestimated the infarct size by 130%.
Conclusion: Besides intravenous administration. a small dose of ga- dophrin-2 can also be administered directly in the coronary artery dur- ing PTCA for postprocedure assessment of myocardial viability.
Intravascular Contrast Agent Improves 3D Magnetic Resonance Coronary Angiography in Humans L.O. Johansson,’ M.B.M. Hofman,’ S.E. Fischer,’ S.A. Wickline,’ C.H. Lorens’ S. Witte.’ ‘St. Louis. MO; *Cambridge, MA
Extracellular contrast agents have limited applicability for magnetic resonance coronary angiography (MRCA) due to the shurt intravascular half-life, which limits the resolution and possibilities for repeated scans. The purpose of this study was to evaluate the effect of a new intravascu- lar contrast agent, MS-325 (EPIX Medical Inc.), with a long intravascu- lar half-life for 3D-iMRCA. Six patients with known coronary artery disease were scanned using a Gyroscan ACS-NT (Philips Medical Sys- tems) 1.5-T scanner. The protocol was a navigator-based respiratory- gated and ECG-triggered 3D gradient echo sequence with a resolution of 1 X 1 X 1.9 mm3 with TRiTE 7.8/3.0 ms with a flip angle sweep maintaining constant magnetization over the acquisition. Spectral fat suppression was applied. A transverse scan for the left coronary system and an oblique scan for the right coronary system were performed both precontrast and 5-30 min postcontrast. MS-325 was injected over 75 s using a dose of 0.05 mmollkg. The S N R and CNR were measured
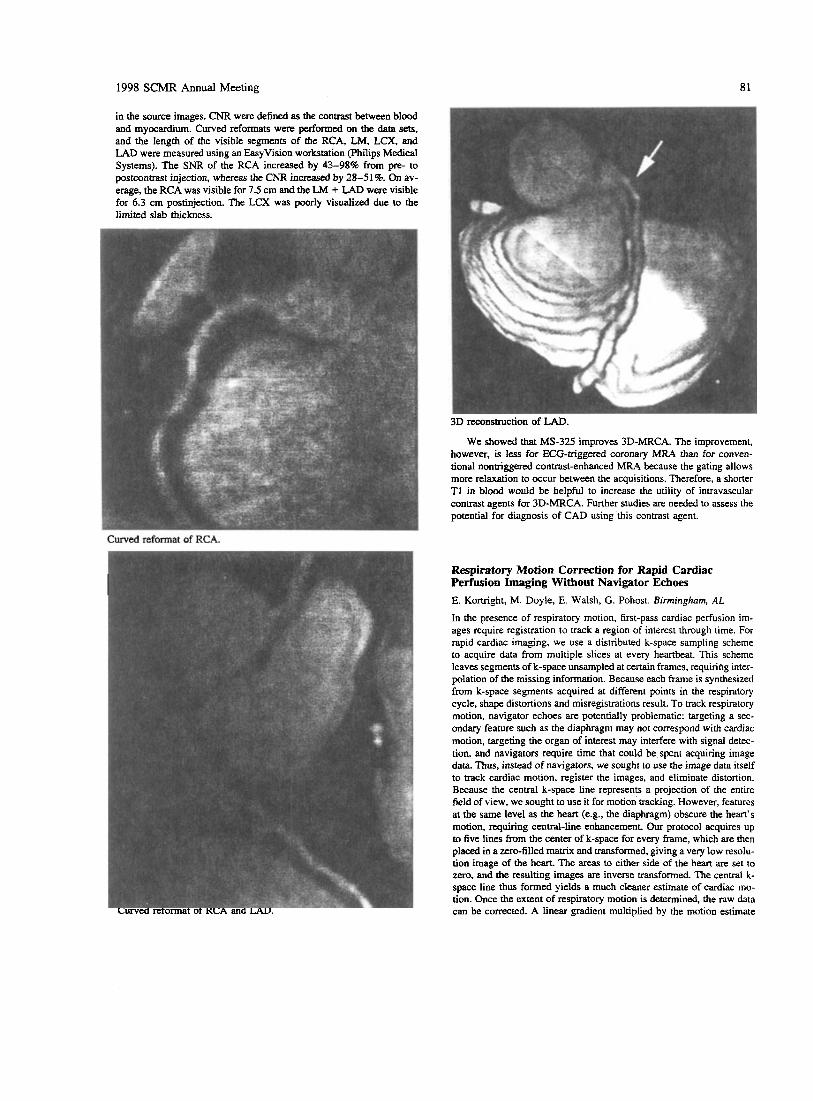
1998 SCMR Annual Meeting 81
Curved reformat of RCA.
Respiratory Motion Correction for Rapid Cardiac Perfusion Imaging Without Navigator Echoes E. Kortright, M. Doyle, E. Walsh, G. Pohost. Birmingham, AL
In the presence of respiratory motion, first-pass cardiac perfusion im- ages require registration to track a region of interest through time. For rapid cardiac imaging, we use a distributed k-space sampling scheme to acquire data from multiple slices at every heartbeat. This scheme leaves segments of k-space unsampled at certain frames, requiring inter- polation of the missing information. Because each frame is synthesized from k-space segments acquired at different points in the respiratory cycle, shape distortions and misregistrations result. To track respiratory motion, navigator echoes are potentially problematic: targeting a sec- ondary feature such as the diaphragm may not cornspond with cardiac motion, targeting the organ of interest may interfere with signal detec- tion, and navigators require time that could be spcnt acquiring image data Thus, instead of navigators, we sought to use the image data itself to track cardiac motion, register the images, and eliminate distortion. Because the central k-space line represents a projection of the entire field of view, we sought to use it for motion tracking. However, features at the same level as the heart (e.g., the diaphragm) obscure the heart’s motion, requiring central-line enhancement. Our protocol acquires up to five lines from the center of k-space for every frame, which are then placed in a zero-filled matrix and transformed, giving a very low resolu- tion image of the heart. The areas to either side of the heart are set to zero, and the resulting images are inverse transformed. The central k- space line thus formed yields a much cleaner estimate of cardiac mo- tion. Once the extent of respiratory motion is determined, the raw data can be corrected. A linear gradient multiplied by the motion estimate Curved reformat of RCA and LAD.
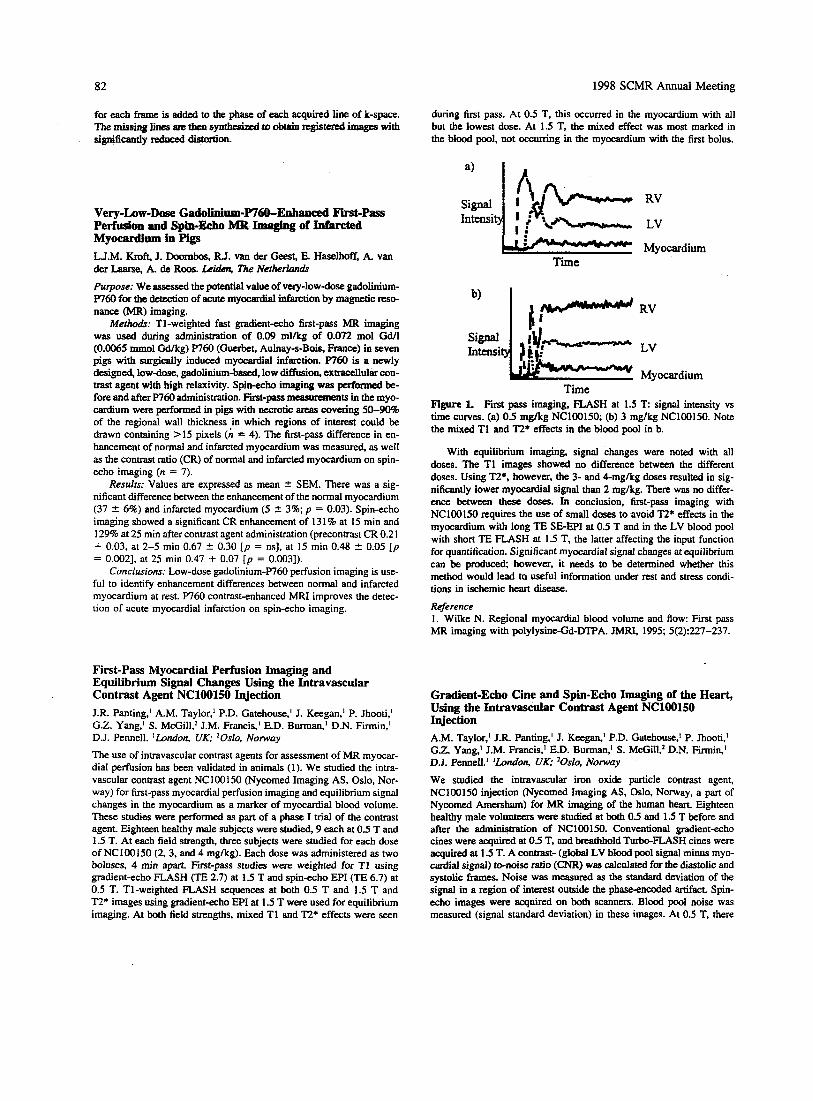
82 1998 SCMR Annual Meeting
for each frame is added to the phase of each acquired line of ic-space. The missing lines m then synthesized to obtain registeredimages with signiscantly &cd dhtortion.
Very-Law-Dose Gadolinium-W60-Enhanced First-pass Perfusion and Spin-Echo MR Imaging of Infarcted Myocardidipm in Pigs L.J.M. Kroft, J. Doornbos, RJ. van der Geest, E Hasclhoff, A. van der Laarsc, A. de Roos. Lriakn, The Nether-
Purpose: We assessed the potential value of very-low-dose gadolinium- P760 for the detection of acute myocardial infarction by magnetic reso- nance (MR) imaging.
Methods: TI-weighted fast gradient-echo first-pass MR imaging was used during administration of 0.09 mllkg of 0.072 mol W l (0.0065 mmol M g ) P760 (Guerbet, Aulnay-s-Bois, France) in seven pigs with surgically induced myocardial infarction. p760 is a newly designed, lowdose, gadolinium-based, low diffusion, extracellular con- trast agent with high relaxivity. Spin-ccho imaging was perfomvd be- fore and after W60 administration. Fit-pass mcasurcments in the myo- cardium were performed in pigs with m t i c areas covering 50-90% of the regional wall thickness ,in which regions of interest could be drawn containing > 15 pixels (n = 4). The first-pass difference in en- hancement of normal and infarcted myocardium was measured, zs well as the contrast ratio (CR) of normal and infarcted myocardium on spin- echo imaging (n = 7).
Results: Values are expressed as mean 2 SEM. There was a sig- nificant difference between the enhancement of the normal myocardium (37 5 6%) and infarcted myocardium (5 2 3%; p = 0.03). Spin-echo imaging showed a significant CR enhancement of 13 1% at 15 min and 129% at 25 min after contrast agent administration (precontnst CR 0.2 I + 0.03. at 2-5 min 0.67 2 0.30 [ p = ns], at 15 min 0.48 I 0.05 [ p = 0.0021, at 25 min 0.47 + 0.07 [p = 0.0031).
Conclusions: Low-dose gadolinium-P760 perfusion imaging is use- ful to identify enhancement differences between normal and infarcted myocardium at rest. P760 contrast-enhanced MRl improves the detec- tion of acute myocardial infarction on spin-echo imaging.
First-Pass Myocardial Perfusion Imaging and Equilibrium Signal Changes Using the Intravascular Contrast Agent NC100150 Injection J.R. Panting,' A.M. Taylor,' P.D. Gatehouse,' J. Keegan,' P. Jhooti,' G.Z. Yang,' S. McGill? J.M. Francis,' E.D. Burman,' D.N. Firmin,' D.J. Pennell. 'London, UK; 20slo, Norway
The use of intravascutar contrast agents for assessment of MR myocar- dial perfusion has been validated in animals (1). We studied the intra- vascular contrast agent NC100150 (Nycomed Imaging AS, Oslo, Nor- way) for first-pass myocardial perfusion imaging and equilibrium signal changes in the myocardium as a marker of myocardial blood volume. These studies were performed as part of a phase I trial of the contrast agent. Eighteen healthy male subjects were studied, 9 each at 0.5 T and 1.5 T. At each field strength, three subjects were studied for each dose of NC100150 (2, 3, and 4 mglkg). Each dose was administered as two boluses, 4 min apart. First-pass studies were weighted for TI using gradient-echo FLASH (TE 2.7) at 1.5 T and spin-echo EPI (TE 6.7) at 0.5 T. T1-weighted FLASH sequences at both 0.5 T and 1.5 T and T2* images using gradient-echo EPI at 1.5 T were used for equilibrium imaging. At both field strengths, mixed TI and TZ* effects were seen
during first pass. At 0.5 T, this occurred in the myocardium with all but the lowest dose. At 1.5 T, the mixed effect was most marked in the blood pool, not occurring in the myocardium with the first bolus.
Time
RV
LV
Myocardium
RV
LV
Myocardium Time
Figure 1. First pass imaging, FLASH at 1.5 T signal intensity vs time w e s . (a) 0 5 mgkg NC100150; (b) 3 mglkg NC100150. Note the mixed T1 and R* effects in the blood pool in b.
With equilibrium imaging, signal changes were noted with all doses. The T1 images showed no difference between the different doses. Using R*. however, the 3- and Cmgkg doses resulted in sig- nificantly lower myocardial signal than 2 mg/kg. There was no differ- ence between these doses. In conclusion, first-pass imaging with NC100150 requires the use of small doses to avoid T2* effects in the myocardium with long TE SE-EPI at 0.5 T and in the LV blood pool with short TE FLASH at 1.5 T, the latter affecting the input function for quantification. Significant myocardial signal changes at equilibrium can be produced; however, it needs to be determined whether this method would lead ta useful information under rest and stress condi- tions in ischemic heart disease.
Reference I . Wilke N. Regional myocardial blood volume and Row: First pass MR imaging with polylysine-Gd-DTPA. JMRI, 1995; 5(2):227-237.
Gradient-Echo Cine and Spin-Echo Imaging of the Heart, Using the Intravascular Contrast Agent NC100150 Injection A.M. Taylor,' J.R Panting,' J. Keegan,' P.D. Gatehouse,' P. Jhooti.' G . 2 Yang,' J.M. Francis.' E.D. Burman,' S. McGiIl? D.N. F i i i n , ' DJ. Pennell.' 'London, UK: 20slo, Norway We studied the intravascular iron oxide particle contrast agent, NC100150 injection (Nycomed Imaging AS, Oslo, Norway, a part of Nycomed Amersham) for h4R imaging of the human heart. Eighteen healthy male volunteers were studied at both 05 and 1.5 T before and after the administration of NC100150. Conventional $radient-echo cines were acquired at 05 T, and breathhold Turbo-FLASH cines were acquired at 1.5 T. A contrast- (global LV blood pool signal minus myo- cardial signal) to-noise ratio (CNR) was calculated for the diastolic and systolic frames. Noise was measured as the standard deviation of the signal in a region of interest outside the phaseencoded artifact Spin- echo images were acquired on both scanners. Blood pool noise was measured (signal standard deviation) in these images. At 0.5 T, there
1998 SCMR Annual Meeting 83
was a significant increase in the CNR in the diastolic (56%. p = 0.01) and systolic (141%. p < 0.001) cine frames. There was also a significant increase in the signal intensity (SI) gradient at the LV blood poollmyo- cardial border in the diastolic and systolic frames (both p < 0.001). At 1.5 T, there was a significant increase in the CNR in the diastolic (221%.p < 0.001) and systolic (916%,p < 0.001) cine frames. Again, there was also a si,pificant increase in the SI gradient at the LV blood poollmyocardial border in the diastolic and systolic frames (both p < 0.001). Spin-echo images showed a significant improvement in image quality, secondary to a reduction in the flow artifact at both field strengths (p = 0.01 at 0.5 and 1.5 T). In conclusion, NC100150 showed no adverse effects in 18 subjects, and image quality and LV blood pool/myocardial definition were improved. These improvements enable better spin-echo anatomical definition, bemr definition of myo- cardial wall motion, and should improve automated edge detection al- gorithms.
Multislice First-Pass Magnetic Resonance Perfusion Imaging in Comparison with Regional Myocardial Wall Thickening in Chronic Myocardial Ischemia B.J. Wintersperger, H. Penzkofes, A. Knez, M. Reiser. Universify of Munich, Germany
Purpose: The purpose of our study was to compare findings of first- pass MR perfusion imaging and cine MRI in patients with chronic myo- cardial infarction.
Merho&: Twelve patients with chronic myocardial infarction un- derwent MR perfusion imaging and cine MRI on a 1.5-T Magnetom Vision. Perfusion was assessed using a triple-slice saturation recovery Turbo-FLASH sequence (2.5 mdl .2 ms/8") and automated injection of gadopentetate dimeglumine (1). Myocardial thickening was assessed using a segmented breathhold 2D FLASH sequence (80 ms14.8 msl 10"). Perfusion and wall thickening were determined for corresponding slice positions. Systolic myocardial wall thickening was evaluated after semiautomated segmentation of myocardial contours, and results were compared with mean values obtained from six healthy volunteers. Myo- cardial wall thickening percentage more than two standard deviations below the mean values of the control group was considered abnormal. Anterior, lateral, posterior, and septal myocardial regions (ROIs) were classified for comparison with perfusion MRI. Multisection fist-pass perfusion imaging was analyzed with a user-developed software tool, calculating color-coded parameter maps for signal intensity upslope.
Resulrs: Mean wall thickening percentage in our control group rose from the base (40.0 t 12.4%) to the apex (71.7 2 19.6%). In the patient group in 1 1 of 48 ROIs, first-pass MR perfusion imaging showed hyper- perfusion correlating well to 99"Tc-Sestamibi S P E m . Cine MRI showed abnormal myocardial wall thickening percentage in 13 of 48 ROIs. One ROI with abnormal myocardial perfusion did not show re- duced myocardial wall thickening. Additionally to perfusion MRI, three ROIs with reduced wall thickening could be identified.
Conclusion: Myocardial wall thickening analyzes and myocardial perfusion in MRI provides complementary informations in patients with CHD. In patients with chronic myocardial infarction, wall thickening is significantly reduced in hypoperfused areas than in normal perfused areas. Hypoperfusion and restricted myocardial thickening correlate well.
Reference 1. Wilke N. Myocardial perfusion reserve: Assessment with multisec- tion, quantitative first-pass MR imaging. Radiology, 1997; 204.273- 384.
Interobserver Reproducibility of MRI Tagged Data in Patients with Hypertensive Left Ventricular Hypertrophy R.W.W. Biederman,' M. Doyle,' A. Young? S. Thrupp? E. Kortright,' S. Oparil,' G. Pohost,' L. Dell'Italia,' for LIFE study investigators. 'Birmingham, AL: zAuckland, N e w Zealand
In this study we sought to compare the reproducibility of MRI tagging by spatial amplitude modulation (SPAMM). We evaluated 14 patients with left ventricular hypertrophy by ECG criteria in the LIFE study (9 m and 5 f, 56-78 yr). As prescribed by the LIFE study, the site of the 2D MRI acquisitions were based on American Society of Echocardiog- raphy standards and positioned just above the level where the papillary muscles attach to the myocardium. Data were acquired on a 1.5-T sys- tem. In the 2D analysis, the intersection of tagged regions were semiau- tomatically detected and tracked from systole to diastole. From this analysis, intramyocardial strain (E) can be calculated for specific myo- cardial regions. Strain between diastole and systole was calculated for hbo regions-the inmavenhcular septaI wall (IVS) and the posterior wall (PW)-to correspond with parallel echocardiography measure- ments. The strain was resolved into radial (&) and circumferential (EC) components. Two separate readers using the same software package analyzed the data (the software makes an attempt to automatically track the vertices, but due to low signal-to-noise ratio, substantial manual intervention is required to override obvious errors). The correlation co- efficient ( r ) was calculated for each variable, summarized below:
Variable r value
ER(NS) 0.85 EC(NS) 0.80 ER(PW) 0.86 EC(Pw) 0.34
All r values are in an excellent level with the exception of the circum- ferential strain in the posterior wall, which is due to a single outlier. Correcting for this outlier, the r value becomes 0.84. To obtain such a high level of correlation in a difficult patient population is promising for clinical utility of this new technology.
Regional Analysis of Left Ventricular Wall Thickness and Motion Myocardial Infarction B.R. Cowan,' A.A. Young,' L.J. Dell'ltalia.2 'Auckland, New Zealand; 'Birmingham, AL
The assessment of cardiac function after myocardial infarction is gener- ally based on the measurement of global parameters such as end-sys- tolic volume, end-diastolic volume, ejection fraction, and left ventricu- lar mass. The process of infarction and the response of uninvolved myocardium is, however, a highly regionalized phenomenon, with re- duced wall thickening occurring in the ischemic areas and compensa- tory increases in those supplied by unaffected vascular territories. Stan- dard global indices therefore tend to average out these effects. The aim of this investigation was to develop a methodology whereby multislice long- and short-axis MRI data could be analyzed on a regional basis. Initially, the endocardial and epicardial contours were defined on all images, and fiducial markers were inserted to locate the position of the right ventricle and base plane. These results were then transferred to a customized finite-element software package that fitted a moving three- dimensional surface to the epicardium and endocardium, resulting in a
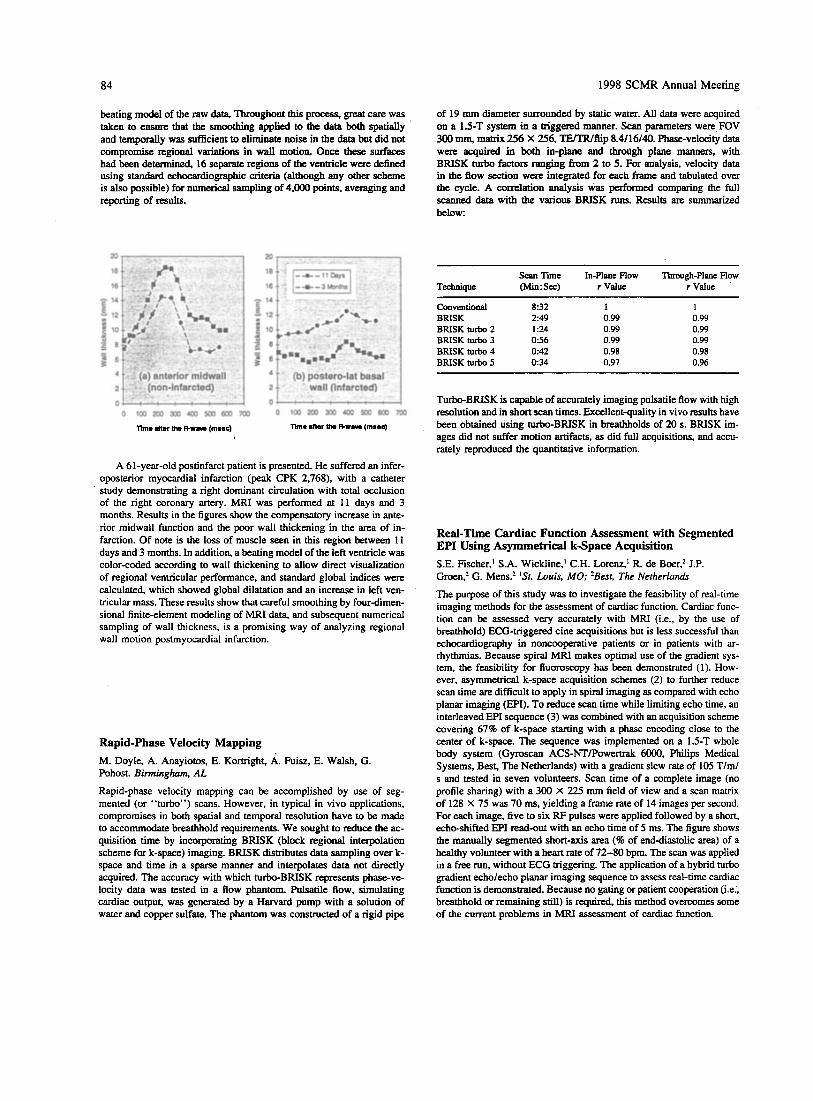
84 1998 SCMR Annual Meeting
beating model of the raw data. Throughout this process, great care was taken to ensure that the smoothing applied to the data both spatially and temporally was sufficient to eliminate noise in the data but did not compromise regional variations in wall motion. Once these surfaces had been determined, 16 separate regions of the ventricle were defined using standard echocardiographic criteria (although any other scheme is also possible) for numerical sampling of 4,000 points, averaging and reporting of results.
a0
16
16 - 14 E 5 12
i j s *
4
2
0
A 61-year-old postinfarct patient is presented. He suffered an infer- oposterior myocardial infarction (peak CPK 2.768). with a catheter study demonstrating a right dominant circulation with total occlusion of the right coronary artery. MRI was performed at 11 days and 3 months. Results in the figures show the compensatory increase in ante- rior midwall function and the poor wall thickening in the area of in- farction. Of note is the loss of muscle Seen in this region between I 1 days and 3 months. In addition, a beating model of the left ventricle was color-coded according to wall thickening to allow direct visualization of regional ventricular performance, and standard global indices were calculated. which showed global dilatation and an increase in left ven- tricular mass. These results show that careful smoothing by four-dimen- sional finite-element modeling of MRI data. and subsequent numerical sampling of wall thickness, is a promising way of analyzing regional wall motion postmyocardial infarction.
Rapid-Phase Velocity Mapping M. Doyle, A. Anayiotos, E. Kortright, A. Fuisz, E. Walsh, G. Pohost. Birminghawz, AL
Rapid-phase velocity mapping can be accomplished by use of seg- mented (or “turbo”) scans. However, in typical in vivo applications, compromises in both spatial and temporal resolution have to be made to accommodate breathhold requirements. We sought to reduce the ac- quisition time by incorporating BRISK (block regional interpolation scheme for k-space) imaging. BRISK distributes data sampling over k- space and time in a sparse ,manner and interpolates data not directly acquired. The accuracy with which turbo-BRISK represents phase-ve- locity data was tested in a flow phantom. Pulsatile flow, simulating cardiac output, was generated by a Harvard pump with a solution of water and copper sulfate. The phantom was constructed of a rigid pipe
of 19 mm diameter surrounded by static water. All data were acquired on a 15-T system in a triggered manner. Scan parameters were FOV 300 mm. matrix 256 X 256, W f l i p 8.4/16/40. Phase-velocity data were acquired in both in-plane and through plane manners, with BRISK turbo factors ranging from 2 to 5. For analysis, velocity data in the flow section were integrated for each frame and tabulated over the cycle. A correlation analysis was performed comparing the full scanned data with the various BRISK runs. Results are summarized below:
Scan T i e In-Plane Flow Thrwgh-Plane Flow Technique (Min:SeC) r Value r Value
Conventional 832 1 1 BRISK 249 0.99 0.99 BRISK turbo 2 1:24 0.99 0.99 BRISK turbo 3 056 0.99 0.99 BRISK turbo 4 042 0.98 0.98 BRISK turbo 5 034 0.97 0.96
Turbo-BRISK is capable of accurately imaging pulsatile flow with high resolution and in shoct scan times. Excellentquality in vivo results have been obtained using turbo-BRISK in breathholds of 20 s. BRISK im- ages did not suffer motion artifacts, as did full acquisitions, and accu- rately reproduced the quantitative information.
Real-Time Cardiac Function Assessment with Segmented EPI Using Asymmetrical k-Space Acquisition S.E. Fischer,’ S.A. Wickline,’ C.H. Lorenz,’ R. de Boer: J.P. Groen,’ G. Mens.’ ‘Sf. Louis, MO: ’Best. The Nerherlands
The purpose of this study was to investigate the feasibility of real-time imaging methods for the assessment of cardiac function. Cardiac func- tion can be assessed very accurately with MRI (i.e., by the use of breathhold) ECG-triggered cine acquisitions but is less successful than echocardiography in noncooperative patients or in patients with ar- rhythmias. Because spiral MRI makes optimal use of the gradient sys- tem, the feasibility for fluoroscopy has been demonstrated (1). How- ever, asymmetrical k-space acquisition schemes (2) to further reduce scan time are difficult to apply in spiral imaging as compared with echo planar imaging (EPI). To reduce scan time while limiting echo time, an interleaved EPI sequence (3) was combined with an acquisition scheme covering 67% of k-space starting with a phase encoding close to the center of k-space. The sequence was implemented on a 1.5-T whole body system (Gyroscan ACS-NTIPowertrak 6O00, Philips Medical Systems, Best, The Netherlands) with a gradzent slew rate of 105 T/m/ s and tested in seven volunteers. Scan time of a complete image (no profile sharing) with a 300 X 225 mm field of view and a scan matrix of 128 X 75 was 70 ms, yielding a frame rate of 14 images per second. For each image, five to six RF pulses were applied followed by a short, echwshifted EPI read-out with an echo time of 5 ms. The figure shows the manually segmented short-axis area (9% of end-diastolic area) of a healthy volunteer with a heart rate of 72-80 bpm. The scan was applied in a free run, without ECG triggering. The application of a hybrid turbo gradient echo/echo planar imaging sequence to assess real-time cardiac function is demonstrated. Because no gating or patient cooperation (i.e., breathhold or remaining still) is required. this method overcomes some of the current problems in MRI assessment of cardiac function.
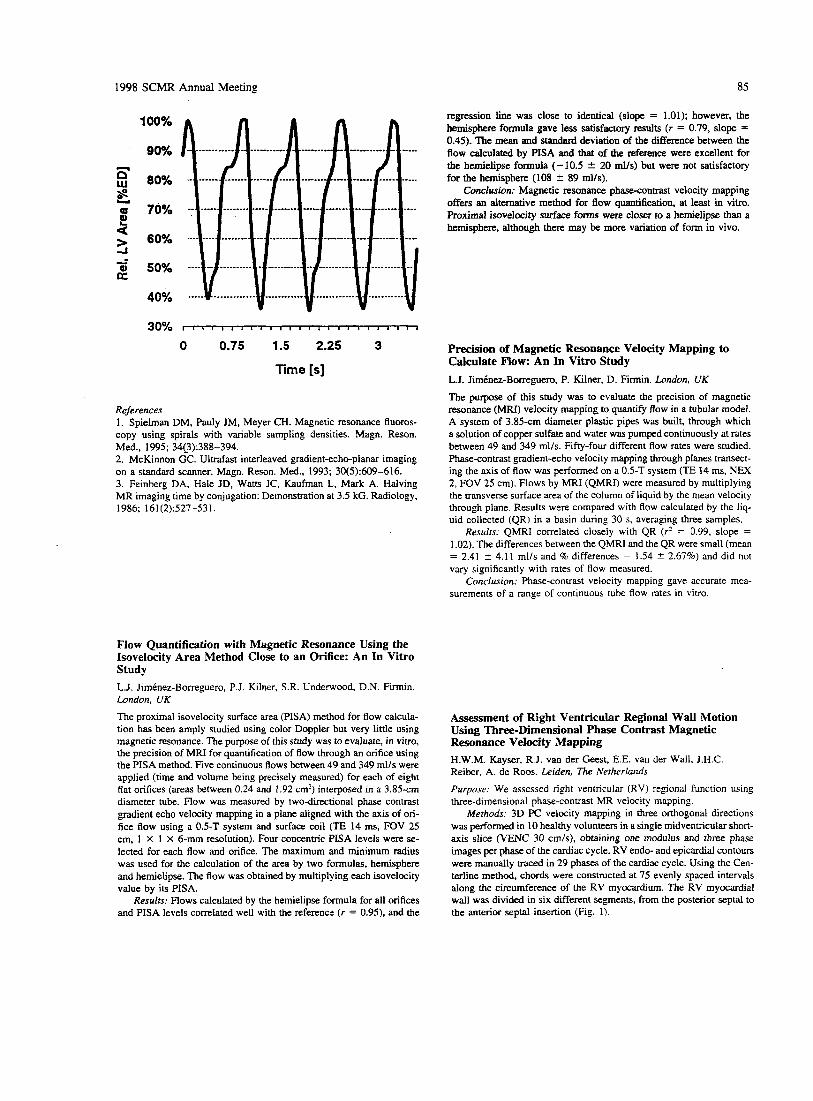
1998 SCMR Annual Meeting 85
100%
90%
80%
70%
60%
50%
40%
30% I I I I I I I I I I I I I I I I I I I I I I I I t
0 0.75 1.5 2.25 3
Time [s]
References 1. Spielman DM, Pauly JM, Meyer CH. Magnetic resonance fluoros- copy using spirals with variable sampling densities. Magn. Reson. Med., 1995; 34(_3):388-394. 2. McKinnon GC. Ultrafast interleaved gradient-echo-planar imaging on a standard scanner. Magn. Reson. Med., 1993; 30(5):609-616. 3. Feinberg DA, Hale JD, Watts JC, Kaufman L, Mark A. Halving MR imaging time by conjugation: Demonstration at 3.5 kG. Radiology, 1986; 161(2):527-531.
Flow Quantification with Magnetic Resonance Using the kovelocity Area Method Close to an Orifice: An In Vitro Study L.J. JimCnez-Borreguero, P.J. Kilner, S.R. Underwood, D.N. Firmin. London, UK The proximal isovelocity surface area (PISA) method for flow calcula- tion has been amply studied using color Doppler but very little using magnetic resonance. The purpose of this study was to evaluate, in vitro, the precision of MRI for quantification of flow through an orifice using the PISA method. Five continuous flows between 49 and 349 mlls were applied (time and volume being precisely measured) for each of eight flat orifices (areas between 0.24 and 1.92 crn') interposed in a 3.85-cm diameter tube. Flow was measured by two-directional phase contrast gradient echo velocity mapping in a plane aligned with the axis of ori- fice flow using a 0.5-T system and surface coil (TE 14 ms, FOV 25 cm, 1 X 1 X 6-mm resolution). Four concentric PlSA levels were se- lected for each flow and orifice. The maximum and minimum radius was used for the calculation of the area by two formulas, hemisphere and hemielipse. The flow was obtained by multiplying each isovelocity value by its PISA.
Resulrs: Flows calculated by the hemielipse formula for all orifices and PISA levels correlated well with the reference ( r = 0.95). and the
regression line was close to identical (slope = 1.01); however, the hemisphere formula gave less satisfactoq results (r = 0.79, slope = 0.45). The mean and standard deviation of the difference between the flow calculated by PISA and that of the reference were excellent for the hemielipse formula (-10.5 2 20 mlls) but were not satisfactory for the hemisphere (108 2 89 mlls).
Conclusion: Magnetic resonance phasecontrast velocity mapping offers an alternative method for flow quantification, at least in vitro. Proximal isovelocity surface forms were closer to a hemielipse than a hemisphere, although there may be more variation of form in vivo.
Precision of Magnetic Resonance Velocity Mapping to Calculate Now: An In Vitro Study L.J. JirnCnez-Borreguero, P. Kilner, D. Firmin. London, UK The purpose of this study was to evaluate the precision of magnetic resonance (MRI) velocity mapping to quantify flow in a tubular model. A system of 3.85-cm diameter plastic pipes was built, through which a solution of copper sulfate and water was pumped continuously at rates between 49 and 349 ml/s. Fifty-four different flow rates were studied. Phase-contrast gradient-echo velocity mapping through planes transect- ing the axis of flow was performed on a 0.5-T system (TE 14 ms, NEX 2, FOV 25 cm). Flows by MRI (QMRI) were measured by multiplying the transverse surface area of the column of liquid by the mean velocity through plane. Results were compared with flow calculated by the liq- uid collected (QR) in a basin during 30 s, averaging three samples.
Resulrs: QMRI correlated closely with QR ( r 2 = 0.99, slope = 1.02). The differences between the QMRI and the QR were small (mean = 2.41 2 4.11 ml/s and % differences = 1.54 f 2.67%) and did not vary significantly with rates of flow measured.
Conclusion: Phase-contrast velocity mapping gave accurate mea- surements of a range of continuous tube flow rates in vitro.
Assessment of Right Ventricular Regional Wall Motion Using Three-Dimensional Phase Contrast Magnetic Resonance Velocity Mapping H.W.M. Kayser, R.J. van der Geest, E.E. van drr Wall, J.H.C. Reiber, A. de Roos. Leiden, The Netherlands
Piirpose: We assessed right ventricular (RV) regional function using three-dimensional phase-contrast MR velocity mapping.
Methods: 3D PC velocity mapping in three orthogonal directions was performed in 10 healthy volunteers in a single midventricular short- axis slice (VENC 30 cm/s), obtaining one modulus and three phase images per phase of the cardiac cycle. RV endo- and epicardial contours were manually traced in 29 phases of the cardiac cycle. Using the Cen- terline method, chords were constructed at 75 evenly spaced intervals along the circumference of the RV myocardium. The RV myocardial wall was divided in six different segments, from the posterior septal to the anterior septal insertion (Fig. 1).
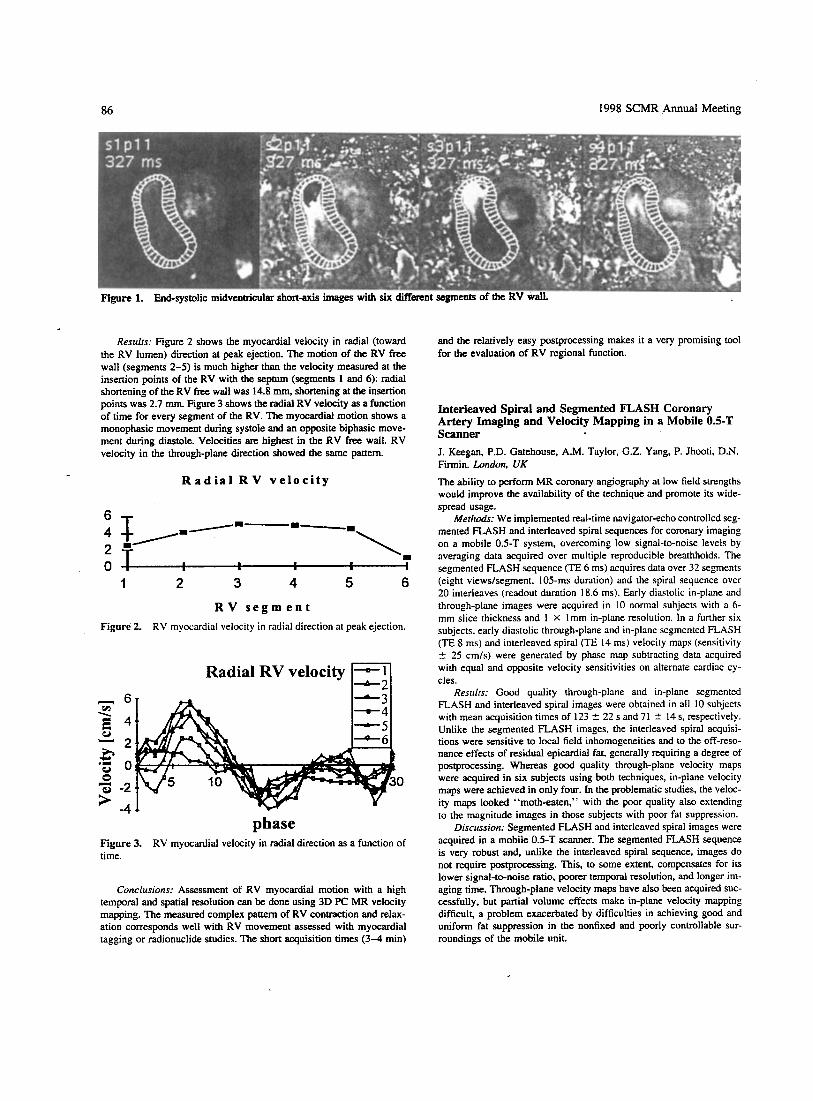
86 1998 SCMR Annual Meeting
Resulrs: Figure 2 shows the myocardial velocity in radial (toward the RV lumen) direction at peak ejection. The motion of the RV free wall (segments 2-5) is much higher than the velocity measured at the insertion points of the RV with the sephlrn (segments 1 and 6): radial shortening of the RV free wall was 14.8 mm, shortening at the insertion points was 2.7 mm. Figure 3 shows the radial RV velocity as a function of time for every segment of the RV. The myocardial motion shows a monophasic movement during systole and an opposite biphasic move- ment during diastole. Velocities are highest in the RV free wall. RV velocity in the through-plane direction showed the same pattern.
R a d i a l R V v e l o c i t y
/--I 6
4 2 - T,- --\. o ? . I
1 2 3 4 5 6
R V s e g m e n t Figure 2. RV myocardial velocity in radial direction at peak ejection.
Radial RV velocity - I--:I
phase Figure 3. RV myocardial velocity in radial direction as a function of time.
Conclusions: Assessment of RV myocardial motion with a high temporal and spatial resolution can be done using 3D PC MR velocity mapping. The measured complex pattern of RV contraction and relax- ation corresponds well with RV movement assessed with myocardial tagging or radionuclide studies. The short acquisition times (3-4 min)
and the relatively easy postprocessing makes it a very promising tool for the evaluation of RV regional function.
Interleaved Spiral and Segmented FLASH Coronary Artery Imaging and Velocity Mapping in a Mobile 0.5-T Scanner J. Keegan, P.D. Gatehouse. A.M. Taylor, G.Z. Yang, P. Jhooti, D.N. Firmin. London. UK The ability to perform MR coronary angiography at low field strengths would improve the availability of the technique and promote its wide- spread usage.
Merhods: We implemented real-time navigator-echo controlled seg- mented FLASH and interleaved spiral sequences for coronary imaging on a mobile 0.5-T system, overcoming low signal-to-noise levels by averaging data acquired over multiple reproducible breathholds. The segmented FLASH sequence (TE 6 ms) acquires data over 32 segments (eight viewslsegment, 105-111s duration) and the spiral sequence over 20 interleaves (readout duration 18.6 ms). Early diastolic in-plane and through-plane images were acquired in 10 normal subjects with a 6- mm slice thickness and 1 X Imm in-plane resolution. In a further six subjects, early diastolic through-plane and in-plane segmented FLASH (TE 8 ms) and interleaved spiral (TE 14 ms) velocity maps (sensitivity 5 25 cm/s) were generated by philse map subtracting data acquired with equal and opposite velocity sensitivities on alternate cardiac cy- cles.
Restilrs: Good quality through-plane and in-plane segmented FLASH and interleaved spiral images were obtained in all 10 subjects with mean acquisition times of 123 2 22 s and 71 5 14 s, respectively. Unlike the segmented FLASH images, the interleaved spiral acquisi- tions were sensitive to local field inhomogeneities and to the off-reso- nance effects of residual epicardial fat, generally requiring a degree of postprocessing. Whereas good quality through-plane velocity maps were acquired in six subjects using both techniques, in-plane velocity maps were achieved in only four. In the problematic studies, the veloc- ity maps looked “moth-eaten,” with the poor quality also extending to the magnitude images in those subjects with poor fat suppression.
Discussion: Segmented FLASH and interleaved spiral images were acquired in a mobile 0.5-T scanner. The segmented FLASH sequence is very robust and, unlike the interleaved spiral sequence, images do not require postprocessing. This, to some extent, compensates for its lower signal-to-noise ratio, poorer temporal resolution, and longer im- aging time. Through-plane velocity maps have also been acquired suc- cessfully, but partial volume effects make in-plane velocity mapping difficult, a problem exacerbated by difficulties in achieving good and uniform fat suppression in the nonfixed and poorly controllable sur- roundings of the mobile unit.
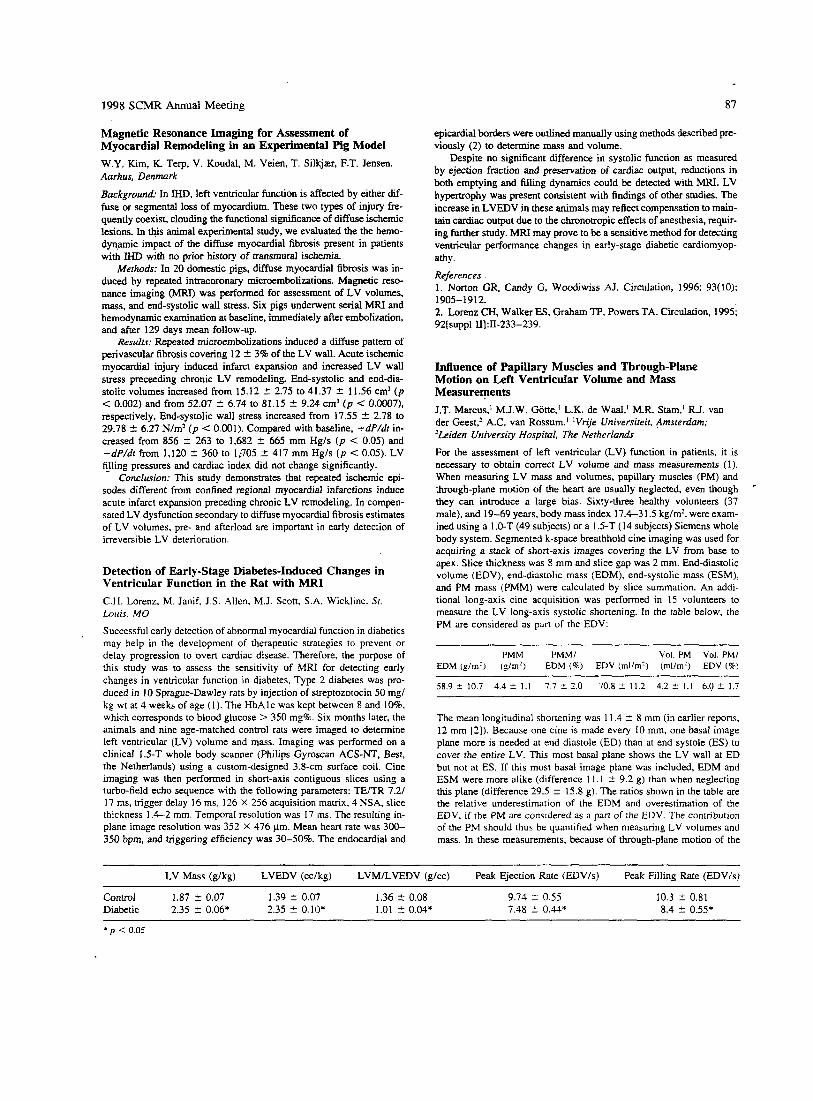
1998 SCMR Annual Meeting 87
Magnetic Resonance Imaging for Assessment of Myocardial Remodeling in an Experimental Pig Model W.Y. Kim, K Terp, V. Koudal, M. Veien, T. Silkjax, F.T. Jensen. Aarhus, Denmark
Background: In IHD, left ventricular function is affected by either dif- fuse or segmental loss of myocardium. These two types of injury fre- quently coexist, clouding the functional significance of diffuse ischemic lesions. In this animal experimental study, we evaluated the the hemo- dynamic impact of the diffuse myocardial fibrosis present in patients with IHD with no prior history of transmural ischemia.
Methods: In 20 domestic pigs, diffuse myocardial fibrosis was in- duced by repeated intracoronary microembolizations. Magnetic reso- nance imaging (MRI) was performed for assessment of LV volumes, mass, and end-systolic wall stress. Six pigs underwent serial MRI and hemodynamic examination at baseline, immediately after embolization, and after 129 days mean follow-up.
Results: Repeated microembolizations induced a diffuse pattern of perivascular fibrosis covering 12 f 3% of the LV wall. Acute ischemic myocardial injury induced infarct expansion and increased LV wall stress preceeding chronic LV remodeling. End-systolic and enddia- stolic volumes increased from 15.12 5 2.75 to 41.37 ? 11.56 cm' ( p < 0.002) and from 52.07 f 6.74 to 81.15 5 9.24 cm3 (p < 0.0007). respectively. End-systolic wall stress increased from 17.55 t 2.78 to 29.78 5 6.27 N/m' (p < 0,001). Compared with baseline, +dP/dr in- creased from 856 ? 263 to 1,682 ? 665 mm Hg/s ( p < 0.05) and -dP/dt from 1,120 f 360 to 1;705 f 417 mm Hg/s ( p < 0.05). LV @ling pressures and cardiac index did not change significantly.
Conclusion: This study demonstrates that repeated ischemic epi- sodes different from confined regional myocardial infarctions induce acute infarct expansion preceding chronic LV remodeling. In compen- sated LV dysfunction secondary to diffuse myocardial fibrosis estimates of LV volumes, pre- and afterload are important in early detection of irreversible LV deterioration.
Detection of Early-Stage Diabetes-Induced Changes in Ventricular Function in the Rat with MRI C.H. Lorenz, M. Janif. J.S. Allen, M.J. Scott, S.A. Wickline. Sr. Loitis. MO
Successful early detection of abnormal myocardial function in diabetics may help in the development of therapeutic strategies to prevent or delay progression to overt cardiac disease. Therefore, the purpose of this study was to assess the sensitivity of MlU for detecting early changes in ventricular function in diabetes. Type 2 diabetes was pro- duced in 10 Sprague-Dawley rats by injection of streptozotocin 50 mg/ kg wt at 4 weeks of age (1). The HbAlc was kept between 8 and 10%. which corresponds to blood glucose > 350 mg%. Six months later, the animals and nine age-matched control rats were imaged to determine left ventricular (LV) volume and mass. Imaging was performed on a clinical I .5-T whole body scanner (Philips Gyroscan ACS-NT, Best, the Netherlands) using a custom-designed 3.8-cm surface coil. Cine imaging was then performed in short-axis contiguous slices using a turbo-field echo sequence with the following parameters: TElTR 7.2/ 17 ms, trigger delay 16 ms, 126 X 256 acquisition matrix, 4 NSA, slice thickness 1.4-2 mm. Temporal resolution was 17 ms. The resulting in- plane image resolution was 352 X 476 pm. Mean heart rate was 300- 350 bpm, and triggering efficiency was 30-508. The endocardial and
epicardial borders were outlined manually using methods described pre- viously (2) to determine mass and volume.
Despite no significant difference in systolic function as measured by ejection fraction and preservation of cardiac output, reductions in both emptying and filling dynamics could be detected with MRI. LV hypertrophy was present consistent with findings of other studies. The increase in LVEDV in these animals may reflect compensation to main- tain cardiac output due to the chronotropic effects of anesthesia, requir- ing further study. MRI may prove to be a sensitive method for detecting ventricular performance changes in early-stage diabetic cardiomyop- athy.
References 1 . Norton GR, Candy G, Woodiwiss AJ. Circulation, 1996; 93(10):
2. Lorenz CH, Walker ES, Graham TP, Powers TA. Circulation, 1995; 1905- 191 2.
SUPPI PI II]:II-233-239.
Influence of Papillary Muscles and Through-Plane Motion on Left VentricuIar Volume and Mass Measurements J.T. Marcus,I M.J.W. G0tte.l L.K. de Waal,' M.R. Stam,' R.J. van der Geest,* A.C. van Rossum.' 'Vrije Universiteir, Amsterdam; 'Leiden University Hospital9 The Netherlands
For the assessment of left ventricular (LV) function in patients, it is necessary to obtain correct LV volume and mass measurements (I). When measuring LV mass and volumes, papillary muscles (PM) and through-plane motion of the heart are usually neglected, even though they can introduce a large bias. Sixty-three healthy volunteers (37 male), and 19-69 years, body mass index 17.4-31.5 kg/m', were exam- ined using a 1 .O-T (49 subjects) or a 1.5-T (I4 subjects) Siemens whole body system. Segmented k-space breathhold cine imaging was used for acquiring a stack of short-axis images covering the LV from base to apex. Slice thickness was 8 mm and slice gap was 2 mm. End-diastolic volume (EDV), end-diastolic mass (EDM), end-systolic mass (ESM), and PM mass (PMM) were calculated by slice summation. An addi- tional long-axis cine acquisition was performed in 15 volunteers to measure the LV long-axis systolic shortening. In the table below, the PM are considered as part of the EDV:
PMM PMMI Vol. PM Vol. PMI EDM (g/rn:) (&') EDM (Ye) EDV ( r n l h ' ) (rnllrn') EDV (%)
58.9 2 10.7 4.4 2 1.1 7 7 5 2.0 70.82 11.2 4.2 i 1.1 6.0" 1.7
The mean longitudinal shortening was 1 1.4 ? 8 mm (in earlier reports, 12 mm [?I). Because one cine is made every I0 mm, one basal image plane more is needed at end diastole (ED) than at end systole (ES) to cover the entire LV. This most basal plane shows the LV wall at ED but not at ES. If this most basal image plane was included, EDM and ESM were more alike (difference 11.1 t- 9.2 g) than when neglecting this plane (difference 29.5 ? 15.8 g). The ratios shown in the table are the relative underestimation of the EDM and overestimation of the EDV, if the PM are considered as a pan of the EDV. The contribution of the PM should thus be quantified when measuring LV volumes and mass. In these measurements, because of through-plane motion of the
LV Mass (g/kg) LVEDV (cc/kg) LVMlLVEDV (glcc) Peak Ejection Rate (EDV/s) Peak Filling Rate (EDV/s)
Control 1.87 t 0.07 1.39 ? 0.07 1.36 2 0.08 Diabetic 2.35 ? 0.06* 2.35 2 0.10* 1.01 2 O M *
9.71 -t 0.55 7.18 f 0.44*
10.3 2 0.81 8.4 2 0.55*
' p C 0.05
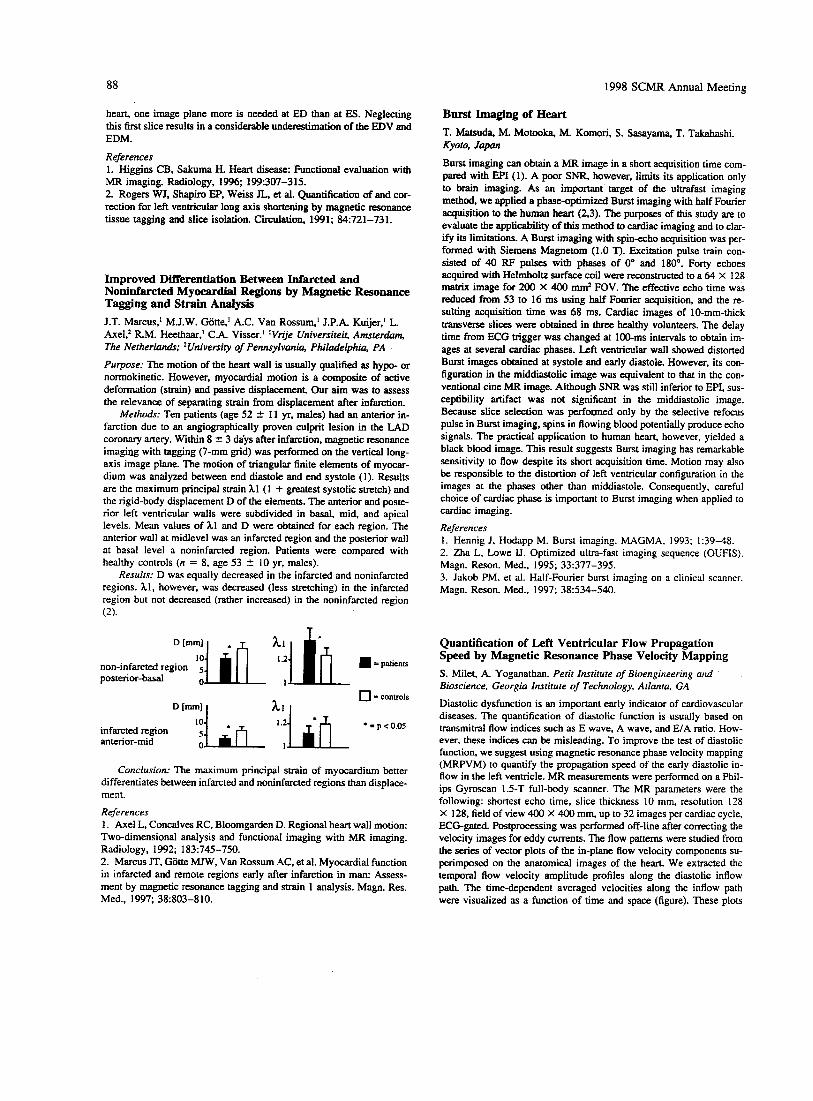
88 1998 SCMR Annual Meeting
Burst Imaging of Heart T. Matsuda, M. Motooka, M. Komori, S. Sasayama, T. Takahashi. Kyoto, Japm Burst imaging can obtain a MR image in a short acquisition time com- pared with EPI (1). A poor SNR, however, limits its application only to brain imaging. As an important target of the ultrafast imaging method, we applied a phase-optimized Burst imaging with half Fourier acquisition to the human heart (2,3). The purposes of this study are to evaluate the applicability of this method to cardiac imaging and to clar- ify its limitations. A Burst imaging with spin-echo acquisition was per- formed with Siemens Magnetom (1.0 T). Excitation pulse train con- sisted of 40 RF pulses with phases of 0" and 180". Forty echoes acquired with Helmholtz surface coil were reconstructed to a 64 X 128 matrix image for 200 X 400 mm2 FOV. The effective echo time was reduced from 53 to 16 ms using half Fourier acquisition, and the re- sulting acquisition time was 68 ms. Cardiac images of 10-mm-thick transverse slices were obtained in three healthy volunteers. The delay time from ECG trigger was changed at 1Wms intervals to obtain im- ages at several cardiac phases. Left ventricular wall showed distorted Burst images obtained at systole and early diastole. However, its con- figuration in the middiastolic image was equivalent to that in the con- ventional cine MR image. Although S N R was still inferior to EPI, sus- ceptibility artifact was not significant in the middiastolic image. Because slice selection was perfomed only by the selective refocus pulse in Bunt imaging, spins in flowing blood potentially produce echo signals. The pmtical application to human heart, however, yielded a black blood image. This result suggests Burst imaging has remarkable sensitivity to flow despite its short acquisition time. Motion may also be responsible to the distortion of left ventricular configuration in the images at the phases other than middiastole. Consequently, careful choice of cardiac phase is important to Burst imaging when applied to cardiac imaging.
References I . Hennig J, Hodapp M. Burst imaging. MAGMA, 1993; 1:39-48. 2. Zha L, Lowe U. Optimized ultra-fast imaging sequence (OUFIS). Magn. Reson. Med., 1995; 33:377-395. 3. Jakob PM. et al. Half-Fourier burst imaging on a clinical scanner. Magn. Reson. Med., 1997; 38:534-540.
heart, one image plane more is needed at ED than at ES. Neglecting this first slice results in a considerable underestimation of the EDV and EDM.
References 1. Higgins CB, Sakuma H. Hear& disease: Functional evaluation with MR imaging. Radiology, 1996; 1W307-315. 2. Rogers WJ, Shapiro EP, Weiss JL,, et al. Quantification of and cor- rection for left ventricular long axis shortening by magnetic resonance tissue tagging and slice isolation. Circulation. 1991; 84:721-731.
Improved Differentiation Between Infarcted and Noninfarcted Myocardial Regions by Magnetic Resonance Tagging and Strain Analysis J.T. Marcus,' M.J.W. Gotte,' A.C. Van Rossum,' J.P.A. Kuijer,' L. Axel? R.M. Heethaar,' C.A. Visser.' 'Vrije Universiteit. Amsterdam, The N e t h e r i d ; 2Universiry of Pennsylvania, Philadelphia, PA
Purpose: The motion of the heart wall is usually qualified as hypo- or normokinetic. However, myocardial motion is a composite of active deformation (strain) and passive displacement Our aim was to assess the relevance of separating strain from displacement after infarction.
Methods: Ten patients (age 52 2 11 yr. males) had an anterior in- farction due to an angiographically proven culprit lesion in the LAD coronary artery. Within 8 2 3 days after infarction, magnetic resonance imagiu with tagging (7-mm grid) was performed on the vertical long- axis image plane. The motion of triangular finite elements of myocar- dium was analyzed between end diastole and end systole (1). Results are the maximum principal strain hl ( 1 + greatest systolic stretch) and the rigid-body displacement D of the elements. The anterior and poste- rior left ventricular walls were subdivided in basal, mid, and apical levels. Mean values of hl and D were obtained for each region. The anterior wall at midlevel was an infarcted region and the posterior wall at basal level a noninfarcted region. Patients were compared with healthy controls (n = 8, age 53 2 10 yr, males).
Results: D was equally decreased in the infarcted and noninfarcted regions. hl , however, was decreased (less stretching) in the infarcted region but not decreased (rather increased) in the noninfarcted region (2).
T
D I ~ ~ I ] 0 ifi rn = patients 10
non-infarcted region 5
posterior-basal 0
infarcted region fi l.rj i n * =p<o.05 anterior-mid 0
Conclusion: The maximum principal strain of myocardium better differentiates between infarcted and noninfarcted regions than displace- ment.
References 1. Axel L, Concalves RC, Bloomgarden D. Regional heart wall motion: Two-dimensional analysis and functional imaging with MR imaging. Radiology, 1992; 183:745-750. 2. Marcus JT, Gotte UTW, Van Rossum AC, et al. Myocardial function in infarcted and remote regions early after infarction in man: Assess- ment by magnetic resonance tagging and strain 1 analysis. Magn. Res. Med., 1997; 382303-810.
Quantification of Left Ventricular Flow Propagation Speed by Magnetic Resonance Phase Velocity Mapping S. Milet, A. Yoganathan. Petit Institute of Bioengineering and Bioscience, Georgia Institute of Technology, Atlanta, GA
Diastolic dysfunction is an important early indicator of cardiovascular diseases. The quantification of diastolic function is usually based on transmitral flow indices such as E wave, A wave, and EIA ratio. How- ever, these indices can be misleading. To improve the test of diastolic function, we suggest using magnetic resonance phase velocity mapping (MRPVM) to quantify the propagation speed of the early diastolic in- flow in the left ventricle. MR measurements were performed on a Phil- ips Gyroscan 1.5-T full-body scanner. The MR parameters were the following: shortest echo time, slice thickness 10 mm, resolution 128 X 128, field of view 400 X 400 mm, up to 32 images per cardiac cycle, ECG-gated. Postprocessing was performed off-line after correcting the velocity images for eddy currents. The flow patterns were studied from the series of vector plots of the in-plane flow velocity components su- perimposed on the anatomical images of the heart. We extracted the temporal flow velocity amplitude profiles along the diastolic inflow path. The time-dependent averaged velocities along the inflow path were visualized as a function of time and space (figure). These plots
1998 SCMR Annual Meeting 89
show the velocity amplitude along the diastolic inflow path into the left ventricle during the entire cardiac cycle. For each plot the inflow propagation speed (PS) is computed as the slope of the diastolic inflow area Diastolic filling propagation speed can be computed in vivo using MRPVh4 of the left ventricular inflow. PS is a direct measurement of ventricular filling and has the potential to adequately quantify ventricu- lar chamber properties. The propagation speed index can be used in diseases where relaxation and filling pattern are affected, such as isch- emic heart disease or LV hypertrophy. This method provides a poten- tially powerful technique for the diagnosis of patients with diastolic dysfunction.
LV inflow velocity amplitudes as a function of time amd location.
Vortex Flow Demonstrated in the Healthy and the Dilated Left Ventricle by MR Velocity Mapping and an Automated Flow Pattern Recognition Method R.H. Mohiaddin, G.Z. Yang, D.N. Firmin, D.J. Pennell. Royal Brompron Hospiral, London, U K
Purpose: We describe an automated method for flow pattern recogni- tion and demonstrate its application for studying vortical flow in the normal and the dilated ischemic left ventricles (LV) using multidirec- tional MR velocity mapping. This is important because in left ventricu- lar disease, the disturbance of blood flow patterns within the ventricle may be important in maintaining or disrupting the blood flow in and out of the left ventricle.
Mezhods: Eight patients with dilated LV resulting from coronary artery disease and eight healthy subjects were studied. All patients were in sinus rhythm and had mild-to-moderate functional mitral valve regur- gitation. Cine gradient-echo images were acquired in the LV vertical and horizontal long axes (HLA) to measure LV volumes and ejection fractions using the biplane area-length method. Vertical and horizontal velocity components in the HLA plane of the LV were encoded simulta- neously by interleaving. Maps of velocity components acquired in the HLA plane of the LV were processed into multiple computer-generated streaks whose orientation, length, and movement corresponded to ve- locity vectors. Vortex flow is characterized by its circular or swirling motion and is recognized using ordinary differential equations to pro-
vide local linearization to the acquired multidirectional M R velocity data The size and the travel distance of each vortex are automatically tracked through the entire plane during the entire cardiac cycle.
Resulrs: in normal subjects the predominant direction of diastolic flow through the mitral valve was toward the apex, with short-lived vortices curling back behind each mitrallaflet at early and late phases of LV filling. In patients with dilated LV, the inflow was directed not toward the apex but toward the free wall, giving rise to a well-developed circular flow pattern turning back toward the septum and outflow tract and persisting through diastole. The following parameters (mean 2 SD) differed significantly between the two groups: heart rate (patients 70 t- 11 beat/min, controls 57 t- 8, p < 0.001), end-diastolic volume (patients 264 2 83 ml, controls 143 2 25 ml, p < 0.001). ejection fraction (patients 31% 2 7, controls 61% t 5, p < 0.001), the maxi- mum diastolic size and the travel distance of the vortex below the septal leaflet of the mitral valve (patients 12.7 t- 2.0 cm2, 3.4 t 0.8 cm2, controls 8.5 t- 2.5 cm2, 2.6 t- 0.5 cm, p < 0.003, p < 0.02).
Conclusion: The ability of an automated method for measuring the topological features of vortical flow in the normal and dilated LV was demonstrated in healthy volunteers and in patients with dilated ischemic LV. The diastolic size and the travel distance of the vortex below the septal mitral valve leaflet are significantly larger in the patients than in the healthy volunteers. This technique may prove invaluable in under- standing the fluid mechanics in the normal and dilated LVs.
Alignment and Visualization of Quantitative and Qualitative Data from Cardiac Studies in MRI, SPECT and PET S. Nekolla, U. Schricke, F. Roder, M. Schwaiger. Nukleamedizinische Klinik rechts der Isar der TU, Miinchen, Germany
Purpose; We demonstrated the feasibility of a semiautomated coregis- tration and fusion tool for inter- and intramodal PET, SPECT, and MRI image and polar map data.
Methods: Within the cardiac software environment “Mu- nichHeart” developed in our department, several modules allow for the delineation of cardiac contours and calculation of regional parameters. For gated MRI studies, the manual definition of endo- and epicardial borders in ED and ES is supported. Using PET or SPECT studies, after manual definition of the long axis, automatically maximum count sur- faces or endo- and epicardial surfaces through the cardiac cycle are delineated, encompassing the left ventricle. Subsequently. surface data from any two studies are used to align them initially using geometric properties. Because the high rotational symmetry along the heart’slong axis, a user interaction is allowed to adjust the posterior junctions of left and right ventricle as defined during the calculation of the polar maps. Finally, the surfaces are matched automatically. After accepting the optimal coregistration, the quantitative information (i.e., the data represented in polar map or “bullseye” format) are projected onto the reference data set to provide an exact spatial alignment. During all steps advanced visualization features are supplied display of orthogonal slices of original and overlay images in 2D and fully interactive 3D together with the cardiac surfaces with the various quantitative informa- tion mapped onto them.
Results: Depending on the selected surface, multimodality coregis- tration (e.g., endocardial surface MIBI-SPECT and MRI in ED) yielded minimal mean distances of less than 2.5 mm. Using single modality multitracer studies of the same patient (e.g., FDGINH, PET viability), a minimal mcan distance between the two surfaces of less than 1.5 mm could be achieved.
Conclusion: For both clinical purposes, like the precise alignment in rest/stress and follow-up studies, and scientific issues, such as the
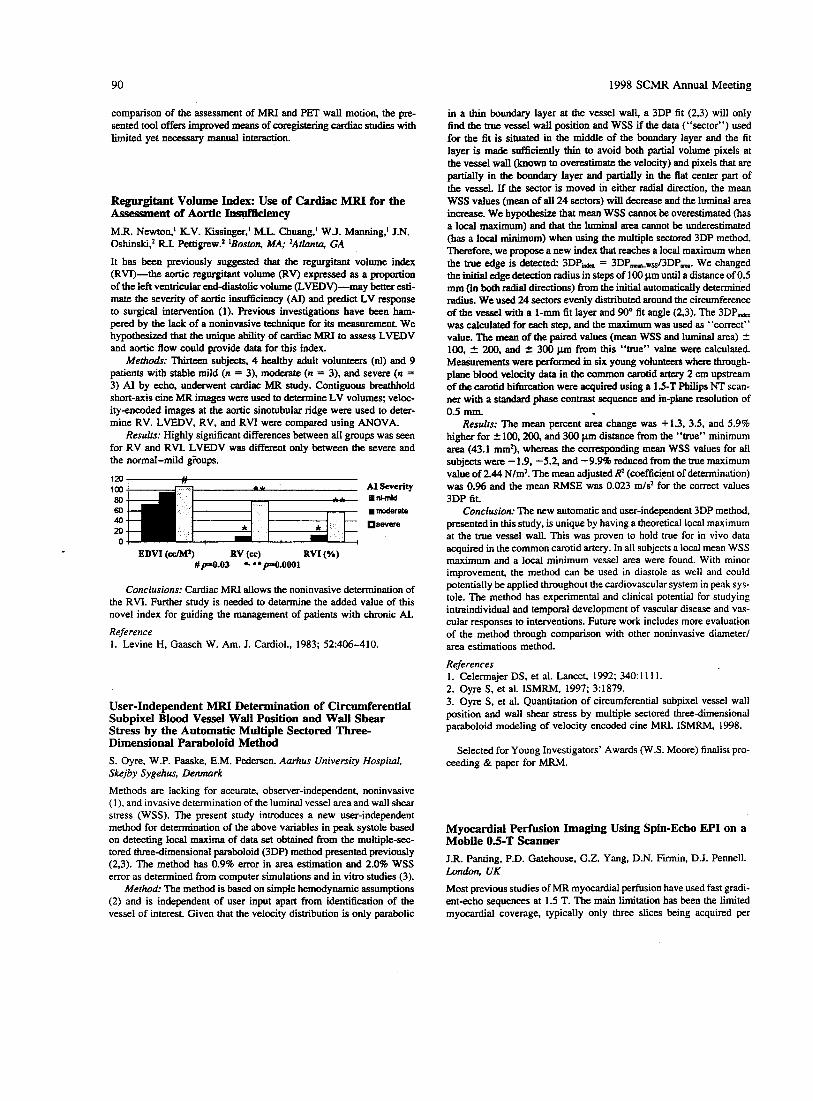
90 1998 SCMR Annual Meeting
comparison of the assessment of MRI and PET wall motion, the pre- sented tool offers improved means of coregistering cardiac studies with limited yet necessary manual interaction.
Regurgitant Volume Index: Use of Cardiac MRI for the Assessment of Aortic Iasut?iciency M.R. Newton,l K.V. Kissinger,’ M.L. Chuang.’ W.J. Manning,’ J.N. 0shinski.Z R.I. Pettigrew? lBoston, MA; 2AtZunzu, GA
It has been previously suggested that the regurgitant volume index (RVI)-the aortic regurgitant volume (RV) expressed as a proportion of the left ventricular end-diastolic volume (LVEDV)-may better esti- mate the severity of aortic insufficiency (AI) and predict LV response to surgical intervention (1). Previous investigations have been ham- pered by the lack of a noninvasive technique for its measurement We hypothesized that the unique ability of cardiac MRI to assess LVEDV and aortic flow could provide data for this index.
Metho&: Thirteen subjects, 4 healthy adult volunteers (nl) and 9 patients with stable mild (n = 3), moderate (n = 3), and severe (n = 3) AI by echo, underwent cardiac MR study. Contiguous breathhold short-axis cine MR images were used to determine LV volumes; veloc- ity-encoded images at the aortic sinotubular ridge were used to deter- mine RV. LVEDV, RV, and RVI were compared using ANOVA.
Results: Highly significant differences between all groups was seen for RV and RVI. LVEDV was different only between the severe and the normal-mild @ups.
AI severity mncniti .moderate
severe
;;;Fj 40
M 0
EDVI (&) RV (@ RVI (Ye) #/~=O.03 *. * * ~ . O O O l
Conclusions: Cardiac MRI allows the noninvasive determination of the RVI. Further study is needed to determine the added value of this novel index for guiding the management of patients with chronic AI. Reference 1. Levine H, Gaasch W. Am. J. Cardiol., 1983; 52:406-410.
User-Independent MRI Determination of Circumferential Subpixel Blood Vessel Wall Position and Wall Shear Stress by the Automatic Multiple Sectored Three- Dimensional Paraboloid Method S. Oyre, W.P. Paaske, E.M. Pedersen. Aarhus University Hospital. Skejby Sygehus, Denmark
Methods are lacking for accurate, observer-independent, noninvasive ( I ) , and invasive determination of the luminal vessel area and wall shear srress (WSS). The present study introduces a new user-independent method for determination of the above variables in peak systole based on detecting local maxima of data set obtained from the multiple-sec- tored three-dimensional paraboloid (3DP) method presented previously (2,3). The method has 0.9% error in area estimation and 2.0% WSS error as determined from computer simulations and in vitro studies (3).
Method: The method is based on simple hemodynamic assumptions (2) and is independent of user input apart from identification of the vessel of interest. Given that the velocity distribution is only parabolic
in a thin boundary layer at the vessel wall, a 3DP fit (2,3) will only find the uue vessel wall position and WSS if the data (“sector”) used for the fit is situated in the middle of the boundaty layer and the fit layer is made sufficiently thin to avoid both partial volume pixels at the vessel wall (known to overestimate the velocity) and pixels that are partially in the boundary layer and partially in the flat center part of the vessel. If the sector is moved in either radial direction, the mean WSS values (mean of all 24 sectors) will decrease and the luminal area in-- We hypothesize that mean WSS cannot be overestimated (has a local maximum) and that the luminal area cannot be underestimated (has a local minimum) when using the multiple sectored 3DP method. Therefore, we propose a new index that reaches a local maximum when the true edge is detected: 3DP- = 3DPmwss/3DPm. We changed the initial edge detection radius in steps of 100 pm until a distance of 0.5 mm (in both radial directions) from the initial automatically determined radius. We used 24 sectors evenly distributed around the circumference of the vessel with a 1-mm fit layer and 90” fit angle (2.3). The 3DPmd, was calculated for each step, and the maximum was used as “correct” value. The mean of the paired values (mean WSS and luminal area) 2 100, 2 200. and ir 300 pm from this “true” value were calculated. Measurements were p e r f o d in six young volunteers where through- plane blood velocity data in the common carotid artery 2 cm upstream of the carotid bifurcation were acquired using a 1.5-T Philips NT scan- ner with a standard phase contrast sequence and in-plane resolution of 0.5 nun.
Results: The mean percent area change was + 1.3, 3.5, and 5.9% higher for ir 100,200, and 300 pm distance from the “true” minimum area (43.1 mm3, whereas the corresponding mean WSS values for all subjects were -1.9, -5.2, and -9.9% reduced from the true maximum value of 2.44 N/m2. The mean adjusted R2 (coefficient of determination) was 0.96 and the mean RMSE was 0.023 m/s2 for the correct values 3DP fit
Conclusiotr The new automatic and user-independent 3DP method, presentedin this study, is unique by having a theoretical local maximum at the true vessel wall. This was proven to hold true for in vivo data acquired in the common carotid artery. In all subjects a local mean WSS maximum and a local minimum vessel area were found. With minor improvement, the method can be used in diastole as well and could potentially be applied throughout the cardiovascular system in peak sys- tole. The method has experimental and clinical potential for studying intraindividual and temporal development of vascular disease and vas- cular responses to interventions. Future work includes more evaluation of the method through comparison with other noninvasive diameter/ area estimations method.
References 1. Celermajer DS, et al. Lancet, 1992; 340: 11 11. 2. Oyre S, et al. ISMRM, 1997; 3:1879. 3. Oyre S, et al. Quantitation of circumferential subpixel vessel wall position and wall shear stress by multiple sectored three-dimensional paraboloid modeling of velocity encoded cine MRI. ISMRM, 1998.
Selected for Young Investigators’ Awards (W.S. Moore) finalist pro- ceeding & paper for MRM.
Myocardial Perfusion Imaging Using Spin-Echo EPI on a Mobile 0.5-T Scanner J.R. Panting, P.D. Gatehouse, G.Z. Yang, D.N. Firmin, D.J. Pennell. London. UK Most previous studies of MR myocardial perfusion have used fast gradi- ent-echo sequences at 1.5 T. The main limitation has been the limited myocardial coverage, typically only three slices being acquired per

1998 SCMR Annual Meeting 91
heartbeat due to long acquisition times (200-300 ms per slice). To ob- tain greater coverage, spin-echo EPI with acquisition times of between 50 and 100 ms have been suggested. We report our experience of using this type of sequence at 0.5 T. We studied 36 subjects. Of these, 26 were patients with coronary disease who underwent single-slice, one- shot, inversion-recovery, spin-echo EPI at rest and during stress with 140 pg/kg/min adenosine for maximal coronary hyperemia. The im- ages were corrected for motion and assessed by visual analysis of the dynamic series, parametric mapping, and construction of signal inten- sity versus time curves. The results were compared with SPECT. Meth- ods of achieving multislice acquisitions were then investigated. Studies were carried out on eight normal subjects, four using a single, nonslice- selective, 180" inversion pulse (SIP) 200 ms before imaging the slices in rapid succession and four using multiple, nonslice-selective, inver- sion pulses (MIP) of between 90" and 120" 100 ms before each slice acquisition. Comparative studies of patients with ischemic heart disease are now underway. The single-slice study showed good correlation with SPECT, achieving 80% concordance in the detection of perfusion de- fects. For the multislice technique, SIP resulted in varying baseline sig- nal intensity depending on the length of time after the inversion pulse to slice acquisition. Despite this, the net signal change with contrast was similar, and all five slices were assessable. The MIP method gave uniform baseline intensity, but as a result of the inversion delay. the number of slices was typically limited to three. Initial experience of the SIP technique in five patients with CAD showed good ventricular coverage and good correlation with SPECT. With further development, this technique is a candidate rival for SPECT in clinical practice; how- ever, large comparative studies are required.
Left Ventricular Mass by Echocardiography and Magnetic Resonance G. Pons-Llad6, F. Cameras. X. Borris, J. Llauger. J. Palmer, A BayCs de Luna. Barcelona, Spain
The aim of the present study was to compare values of left ventricular mass (LVM) obtained by M-mode echocardiography (ECHO) with those from magnetic resonance imaging (MRI). Also, a simplified method of calculation of LVM by MRI was tested. Both ECHO and MRI studies were performed on an unselected series of 35 patients (28 males and 7 females aged 13-85; mean. 41 -t 18) with the following clinical diagnosis: 12 with symmetrical left ventricular hypertrophy due to hypertension (10) or aortic valve disease (2); 6 with hypertrophic cardiomyopathy of the asymmetrical type; 6 with ischemic heart dis- ease, including a previous myocardial infarction; 6 with a structurally normal heart; and 5 patients with miscellaneous diseases. ECHO calcu- lations were performed using two different formulas: Penn's convention method and American Society of Echocardiography (ASE) method. The MRI technique of summation of contiguous short-axis slices of the left ventricle on a spin-echo sequence was used as a reference against which ECHO measurements were compared. Also, a simplified MRI method of estimation of LVM based on Simpson's rule applied on a single long-axis left ventricular plane was also tested. Results showed that ECHO studies, which could not be applied due to technical limita- tions in 2 of 35 patients, systematically overestimated values of LVM by MRI, although results from the ASE method agreed more closely with MRI than those obtained by Penn's method (Figs. 1 and 2). h g e overestimation persisted, however, in some cases, accounting for more than 50% of values calculated by MRI in five patients, all of them with either asymetrical septal hypertrophy or with a grossly distorted left ventricular shape due to a previous infarction. On the other hand, the simplified method of calculation of LVM by MRI using a single long- axis plane showed an excellent correlation with the method of summa- tion of contiguous short axis slices (Fig. 3).
! a, '. n=33
r =.74
,'*
I E
1 ,-•
-t-------l 0 i:-- -7.--- -i
0 100 200 300 400 Single plane method
Figure 3
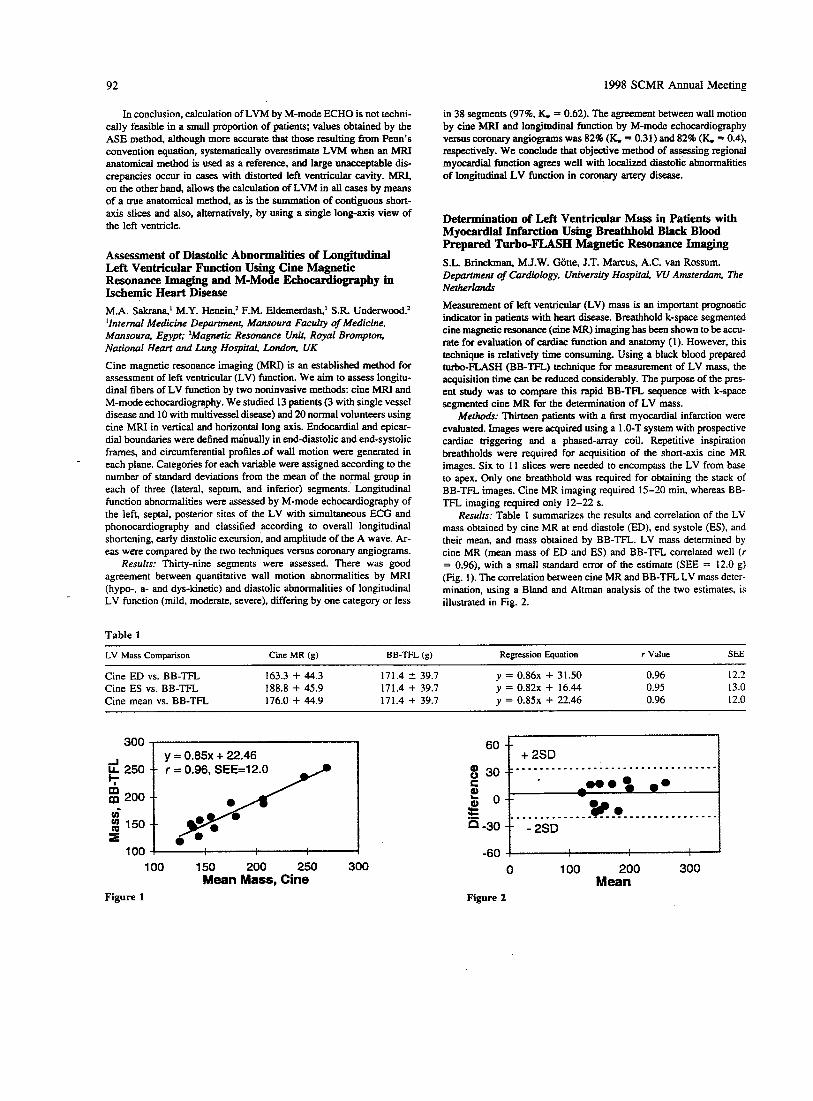
92 1998 SCMR Annual Meeting
In conclusion, calculation of LVM by M-mode ECHO is not techni- cally feasible in a small proportion of patients; values obtained by the ASE method, although more accurate that those resulting from Penn's convention equation, systematically overestimate LVM when an MFU anatomical method is used as a reference, and large unacceptable dis- crepancies occur in cases with distorted left ventricular cavity. MRI, on the other hand, allows the calculation of LVM in all cases by means of a true anatomical method, as is the summation of contiguous short- axis slices and also, alternatively. by using a single long-axis view of the left ventricle.
Assessment of Diastolic Abnormalities of Longitudinal Left Ventricular Function Using Cine Magnetic Resonance Imaging and M-Mode Eehocarcliography in Ischemic Heart Disease M.A. Sakrana,' M.Y. Henein,* F.M. Eldemerdash,' S.R. Underwood? 'Internal Medicine Department, Mansoura Faculty of Medicine, Mansoura, Egypt; zMagnetic Resonance Unit, Royal Brompton, National Heart and Lung HospitaL, London, UK Cine magnetic resonance imaging (MRI) is an established method for assessment of left ventricular (LV) function. We aim to assess longitu- dinal fibers of LV function by two noninvasive methods: cine MRI and M-mode echocardiography. We studied 13 patients (3 with single vessel disease and 10 with multivessel disease) and 20 normal volunteers using cine MRI in vertical and horizontal long axis. Endocardial and epicar- dial boundaries were defined ma'nually in end-diastolic and end-systolic frames, and circumferential profilesnf wall motion were generated in each plane. Categories for each variable were assigned according to the number of standard deviations from the mean of the normal group in each of three (lateral, septum, and inferior) segments. Longitudinal function abnormalities were assessed by M-mode echocardiography of the left, septal, posterior sites of the LV with simultaneous ECG and phonocardiography and classified according to overall longitudinal shortening, early diastolic excursion, and amplitude of the A wave. Ar- eas were compared by the two techniques versus coronary angiograms.
Results: Thirty-nine segments were assessed. There was good agreement between quantitative wall motion abnormalities by MRI (hypo-, a- and dys-kinetic) and diastolic abnormalities of longitudinal LV function (mild, moderate, severe), differing by one category or less
Table 1
in 38 segments (97% K. = 0.62). The agreement between wall motion by cine MRI and longitudinal function by M-mode echocardiography versus coronary angiograms was 82% (K. = 0.31) and 82% (K. = 0.4), respectively. We conclude that objective method of assessing regional myocardial function agrees well with localized diastolic abnormalities of longitudinal LV function in coronary artery disease.
Determination of Left Ventricular Mass in Patients with Myocardial Infarction Using Breathbold Black Blood Prepared Turbo-FLASH Magnetic Resonance Imaging S.L. Brinckman, M.J.W. Gone, J.T. Marcus, A.C. VM Rossum. D e p a m e n t of Cardiology, University Hospital, VU Amsterdam. The Netherlcurds Measurement of left ventricular (LV) mass is an important prognostic indicator in patients with heart disease. Breathhold k-space segmented cine magnetic resonance (cine MR) imaging has been shown to be accu- rate for evaluation of cardiac function and anatomy (1). However, this technique is relatively time consuming. Using a black blood prepared turbo-FLASH (BB-TFL) technique for measurement of LV mass, the acquisition time can be reduced considerably. The purpose of the pres- ent study was to compare this rapid BB-TFL sequence with k-space segmented cine MR for the determination of LV mass.
Merho&: Thirteen patients with a first myocardial infarction were evaluated. Images were acquired using a 1 .O-T system with prospective cardiac triggering and a phased-array coil. Repetitive inspiration breathholds were required for acquisition of the short-axis cine MR images. Six to 11 slices were needed to encompass the LV from base to apex. Only one breathhold was required for obtaining the stack of BB-TFL images. Cine MR imaging required 15-20 min, whereas BB- TFL imaging required only 12-22 S.
Results: Table 1 summarizes the results and correlation of the LV mass obtained by cine MR at end diastole (ED), end systole (ES), and their mean, and mass obtained by BB-TFL. LV mass determined by cine MR (mean mass of ED and ES) and BB-TFL correlated well ( r = 0.96), with a small standard error of the estimate (SEE = 12.0 g) (Fig. 1). The correlation between cine MR and BB-TFL LV mass deter- mination, using a Bland and Altman analysis of the two estimates, is illustrated in Fig. 2.
LV Mass Comparison Cine MR (g) BB-TFL (g) Regression Equation r Value SEE
Cine ED vs. BB-TFL 163.3 + 44.3 171.4 2 39.7 y = 0 . 8 6 ~ + 31.50 0.96 12.2
Cine mean vs. BB-TFL 176.0 + 44.9 171.4 + 39.7 y = 0 .85~ + 22.46 0.96 12.0 Cine ES vs. BB-TFL 188.8 + 45.9 171.4 + 39.7 y = 0 . 8 2 ~ + 16.44 0.95 13.0
300 a 1
250
200
150
1 00
y = 0.85~ + 22.46 = 0.96, SEE=12.0 - t I
100 150 200 250 300 Mean Mass, Cine
Figure 1
6o t r ,
-60 0 100 200 300
Mean Figure 2

r . . . Conchion: BB-TFL. has a comparable accuracy to cine MR for . . . . . . . . , . , - . , . . * * n I J - . , . l U / determination of LV mass and reduces image acquisition time approxi-
mately by a factor of 10. ' ; < ; : : ; : , - - . # . L ' , , , , , , , , * - . . . - .
breath-hold cine MR imaging. Radiology, 1993; 188(2):377-380. I . - . - . . . , , , , . . , / / / I I . I . . , , . , .
, . , , , , I , , I . . . * . -
. . , . * , , , . , . . . - . Reference 1. Sakuma H. Evaluation of left ventricular volume and mass with . _ . . . . , . . ) . . . . . , . . , . . . . . .
/ I / . . . . , . , , , , , . / / ( L / x : ; : : : ! : : < :
Effects of Maxwell Terms on Particle Traces Calculated from 3D Cine Phase-Contrast Images L. Wigstrorn,' T. Ebbers,' A. Fyrenius,' M. Karlsson,' J. Engvall,' B. Wranne,' A.F. Bolger? 'Linkoping Universi?. Sweden; *Universify of California Riverside, CA
The complex patterns of intracardiac flow can be visualized in an intu- itive way using particle traces obtained from 3D phase-conmt data (1). Phase contrast has been shown to be sensitive to shading artifacts induced by eddy currents and Maxwell terms, however. The effects of eddy currents can be compensated for by subtraction of a linear function from the acquired velocity data (2). The Maxwell terms can be calcu- lated, because the pulse sequence is known (3). We used a stationary phantom to determine the impact of Maxwell terms on particle traces derived from phase-contrast data. The study was performed using a Signa Horizon EchoSpeed scanner (GE Medical Systems, Milwaukee, WI) and a 3D cine phase contrast pulse sequence (256 X 96 X 16 matrix, FOV 30 X 30 X 12.8 cm, TR 18 ms, TE 6 ms, VENC 60 cm/ s) (4). The correction for the Maxwell terms was performed by calculat- ing the phase error from the gradient waveforms according to Bernstein et al. (3). Figures I and 2 show particle traces obtained by integrating the velocity field during 0.5 s, starting from a 16 X 16 grid through the center of the 3D phantom. Figure 1 shows the particle traces created without correction for Maxwell terms and Figure 2 the traces with cor- rection performed before their calculation. In both cases, a 3D linear function was fitted and subtracted to compensate for eddy current ef- fects. Without correction for Maxwell terms, some of the particle traces extended more than 3 cm from their starting points. Because the phase error due to the Maxwell terms is a nonlinear function of the distance from the center of the magnet, the effects on particle traces will be largest in the image periphery. When studying left ventricular flow pat- terns, these effects will be most severe at the apex and may cause some particle traces to drift outside the heart. Correction for eddy currents and Maxwell terms is therefore important when applying particle trace techniques to 3D phase-contrast data for the study of intracardiac
Figure 2.
References 1. Wigstrijrn L, Karlsson M, Bolger AF, Wranne B. ESMRMB, Prague, 1996; p. 158. 2. Pelc NJ, Herfkens FU, Shimakawa A, Enzmann DR. Magn. Reson.
3. Bernstein MA, Zhou X, King KF, Ganin A, Pelc Nl, Glover GH. SMR, Vancouver, 1997; p. 110. 4. Wigstrom L, Sjijqvist L, Wranne B. MRM, 1996; 36:800-803.
With correction for Maxwell terms.
Q., 1991; 7:229-254.
Wavelet-Packet Denoising of Echoplanar and Fast-Card Images John C. Wood, Kevin Johnson. New Haven, CT High-spatial resolution is imperative for coronary artery imaging, but voxel size is limited by signal-to-noise ratio (SNR). Decreased band- width and increased NEXs improves SNR but at a "cost" of motional blurring and increased exam time. Consequently, postprocessing tech- niques to improve SNR are attractive. One such approach, wavelet- packet denoising, can produce striking improvements in magnetic reso- nance images, particularly in images with low S N R and modest spatial frequencies (1). Therefore, we sought to quantitate the tradeoff between noise suppression and edge preservation in a high contrast, sharply de- marcated, "myocardial" phantom using a commercially available wavelet-packet promoram (2). Specifically, changes in SNR, signal-to- background ratio (SBR), "myocardial" wall full width-half maximum (FWHM), and edge width (EW, defined as the distance from 25% maxi- mum to 75% maximum) were measured in I , 2.4, 8, 16, and 32 NEX single-shot echoplanar images images pre- and postdenoising. Median and Wiener filtering was performed for comparison (3). All three meth- ods were also subjectively evaluated for blurring and artifact on Fast- Card and echoplanar cardiac images from normal volunteers.
Results: Denoising produced a 2: 1 improvement in SBR and a 1.5 : 1 SNR improvement for 1,2, and 4 NEX images (single-shot SNR 8.8). For higher NEXs, denoising yielded diminishing SNR returns; never- theless, SNR improved 25% for a 32 NEX image without loss of detail. SBR improvement ranged between 1.7 and 2 Denoising did not in- crease the FWHM, in contrast to median filtering. Wiener filtering did not increase FWHM or EW, but SNR improvement was only 25% for 1 Nex and 2% for 32 Nex images, respectively. Most importantly,
free. Wavelet-packet denoising can improve SNR/SBR without sacri- ficing image clarity, even in images with high contrast and spatial fre- quencies, and may faciIitate coronary artery imaging.
References 1. Woog L. Ph.D. Thesis, Department of Mathematics, Yale Univer- sity. 2. Coifman RR, Wieckerhauser MV. Numerical Algorithms Research Group, Department of Mathematics, Yale University. 3. Matlab Image Processing Library. The Math Works Inc., 24 Prime Park Way, Natick, MA 01760.
now.
R/L (x) 24 cm 4 b wavelet-denoised phantom and cardiac images were sharp and artifact
sfi (z) 10 cm I Figure 1. Without correction for Maxwell terms.
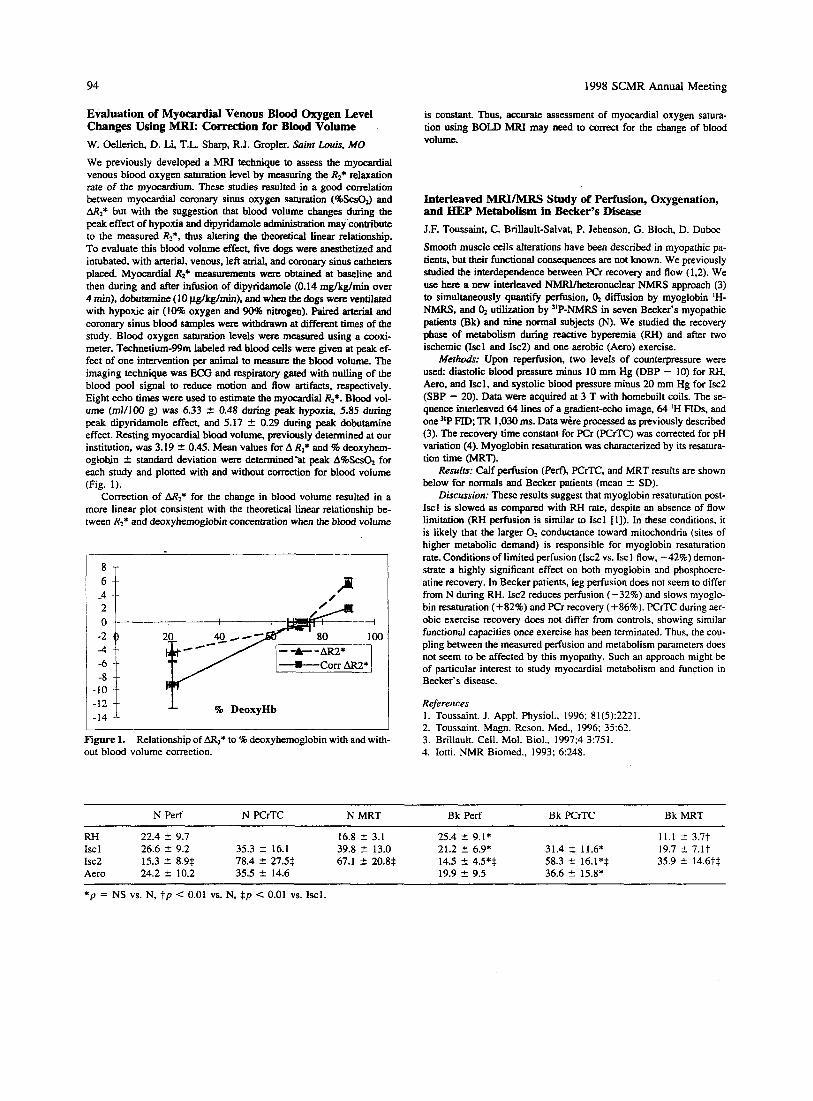
94 1998 SCMR Annual Meeting
Evaluation of Myocardial Venous Blood Oxygen Level Changes Using MRI: Correction for Blood Volume W. Oellerich, D. Li, T.L. Sharp, RJ. Gropler. Saint Louis, MO We previously developed a MRI technique to assess the myocardial venous blood oxygen saturation level by measuring the Rz* relaxation rate of the myocardium. These studies resulted in a good correlation between myocardial coronary sinus oxygen saturation (%ScsO3 and AR2* but with the suggestion that blood volume changes during the peak effect of hypoxia and dipyridamole administration may contribute to the measured R2*. thus altering the theoretical Linear relationship. To evaluate this blood volume effect, five dogs were anesthetized and intubated, with arterial, venous, left atrial, and coronary sinus catheten placed Myocardial R2* measurements were obtained at baseline and then during and after infusion of dipyridamole (0.14 mglkglrnin over 4 min), dobutamine ( 10 pg/kg/min). and when the dogs were ventilated with hypoxic air (10% oxygen and 90% nitrogen). Paired arterial and coronary sinus blood samples were withdrawn at different times of the study. Blood oxygen saturation levels were measured using a cooxi- meter. Technetium-99m labeled red blood cells were given at peak ef- fect of one intervention per animal to measure the blood volume. The imaging technique was ECG and respiratory gated with nulling of the blood pool signal to reduce motion and flow artifacts, respectively. Eight echo times were used to estimate the myocardial Rz*. Blood vol- ume (m1/100 g) was 6.33 4 0.48 during peak hypoxia, 5.85 during peak dipyridamole effect, and 5.17 2 0.29 during peak dobutamine effect. Resting myocardial blood volume, previously determined at our institution, was 3.19 t 0.45. Mean values for A R2* and % deoxyhem- oglobjn 2 standard deviation were determined-at peak A%ScsG for each study and plotted with and without correction for blood volume (Fig. 1).
Correction of M2* for the change in blood volume resulted in a more linear plot consistent with the theoretical linear relationship be- tween R2* and deoxyhemoglobin concentration when the blood volume
1:;: f 9% DeoxyHb
Figure 1. out blood volume correction.
Relationship of AR2* to % deoxyhemoglobin with and with-
is constant. Thus, accurate assessment of myocardial oxygen satura- tion using BOLD MRI may need to c o m t for the change of blood volume.
Interleaved MRYMRS Study of Perfusion, Oxygenation, and BEP Metabolism in B e e r ' s Disease J.F. Toussaint, C. Brillault-Salvat, P. Jehenson, G. Blcch, D. Duboc
Smooth muscle cells alterations have been described in myopathic pa- tients, but their functional consequences are not known. We previously studied the interdependence between PCr recovery and flow (1.2). We use here a new interleaved NMRYheteronuclear NMRS approach (3) to simultaneously quantify perfusion, 4 diffusion by myoglobin 'H- NMRS, and O2 utilization by "P-NMRS in seven Becker's myopathic patients (Bk) and nine normal subjects (N). We studied the recovery phase of metabolism during reactive hyperemia (RH) and after two ischemic (Iscl and 1x2) and one aerobic (Aero) exercise.
Merhods: Upon reperfusion, two levels of counterpressure were used: diastolic blood pressure minus 10 mm Hg (DBP - 10) for RH, Aero, and Iscl. and systolic blood pressure minus 20 mm Hg for Isc2 (SBP - 20). Data were acquired at 3 T with homebuilt coils. The se- quence interleaved 64 lines of a gradient-echo image, 64 'H FTDs, and one "P FID; TR 1,030 ms. Data wire processed as previously described (3). The recovery time constant for PCr (PCrTC) was corrected for pH variation (4). Myoglobin resaturation was characterized by its resatura- tion time (MRT).
Resufrs: Calf perfusion (PerQ), PCrTC, and MRT results are shown below for normals and Becker patients (mean t SD).
Discussion: These results suggest that myoglobin resaturation post- Iscl is slowed as compared with RH rate, despite an absence of flow limitation (RH perfusion is similar to Iscl [I]). In these conditions, it is likely that the larger O2 conductance toward mitochondria (sites of higher metabolic demand) is responsible for myoglobin resaturation rate. Conditions of limited perfusion (Isc2 vs. Iscl flow, -42%) demon- strate a highly significant effect on both myoglobin and phosphocre- atine recovery. In Becker patients, leg perfusion does not seem to differ from N during RH. 1x2 reduces perfusion (-32%) and slows myoglo- bin resaturation (+82%) and PCr recovery (+86%). PCrTC during aer- obic exercise recovery does not differ from controls, showing similar functional capacities once exercise has been terminated. Thus, the cou- pling between the measured perfusion and metabolism parameters does not seem to be affected by this myopathy. Such an approach might be of particular interest to study myocardial metabolism and function in Becker's disease.
References 1. Toussaint. J. Appl. Physiol., 1996; 8 1(5):222 I . 2. Toussaint. Magn. Reson. Med., 1996; 35:62. 3. Brillault. Cell. Mol. Biol., 1997;4 3:751. 4. Iotti. NMR Biomed., 1993; 6:248.
N Perf N PCrTC N MRT Bk Perf Bk PCrTC Bk MRT
RH 22.4 4 9.7 16.8 4 3.1 25.4 t- 9.1 * 11.1 2 3.7t Isc 1 26.6 2 9.2 35.3 2 16.1 39.8 2 13.0 21.2 f 6.9* 31.4 Z 11.6* 19.7 2 7.lt 1x2 15.3 2 8.9$ 78.4 C 27.5$ 67.1 C 20.8$ 14.5 4 4.5*$ 58.3 2 16.1*$ 35.9 t- 14.6t$ Aero 24.2 2 10.2 35.5 4 14.6 19.9 4 9.5 36.6 2 15.8*
* p = NS vs. N, t p < 0.01 vs. N, $p < 0.01 VS. Iscl.
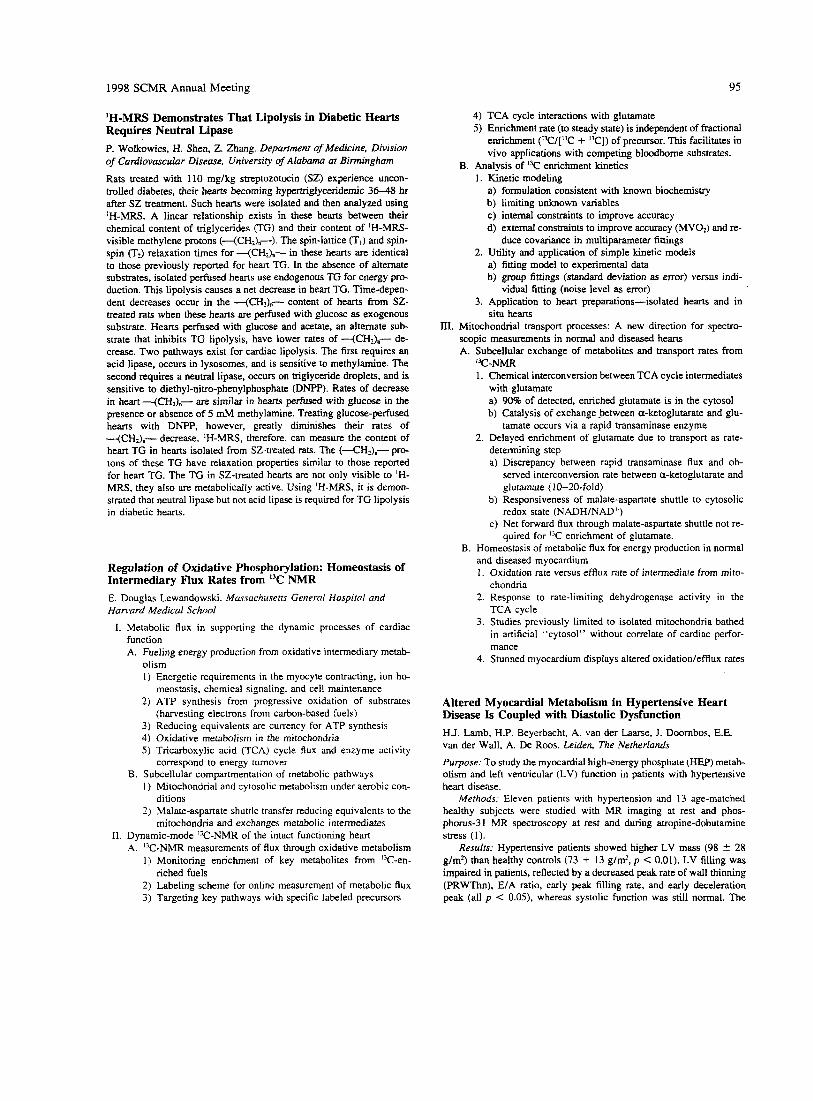
1998 S C M R Annual Meeting 95
'H-MRS Demonstrates That Lipolysis in Diabetic Hearts Requires Neutral Lipase P. Wolkowics, H. Shen, Z. Zhang. Department of Medicine, Division of Cardiovascular Disease, University of Alabuma at Birmingham
Rats treated with 110 mglkg streptozotocin (SZ) experience uncon- trolled diabetes, their hearts becoming hypertriglyceridemic 36-48 hr after SZ treatment. Such hearts were isolated and then analyzed using 'H-MRS. A linear relationship exists in these hearts between their chemical content of triglycerides (TG) and their content of 'H-MRS- visible methylene protons (--(CH2)"-). The spin-lattice (TI) and spin- spin (T2) relaxation times for -(CH2h- in these hearts are identical to those previously reported for heart TG. In the absence of alternate substrates, isolated perfused hearts use endogenous TG for energy pro- duction. This lipolysis causes a net decrease in heart TG. Time-depen- dent decreases occur in the -(CH2)"- content of hearts from SZ- treated rats when these hearts are perfused with glucose as exogenous substrate. Hearts perfused with glucose and acetate, an alternate sub- strate that inhibits TG lipolysis, have lower rates of -(CH2)"- de- crease. Two pathways exist for cardiac lipolysis. The first requires an acid lipase, occurs in lysosomes, and is sensitive to methylamine. The second requires a neutral lipase, occurs on triglyceride droplets, and is sensitive to diethyl-nitro-phenylphosphate (DNPP). Rates of decrease in heart -(CH?),,- are similar in hearts pe&sed with glucose in the presence or absence of 5 mh4 methylamine. Treating glucose-perfused hearts with DNPP, however, greatly diminishes their rates of +CH&-- decrease. IH-MRS, therefore, can measure the content of heart TG in hearts isolated from SZ-treated rats. The (<HI)"- prc- tons of these TG have relaxation properties similar to those reported for heart TG. The TG in SZ-treated hearts are not only visible to 'H- MRS, they also are metabolically active. Using 'H-MRS, i t is demon- strated that neutral lipase but not acid lipase is required for TG lipolysis in diabetic hearts.
Regulation of Oxidative Phosphorylation: Homeostasis of Intermediary Flux Rates from I3C NMR E. Douglas Lewandowski. Mussuchusetrs General Hospital and Hanvard Medicd School
I. Metabolic flux in supporting the dynamic processes of cardiac function A. Fueling energy production from oxidative intermediary metab-
olism I ) Energetic requirements in the myocyte contracting, ion ho-
2) ATP synthesis from progressive oxidation of substrates
3) Reducing equivalents are currency for ATP synthesis 4) Oxidative metabolism in the mitochondria 5 ) Tricarboxylic acid (TCA) cycle flux and enzyme activity
meostasis, chemical signaling, and cell maintenance
(harvesting electrons from carbon-based fuels)
correspond to energy turnover B. Subcellular compartmentation of metabolic pathways
1 ) Mitochondrial and cytosolic metabolism under aerobic con-
2) Malate-aspartate shuttle transfer reducing equivalents to the ditions
mitochondria and exchanges metabolic intermediates
A. "C-NMR measurements of flux through oxidative metabolism 1) Monitoring enrichment of key metabolites from "C-en-
2) Labeling scheme for online measurement of metabolic flux 3) Targeting key pathways with specific labeled precursors
11. Dynamic-mode "C-NMR of the intact functioning heart
riched fuels
4) TCA cycle interactions with glutamate 5 ) Enrichment rate (to steady state) is independent of fractional
enrichment ('3C/[13C + "C]) of precursor. This facilitates in vivo applications with competing bloodborne substrates.
B. Analysis of "C enrichment kinetics 1. Kinetic modeling
a) formulation consistent with known biochemistry b) limiting unknown variables c) internal consaaints to improve accuracy d) external constraints to improve accuracy (MV02) and re-
duce covariance in multiparameter fittings 2. Utility and application of simple kinetic models
a) fitting model to experimental data b) egoup fittings (standard deviation as error) versus indi-
vidual fitting (noise level as error) 3. Application to heart preparations-isolated hearts and in
111. Mitochondrial transport processes: A new direction for spectro- scopic measurements in normal and diseased hearts A. Subcellular exchange of metabolites and transport rates from
1. Chemical interconversion between TCA cycle intermediates with glutamate a) 90% of detected, enriched glutamate is in the cytosol b) Catalysis of exchange between a-ketoglutarate and glu-
2. Delayed enrichment of glutamate due to transport as rate- determining step a) Discrepancy between rapid transaminase flux and ob-
served interconversion rate between a-ketoglutarate and glutamate (I 0-20-fold)
b) Responsiveness of malate-aspartate shuttle to cytosolic redox state (NADH/NAD+)
c) Net forward flux through malate-aspartate shuttle not re- quired for I3C enrichment of glutamate.
B. Homeostasis of metabolic flux for energy production in normal and diseased myocardium 1. Oxidation rate versus efflux rate of intermediate from mito-
chondria 2. Response to rate-limiting dehydrogenase activity in the
TCA cycle 3. Studies previously limited to isolated mitochondria bathed
in artificial "cytosol" without correlate of cardiac perfor- mance
4. Stunned myocardium displays altered oxidation/efflux rates
situ hearts
"C-NMR
tamate occurs via a rapid transaminase enzyme
Altered Myocardial Metabolism in Hypertensive Heart Disease Is Coupled with Diastolic Dysfunction H.J. Lamb, H.P. Beyerbacht, A. van der Lame, J. Doornbos, E.E. van der Wall, A. De Roos. Leiden, The Netherlands
Purpose: To study the myocardial high-energy phosphate (HEP) metab- olism and left ventricular (LV) function in patients with hypertensive heart disease.
Methods: Eleven patients with hypertension and 13 age-matched healthy subjects were studied with MR imaging at rest and phos- phorus-3 1 MR spectroscopy at rest and during atropine-dobutamine stress (I).
Results: Hypertensive patients showed higher LV mass (98 f. 28 g/m') than healthy controls (73 + 13 g/mz, p < 0.01). LV filling was impaired in patients, reflected by a decreased peak rate of wall thinning (PRWThn), E/A ratio, early peak filling rate, and early deceleration peak (all p < 0.05). whereas systolic function was still normal. The

96 1998 SCMR Annual Meeting
myocardial PCr/ATP ratio, a measure for cellular energy reserve, deter- mined in patients at rest (1.20 -C 0.18) and during stress (0.95 ? 0.25) was lower than those values obtained from healthy controls at rest (1.39 2 0 . 1 7 , ~ < 0.05) and during stress (1.16 5 0.18.p < 0.05). pCr/ATP determined at rest in patients was similar to values obtained in healthy subjects during stress (p > 0.05). pCr/ATP acquired at rest correlated statistically significantly with PRWThn and early deceleration peak ( r 5 0.55, p < 0.01).
Conclusions: Hypertensive heart disease is associated with altered myocardial HEP metabolism and diastolic dysfunction. The present study is the first to provide evidence of a direct relation between myo- cardial HEP metabolism and LV filling charactens . tics in humans. Myo- cardial HEP metabolism in hypertensive heart disease seems to be "stressed" to maintain global heart function at rest. The combination of functional and metabolic evaluation of the human heart seem to provide a sensitive tool for early detection of changes in myocardial performance and viability. Reference 1. Lamb HJ, Beyerbacht HP, Ouwerkerk R, Doornbos J. Pluim BM, van der Walt EE, van der h e A, de R m A. Metabolic response of normal human myocardium to high-dose atropine-dobutamine stress studied by "P-MRS. Circulation. 1997; %2969-2977.
Cardiac Transplant Patients Assessed by the P-31 MRS Stress Test W.T. Evanochko, S. Buchthal, J. den Hollander. R. Bourge, R. Benza, G. Pohost. Birmingham. AL
Literature testifies that biopsies fr& cardiac transplant patients do not correlate with their bioenergetic profiles obtained by "P MRS. Yet these results indicate altered high-energy phosphate metabolism in certain patients. That certain-resting myocardial PCr/ATP from heart transplant patients were significantly lower than in normal controls warrants fur- ther investigation (1). Vasculopathy is a competing mechanism of rejec- tion and is associated with hemodynamic abnormalities in the microvas- culature (2). Mildly stressing these patients using an isometric handgrip (IH) might allow detection of vasculopathy because they would demon- strate a PCr/ATP decrease consistent with ischemia. Therefore, IH ex- ercise was used to induce mild stress and to observe transient changes in the PCr/ATP. A 10-cm "P surface coil was positioned over the apex of the heart (confirmed with scout images) with the patient in the supine position and secured with a Velcro strap to reduce respiratory artifacts. A voxel containing the anterior wall of the left ventricle was defined and shimmed. The M exercise was performed similar to Weiss (3). at 30% maximum voluntary contraction during acquisition while blood pressure and heart rate were monitored. In all subjects studied, the hand- grip exercise generated a small increase in the rate-pressure product (average ARPP, + 12% 2 13). Although there was no significant differ- ence in ARPP between controls and transplant, overall during exercise the normal subjects showed only an increase in heart rate, whereas the transplants, being denervated showed only an increase in blood pres- sure. As expected, the normals showed no significant change in PCr/ ATP during exercise (average, +2% 2 11). However, 7 of 28 trans- plants showed a significant decrase in PCr/ATP (>2 SD) compared with normals during exercise. The decrease in PCr/ATP in transplants may be the first signs of microvascular rejection, a contributing mecha- nism in the rejection process (2). The cause of this ischemia may be microvascular cardiac allograft vasculopathy.
References 1. Buchthal SD. Clinical cardiac rejection assessed by P-3 1 MRS: The final phase I analysis. ISMRM Proc., 1996; 21011. 2. hnes MA. Clinical-pathologic features of humoral rejection in car- diac allografts: A study in 81 consecutive patients. J. Heart Lung Transpl., 1995; 14151-162. 3. Wkss RG. Regional myocardial metabolism of highenergy phos- phates during isomeeic exercise in patients with coronary artery dis- ea~e. N. En@. J. Med., 1990,323:1593-1600.
Trammural l)Na and "P-NMR Measurements of Intracelldar Na+ and High-Energy Phosphates During and After Ischemia in the In Situ Dog Heart J. Hai, H. Shen. J.A. Balschi. Birmingham, AL The objective of this study was to define the relationship between the intracellular Na+ (Na+,) and energetics during regional myocardial isch- emia and reperfusion in the intact dog heart. A bilateral thoracotomy was performed on mongrel dogs (n = 12). A surface coil was attached to the anterior wall of the left ventricle (LV). An occluder was placed around the left anterior descending artery. The dog was placed in the m a w and a shift reagent for Na+, DylTHA3-, infused until the shift of the extracellular Na+ resonance was 22.5 ppm. Three 90-min peri- ods followed: baseline, ischemia, and reperfusion. Nine animals entered this protocol, whereas an additional three entered a control protocol with no occlusion. W a and 31P-NMR one-dimensional chemical shift imaging (IDCSI) measured transmural Na', and high-energy phosphate content. This lDCSI technique generates four localized transmural spectra (slice thickness 0.25 cm). The sum of two 0.25-cm slices defined epicardial (Epi) and endocardia1 (Endo) regions (0.5 cm each). Four sets of interleaved 3Na and )'P IDCSI (20 min) were acquired during each 90-min period. All data are mean 2 SEM. Two-way repeated- measure ANOVA with Fisher's least protected significant difference test was used to compare any mean versus point A in the figures. Differ- ences were declared statistically significant if p < 0.05. During isch- emia, phosphocreatine (PCr) declines to a similar extent in Endo and Epi regions (Fig. 1). Na', increases in the Endo region (Fig. 2) when PCr had decreased to 12% of baseline. The Epi Na', does not signifi- cantly increase during ischemia (Fig. 2). This is consistent with a more rapid evolution of damage in the Endo region. Epi Na+, does increase during early reperfusion. These results are. consistent with an inhibition of the Na+/K+, ATPase in the Endo region during ischemia.
Time ( min )
Figure 1
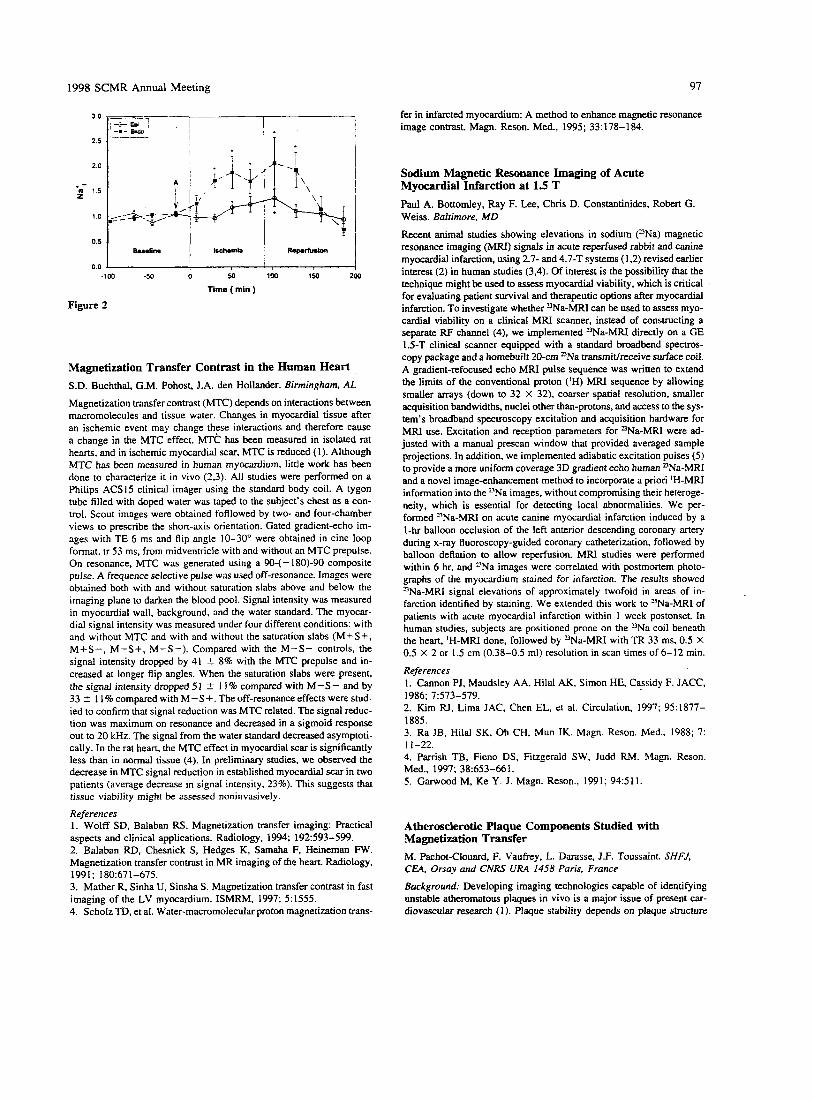
1998 SCMR Annual Meeting 97
J 1
0.0 J I
-100 -50 0 50 100 150 200
Time ( min )
Figure 2
Magnetization Transfer Contrast in the Human Heart S.D. Buchthal, G.M. Pohost, J.A. den Hollander. Birmingham A t
Magnetization transfer contrast (MTC) depends on interactions between macromolecules and tissue water. Changes in myocardial tissue after an ischemic event may change these interactions and therefore cause a change in the MTC effect. MTC has been measured in isolated rat h e m , and in ischemic myocardial scar, MTC is reduced (1). Although MTC has been measured in human myocardium, little work has been done to characterize it in vivo (2.3). All studies were performed on a Philips ACSl5 clinical imager using the standard body coil. A tygon tube filled with doped water was taped to the subject's chest as a con- trol. Scout images were obtained fofllowed by two- and four-chamber views to prescribe the short-axis orientation. Gated gradient-echo im- ages with TE 6 ms and flip angle 10-30' were obtained in cine loop format. tr 53 ms, from midventricle with and without an MTC prepulse. On resonance, MTC was generated using a 904 - 180)-90 composite pulse. A frequence selective pulse was used off-resonance. Images were obtained both with and without saturation slabs above and below the imaging plane to darken the blood pool. Signal intensity was measured in myocardial wall. background, and the water standard. The myocar- dial signal intensity was measured under four different conditions: with and without MTC and with and without the saturation slabs (M+S+, M+S-, M-S+, M-S-). Compared with the M-S- controls, the signal intensity dropped by 41 2 8% with the MTC prepulse and in- creased at longer flip angles. When the saturation slabs were present, the signal intensity dropped 51 _f 11% compared with M-S- and by 33 2 1 1 % compared with M - S + . The off-resonance effects were stud- ied to confirm that signal reduction was MTC related. The signal reduc- tion was maximum on resonance and decreased in a sigmoid response out to 20 kHz. The signal from the water standard decreased asymptoti- cally. In the rat heart, the MTC effect in myocardial scar is significantly less than in normal tissue (4). In preliminary studies, we observed the decrease in MTC signal reduction in established myocardial scar in two patients (average decrease in signal intensity, 23%). This suggests that tissue viability might be assessed noninvasively.
References 1. Wolff SD, Balaban RS. Magnetization transfer imaging: Practical aspects and clinical applications. Radiology, 1994: 192593-599. 2. Balaban RD. Chesnick S , Hedges K, Samaha F, Heineman FW. Magnetization transfer contrast in MR imaging of the heart. Radiology, 1991 ; 180:67 1-675. 3. Mather R, Sinha U, Sinsha S . Magnetization transfer contrast in fast imaging of the LV myocardium. ISMRM, 1997; 51555. 4. Scholz TD, et al. Water-macromolecular proton magnetization trans-
fer in infarcted myocardium: A method to enhance magnetic resonance image contrast. Magn. Reson. Med., 1995; 33:178-184.
Sodium Magnetic Resonance Imaging of Acute Myocardial Infarction at 1.5 T Paul A. Bottomley, Ray F. Lee, Chris D. Constantinides, Robert G. Weiss. Baltimore, MD
Recent animal studies showing elevations in sodium (nNa) magnetic resonance imaging (MRI) signals in acute reperfused rabbit and canine myocardial infarction, using 2.7- and 4.7-T systems (1.2) revised earlier interest (2) in human studies (3.4). Of interest is the possibility that the technique might be used to assess myocardial viability, which is critical for evaluating patient survival and therapeutic options after myocardial infarction. To investigate whether UNa-MRI can be used to assess myo- cardial viability on a clinical MRI scanner, instead of constructing a separate RF channel (4). we implemented UNa-MRI directly on a GE 1.5-T clinical scanner equipped with a standard broadbend spectros- copy package and a homebuilt 20-cm ']"a transmitkceive surface coil. A gradient-refocused echo MRI pulse sequence was written to extend the limits of the conventional proton ('H) MRI sequence by allowing smaller arrays (down to 32 X 32), coarser spatial resolution, smaller acquisition bandwidths, nuclei other than-protons, and access to the sys- tem's broadband spectroscopy excitaiion and acquisition hardware for MRI use. Excitation and reception parameters for =Na-MRI were ad- justed with a manual prescan window that provided averaged sample projections. In addition, we implemented adiabatic excitation pulses (5) to provide a more uniform coverage 3D gradient echo human Z-"a-MRI and a novel image-enhancement method to incorporate a priori 'H-MRI information into the "Na images, without compromising their heteroge- neity, which is essential for detecting local abnormalities. We per- formed "Na-MRI on acute canine myocardial infarction induced by a 1-hr balloon occlusion of the left anterior descending coronary artery during x-ray fluoroscopy-guided coronary catheterization, followed by balloon deflation to allow reperfusion. MRI studies were performed within 6 hr, and UNa images were correlated with postmortem photo- graphs of the myocardium stained for infarction. The results showed "Na-MRI signal elevations of approximately twofold in areas of in- farction identified by staining. We extended this work to >Na-MRI of patients with acute myocardial infarction within 1 week postonset. In human studies, subjects are positioned prone on the "Na coil beneath the heart, 'H-MRI done, followed by "Na-MRI with TR 33 ms, 0.5 X 0.5 X 2 or 1.5 cm (0.38-0.5 ml) resolution in scan times of 6-12 min.
References 1. Cannon PJ, Maudsley AA, Hilal AK, Simon HE, Cesidy F. JACC,
2. Kim RI. Lima JAC, Chen EL, et al. Circulation, 1997; 95:1877- 1885. 3. Ra JB, Hilal SK, Oh CH, Mun IK. Magn. Reson. Med., 1988; 7: 11-22. 4. Parrish TB, Fieno DS, Fitzgerald SW, Judd RM. hlagn. Reson. Med., 1997; 38:653-661. 5. Ganvood M, Ke Y. J. Magn. Reson., 1991; 94511.
1986; 7:573-579.
Atherosclerotic Plaque Components Studied with Magnetization Transfer M. Pachot-Cloud, F. Vaufrey, L. Darasse, J.F. Toussaint. SHFf, CEA. Orsay and CNRS URA 1458 Paris. France
Background: Developing imaging technologies capable of identifying unstable atheromatous plaques in vivo is a major issue of present car- diovascular research ( I ) . P ique stability depends on plaque structure
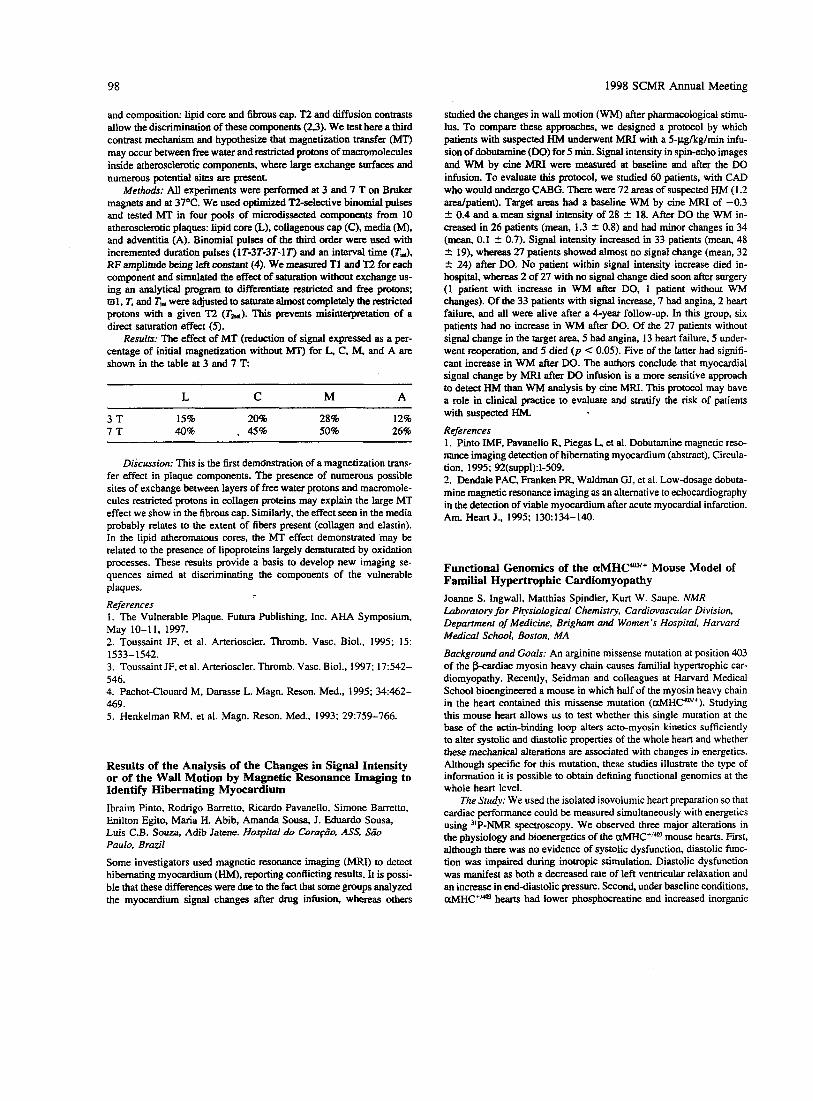
98 1998 SCMR Annual Meeting
studied the changes in wall motion (WM) after pharmacological stimu- lus. To compare these approaches. we designed a protocol by which patients with suspected HM underwent MRI with a 5-pgglkglmin infu- sion of dobutamine (DO) for 5 min. Signal intensity in spin-echo images and WM by cine MRI were measured at baseline and after the DO infusion. To evaluate this protocol, we studied 60 patients, with CAD who would undergo CABG. There were 72 areas of suspected HM (I .2 arealpatient). Target areas had a baseline WM by cine MRI of -0.3 2 0.4 and ameau signal intensity of 28 2 18. After DO the WM in- creased in 26 patients (mean, 1.3 2 0.8) and had minor changes in 34 (mean, 0.1 2 0.7). Signal intensity increased in 33 patients (mean, 48 2 19). whereas 27 patients showed almost no signal change (mean, 32 2 24) after DO. No patient within signal intensity increase died in- hospital, whereas 2 of 27 with no signal change died soon after surgery (1 patient with increase in WM after DO, 1 patient without WM changes). Of the 33 patients with signal increase, 7 had angina, 2 heart failure. and all were alive after a 4-year follow-up. In this group, six patients had no increase in WM after DO. Of the 27 patients without signal change in the target area, 5 had angina, 13 heart failure, 5 under- went reoperation, and 5 died ( p < 0.05). Five of the latter had signifi- cant increase in WM after DO. The authors conclude that myocardial signal change by h4RI after DO infusion is a more sensitive approach to detect HM than WM analysis by cine MRI. This protocol may have a role in clinical practice to evaluate and stratify the risk of patients with suspected HM. References 1. Pinto IMF, Pavanello R. Piegas L, et al. Dobutamine magnetic reso- nance imaging detection of hibernating myocardium (abstract). Circula- tion, 1995; 92(suppl):I-509. 2. Dendale PAC, Franken PR, Waldman GJ, et al. Low-dosage dobuta- mine magnetic resonance imaging as an alternative to echocardiography in the detection of viable myocardium after acute myocardial infarction. Am. Heart J., 1995; 130:134-140.
and composition: lipid core and fibrous cap. “2 and diffusion contrasts allow the discrimination of t h e components (2.3). We test here a third contrast mechanism and hypothesize that magnetization transfer (MT) may occur between free water and restricted protons of macromolecules inside atherosclerotic components. where large exchange surfaces and numerous potential sites are present.
Methods: AU experiments were performed at 3 and 7 T on Bruker magnets and at 37°C. We used optimized “2-selective binomial pulses and tested MT in four pools of mirrodissected components from 10 atherosclerotic plaques: lipid core (L), collagenous cap (C), media 0, and adventitia (A). Binomial pulses of the third order were used with incremented duration pulses (IT-3T-3T-17‘) and an interval time (Td, RF amplitude being left constant (4). We measured TI and T2 for each component and simulated the effect of saturation without exchange us- ing an analytical program to differentiate restricted and free protons; rn 1, T, and Tm were adjusted to saturate almost completely the restricted protons with a given T2 (T-). This prevents misinterpretation of a direct saturation effect (5).
Resulrs: The effect of MT (reduction of signal expressed as a per- centage of initial magnetization without MT) for L, C. M, and A are shown in the table at 3 and 7 T
L C M A
3 T 15% 20% 28% 12% 7 T 40% , 45% 50% 26%
Discussion: This is the first demdnstration of a magnetization trans- fer effect in plaque components. The presence of numerous possible sites of exchange between layers of free water protons and macromole- cules restricted protons in collagen proteins may explain the large MT effect we show in the fibrous cap. Similarly, the effect seen in the media probably relates to the extent of fibers present (collagen and elastin). In the lipid atheromatous cores, the MT effect demonstrated may be related to the presence of lipoproteins largely demturated by oxidation processes. These results provide a basis to develop new imaging se- quences aimed at discriminating the components of the vulnerable plaques. References 1. The Vulnerable Plaque. Futura Publishing, Inc. AHA Symposium, May 10-11, 1997. 2. Toussaint JF, et al. Arterioscler. Thromb. Vasc. Biol., 1995; 15:
3. Toussaint JF, et al. Arterioscler. Thromb. Vasc. Biol., 1997; 17542- 546. 4. Pachot-Clouard M, Darasse L. Magn. Reson. Med., 1995; M462- 469. 5. Henkelman RM, et al. Magn. Reson. Med., 1993; 29:759-766.
1533-1542.
Results of the Analysis of the Changes in Signal Intensity or of the Wall Motion by Magnetic Resonance Imaging to Identify Hibernating Myocardium Ibraim Pinto, Rodrigo Barretto, Ricardo Pavanello, Simone Barretto. Enilton Egito, Maria H. Abib, Amanda Sousa, J. Fduardo Sousa, Luis C.B. Souza, Adib Jatene. Hospital do Com@o, ASS, SrTO Paulo, Brazil
Some investigators used magnetic resonance imaging (MU) to detect hibernating myocardium (HM), reporting conflicting results. It is possi- ble that these differences were due to the fact that some groups analyzed the myocardium signal changes after drug infusion, whereas others
Functional Genomics of the aMHCm’+ Mouse Model of Familial Hypertrophic Cardiomyopathy Joanne S. Ingwall. Matthias Spindler, Kurt W. Saupe. NMR Laboraroiy for Physiological Chemistry, Cardiovascular Division, Department of Medicine, Brigham and Women’s Hospital, Harvard Medical School, Boston, MA
Background and Gods: An arginine missense mutation at position 403 of the gcardiac myosin heavy chain causes familial hypertrophic car- diomyopathy. Recently, Seidman and colleagues at Harvard Medical School bioengineered a mouse in which half of the myosin heavy chain in the heart contained this missense mutation (aMHp3’+). Studying this mouse heart allows us to test whether this single mutation at the base of the actin-binding loop alters actc-myosin kinetics sufficiently to alter systolic and diastolic properties of the whole heart and whether these mechanical alterations are associated with changes in energetics. Although specific for this mutation, these studies illustrate the type of information it is possible to obtain defining functional genomics at the whole heart level.
The Srudy: We used the isolated isovolumic heart preparation so that cardiac performance could be measured simultaneously with energetics using 31P-NMR spectroscopy. We observed three major alterations in the physiology and bioenergetics of the CMHC+’~’ mouse hearts. First, although there was no evidence of systolic dysfunction, diastolic func- tion was impaired during inompic stimulation. Diastolic dysfunction was manifest as both a decreased rate of left ventricular relaxation and an increase. in end-diastolic pressure. Second, under baseline conditions, C~.MHC+’~ hearts had lower phosphocreatine and increased inorganic
1998 SCMR Annual Meeting 99
phosphate contents, with unchanged ATP content, resulting in a de- crease in the calculated value for the free energy released from ATP hydrolysis. Third, hearts from aMHC"Om that were studied unpaced responded to increased perfusate calcium by decreasing heart rate ap- proximately twice as much as wild-types.
We conclude that hearts from crMHCm3'+ mice demonstrate work- load-dependent diastolic dysfunction resembling the human form of fa- milial hypertrophic cardiomyopathy. These changes may be explained by a slowed release of the actin binding loop from the thin filament. Changes in high energy phosphate content suggest that an energy- requiring process contributes to the observed diastolic dysfunction.
Creatine Kinase Flux in Myocardium: Insights from Transgenic Mice Cees J.A. van Echteld. University Hospitul, Utrecht, The Netherlands
"P-NMR magnetization transfer methods have been extensively used to study fluxes through the myocardial CK reaction. However, in general it has not been possible to determine the individual contributions of the different iso-enzymes. A kind gift of Prof. Dr. B. Wieringa. University of Nijmegen, of the transgenic mouse model, has enabled us to study in vivo enzyme kinetics of CK in isolated perfused hearts of transgenic mice lacking the cytosolic MM-CK in heart and skeletal muscle. Re- cently, the group of Prof. Wieringa found no NMR-detectable fluxes through the CK reaction in skeletal muscle of these MM-CK-deficient mice (1). In our study (2). we investigated whether in cardiac muscle of MM-CK-deficient mice a Mi-CK-mediated flux through the CK re- action could be observed. Isolated perfused mouse hearts were studied at 400 and 600 bpm and during K' arrest. "P-NMR spectra were ob- tained at 202 MHz on a Bruker AM 500 spectrometer. Spectra showed clearly observable magnetization transfer in these MM-CK-deficient mouse hearts. PCr/ATP ratios in wild-type and MM-CK-deficient hearts were similar. Saturation of the y-ATP resonance for varying du- rations was used to determine the rate constant kfor of the PCr to ATP reaction in wild-type ( n = 7) and MM-CK-deficient (n = 6) mouse hearts. At 400 bpm kfor calculated from these data was 0.43 2 0.06 s-' for wild-type and 0.22 2 0.03 s-l for MM-CK-deficient hearts. During K' arrest the flux through the forward CK reaction decreased by -50% in wild-type hearts and remained unchanged in MM-CK- deficient hearts. That Mi-CK flux in hearts of MM-CK-deficient mice could be clearly observed, in contrast to Mi-CK flux in skeletal muscle of these mice, is most likely due to the much higher Mi-CK content in cardiac muscle. In vitro assessment showed that total CK activity in MM-CK-deficient hearts was 26% of total CK activity in wild-type hearts. Therefore, it appears that in vivo, Mi-CK contributes much more than MM-CK to total CK flux in wild-type mouse hearts. It is also tempting to speculate that during K' arrest in wild-type hearts, total CK flux is fully explained by Mi-CK activity, although an MM- CK contribution cannot be ruled out. However, when interpreting these data, one should keep in mind that adaptations may occur in response to the genetic modifications (3.4). For instance, Ventura-Clapier et al. (3) reported that the rate constans of tension changes of skinned ventric- ular fibers was markedly reduced in MM-CK-deficient mice, which is not surprising in view of the absence of a local ATP-regenerating sys- tem. Veksler et al. (4) found that in MM-CK-deficient mouse heart, the K , for ADP and the V,, of the mitochondrial respiration had changed substantially in the absence of creatine compared with wild-type heart, from which they conclude an adaptation of the adenine nucleotide trans- port system. Interestingly, no such differences were found in the pres- ence of creatine, which is always the case for the hearts in our study. Furthermore, although not consistently found, some studies show an increased expression of BB-CK in MM-CK-deficient mouse hearts. Nevertheless, when carefully taking into account the consequences of
these adaptations, these CK knockout mice will yield much valuable information on the role of the different CK iso-enzymes, which cannot be obtained otherwise.
References 1. Van Deursen J, Heerschap A, Oerlemans F, Ruitenbeek W, Jap P, Ter Laak H, Wieringa B. Skeletal muscles of mice deficient in muscle creatine kinase lack burst activity. Cell, 1993; 74:612-631. 2. Van Dorsten FA, Nederhoff MGJ, Nicolay K, Van Echteld CJA. "P NMR studies of creatine kinase flux in M-creatine kinase deficient mouse heart. Am. J. Physiol. (provisionally accepted). 3. Ventura-Clapier R, Kuznetsov AV, D'Albis A, Van Deursen J, Wieringa B, Veksler VI. Muscle creatine kinase-deficient mice. I. Alter- ations in myofibrillar function. J. Biol. Chem., 1995; 27019914- 19920. 4. Veksler VI, Kuznetsov AV, Anflous K, Mateo P, Van Deursen J, Wieringa B, Ventura-Clapier R. Muscle creatine kinase-deficient mice. II. Cardiac and skeletal muscle exhibit tissue-specific adaptation of the mitochondrial function. J. Biol. Chem., 1995; 270:19921-19929.
"P-NMR of the Failing Heart Stefan Neubauer. Medizinische Universitiitsklinik, Wiirzburg, Germany
)'P-NMR spectroscopy ('IP-MRS) is the only method for the noninva- sive investigation of cardiac energy metabolism without the need for radioactive tracers. In heart failure, I'P-MRS may have three applica- tions: study of the pathophysiology of contractile failure, diagnostic tool for grading of disease severity and prognosis assessmenf and follow- up during chronic drug therapy. Whether the failing heart has limited contractile function due to impaired energy metabolism has been de- bated for decades (1). "P-MRS now allows the study of this hypothesis in the human heart. In principle, energy metabolism could limit perfor- mance via three mechanisms. First, simply by a reduction of ATP. Be- cause ATP levels in heart failure are unchanged or reduced by no more than 30-40% and because the K, (ATP) values of SERCA, myosin ATPase, and other enzymes involved in contractile function are in the pM range, reduction of steady-state ATP levels is almost certainly not a limiting factor. Second, it is likely that intracellular ATP is compart- mentalized, and thus the question is whether "we get ATP where we need it" (i.e., foremost to the myofibrillar compartment). The creatine kinase (CK) shuttle is likely to serve as an energy transfer system, shut- tling the high-energy phosphate bond to the sites of ATP utilization (1,2). CK reaction velocity (flux) can be measured with NMR saturation transfer. If CK flux falls below the rate of ATP synthesis (measured from oxygen consumption). then ATP transfer may be limiting perfor- mance. Third, the free energy change of ATF' hydrolysis (AG) is a mea- sure of the amount of energy that can be released from hydrolysis of I mol of ATP (3). AG can decrease without a major change in ATP steady-state levels. Typically, AG is approximately -58 Idlmol. The minimum required AG for SERCA is -52 kllmol. If AG falls below this threshold, contractile dysfunction develops. Experimentally, many animal models of heart failure have been studied, including, among others, postmyocardial infarction, aortic banding, volume overload, pacing tachycardia, hereditary (Syrian hamster, SHR rat), or toxic (iso- proterenol, adriamycin, furazolidone) models. Changes of energy me- tabolism occur uniformly in these models, independent of the etiology of heart failure. Typically, ATP levels are unchanged or slightly de- creased. Phosphocreatine and total creatine levels are reduced by up to -80% (1.4). Total CK activity decreases as does the activity of the mitochondrial CK isoenzyme. B-containing fetal CK isoenzymes in- crease. ATP transfer (CK flux) decreases substantially. In most models, ATP transfer remains higher than ATP synthesis and thus cannot be
100 1998 SCMR Annual Meeting
limiting performance. In severe end-stage heart failure. however, ATP transfer may decrease below ATP synthesis, limiting performance (5). During inotropic simulation, ADP increases disproportionately and thus AG decreases in the failing heart. This is a mechanism likely to be responsible for limiting contractile reserve of the failing heart Although experimentally all components of energy metabolism (ATP, phospho- creatine, free creatine, CK total and isoenyme activity, ADP. AG) can be measured or calculated, human studies (6) were limited to measuring the PCr/ATP ratio as an “index of the energetic state of the heart.” Because the CK equilibrium constant favors ATP synthesis over PCr synthesis by two orders of magnitude, any imbalance between ATF’ demand and supply will first decrease PCr and thus the PCr/ATP ratio. In addition. demases of the PCr/ATP ratio in the failing human heart also reflect the loss of total creatine. Solutions to quantitate absolute levels of ATP and PCr in human heart are on the way (7). In addition, quantification of total creatine by ‘H-MRS (8) will allow calculation of free ADP and AG in human heart Thus, future studies of human heart failure will allow us to study the contribution of energy metabolism to contractile failure in greater detail, including ADP and AG measure- ments during inotropic stimulation. Also, measurement of CK flux in human heart failure should be performed to evaluate a possible role for ATP transfer. Present data are consistent with, but do not prove, a causal role for energy metabolism in heart failure.
In heart failure of nonischemic or ischemic origin. we (9) and others (10) described a significant reduction of the pCr/ATP ratio. The reduc- tion also correlates with the s5verity of heart failure and with ejection fraction. Altered energetics can be shown for post-MI hearts (1 1). di- lated cardiomyopathy (9,l l), and also valve disease (12). again demon- strating that this is a phenomenon occurring independent from the etiol- ogy of heat failure. We recently demonstrated that PCr/ATp ratios also hold prognostic information on mortality in patients with DCM (13).
3’P-MRS allows us to sequentially follow the energetic response of the failing heart to chronic drug therapy. Experimentally, ACE-inhibi- tors and beta-receptor-blockers attenuated the changes of energy metab- olism in heart failure models. We reported an improvement of the PCr/ ATP ratio in DCM patients during chronic therapy with ACE inhi6itors. diuretics, digitalis, and beta-receptor-blockers (9). Systematic placebo- controlled clinical trials are awaited.
References I . lngwall JS. Is cardiac failure a consequence of decreased energy
reserve? Circulation, 1993; 87(Suppl.VII):58-62. 2. Wallimann T, Wyss M, Brdiczka D, Nicolay K, Eppenberger HM.
Intracellular compartmentation, structure and function of creatine ki- nase isoenzymes in tissues with high and fluctuating energy demands: The “phosphocreatine circuit” for cellular energy homeostasis. Bio-
3. Kammermeier H. Schmidt P. Jungling E. Free energy change of ATP-hydrolysis: A causal factor of early hypoxic failure of the myocar- dium? J. Mol. Cell. Cardiol., 1982; 14267-277. 4. Neubauer S, Horn M, Naumann A, et al. Impairment of energy
metabolism in intact residual myocardium of rat hearts with chronic myocardial infarction. J. Clin. Invest., 1995; 95:1092-1100. 5. Liao R, Nascimben L, Friedrich J, Gwathmey JK, Ingwall JS. De-
creased energy reserve in an animal model of dilated cardiomyopathy. Relationship to contractile performance. Circ. Res., 1996; 78:893-902. 6. Bottomley PA. MR spectroscopy of the human heart: The StaNS
and the challenges. Radiology. 1994: 191593-612. 7. Bottomley PA, Atalar E, Weiss RG. Human cardiac high-energy
phosphate metabolite concentrations by ID-resolved NMR spectros- copy. Magn. Reson. Med., 1996; 35:664-670.
8. Bottomley P, Lee SYH. Weiss RG. Proton MR spectroscopy of creatine in myocardial infarction. Vol. 1. ISMRM 4th scientific meeting, New York; 1996. 9. Neubauer S, Krahe T. Schindler R. et al. 31P magnetic resonance
spectroscopy in dilated cardiomyopathy and coronary artery disease.
phys. J., 1992; 281:21-40.
Altered cardiac high-energy phosphate metabolism in heart failure. Cir- culation, 1992; 861810-1818. 10. Hardy CJ, Weiss RG, Bottomley PA, Gerstenblith G. Altered myo- cardial high-energy phosphate metabolites in patients with dilated car- diomyopathy. Am. Heart J., 1991; 122795-801. 11. Hardy CJ, Bottomley PA. 31P spectroscopic localization using pinwheel NMR excitation pulses. Magn. Reson. Me&, 199 1 ; 17:3 15- 327. 12. Neubauer S, Horn M, Pabst T, et al. Cardiac highenergy phosphate metabolism in patients with aortic valve disease assessed by 31P-mag- netic resonance spectroscopy. J. Invest. Med., in press. 13. Neubauer S, Horn M, Cramer M, et al. In patients with dilated cardiomyopathy the myocardial phosphocreatine-to-ATP ratio is a pre- dictor of mortality. Circulation, 1997; 962190-2196.
Preliminary Experience with Multislice First-Pass Perfusion Imaging in Patients with Coronary Artery Disease A. Moalemi,’ S. Ding,l F. Epstein,’ V. Dilsizian,’ R. Balaban,I A. Arai,l C. Lundergan? lBerhesda. MD; 2Washingron, DC Purpose: To use dipyridamole thallium and cardiac catheterization to guide reading criteria for detectioll of significant coronary artery disease by a new multislice MRI technique.
Methods: Nine patients with history of coronary artery disease with a clinical indicatien for a stress thallium study underwent both dipyrida- mole thallium and dipyridamole perfusion MRI study. Imaging was per- formed on a 1.5-T GE scanner with enhanced gradients using a highly segmented cardiac-gated GRE-EPI sequence with a volumetric sat pulse preceding each image. Five to seven short-axis images of the left ventricle were acquired every heart beat during the first passage of ga- dopentate dimeglumine (Magnevist) 0.14 mmol/kg at 5 ml/s via an antecubital N. The temporal resolution of each image was approxi- mately 100-120 ms, and the spatial resolution was approximately 2.8 mm. Cardiac catheterization information was available on all patients.
Resulrs: Nine patients with coronary artery disease (six men, three women) completed the study. Perfusion defects appeared as dark suben- docardial regions with delayed enhancement relative to normal zones. These abnormal zones persist beyond the peak left ventricular cavity enhancement phase. Subendocardial artifacts in normal zones tend to be evanescent correlating in time with peak contrast in the cardiac chambers. Defining significance as 260% coronary stenosis, 1 1 of 27 coronary distributions (LAD, RCA, LCX and their corresponding major branches) were abnormal. Qualitative assessment of the MRI scans de- tected 11 of l l coronary distribution abnormalities but had 3 of 16 false positives.
Discussion: First-pass MRl perfusion methods are practical in pa- tients with known coronary artery disease. Preliminary results suggest that this technique can be calibrated to have a high sensitivity and rea- sonable specificity for the detection of coronary artery disease.
Predicting the Long-term Follow-up of Patients with Acute Myocardial Infarction by Gadolinium-Enhanced Magnetic Resonance Imaging Ibraim Pinto, Ricardo Pavanello, Leopoldo Piegas, Rodrigo Barretto, Marcos Barbosa, Edson Romano, Enilton Egito, Amanda Sousa, J. Eduardo Sousa, Luis C.B. Souza. Hospiral do Cora@, ASS. SrSo Paulo. SP, Brail.
Preliminary work with gadolinium (GD) enhanced magnetic resonance imaging (MRI) suggested that this method could estimate myocardial viability and predict the long-term follow-up of patients with acute
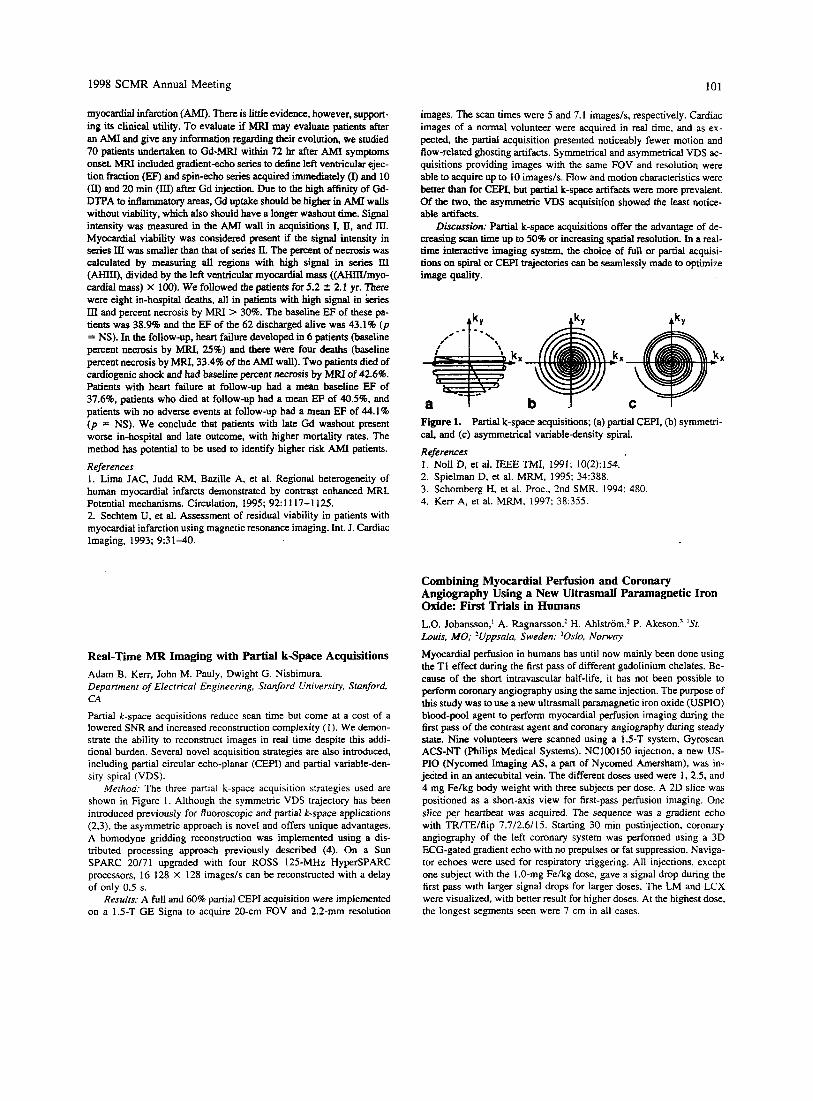
1998 SCMR Annual Meeting 101
myocardial infarction (MI). There is little evidence, however, support- ing its clinical utility. To evaluate if MRI may evaluate patients after an AMI and give any information regarding their evolution, we studied 70 patients undertaken to Gd-MRI within 72 hr afta AMI symptoms onset. MRI included gradient-echo series to define left ventricular ejec- tion fraction (EF) and spin-echo series acquired immediately 0 and 10 (II) and 20 min (m) after Gd injection. Due to the high affinity of Gd- DTPA to inflammatory areas, Gd uptake should be higher in AMI w d s without viability, which also should have a longer washout time. Signal intensity was measured in the AMI wall in acquisitions I, II, and III. Myocardial viability was considered present if the signal intensity in series III was smaller than that of series II. The percent of necrosis was calculated by measuring all regions with high signal in series tU (AHIII), divided by the left ventricular myocardial mass ((AHIII/myo- cardial mass) X 100). We followed the patients for 5.2 2 2.1 yr. There were eight in-hospital deaths, all in patients with high signal in kries IXI and percent necrosis by MRI > 30%. The baseline EF of these pa- tients was 38.9% and the EF of the 62 discharged alive was 43.1% (p = NS). In the follow-up, heart failure developed in 6 patients (baseline percent necrosis by MRL 25%) and there were four deaths (baseline percent necrosis by MRI, 33.4% of the AMI wall). Two patients died of cardiogenic shock and had baseline percent necrosis by MRI of 42.6%. Patients with heart failure at follow-up had a mean baseline EF of 37.6%. patients who died at follow-up had a mean EF of 40.5%. and patients wih no adverse events at follow-up had a mean EF of 44.1% (p = NS). We conclude that patients with late Gd washout present worse in-hospital and late outcome, with higher mortality rates. The method has potential to be used to identify higher risk AMI patients.
References 1. Lima JAC, Judd RM, Bazille A, et al. Regional heterogeneity of human myocardial infarcts demonstrated by contrast enhanced MRI. Potential mechanisms. Circulation. 1995; 92:1117-1125. 2. Sechtem U, et al. Assessment of residual viability in patients with myocardial infarction using magnetic resonance imaging. Int. J. Cardiac Imaging, 1993; 9:31-40.
Real-Time MR Imaging with Partial k-Space Acquisitions Adam B. Kerr, John M. Pauly, Dwight G. Nishimura. Department of Electrical Engineering, Stanford University, Stanford, CA
Partial k-space acquisitions reduce scan time but come at a cost of a lowered SNR and increased reconstruction complexity (1). We demon- strate the ability to reconstruct images in real time despite this addi- tional burden. Several novel acquisition strategies are also introduced, including partial circular echo-planar (CEPI) and partial variable-den- sity spiral (VDS).
Merhod: The three partial k-space acquisition strategies used are shown in Figure 1. Although the symmetric VDS trajectory has been introduced previously for fluoroscopic and partial k-space applications (2.3). the asymmetric approach is novel and offers unique advantages. A homodyne gridding reconstruction was implemented using a dis- tributed processing approach previously described (4). On a Sun SPARC 20l71 upgraded with four ROSS 125-MHz HyperSPARC processors, 16 128 X 128 imagesls can be reconstructed with a delay of only 0.5 s.
Results: A full and 60% partial CEPI acquisition were implemented on a 1.5-T GE Signa to acquire 20-cm FOV and 2.2-mm resolution
images. The scan times were 5 and 7.1 images/s, respectively. Cardiac images of a normal volunteer were acquired in real time, and as ex- pected, the partial acquisition presented noticeably fewer motion and flow-related ghosting artifacts. Symmetrical and asymmetrical VDS ac- quisitions providing images with the same FOV and resolution were able to acquire up to 10 imagesls. Flow and motion characteristics were better than for CEPI, but partial k-space artifacts were more prevalent. Of the two, the asymmetric VDS acquisition showed the least notice- able artifacts.
Discus5wn: Partial k-space acquisitions offer the advantage of de- creasing scan time up to 50% or increasing spatial resolution. In a real- time interactive imaging system, the choice of full or partial acquisi- tions on spiral or CEPI trajectories can be seamlessly made to optimize image quality.
X
Figure 1. Partial k-space acquisitions; (a) partial CEPI. (b) symmetri- cal, and (c) asymmemcal variable-density spiral.
References I . Noll D, et al. IEEE TMI, 1991; 10(2):154. 2. Spielman D, et al. MRM, 1995; 34:388. 3. Schomberg H, et al. Proc., 2nd SMR, 1994: 480. 4. Kerr A, et al. MRM, 1997: 38:355.
Combining Myocardial Perfusion and Coronary Angiography Using a New Ultrasmali Paramagnetic Iron Oxide: First Trials in Humans L.O. Johansson,' A. Ragnarsson,' H. Ahlstrom? P. Akeson.' 'Sr. Louis, MO; 'Uppsala, Sweden: 'Oslo, Norway
Myocardial perfusion in humans has until now mainly been done using the T1 effect during the first pass of different gadolinium chelates. Be- cause of the short intravascular half-life, it has not been possible to perform coronary angiography using the same injection. The purpose of this study was to use a new ultrasmall paramagnetic iron oxide (USPIO) blood-pool agent to perform myocardial perfusion imaging during the first pass of the contrast agent and coronary angiography during steady state. Nine volunteers were scanned using a 1.5-T system, Gyroscan ACS-NT (Philips Medical Systems). NC100150 injectlon, a new US- P I 0 (Nycomed Imaging AS. a part of Nycomed Amersham), was in- jedted in an antecubital vein. The different doses used were 1, 2.5, and 4 mg Felkg body weight with three subjects per dose. A 2D slice was positioned as a short-axis view for first-pass perfusion imaging. One slice per heartbeat was acquired. The sequence was a gradient echo with TRlTElflip 7.7/2.6/15. Starting 30 min postinjection, coronary angiography of the left coronary system was performed using a 3D ECG-gated gradient echo with no prepulses or fat suppression. Naviga- tor echoes were used for respiratory triggering. All injections, except one subject with the 1 .O-mg Felkg dose, gave a signal drop during the first pass with larger signal drops for larger doses. The LM and LCX were visualized, with better result for higher doses. At the highest dose, the longest segments seen were 7 cm in all cases.
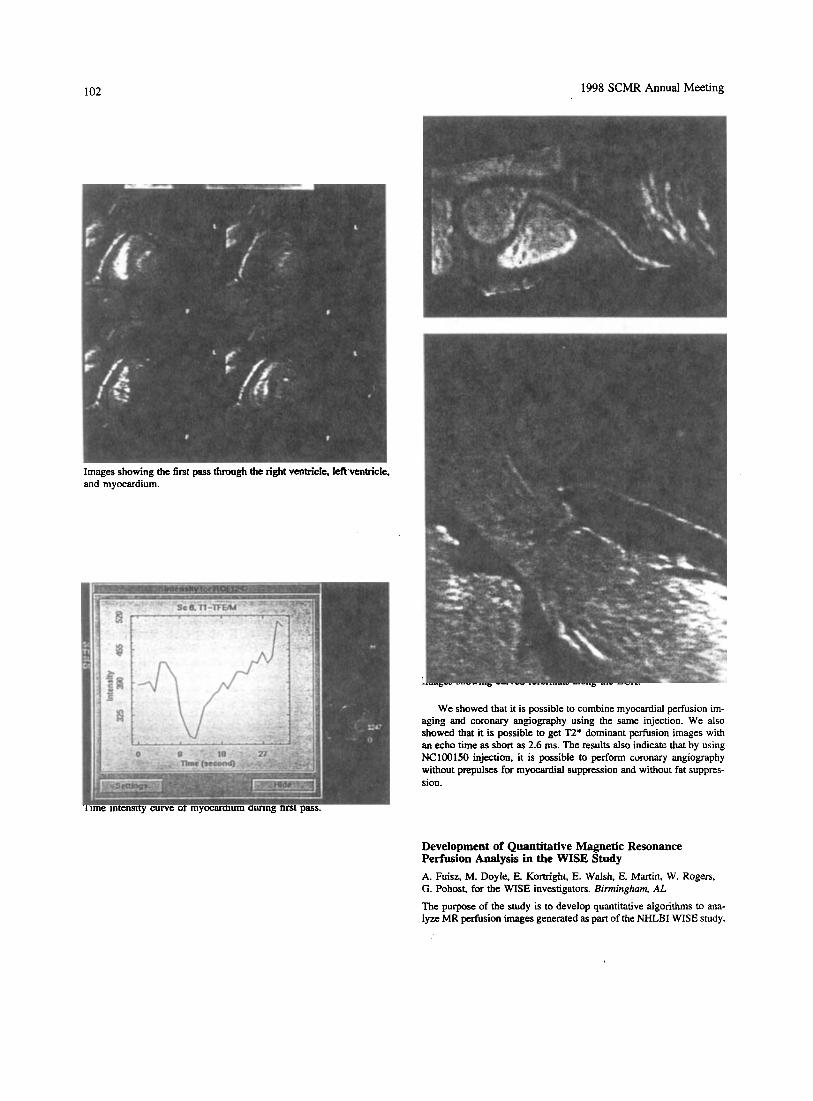
102 1998 SCMR Annual Meeting
Time intensity curve of myocardium during first pass.
Development of Quantitative Magnetic Resonance Perfusion Analysis in the WISE Study A. Fuisz, M. Doyle, E. Kortright, E. Walsh, E. Martin, W. Rogers, G. Pohost, for the WISE investigators. Birmingham, AL
The pu’pose of the study is to develop quantitative algorithms to ana- lyze MR perfusion images generated as part of the NHLBI WISE study.
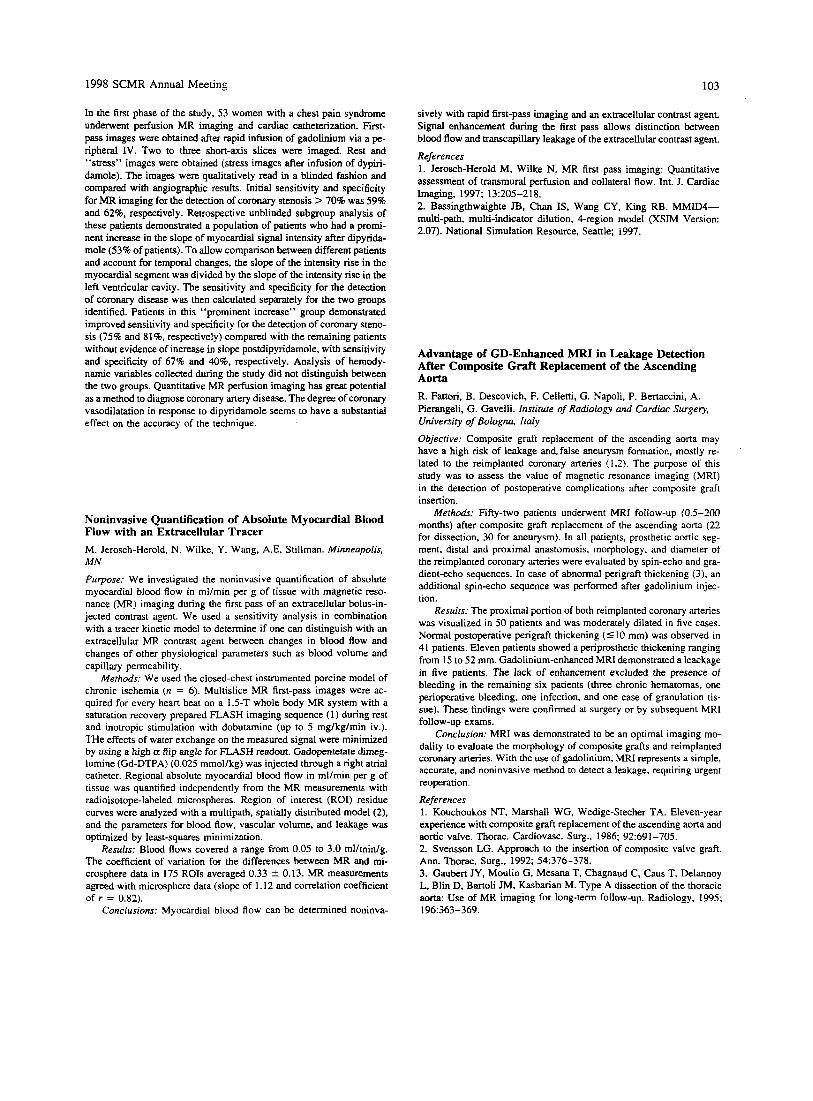
1998 SCMR Annual Meeting 103
In the first phase of the study, 53 women with a chest pain syndrome underwent perfision MR imaging and cardiac catheterization. First- pass images were obtained after rapid infusion of gadolinium via a pe- ripheral IV. Two to three short-axis slices were imaged. Rest and “stress” images were obtained (stress images after infusion of dypiri- damole). The images were qualitatively read in a blinded fashion and compared with angiographic results. Initial sensitivity and specificity for MR imaging for the detection of coronary stenosis > 70% was 59% and 62%, respectively. Retrospective unblinded subgroup analysis of these patients demonstrated a population of patients who had a prorni- nent increase in the slope of myocardial signal intensity after dipyrida- mole (53% of patients). To allow comparison between different patients and account for temporal changes, the slope of the intensity rise in the myocardial segment was divided by the slope of the intensity rise in the left ventricular cavity. The sensitivity and specificity for the detection of coronary disease was then calculated separately for the two groups identified. Patients in this “prominent increase” group demonstrated improved sensitivity and specificity for the detection of coronary steno- sis (75% and 81%, respectively) compared with the remaining patients without evidence of increase in slope postdipyridamole, with sensitivity and specificity of 67% and 40%. respectively. Analysis of hemody- namic variables collected during the study did not distinguish between the two groups. Quantitative MR perfusion imaging has great potential as a method to diagnose coronary artery disease. The degree of coronary vasodilatation in response to dipyridamole seems to have a substantial effect on the accuracy of the technique.
Noninvasive Quantification of Absolute Myocardial Blood Flow with an Extracellular Tracer M. Jerosch-Herold, N. Wilke. Y. Wang, A.E. Stillman. Minneapolis, MN
Purpose: We investigated the noninvasive quantification of absolute myocardial blood flow in ml/min per g of tissue with magnetic reso- nance (MR) imaging during the first pass of an extracellular bolus-in- jected contrast agent. We used a sensitivity analysis in combination with a tracer kinetic model to determine if one can distinguish with an extracellular MR contrast agent between changes in blood flow and changes of other physiological parameters such as blood volume and capillary permeability.
Methods: We used the closed-chest instrumented porcine model of chronic ischemia (n = 6). Multislice MR first-pass images were ac- quired for every heart beat on a 1.5-T whole body MR system with a saturation recovery prepared FLASH imaging sequence ( I ) during rest and inotropic stimulation with dobutamine (up to 5 mglkglmin iv.). THe effects of water exchange on the measured signal were minimized by using a high a flip angle for FLASH readout. Gadopentetate dimeg- lumine (Gd-DTPA) (0.025 mmollkg) was injected through a right atrial catheter. Regional absolute myocardial blood flow in mllmin per g of tissue was quantified independently from the MR measurements with radioisotope-labeled microspheres. Region of interest (ROI) residue curves were analyzed with a multipath, spatially distributed model (2), and the parameters for blood flow, vascular volume, and leakage was optimized by least-squares minimization.
Results: Blood flows covered a range from 0.05 to 3.0 ml/min/g. The coefficient of variation for the differences between MR and mi- crosphere data in 175 ROIs averaged 0.33 2 0.13. MR measurements agreed with microsphere data (slope of 1.12 and correlation coefficient of r = 0.82).
Conclusions: Myocardial blood flow can be determined noninva-
sively with rapid first-pass imaging and an extracellular contrast agent. Signal enhancement during the first pass allows distinction between blood flow and transcapillary leakage of the extracellular contrast agent.
References 1. Jerosch-Herold M, Wilke N. MR first pass imaging: Quantitative assessment of transmural perfusion and collateral flow. Int. J. Cardiac Imaging, 1997; 13:205-218. 2. Bassingthwaighte JB, Chan IS, Wang CY, King RB. MMID4- multi-path, multi-indicator dilution, 4-region model (XSIM Version: 2.07). National Simulation Resource, Seattle; 1997.
Advantage of GD-Enhanced MRI in Leakage Detection After Composite Graft Replacement of the Ascending Aorta R. Fattori, B. Descovich, F. Celletti, G. Napoli, P. Bertaccini, A. Pierangeli, G. Gavelli. Institute of Radiology and Cardiac Surgery, University of Bologna, Italy
Objective: Composite graft replacement of the ascending aorta may have a high risk of leakage and-false aneurysm formation, mostly re- lated to the reimplanted coronary arteries (1.2). The purpose of this study was to assess the value of magnetic resonance imaging (MRI) in the detection of postoperative complications after composite graft insertion.
Methods: Fifty-two patients underwent MRI follow-up (0.5-200 months) after composite graft replacement of the ascending aorta (22 for dissection. 30 for aneurysm). In all patients, prosthetic aortic seg- ment, distal and proximal anastomosis, morphology, and diameter of the reimplanted coronary arteries were evaluated by spin-echo and gra- dient-echo sequences. In case of abnormal perigraft thickening (3). an additional spin-echo sequence was performed after gadolinium injec- tion.
Results: The proximal portion of both reimplanted coronary arteries was visualized in 50 patients and was moderately dilated in five cases. Normal postoperative perigraft thickening (510 mm) was observed in 4 I patients. Eleven patients showed a periprosthetic thickening ranging from 15 to 52 mm. Gadolinium-enhanced MRI demonstrated a leackage in five patients. The lack of enhancement excluded the presence of bleeding in the remaining six patients (three chronic hematomas, one perioperative bleeding. one infection, and one case of granulation tis- sue). These findings were confirmed at surgery or by subsequent MRI follow-up exams.
Conclusion: MRI was demonstrated to be an optimal imaging mo- dality to evaluate the morphology of composite grafts and reimplanted coronary arteries. With the use of gadolinium, MRI represents a simple, accurate, and noninvasive method to detect a leakage, requiring urgent reoperation.
References 1. Kouchoukos NT, Marshall WG, Wedige-Stecher TA. Eleven-year experience with composite graft replacement of the ascending aorta and aortic valve. Thorac. Cardiovasc. Surg., 1986; 92:691-705. 2. Svensson LG. Approach to the insertion of composite valve graft. Ann. Thorac. Surg., 1992; 54376-378. 3. Gaubert JY, Moulin G, Mesana T, Chagnaud C, Caus T, Delannoy L, Blin D, Bartoli JM, Kasbarian M. Type A dissection of the thoracic aorta: Use of MR imaging for long-term follow-up. Radiology, 1995; 1961363-369.
104 1998 SCMR Annual Meeting
MR Breathhdd Flow Measurement in Venous and Arterial Coronary Graft.% Comparison with Intraoperative Doppler Measurement T. Voiglbder,' K.-F. Kreitner: M. Dahm' T. Wittlinger,' P. Kalden,' C. Frick,' J. Meyer.' W. Nitz.' '2nd Medcul Clinic, zClinic for Radiolopy, and 3Clinic for Heart Saugeiy, University of Main? Germany; 'Siemens, Erlangen, Gennany
Recently, noninvasive evaluation of coronary bypass grafts using MR angiography has been reported. MR flow measurement in venous and arterial coronary grafts provides an important contribution to m o p h e logical assessment (1.2). The aim of this study was to evaluate the reli- ability of breathhold MR flow measurement early after coronary bypass grafting, comparing it with the results of the intraoperatively performed Doppler measurement.
Metho&: In 21 patients (mean age 57 yr, range 43-78 yr) with 12 internal mammarial grafts (IMA) and 13 venous grafts (VG), flow was measured intraoperatively using the transit time Doppler 0 method (Cardio Med., Norway, one measurementl4 ms). MR flow measure- ment (Siemens Vision, 1.5 T) was performed after 8 -C 3 days. After Visualization of the course of the bypass grafts (HASTE, seven to nine slices, breathhold, acquisition time 10-15 s), flow measurements (phase-change technique, breathhold, TR 110-125 ms) perpendicular to the course of the grafts were performed.
Results: All grafts evaluated intraoperatively were visualized by MR, and flow measurement could be performed. The mean flow for VG and IMA was not significantly different.
Mean Flowlmin
All (n = 25) VG (n = 12) IMA (n = 13)
TTF (mllmin) 44.91 t 26.6 47.84 t 29.65 41.73 t 23.91 MR (ml/min) 45.37 -C 26.84 50.52 2 30.98 39.8 t 21.43 r value 0.81 0.80 0.83
Conclusion: MR flow measurement in coronary grafts correlated well with intraoperatively derived mean flow values. The prerequisite for these promising results is optimized MR flow measurement after visualization of the bypass course by HASTE sequence.
References I . Sakuma H. Breath-hold MR measurement of blood flow velocity in internal mammary arteries and coronary bypass gmfts. JMRI. 1996; I :
2. Van Rossum. The role of MR in the evaluation of functional results after CABGIPTCA. Int. J. Cardiac Imaging, 1993; 9:59-69.
2 19-222.
MR Assessment of Blood Flow and Flow Reserve in Internal Mammary Artery G d H. Sakuma,' N. Kawada,' K. Takeda,' B.P. C w , ' I. Yada,' C.B. Higgins.2 'Tsu, Mie, Japan; 'Sari Francisco, CA
Purpose: We assessed the internal mammary artery (MA) graft func- tion by measuring the flow pattern and vasodilator flow reserve using fast-velocity-encoded cine (VEC) MR imaging.
Methods: Eleven patients who had undergone IMA graft surgery and 13 healthy volunteers were studied. The time interval between IMA bypass graft surgery and MR imaging was 24.6 2 11 .O days (mean t SD). Selective x-ray angiography of the IMA graft was performed in all patients. Fast VEC MR images were acquired on imaging planes that were perpendicular to the vessels within a single breathhold time using k-space segmentation (TWTE 14I5 ms, VENC + I m/s). Fast
vu3 MR images of the IMA grafts were obtained in the basal state and after administration of dipyridamole. In five healthy volunteers, flow measurement in the native IMA was performed in the basal state. Flow velocities in the native coronary artery were assessed in the basal state and after dipyridamole injection in eight healthy volunteers.
Results: The IMA graft was patent at x-ray angiography in all pa- tients. Graft flow was characterized by a biphasic forward-flow pattern, with one peak in early systole and anothex in early diastole. In nine patients without graft stenosis, the diastoliclsystolic peak velocity ratio in the IMA gmtl was 2.17 -C 0.30, which was significantly higher than that in the native IMA in healthy volunteers (0.23 2 0.02, p < 0.01). In early postoperative state, the CFR ratio in the nonstenotic IMA grafts (1.67 2 0.17) was lower than the normal CFR ratio in the native coro- nary artery (3.1 1 2 0.48, p < 0.01). VEC MRI showed a decrease. in the diastolic flow in two patients with stenotic IMA grafts.
Conclusions: Fast VEC MR imaging is a noninvasive technique that can provide assessment of the functional adequacy of the IMA to coronary artery bypass grafts.
Analysis and Display of Phase-Contrast Data by Computational Fluid Dynamics Methods B.R Cowan. G.D. Mallinson. Au~Uund, New Zeuland Computational fluid dynamics (CFD) is the discipline concerned with the prediction of fluid motion by numerical solution of the fundamental equations of physics. These techniques have found-wide application in areas such as flow over aircraft, mund yacht keels, and in many indus- trial processes. In clinical applications where vessels are curved in a complex manner such as the aortic arch, clustered in a complex way as is commonly found in congenital heart disease or blood flow has a complex structure as may be encountered at the site of a stenosis, good visualization is essential. It is advantageous to obtain a three-dimen- sional velocity data set and to be able to view and analyze it in a single animated display format. Phase-contrast MR imaging (XI) produces images containing a rectangular grid of velocity data that is similar in many respects to the output from CFD solutions. The aim of this study was to develop a visualization package based on CFD techniques that woul& accept four-dimensional F'CI data and analyze and display these data in an intuitive and clinically useful format. PCI data containing multiple slices, each acquired with three orthogonal velocity sensitizing directions and gated over the cardiac cycle, were automatically read from storage into the software and the header information used to as- semble the data correctly. Although still evolving in response to clinical need, current capabilities include maps of vectors indicating the direc- tion (as a three-dimensional projection) and speed (by length and/or colour) of flow; simultaneous displays of single or multiple image planes, which may also be time varying or interpolated; calculated streamlines that indicate the path taken by a notional red blood cell; time varying absolute speed plots at interactively user defined location; and flow rates through user-defined regions of interest.
Visualization results are presented for a 20-year-old man who un- derwent surgery for coarctation of the aorta at 6 months of age. Five parasagittal slices were obtained to encompass the ascending arch and descending aorta. An asymmetrical jet of blood is demonstrated at the site of the repair with a peak velocity of 2.0 mls. Because of the three- dimensional nature of the software, it was possible to display the data in any plane and to systematically investigate the three-dimensional na- ture of the flow. Finally, quantitative flow rates, velocity information. and streamlines representing the path of notional red cells were ex- tracted at representative locations in the data set. The results presented demonstrate the utility of the application of computational fluid dynam- ics flow visualization approaches to the display and analysis of complex three-dimensional PCI data sets.
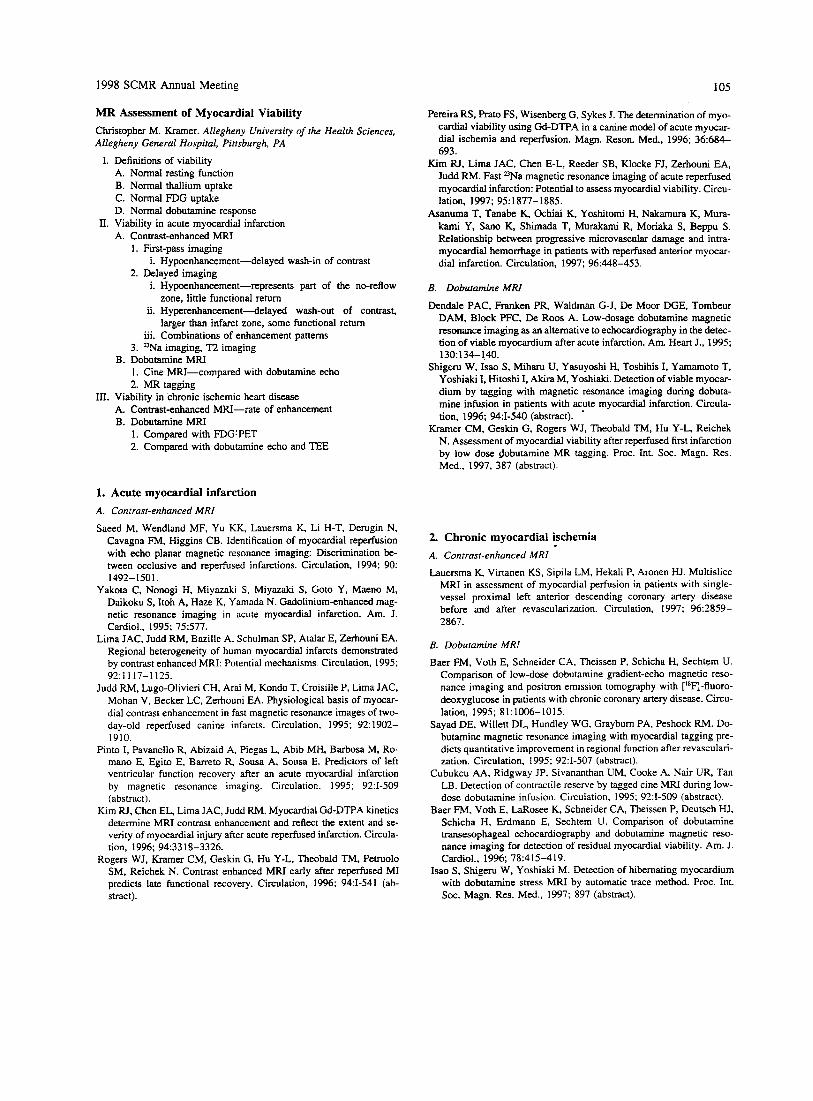
1998 SCMR Annual Meeting 105
MR Assessment of Myocardial Viability Christopher M. Kramer. Allegheny University of the Health Sciences, Allegheny General Hospital, Pittsburgh, PA
I. Definitions of viability A. Normal resting function B. Normal thallium uptake C. Normal FDG uptake D. Normal dobutamine response
A. Contrast-enhanced MRI 1. First-pass imaging
2. Delayed imaging
II. Viability in acute myocardial infarction
i. Hypoenhancement-delayed wash-in of contrast
i. Hypoenhancement-represents part of the no-reflow
ii. Hyperenhancement-delayed wash-out of contrast,
iii. Combinations of enhancement patterns
zone, little functional return
larger than infarct zone, some functional return
3. =Na imaging, T2 imaging B. Dobutamine MRI
1. Cine MRI-compared with dobutamine echo 2. MR tagging
111. Viability in chronic ischemic heart disease A. Contrast-enhanced MRI-rate of enhancement B. Dobutamine MRI
1. Cornpared with FDGLPET 2. Compared with dobutamine echo and TEE
1. Acute myocardial infarction A. Contrust-enhanced MRI
Saeed M, Wendland MF, Yu KK, Lauersma K, Li H-T, Derugin N, Cavagna FM, Higgins CB. Identification of myocardial reperfusion with echo planar magnetic resonance imaging: Discrimination be- tween occlusive and reperfused infarctions. Circulation, 1994; 90:
Yakota C, Nonogi H, Miyazaki S , Miyazaki S, Goto Y. Maeno M, Daikoku S , Itoh A, Haze K, Yamada N. Gadolinium-enhanced mag- netic resonance imaging in acute myocardial infarction. Am. J. Cardiol., 1995; 75577.
Lima JAC, Judd RM. Bazille A, Schulman SP, Atalar E, Zerhouni EA. Regional heterogeneity of human myocardial infarcts demonstrated by contrast enhanced MRI: Potential mechanisms Circulation, 1995; 92:1117-1125.
Judd RM, Lugo-Olivieri CH, Arai M. Kondo T, Croisille P, Lima JAC, Mohan V, Becker LC, Zerhouni EA. Physiological basis of myocar- dial contrast enhancement in fast magnetic resonance images of hvo- day-old reperfused canine infarcts. Circulation, 1995; 92: 1902- 1910.
Pinto I, Pavanello R, Abizaid A, Piegas L, Abib MH, Barbosa M, Ro- mano E, Egito E, Barreto R, Sousa A, Sousa E. Predictors of left ventricular function recovery after an acute myocardial infarction by magnetic resonance imaging. Circulation. 1995; 92:I-509 (abstract).
Kim RJ, Chen EL, Lima JAC, Judd RM. Myocardial Gd-DTPA kinetics determine MRI contrast enhancement and refiect the extent and se- verity of myocardial injury after acute reperfused infarction. Circula- tion, 1996; 94:3318-3326.
Rogers WJ, Kramer CM, Geskin G, Hu Y-L, Theobald TM, Petruolo SM, Reichek N. Contrast enhanced MRI early after reperfused MI predicts late functional recovery. Circulation, 1996; 94:I-541 (ab- stract).
1492-1501.
Pereira RS, Rat0 FS, Wisenberg G, Sykes J. The determination of myo- cardial viability using Gd-DTPA in a canine model of acute myocar- dial ischemia and reperfusion. Magn. Reson. Med., 1996; 36:684- 693.
Kim RJ, Lima JAC, Chen E-L, Reeder SB, Klocke FJ, Zerhouni EA, Judd RM. Fast 2)Na magnetic resonance imaging of acute reperfused myocardial infarction: Potential to assess myocardial viability. Circu- lation, 1997; 951877-1885.
Asanuma T, Tanabe K, Ochiai K, Yoshitomi H, Nakamura K, Mura- kami Y, Sano K, Shimada T, Murakami R, Moriaka S, Beppu S . Relationship between progressive microvascular damage and intra- myocardial hemorrhage in patients with reperfused anterior myocar- dial infarction. Circulation, 1997; 96:448-453.
B. Dobutamine MRI
Dendale PAC, Franken PR, Waldman G-J, De Moor DGE, Tombeur DAM, Block PFC, De Roos A. Low-dosage dobutamine magnetic resonance imaging as an alternative to echocardiography in the detec- tion of viable myocardium after acute infarction. Am. Heart J., 1995;
Shigem W, Isao S, Miharu U, Yasuyoshi H, Toshihis I, Yamamoto T, Yoshiaki I, Hitoshi I. Akira M, Yoshiaki. Detection of viable myocar- dium by tagging with magnetic resonance imaging during dobuta- mine infusion in patients with acute myocardial infarction. Circula- tion, 1996; 943-540 (abstract).
Kramer CM, Geskin G, Rogers WJ, Theobald TM, Hu Y-L, Reichek N. Assessment of myocardial viability after reperfused first infarction by low dose dobutamine MR tagging. Proc. Int. SOC. Magn. Res. Med., 1997, 387 (abstract).
130134-140.
2. Chronic myocardial ischemia A. Contrast-enhanced MRI
Lauersma K. Virtanen KS, Sipila LM, Hekali P, Aronen HJ. Multislice MRI in assessment of myocardial perfusion in patients with single- vessel p r o h a l left anterior descending coronary artery disease before and after revascularization. Circulation, 1997; 96:2859- 2867.
B. Dobutamine MRI
Baer FM, Voth E, Schneider CA, Theissen P, Schicha H, Sechtem U. Comparison of low-dose dobutamine gradient-echo magnetic reso- nance imaging and positron emission tomography with [lSF]-fluoro- deoxyglucose in patients with chronic coronary artery disease. Circu- lation, 1995; 81:1006-1015.
Sayad DE, Willett DL, Hundley WG, Grayburn PA, Peshock RM. Do- butamine magnetic resonance imaging with myocardial tagging pre- dicts quantitative improvement in regional function after revasculari- zation. Circulation, 1995; 92:I-507 (abstract).
Cubukcu AA, Ridgway JP, Sivananthan UM, Cooke A, Nair UR, Tan LB. Detection of contractile reserve by tagged cine MRI during low- dose dobutamine infusion. Circulation. 1995; 92:1-509 (abstract).
Baer FM, Voth E, LaRosee K, Schneider CA, Theissen P, Deutsch HJ, Schicha H, Erdmann E, Sechtem U. Comparison of dobutamine transesophageal echocardiography and dobutamine magnetic reso- nance imaging for detection of residual myocardial viability. Am. J. Cardiol., 1996; 78:415-419.
Isao S, Shigeru W, Yoshiaki M. Detection of hibernating myocardium with dobutamine stress MRI by automatic trace method. Proc. Int. Soc. Magn. Res. Med., 1997; 897 (abstract).

106 1998 SCMR Annual Meeting
Methods and Clinical Importance of Magnetic Resonance Imaging in the Diagnosis of Coronary Bypass Grafts T. Wittlinger,' T. Voigtliinder,' K.F. Kreitner? P. Kalden? K. Grauvoge1.I M. Thelen? J. Meyer.' I2nd Medical Clinic and Policlinic and =Department of Radwlogy, University Clinic, MainL G e m n y
The aim of this study was to evaluate the reliability of magnetic reso- nance imaging (MRI) in the assessment of coronary bypass grafts. we investigated 44 patients with a total of 113 bypass grafts. With 87 ve- nous and 26 arterial bypasses (IMA). Target vessel was in 41 cases the LAD, in 26 cases the RCA, in 8 cases the RCX, and in 38 cases side branches of the LAD or RCX. MRI (1.5 T Vision. Siemens AG. Er- langen) was performed using a multislice, electrocardiogram-gated, T2- weighted breathhold turbo spin-echo sequence (HASTE), a 3D angiog- raphy sequence with navigator echo-based respiratory gating (NAVI- GATOR). and a 3-D contrast-agentcnhanced angiography sequence (FISP). Standardized scan directions consisted of axial scans. long axis views parallel to the interventricular septum. and of tangential scam directed to the anterior wall of the left ventricle simulating the 50" left anterior oblique view of the coronary angiography. After MRI in all patients, coronary angiography was performed within 1 week The HASTE-sequence served as a fast orientation of the vessel course and as basis for planning flow quantitative measurements. A feature of the 3D angiography in navigator technique is the registration of the dia- phragm of the free-breathing patient. The FISP angiography sequence is characterized by short repetition and echo times. This sequence allows an investigation time of 25-32 seconds the imaging of the proxi- mal anastomosis and of the vessel course and of the distal anastomosis in about 80% of the cases.
Results:
Sequence Sensitivity Reliability Pos. Prognostic Value
HASTE 92% 97% 97% NAVIGATOR 82% 87% 100% 3D and contrast media 92% 94% 100%
These results show that coronary bypass grafts can reliably be detected using MRI. A total imaging of the vessel course is possible in most cases by combining different investigation techniques. The distal anas- tomosis can be detected in 80% of the bypass grafts.
References I . Pennel DJ, Bogren HG, Keegan J, Firmin DN, Underwood SR. As- sessment of coronary artery stenosis by magnetic resonance imaging. Heart. 1996; 127-133. 2. Buser PT, Higgins CB. Coronary artery graft disease: Diagnosis of graft failure by magnetic resonance imaging. In: Liischer TF, Turina M, Braunwald E eds. Coronary Artery Graft Disease: Mechanisms and Prevention. Berlin: Springer Verlag; 1994: 99- 1 12.
3D Coronary Imaging with Phase Reordering for Optimal Scan Efficiency P. Jhooti. J. Keegan, P.D. Gatehouse, A.M. Taylor, S. Collins, D.N. Finnin. Magnetic Resonance Unit. Royal Brompton Hospital. London, UK 3D coronary imaging techniques are limited by long acquisition times and respiratory motion artifacts. The purpose of this study was to inves- tigate the potential of applying phase encode reordering to 3D seg- mented acquisitions to allow larger navigator acceptance windows to be used to reduce the acquisition time while retaining image quality.
Methods: The mapping algorithm used was based on the hybrid ordered phase encoding method. This method, which was developed
for 2D imaging, has shown to be reliable and robust against variable respiratory patterns and patient motion. The reordering method uses a 10-mm window with the most frequent 5-mm range of positions used for the central 50% of k-space. The method was compared with the acceptance rejection algorithm (ARA) using a window of 5 mm, the diminishing variance algorithm (DVA) with its scan time set to that of the phase reordered scan, and retrospective respiratory gating (RRG). To test the methods in vitro. a specially designed coronary phantom was built. In vivo studies were also &ed out in 10 volunteers.
Results/Discusswn: Studies in vitro have shown the method to pro- duce a consistent image quality that was comparable or better than the other methods, with a considerable increase in scan efficiency. Results in vivo are also very promising. Statistical analysis of image quality showed no significant difference between phase reordering and ARA (p = 0.85%). However, a significant improvement was observed between phase reordering and both DVA ( p = 0.03) and RRG (p = 0.03). For scan efficiency, analysis showed a significant improvement between the phase reordering method and both ARA (72% vs. 48% respectively, p < 0.001) and RRG (72% vs. 20% respectively, p < 0.001).
Conclusiox The method presented improves image quality while maintaining a short acquisition time, compared with other currently ap- plied respiratory compensation methods.
(a) Phase reordered 10 mm (efficiency = 73%)
(b) ARA (efficiency = 49%)
(d) RRG (efficiency =. 20%)
Magnetic Resonance Angiography of Coronary Arteries with Gadolinium Enhancement
J. Zheng, D. Li, K.T. Bae, E.M. Haacke. St. Louis. MO
Purpose: We evaluated the feasibility of magnetic resonance (MR) im- aging of coronary arteries during first pass of gadolinium injection.
Merho&: A three-dimensional (3D) segmented gradient-echo se- quence was developed to image the coronary arteries within a single breathhold (TR 4 ms, Rip angle 25" data acquisition matrix 124 X 256, FOV 140 X 300 X 16 mm', breathhold time 30 s). ECG triggering was used to minimize cardiac motion. An anterior-posterior four-element phased array coil was used as the signal receiver, and the two posterior elements were turned off to avoid wrap-around artifacts when a small rectangular FOV was used. Every subject was first given a test bolus to determine the time of peak enhancement. Based on our experience, a delay of 10 s was expected between peaks of test bolus and a 20-s full-dose injection. A 35-ml gadolinium-DTPA contrast agent was then injected over 20 s and the 3D MR angiography sequence was initialized
1998 SCMR Annual Meeting 107
at a predetermined time so that the central k-space of data acquisition coincided with the peak concentration of gadolinium. Ten volunteers were studied.
Results: Roughly 1 X 1 mm2 in-plane resolution was achieved with this segmented 3D sequence. Signal-to-noise ratio and contrast-to-noise ratio were dramatically improved by injection of gadolinium. The figure
shows pre- and postcontrast images of a right coronary artery in a dou- ble oblique section from one subject.
Conclusion: Gadolinium-enhanced MR angiography improved the visualization of coronary arteries and may have potential utility to better detect coronary artery stenoses.
Precontnst
Postcontrast
Red-Time Navigator Gated and Corrected Three- Dimensional Coronary Magnetic Resonance Angiography Using T2 Preparation Prepulses for Contrast Enhancement R.M. Botnar, M. Stuber, K.V. Kissinger, P.G. Danias, W.J. Manning. Boston, MA
Coronary arteries are subject to cardiac and respiratory motion, which limits the spatial resolution of breathhold coronary M U . 2D selective navigator pulses can be used for respiratory gating and/or correction to allow for free-breathing coronary MRA (1-3). Despite motion arti- facts, the contrast behavior between blood, cardiac muscle, and epicar- dial fat is crucial for proper visualization of the coronary arteries. Fat signal is usually suppressed using a frequency selective prepulse. How- ever, coronary arteries may be embedded or rest adjacent to cardiac muscle that T1 relaxation time is close to blood. Therefore, a series of T2 preparation prepulses was applied to suppress signal of cardiac mus- cle (5 ) .
Methods: Five healthy adult subjects were examined in the supine position with a real-time respiratory navigator gated/corrected and ECG-gated 3D TFE imaging sequence. All measurements were per- formed on a 1.5-T Philips Gyroscan ACSlNT MR scanner (Philips Medical Systems, Best, The Netherlands) using a five-element phased array research cardiac coil. Imaging parameters were FOV 360 X 305 mm2. matrix 5 12 X 304, slice thickness 3 mm, resulting in an in-plane resolution of 0.7 X 1 .O mm' and volume coverage of 30 mm. The scan time was approximately 10-20 min. To shorten the acquisition window and to minimize flow artifacts, TR as the TE were set to their minimum values. Inflow was enhanced by acquiring data at middiastole (trigger delay 500-600 ms), a period of minimal cardiac motion, and rapid coro- nary flow. Before the 2D selective navigator pulse and before the fre- quency selective fat suppression prepulse, T2 preparation was per- formed using a series of nonselective 90'. I80", 180", 180". 180", and 90" prepulses.
Results: All five subjects were examined successfully without any evidence of respiratory motion artifacts, which allowed visualization of the proximal and midportions of the LAD and the LCX. Without T2 preparation, cardiac muscle and blood had a similar signal level. In all cases, application of T2 preparation prepulses helped to reduce signal of cardiac muscle, yielding an improved contrast behavior between cor- onary blood and cardiac muscle. The efficiency of the T2 preparation prepulses could be improved by lowering the acquisition window from 120 to 60 ms.
Conclusions: The application of a respiratory navigator together with a short acquisition window of 60 ms allows acquisition of respira- tory artifact free images. T2 preparation prepulses improve the contrast between the coronary arteries and cardiac muscle, which is crucial for proper visualization of the left coronary arteries. Further improvements toward a higher resolution have to overcome the limited signal-to-noise ratio of a noncontrast agent sequence.
References 1. Ehman RL, Felmlee JP. Radiology, 1989; 173:255-263. 2. Danias PG, et al. Radiology, 1997; 203:733-736. 3. McConnell MV, et al. Magn. Reson. Med., 37: 148-152. 4. Wang Y, et al. Magn. Reson. Med., 1995; 33:713-719. 5. Brittain JH, et al. Magn. Reson. Med., 1995; 33:689-696
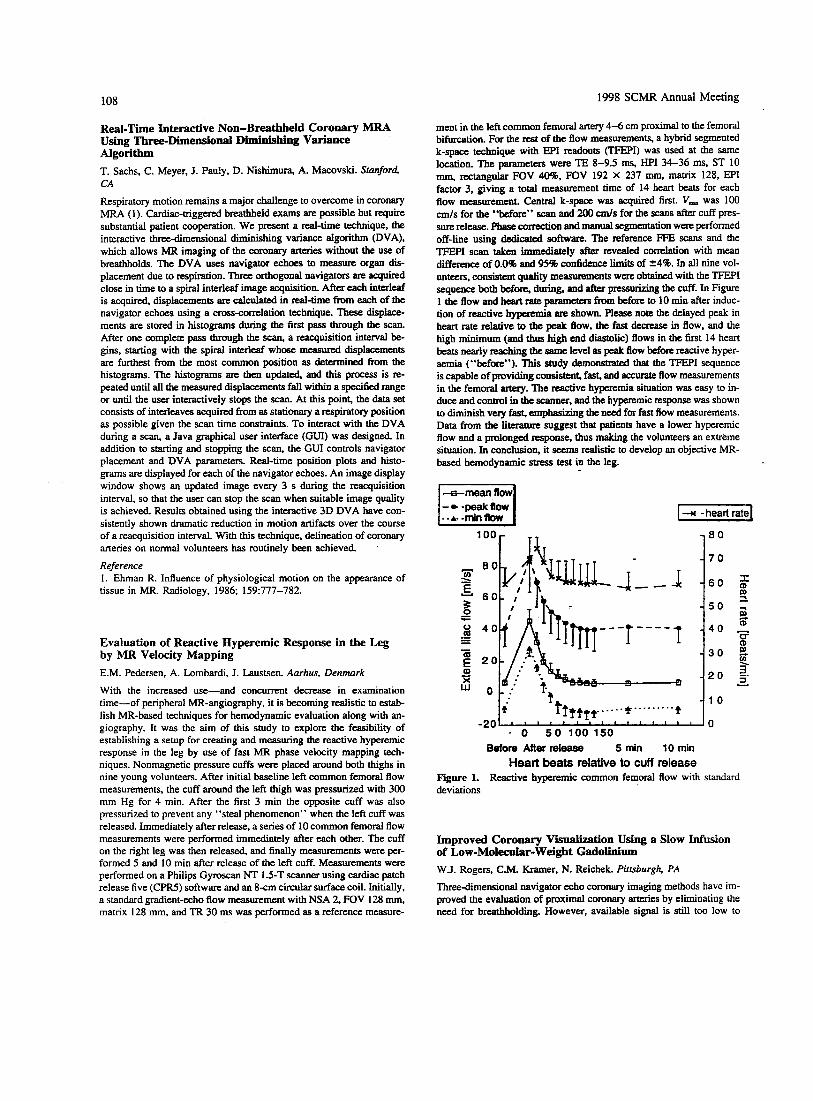
108 1998 SCMR Annual Meeting
Real-Time Interactive Non-Breathbeid Coronary MRA Using Three-Dimensional Diminishing Variance Algorithm T. Sachs, C. Meyer, J. Pauly, D. Nishimura, A. Macovski. Sranford CA
Respiratory motion remains a major challenge to overcome in coronary MRA (1). Cardiac-triggered breathheld exams are possible but require substantial patient cooperation. We present a real-time technique, the interactive three-dimensional diminishing variance algorithm (DVA), which allows MR imaging of the coronary arteries without the use of breathholds. The DVA uses navigator echoes to measure organ dis- placement due to respiration. Three orthogonal navigators are acquired close in time to a spiral interleaf image acquisition. After each interleaf is acquired, displacements are calculated in real-time from each of the navigator echoes using a cross-correlation technique. These displace- ments are stored in histograms during the first pass through the scan. After one complete pass through the scan, a reacquisition intend be- gins, starting with the spiral interleaf whose measured displacements are furthest from the most common position as determined from the histograms. The histograms are then updated, and this process is re- peated until all the measured displacements fall within a specified range or until the user interactively stops the scan. At this point, the data set consists of interleaves acquired from as stationary a respiratory position as possible given the scan time constraints. To interact with the DVA during a scan, a Java graphical user interface (GUI) was designed. In addition to starting and stopping the scan, the GUI controls navigator placement and DVA parameters. Real-time position plots and histo- grams are displayed for each of the navigator echoes. An image display window shows an updated image every 3 s during the reacquisition interval, so that the user can stop the scan when suitable image quality is achieved. Results obtained using the interactive 3D DVA have con- sistently shown dramatic reduction in motion ar&ifacts over the course of a reacquisition interval. With this technique, delineation of coronary arteries on normal volunteers has routinely been achieved.
Reference 1. Ehman R. Influence of physiological motion on the appearance of tissue in MR. Radiology, 1986; 159:777-782.
Evaluation of Reactive Hyperemic Response in the Leg by MR Velocity Mapping E.M. Pedersen, A. Lombardi, J. Laustsen. Aarhus, Denmark
With the increased use-and concurrent decrease in examination time-of peripheral MR-angiography, it is becoming realistic to estab- lish MR-based techniques for hernodynamic evaluation along with an- giography. It was the aim of this study to explore the feasibility of establishing a setup for creating and measuring the reactive hyperemic response in the leg by use of fast MR phase velocity mapping tech- niques. Nonmagnetic pressure cuffs were placed around both thighs in nine young volunteers. After initial baseline left common femoral flow measurements, the cuff around the left thigh was pressurized with 300 mm Hg for 4 min. After the first 3 min the opposite cuff was also pressurized to prevent any “steal phenomenon” when the left cuff was released. Immediately after release, a series of 10 common femoral flow measurements were performed immediately after each other. The cuff on the right leg was then released, and finally measurements were per- formed 5 and 10 min after release of the left cuff. Measurements were performed on a Philips Gyroscan NT 1.5-T scanner using cardiac patcb release five (CPRS) software and an 8-cm circular surface coil. Initially, a standard gradient-echo flow measurement with NSA 2, FOV 128 mm, matrix 128 mm. and TR 30 ms was performed as a reference measure-
ment in the left common femoral artery 4-6 cm proximal to the femoral bifurcation. For the rest of the flow measurements, a hybrid segmented k-space technique with EPI readouts (TFEPI) was used at the same location. The parameters were TE 8-9.5 ms, HPI 34-36 ms, ST 10 mm, rectangular FOV 40%. FOV 192 X 237 mm, matrix 128, EPI factor 3, giving a total measurement time of 14 heart beats for each flow measurement. Central k-space was acquired first. V,, was 100 cmls for the “before” scan and 200 cm/s for the scans after cuff pres- sure release. Pbase correction and manual segmentation were performed off-line using dedicated software. The reference FFE scans and the TFEPI scan taken immdmte . ly after revealed correlation with mean d i f fmce of 0.0% a d 95% confidence limits of 24%. In all nine vol- unteers, consistent quality measurements were obtained with the TFEPI sequence both before, during, and after pressurizing the cuff. In Figure 1 the flow and heart rate paramacrs from before to 10 min after induc- tion of reactive hypemnia are shown. Please note the delayed peak in heart rate relative to the peak flow, the fast decrease in flow, and the high minimum (and thus high end diastolic) flows in the first 14 heart beats nearly reaching the same level as peak flow before Ractive hyper- aemia (“before”). This study demonstrated hat the TFEF’I sequence is capable of providing consistent, fast, and accurate flow measurements in the femoral artery. The reactive hyperemia situation was easy to in- duce and conml in the scanner. and the hyperemic response was shown to diminish v a y fast, emphasizing the need for fast flow measurements. Data from the litaaave suggest that patients have a lower hyperemic flow and a prolonged response, thus making the volunteers an extreme situation. In conclusion. it seems realistic to develop an objective MR- based hemodynamic stress test in the leg.
1-n -heart rate]
180
7 0
6 0
5 0
4 0
3 0
2 0
10
n
H P, a
- - 0 5 0 100 150 Before After release 5 min 10 min
Heart beats relative to cuff release Figure 1. Reactive byperemic common femoral flow with standard deviations
Improved Coronary Visualization Using a Slow Infusion of Low-Molecular-Weight Gadolinium W.J. Rogers, C.M. Kramer. N. Reichek. Pittsburgh, PA
Three-dimensional navigator echo coronary imaging methods have im- proved the evaluation of proximal coronary arteries by eliminating the need for breatbholding. However, available signal is still too low to
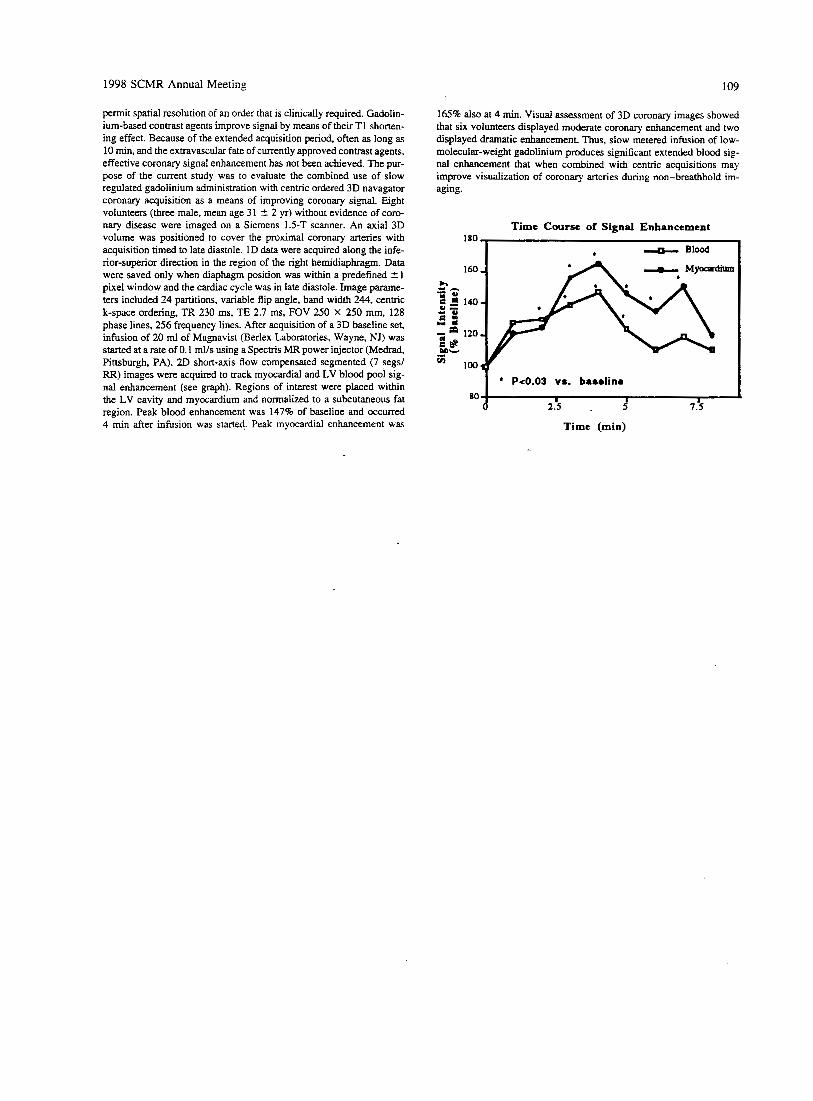
1998 SCMR Annual Meeting 109
permit spatial resolution of an order that is clinically required. Gadolin- ium-based contrast agents improve signal by means of their T1 shorten- ing effect. Because of the extended acquisition period, often as long as 10 min, and the extravascular fate of currently approved contrast agents, effective coronary signal enhancement has not been achieved. The pur- pose of the current study was to evaluate the combined use of slow regulated gadolinium administration with centric ordered 3D navagator coronary acquisition as a means of improving coronary signal. Eight volunteers (three male, mean age 31 -t 2 yr) without evidence of coro- nary disease were imaged on a Siemens 1.5-T scanner. An axial 3D volume was positioned to cover the proximal coronary artexies with acquisition timed to late diastole. 1D data were acquired along the infe- rior-superior directios in the region of the right hemidiaphragm. Data were saved only when diaphagm position was within a predefined f 1 pixel window and the cardiac cycle was in late diastole. Image parame- ters included 24 partitions, variable flip angle, band width 244, centric k-space ordering, TR 230 ms, TE 2.7 ms, FOV 250 X 250 mm, 128 phase lines, 256 frequency lines. After acquisition of a 3D baseline set, infusion of 20 ml of Magnavist (Berlex Laboratories, Wayne, NJ) was started at a rate of 0.1 mlls using a SpecVis MR power injector (Medrad, Pittsburgh, PA). 2D short-axis flow compensated segmented (7 segsl RR) images were acquired to track myocardial and LV blood pool sig- nal enhancement (see graph). Regions of interest were placed within the LV cavity and myocardium and normalized to a subcutaneous fat region. Peak blood enhancement was 147% of baseline and occurred 4 min after infusion was started. Peak myocardial enhancement was
165% also at 4 min. Visual assessment of 3D coronary images showed that six volunteers displayed moderate coronary enhancement and two displayed dramatic enhancement. Thus, slow metered infusion of low- molecular-weight gadolinium produces significant extended blood sig- nal enhancement that when combined with centric acquisitions may improve visualization of coronary arteries during non-breathhold im- aging.
Time Course of Signal Enhancement
I & Blood 1
* Pt0.03 vs. baselino I I I
2.5 . 5 7.5
Time (min)