oracle® fusion applications project management, project ... · pdf fileoracle® fusion...
TRANSCRIPT
Oracle® Fusion Applications Project Management, ProjectPerformance Reporting Guide
11g Release 5 (11.1.5)
Part Number E22601-05
June 2012
Oracle® Fusion Applications Project Management, Project Performance Reporting Guide
Part Number E22601-05
Copyright © 2011-2012, Oracle and/or its affiliates. All rights reserved.
Author: Sreya Dutta
This software and related documentation are provided under a license agreement containing restrictions on use anddisclosure and are protected by intellectual property laws. Except as expressly permitted in your license agreement orallowed by law, you may not use, copy, reproduce, translate, broadcast, modify, license, transmit, distribute, exhibit, perform,publish, or display any part, in any form, or by any means. Reverse engineering, disassembly, or decompilation of thissoftware, unless required by law for interoperability, is prohibited.
The information contained herein is subject to change without notice and is not warranted to be error-free. If you find anyerrors, please report them to us in writing.
If this is software or related documentation that is delivered to the U.S. Government or anyone licensing it on behalf of theU.S. Government, the following notice is applicable:
U.S. GOVERNMENT END USERS: Oracle programs, including any operating system, integrated software, any programsinstalled on the hardware, and/or documentation, delivered to U.S. Government end users are "commercial computersoftware" pursuant to the applicable Federal Acquisition Regulation and agency-specific supplemental regulations. As such,use, duplication, disclosure, modification, and adaptation of the programs, including any operating system, integratedsoftware, any programs installed on the hardware, and/or documentation, shall be subject to license terms and licenserestrictions applicable to the programs. No other rights are granted to the U.S. Government.
This software or hardware is developed for general use in a variety of information management applications. It is notdeveloped or intended for use in any inherently dangerous applications, including applications that may create a risk ofpersonal injury. If you use this software or hardware in dangerous applications, then you shall be responsible to take allappropriate fail-safe, backup, redundancy, and other measures to ensure its safe use. Oracle Corporation and its affiliatesdisclaim any liability for any damages caused by use of this software or hardware in dangerous applications.
Oracle and Java are registered trademarks of Oracle Corporation and/or its affiliates. Other names may be trademarks oftheir respective owners.
Intel and Intel Xeon are trademarks or registered trademarks of Intel Corporation. All SPARC trademarks are used underlicense and are trademarks or registered trademarks of SPARC International, Inc. AMD, Opteron, the AMD logo, and theAMD Opteron logo are trademarks or registered trademarks of Advanced Micro Devices. UNIX is a registered trademark ofThe Open Group.
This software or hardware and documentation may provide access to or information on content, products and services fromthird parties. Oracle Corporation and its affiliates are not responsible for and expressly disclaim all warranties of any kindwith respect to third-party content, products, and services. Oracle Corporation and its affiliates will not be responsible forany loss, costs, or damages incurred due to your access to or use of third-party content, products, or services.
Contents
1 Configure Performance Reporting for Projects
Tolerance Percentage: Explained .......................................................................................1-1
Summarized Financial Plan Types: Explained .................................................................. 1-1
Performance Trend Indicators: Explained .........................................................................1-2
FAQs for Configure Performance Reporting for Projects ..................................................1-3
2 Update Project Performance Data and Generate KPIs
Performance Data Summarization: How It Is Calculated ................................................. 2-1
KPI Components: How They Work Together ................................................................... 2-2
KPI Values: How They Are Generated ............................................................................. 2-5
KPI Trends: How They Are Calculated ............................................................................ 2-7
Calculating Current, Prior Period, and Prior Quarter KPI Values: Examples .................. 2-10
FAQs for Update Project Performance Data and Generate KPIs ..................................... 2-12
3 Analyze Project Performance
Performance Status for Tasks and Resources: How It Is Calculated ..................................3-1
FAQs for Analyze Project Performance ............................................................................ 3-3
FAQs for Review Project Comparison Graphs ..................................................................3-4
FAQs for Review KPI Watchlist Analysis ......................................................................... 3-5
FAQs for Review KPI Historical Trending ........................................................................3-6
FAQs for Review Project Financial Performance .............................................................. 3-6
FAQs for Perform Task and Resource Level Analysis .......................................................3-7

Preface
This Preface introduces the guides, online help, and other information sourcesavailable to help you more effectively use Oracle Fusion Applications.
Oracle Fusion Applications Help
You can access Oracle Fusion Applications Help for the current page, section,activity, or task by clicking the help icon. The following figure depicts the helpicon.
You can add custom help files to replace or supplement the provided content.Each release update includes new help content to ensure you have access to thelatest information. Patching does not affect your custom help content.
Oracle Fusion Applications Guides
Oracle Fusion Applications guides are a structured collection of the helptopics, examples, and FAQs from the help system packaged for easy downloadand offline reference, and sequenced to facilitate learning. You can access theguides from the Guides menu in the global area at the top of Oracle FusionApplications Help pages.
NoteThe Guides menu also provides access to the business process models on whichOracle Fusion Applications is based.
Guides are designed for specific audiences:
• User Guides address the tasks in one or more business processes. They areintended for users who perform these tasks, and managers looking for anoverview of the business processes. They are organized by the businessprocess activities and tasks.
• Implementation Guides address the tasks required to set up an offering,or selected features of an offering. They are intended for implementors.They are organized to follow the task list sequence of the offerings, asdisplayed within the Setup and Maintenance work area provided byOracle Fusion Functional Setup Manager.
• Concept Guides explain the key concepts and decisions for a specificarea of functionality. They are intended for decision makers, such as chieffinancial officers, financial analysts, and implementation consultants. Theyare organized by the logical flow of features and functions.
• Security Reference Manuals describe the predefined data that is includedin the security reference implementation for one offering. They areintended for implementors, security administrators, and auditors. They areorganized by role.
These guides cover specific business processes and offerings. Common areas areaddressed in the guides listed in the following table.
Guide Intended Audience Purpose
Common User Guide All users Explains tasks performed by mostusers.
Common Implementation Guide Implementors Explains tasks within theDefine Common ApplicationsConfiguration task list, which isincluded in all offerings.
Information TechnologyManagement, ImplementApplications Guide
Implementors Explains how to use OracleFusion Functional Setup Managerto plan, manage, and trackyour implementation projects,migrate setup data, and validateimplementations.
Technical Guides System administrators,application developers,and technical members ofimplementation teams
Explain how to install, patch,administer, and customize OracleFusion Applications.
For guides that are not available from the Guides menu, go to Oracle TechnologyNetwork at http://www.oracle.com/technetwork/indexes/documentation.
Other Information Sources
My Oracle Support
Oracle customers have access to electronic support through My OracleSupport. For information, visit http://www.oracle.com/pls/topic/lookup?ctx=acc&id=info or visit http://www.oracle.com/pls/topic/lookup?ctx=acc&id=trs if you are hearing impaired.
Use the My Oracle Support Knowledge Browser to find documents for a productarea. You can search for release-specific information, such as patches, alerts,white papers, and troubleshooting tips. Other services include health checks,guided lifecycle advice, and direct contact with industry experts through the MyOracle Support Community.
Oracle Enterprise Repository for Oracle Fusion Applications
Oracle Enterprise Repository for Oracle Fusion Applications provides visibilityinto service-oriented architecture assets to help you manage the lifecycle ofyour software from planning through implementation, testing, production,
and changes. In Oracle Fusion Applications, you can use the Oracle EnterpriseRepository for Oracle Fusion Applications at http://fusionappsoer.oracle.comfor:
• Technical information about integrating with other applications, includingservices, operations, composites, events, and integration tables. Theclassification scheme shows the scenarios in which you use the assets, andincludes diagrams, schematics, and links to other technical documentation.
• Publishing other technical information such as reusable components,policies, architecture diagrams, and topology diagrams.
Documentation Accessibility
For information about Oracle's commitment to accessibility, visit the OracleAccessibility Program website at http://www.oracle.com/us/corporate/accessibility/index.html.
Comments and Suggestions
Your comments are important to us. We encourage you to send us feedbackabout Oracle Fusion Applications Help and guides. Please send yoursuggestions to [email protected]. You canuse the Send Feedback to Oracle link in the footer of Oracle Fusion ApplicationsHelp.

Configure Performance Reporting for Projects 1-1
1Configure Performance Reporting for
Projects
Tolerance Percentage: Explained
Tolerance percentages are used to compare the previous key performanceindicator (KPI) value to the current value to arrive at the performance trend.
Trend indicators are calculated based on the percentage increase or decrease in aKPI value and the tolerance percentage on the KPI definition.
Example of Tolerance Percentage
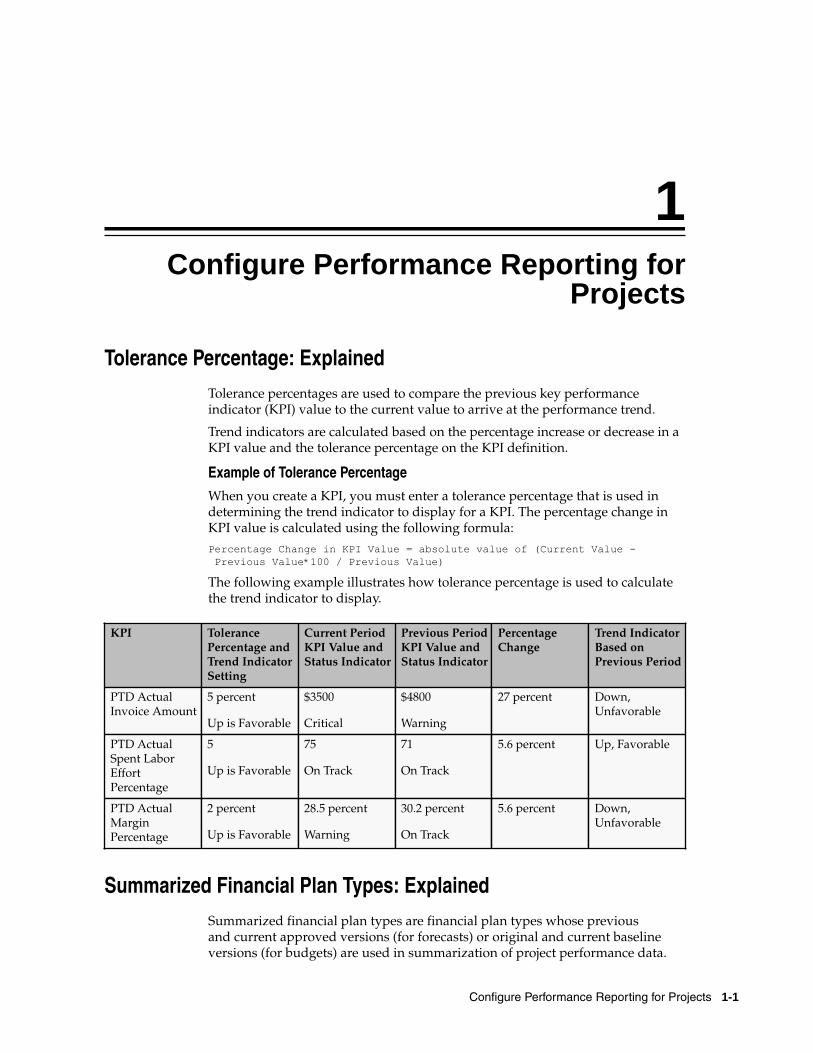
When you create a KPI, you must enter a tolerance percentage that is used indetermining the trend indicator to display for a KPI. The percentage change inKPI value is calculated using the following formula:
Percentage Change in KPI Value = absolute value of (Current Value - Previous Value*100 / Previous Value)
The following example illustrates how tolerance percentage is used to calculatethe trend indicator to display.
KPI TolerancePercentage andTrend IndicatorSetting
Current PeriodKPI Value andStatus Indicator
Previous PeriodKPI Value andStatus Indicator
PercentageChange
Trend IndicatorBased onPrevious Period
PTD ActualInvoice Amount
5 percent
Up is Favorable
$3500
Critical
$4800
Warning
27 percent Down,Unfavorable
PTD ActualSpent LaborEffortPercentage
5
Up is Favorable
75
On Track
71
On Track
5.6 percent Up, Favorable
PTD ActualMarginPercentage
2 percent
Up is Favorable
28.5 percent
Warning
30.2 percent
On Track
5.6 percent Down,Unfavorable
Summarized Financial Plan Types: Explained
Summarized financial plan types are financial plan types whose previousand current approved versions (for forecasts) or original and current baselineversions (for budgets) are used in summarization of project performance data.
1-2 Oracle Fusion Applications Project Management, Project Performance Reporting Guide
Particular financial plan types are included in summarization by default, whileyou must manually select others.
Default Financial Plan Types
Approved forecast and baseline budget versions of the following financial plantypes are automatically included in summarization of project performance data:
• Approved Revenue Budget
• Approved Cost Budget
• Primary Revenue Forecast
• Primary Cost Forecast
Important
A budget or forecast financial plan type may support both cost and revenue inone version.
User-Selected Financial Plan Types
Apart from the default financial plan types, you can include up to four others insummarization of project performance data.
Tip
You can include a financial plan type before it is used on a project for creating aversion.
You can replace a user-selected financial plan type until project performance datais summarized for reporting. After that, you can only disable the financial plantype to exclude it from further summarization.
Performance Trend Indicators: Explained
Project performance trend indicators show whether project performance isfavorable or unfavorable.
When you sort rows in a table by the trend indicator, the order is based onthe sort order specified on the trend indicator definition. You can change thedefault sort order. For example, you can specify that KPIs or projects with anunfavorable trend appear at the top of the list.
The following are the attributes in the trend indicator setup.
Name
Displays the predefined trend indicator name that can be viewed when youmove the cursor over the trend indicator image. The following are the predefinedtrend indicator names:
• Up, favorable
Configure Performance Reporting for Projects 1-3
• Up, unfavorable
• Down, favorable
• Down, unfavorable
• Unchanged
Description
Describes what the trend indicator signifies when it appears against a project or aKPI.
Modifying Sort Order
The sort order of a trend indicator is a number between 1 and 5. If the sortorder of a trend indicator is set to 1, the KPI or project appears at the top of thelist. Similarly, if the sort order of a trend indicator is set to 5, the KPI or projectappears at the bottom of the list. For example, if you want the KPIs or projectsthat have an unfavorable trend to appear at the top of the table, you can changethe sort order of the Up, unfavorable and Down, unfavorable trend indicatorsto 1 and 2.
Image Preview
Displays a preview of the image that appears for each trend indicator.
FAQs for Configure Performance Reporting for Projects
Can I specify the budgets and forecasts to include in summarization?
Certain financial plan types are included in summarization by default, while youmust manually select others. Approved forecast and baseline budget versions ofthe following financial plan types are automatically included in summarizationof project performance data:
• Approved Revenue Budget
• Approved Cost Budget
• Primary Revenue Forecast
• Primary Cost Forecast
Apart from the default financial plan types, you can include up to four others insummarization of project performance data.
Can I replace a financial plan type that is enabled for summarization on a
project?
Yes. You can replace or disable any user-selected financial plan type beforeproject performance data is summarized for reporting.
1-4 Oracle Fusion Applications Project Management, Project Performance Reporting Guide
Can I select the regions to appear on Project Performance Reporting dashboard
pages?
Yes. Using the Personalization option you can select the Edit Current Pageoption in the Personalization list to show or hide regions. You can also modifythe arrangement of the region layouts using the Change Layout option.
Can I select the columns to appear in the Project Performance Reporting
dashboard tables?
Yes. The View menu in the region gives you options to add or remove columnsin a region.
Update Project Performance Data and Generate KPIs 2-1
2Update Project Performance Data and
Generate KPIs
Performance Data Summarization: How It Is Calculated
Summarization is a systematic organization of information for purposes ofproject analysis and tracking. You use summarized data to analyze the health ofprojects and drill down to the causes of any deviation from set thresholds. Youcan complete the following tasks using summarized data:
• Analyzing project performance data
• Reviewing project performance
• Analyzing KPI categories and KPIs
• Tracking project progress
• Viewing revenue and invoice summaries
After you run summarization, the KPI related information is rendered out ofdate with respect to the latest summarized information. Therefore, it is importantthat you generate KPI values once the summarization process is completed. Youcan avoid generating KPI values manually, by enabling automatic generation ofKPI values in the summarization options.
Settings That Affect Performance Data Summarization
You summarize data for a project unit or a business unit. You can alsosummarize performance data for a range of projects or projects owned by aproject manager. Besides this, you must specify the following parameters eachtime you want to run the summarization process manually:
• Select the appropriate summarization method:
• Incremental, for general purpose summarization.
• Bulk, for summarizing large amounts of data all at once.
• Delete and resummarize, for correcting summary data when the sourcesystem data is changed outside the regular transaction flow.

2-2 Oracle Fusion Applications Project Management, Project Performance Reporting Guide
• Resource breakdown structure, for migrating all summary data fromone resource breakdown structure version to the next. If you select thisoption you must also specify the resource breakdown structure header.
• Specify whether to summarize budget and forecast, commitment, actualcost, revenue and invoice, and client extension transactions.
How Performance Data Summarization Is Calculated
Performance data summarization collects data from various sources and assignsamounts to relevant tasks and resources in the project. After data is summarized,you can view how much is being spent on, incurred by, or received by a task orresource. Also, data is grouped according to periods so that it can be trackedacross different time lines.
You can run the summarization process for different situations, such as:
• Your data is out of date and you want to update it.
• Your data is corrupt and you want to delete the existing data andresummarize.
• You have a large volume of data that is not yet summarized and want tosummarize the entire bulk of data in one run.
After you select the parameters for summarization and submit a request, theapplication performs the following steps to generate the data that you view inthe application:
• Scope summarization by determining the list of projects, contracts, andbatches of transaction data for which to run summarization.
• Extract data to be summarized from data sources, group it by periods, andensure the data is prepared for resource mapping.
• Populate summary data into designated tables before resource breakdownstructure mapping.
• Populate business unit, project unit, and other lookup information.
• Populate performance reporting dimension data including time, taskbreakdown structure, and resource breakdown structure.
• Look up resource breakdown structure mappings, scenario dimensionmembers, period IDs, and prepare data for Essbase load.
• Load data into Essbase and merge data into summary tables.
You can track the progress of summarization on the process monitor. If theprocess fails to complete, it continues from the point of failure when youresubmit it.
KPI Components: How They Work Together
A key performance indicator (KPI) enables you to define thresholds of possiblevalues for a performance measure for any project in a project unit. During KPI
Update Project Performance Data and Generate KPIs 2-3
definition, you associate a performance status indicator with each thresholdlevel. When you generate KPI values, the application compares the value againstthe thresholds defined for the KPI. If the value falls within any of the definedthreshold levels, then the application associates the status indicator of thatthreshold with the performance measure. The following are the KPI componentswe will discuss:
• Performance Measure
• Performance Status Indicator
• Threshold Level
• Trend Indicator
• Tolerance Percentage
• Project Performance Data
• Project Unit
Performance Measure
Oracle Fusion Project Performance Reporting provides both fundamental andderived measures that present an objective insight into the performance of theproject. In addition, you can create custom measures to meet the unique needs ofyour organization. Use any delivered or custom performance measure to create aKPI.
Performance measures are available in the areas of budgets and forecasts, billingand revenue, costs, effort, margin, capitalization, and more. Following areexamples of predefined performance measures:
• EAC Budget Cost (the estimate at completion burdened cost from thecurrent baseline budget)
• ITD Forecast Revenue Variance (the inception-to-date current baselinebudget revenue - current approved forecast revenue)
• Prior Period Margin Percentage Variance (the prior period currentbaseline budget margin percentage - actual margin percentage)
A performance measure is associated with a time dimension. The following timedimensions are available:
• Estimate-at-completion (EAC)
• Inception-to-date (ITD)
• Prior Period
• Period-to-date (PTD)
• Quarter-to-date (QTD)
• Year-to-date (YTD)
A particular performance measure set, such as Budget Cost, can have as many assix performance measures: one for each time dimension.
A performance measure can be expressed as a currency amount, as a percentage,or in time units such as hours when effort is measured. If the KPI is used on

2-4 Oracle Fusion Applications Project Management, Project Performance Reporting Guide
projects that use different currencies, you can enter different thresholds levels foreach currency you need.
Performance Status Indicator
Performance status indicators give an immediate picture of the status of aproject, such as critical, at risk, and on track. Icons with unique colors and shapesindicate the status and severity of performance. During KPI definition, you firstassociate status indicators with performance statuses:
• Critical
• Severe
• At risk
• On track
• Ahead
You then associate these statuses with threshold levels. When KPI values aregenerated for a project, each value is compared to the defined thresholds andthe corresponding status indicator for the KPI appears on project performancereports.
A status can identify negative performance so that you can take the appropriateactions to prevent or quickly resolve problems. Conversely, a status can identifypositive performance to help you track expected or excellent performance.
Threshold Level
During KPI definition, you define threshold levels to cover all possible values fora KPI. If a KPI value exceeds the range of values defined for the KPI thresholdlevels, the closest threshold is used to determine the KPI status. For example, ifa KPI value falls below the lowest threshold level, the application assigns thestatus of the lowest threshold level to the KPI.
A status indicator can be associated with more than one threshold level. Forexample, both underutilization and overutilization of resources can indicate acritical performance status.
Trend Indicator
Performance trend indicators give an immediate picture of improving orworsening KPI value trends on the project. Icons with unique colors and shapesindicate whether an increasing performance trend has a positive or negativeimpact. For example, an increase in nonbillable costs is considered unfavorableto organizations that are able to bill costs to their clients. In this example, theperformance trend indicator will show a negative impact.
Tolerance Percentage
A tolerance percentage is used to compare the previous KPI value to the currentvalue to show if the performance trend is increasing, decreasing, or stayingthe same. For example, if the tolerance percentage is 10 percent for a KPI, andthe difference between the previous KPI value and current value is greaterthan 10 percent, then the trend is increasing. If the difference is greater than -10percent, then the trend is decreasing. If the difference is between -10 percent
Update Project Performance Data and Generate KPIs 2-5
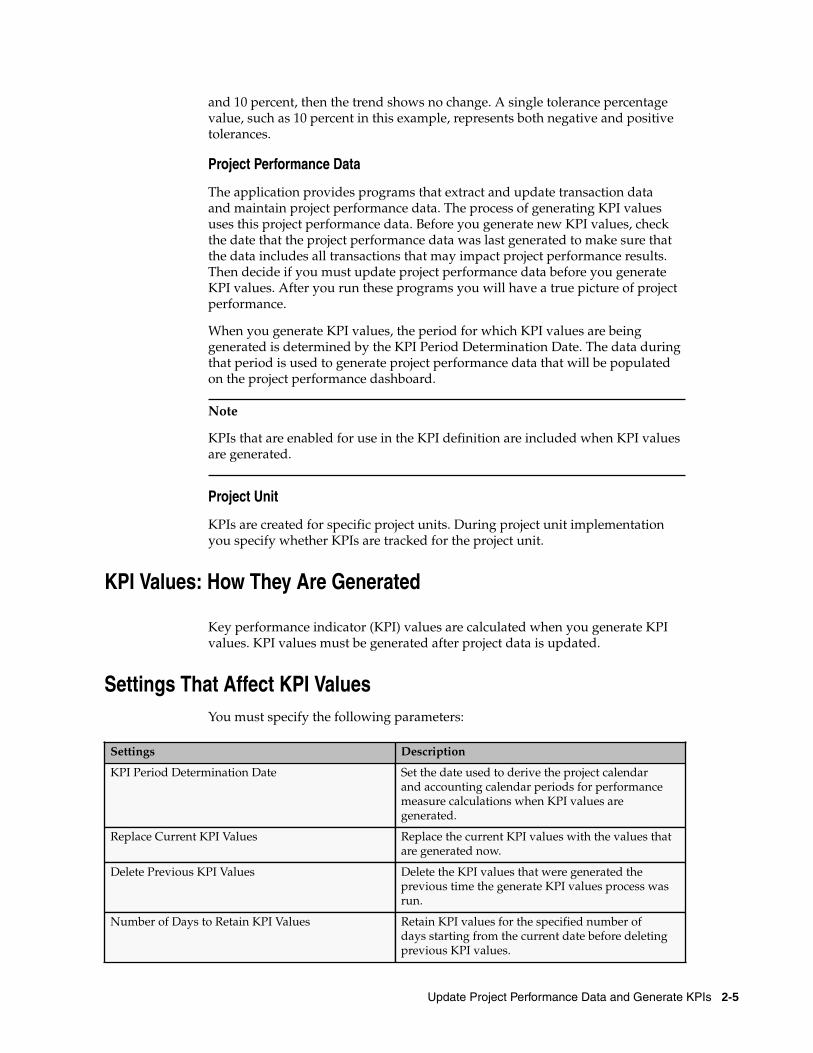
and 10 percent, then the trend shows no change. A single tolerance percentagevalue, such as 10 percent in this example, represents both negative and positivetolerances.
Project Performance Data
The application provides programs that extract and update transaction dataand maintain project performance data. The process of generating KPI valuesuses this project performance data. Before you generate new KPI values, checkthe date that the project performance data was last generated to make sure thatthe data includes all transactions that may impact project performance results.Then decide if you must update project performance data before you generateKPI values. After you run these programs you will have a true picture of projectperformance.
When you generate KPI values, the period for which KPI values are beinggenerated is determined by the KPI Period Determination Date. The data duringthat period is used to generate project performance data that will be populatedon the project performance dashboard.
Note
KPIs that are enabled for use in the KPI definition are included when KPI valuesare generated.
Project Unit
KPIs are created for specific project units. During project unit implementationyou specify whether KPIs are tracked for the project unit.
KPI Values: How They Are Generated
Key performance indicator (KPI) values are calculated when you generate KPIvalues. KPI values must be generated after project data is updated.
Settings That Affect KPI Values
You must specify the following parameters:
Settings Description
KPI Period Determination Date Set the date used to derive the project calendarand accounting calendar periods for performancemeasure calculations when KPI values aregenerated.
Replace Current KPI Values Replace the current KPI values with the values thatare generated now.
Delete Previous KPI Values Delete the KPI values that were generated theprevious time the generate KPI values process wasrun.
Number of Days to Retain KPI Values Retain KPI values for the specified number ofdays starting from the current date before deletingprevious KPI values.

2-6 Oracle Fusion Applications Project Management, Project Performance Reporting Guide
For example, assume KPI values were generated on the following dates:
KPI Period Determination Date Generation Date
October 29, 2010 November 12, 2010
September 30, 2010 October 15, 2010
If you generate KPI values on November 18, 2010 and select to replace thecurrent KPI values, the KPI values generated on November 12, 2010 are deletedand replaced with KPI values generated on November 18, 2010. You must selectto replace the current KPI values for a given period if you want to retain one setof KPI values and review KPI values during the period.
You can also delete KPI values that are not required for reporting. The options,Delete Previous KPI Values and Number of Days to Retain KPI Values, enableyou to delete KPI values that were generated prior to a specific number of days.For example, if today is November 18, and you want to remove all KPI valuesgenerated in the previous year, you must select to delete previous KPI values,and set Number of Days to Retain KPI Values to 322. All KPI values createdsince January 1, 2010 are retained and KPI values generated before that periodare deleted.
Important
Do not delete previous KPI values in the following cases:
• When you are generating KPI values for the first time in a period.
• If you want to see trending information for the KPIs over the life of theproject.
When you generate KPI values, you can select to receive a notification by e-mailby enabling workflow notifications, once KPI values are generated.
How KPI Values Are Generated
KPI values are calculated based on the value of the performance measureassociated with the project. When you generate KPI values, the KPI perioddetermination date is compared to the current date to determine the period. KPIvalues are generated for the period based on the options in the key performanceindicator definition. Only one set of key performance indicators is kept for asingle KPI period determination date.
For example, KPI values are generated for a KPI period determination date ofAugust 24 at 8:15 a.m. for Projects A and B. Then KPI values are generated for aKPI period determination date of August 24 at 10:45 a.m. just for Project B. TheKPI values for Project B generated at 8:15 a.m. are deleted, but KPIs belonging toProject A are retained.
Note
To keep historical information, use a unique KPI period determination date.
Update Project Performance Data and Generate KPIs 2-7
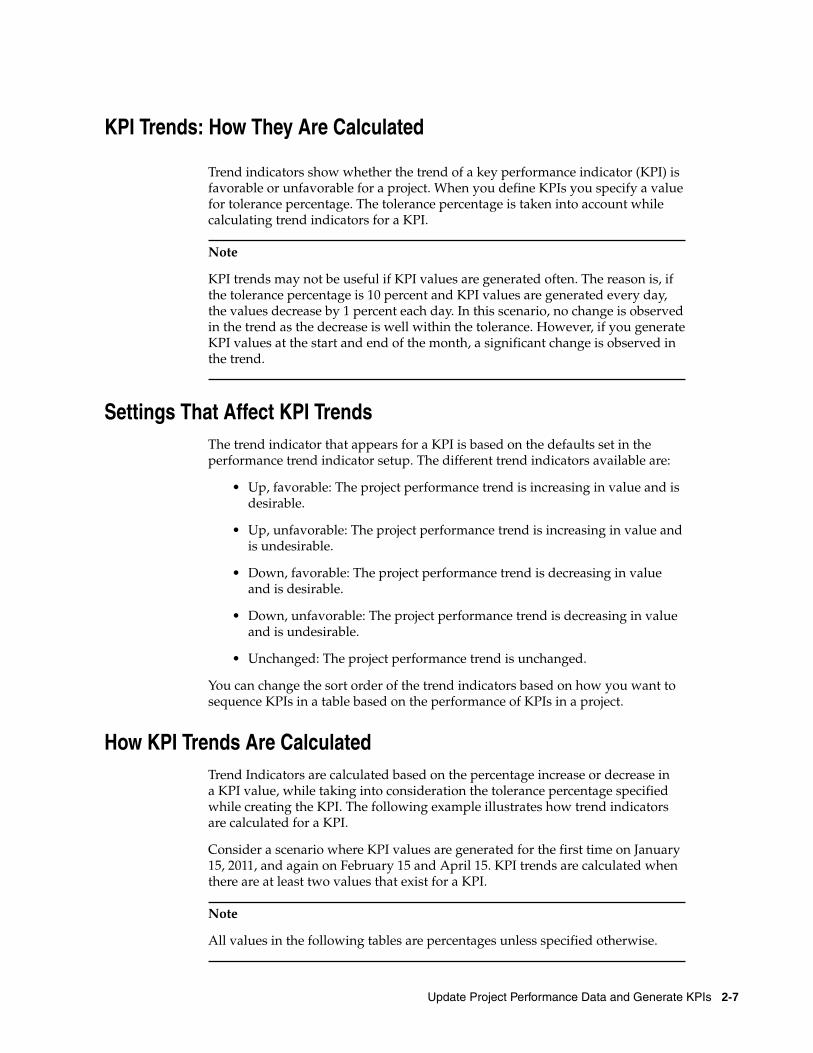
KPI Trends: How They Are Calculated
Trend indicators show whether the trend of a key performance indicator (KPI) isfavorable or unfavorable for a project. When you define KPIs you specify a valuefor tolerance percentage. The tolerance percentage is taken into account whilecalculating trend indicators for a KPI.
Note
KPI trends may not be useful if KPI values are generated often. The reason is, ifthe tolerance percentage is 10 percent and KPI values are generated every day,the values decrease by 1 percent each day. In this scenario, no change is observedin the trend as the decrease is well within the tolerance. However, if you generateKPI values at the start and end of the month, a significant change is observed inthe trend.
Settings That Affect KPI Trends
The trend indicator that appears for a KPI is based on the defaults set in theperformance trend indicator setup. The different trend indicators available are:
• Up, favorable: The project performance trend is increasing in value and isdesirable.
• Up, unfavorable: The project performance trend is increasing in value andis undesirable.
• Down, favorable: The project performance trend is decreasing in valueand is desirable.
• Down, unfavorable: The project performance trend is decreasing in valueand is undesirable.
• Unchanged: The project performance trend is unchanged.
You can change the sort order of the trend indicators based on how you want tosequence KPIs in a table based on the performance of KPIs in a project.
How KPI Trends Are Calculated
Trend Indicators are calculated based on the percentage increase or decrease ina KPI value, while taking into consideration the tolerance percentage specifiedwhile creating the KPI. The following example illustrates how trend indicatorsare calculated for a KPI.
Consider a scenario where KPI values are generated for the first time on January15, 2011, and again on February 15 and April 15. KPI trends are calculated whenthere are at least two values that exist for a KPI.
Note
All values in the following tables are percentages unless specified otherwise.

2-8 Oracle Fusion Applications Project Management, Project Performance Reporting Guide
KPI Values Generated on January 15, 2011
KPI TolerancePercentage andTrend IndicatorSetting
Current KPIValue and StatusIndicator
Previous KPIValue and StatusIndicator
Trend Indicator
PTD Actual SpentLabor EffortPercentage
5
Up is Favorable
70
On Track
- -
PTD Actual SpentEquipment EffortPercentage
5
Up is Unfavorable
30
On Track
- -
PTD Actual InvoiceAmount
5
Up is Favorable
$5000
Warning
- -
Actual Billable CostPercentage
2
Up is Favorable
90
On Track
- -
PTD Actual MarginPercentage
2
Up is Favorable
30
On Track
- -
After generating KPI values on January 15, 2011, the most critical KPI is PTDActual Invoice Amount. The overall project health status is Warning, because themost critical KPI, PTD Actual Invoice Amount, has a status of Warning.
KPI Values Generated on February 15, 2011
KPI TolerancePercentage andTrend IndicatorSetting
Current Period KPIValue and StatusIndicator
Previous PeriodKPI Value andStatus Indicator
Trend Indicatorbased on PreviousPeriod
PTD Actual SpentLabor EffortPercentage
5
Up is Favorable
71
On Track
70
On Track
Unchanged
PTD Actual SpentEquipment EffortPercentage
5
Up is Unfavorable
29
On Track
30
On Track
Unchanged
PTD Actual InvoiceAmount
5
Up is Favorable
$4800
Warning
$5000
Warning
Unchanged
Actual Billable CostPercentage
2
Up is Favorable
91
On Track
90
On Track
Unchanged
PTD Actual MarginPercentage
2
Up is Favorable
30.2
On Track
30
On Track
Unchanged
This table shows how the trend indicator is calculated based on the previousperiod. Although the KPI values for the current period are different from theprevious period, the difference in the values is not significant enough to changethe trend indicator, based on the tolerance percentage defined for each KPI. For
Update Project Performance Data and Generate KPIs 2-9
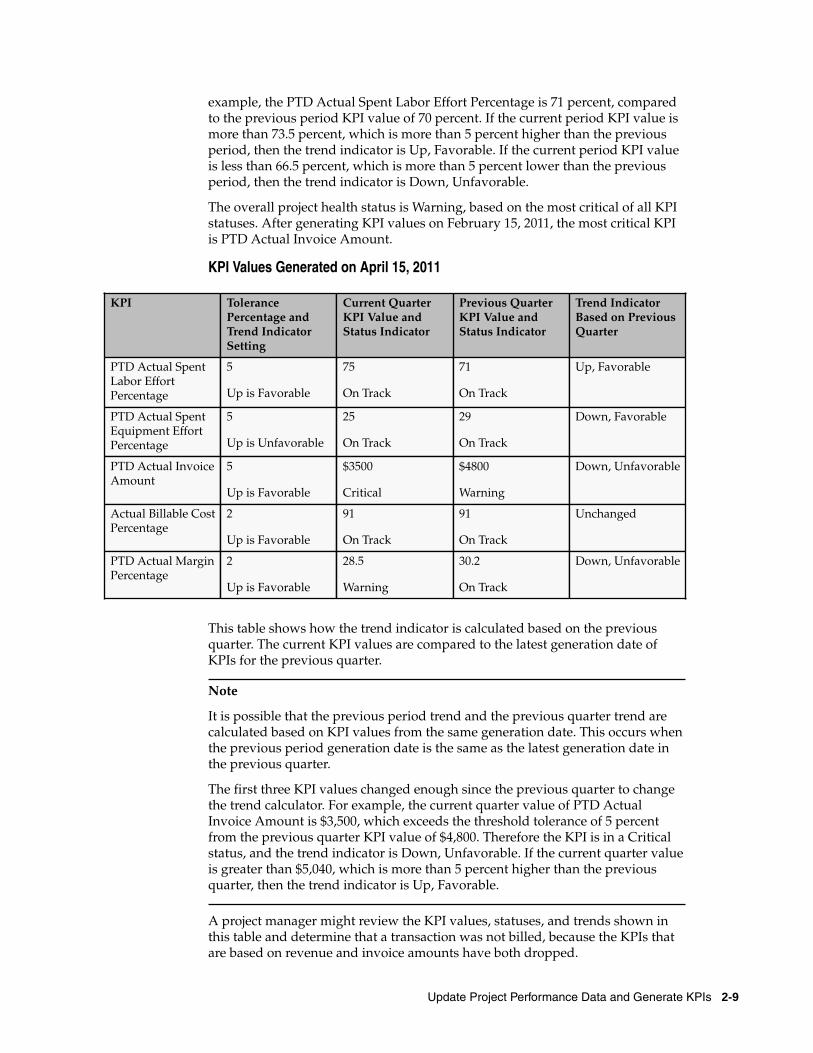
example, the PTD Actual Spent Labor Effort Percentage is 71 percent, comparedto the previous period KPI value of 70 percent. If the current period KPI value ismore than 73.5 percent, which is more than 5 percent higher than the previousperiod, then the trend indicator is Up, Favorable. If the current period KPI valueis less than 66.5 percent, which is more than 5 percent lower than the previousperiod, then the trend indicator is Down, Unfavorable.
The overall project health status is Warning, based on the most critical of all KPIstatuses. After generating KPI values on February 15, 2011, the most critical KPIis PTD Actual Invoice Amount.
KPI Values Generated on April 15, 2011
KPI TolerancePercentage andTrend IndicatorSetting
Current QuarterKPI Value andStatus Indicator
Previous QuarterKPI Value andStatus Indicator
Trend IndicatorBased on PreviousQuarter
PTD Actual SpentLabor EffortPercentage
5
Up is Favorable
75
On Track
71
On Track
Up, Favorable
PTD Actual SpentEquipment EffortPercentage
5
Up is Unfavorable
25
On Track
29
On Track
Down, Favorable
PTD Actual InvoiceAmount
5
Up is Favorable
$3500
Critical
$4800
Warning
Down, Unfavorable
Actual Billable CostPercentage
2
Up is Favorable
91
On Track
91
On Track
Unchanged
PTD Actual MarginPercentage
2
Up is Favorable
28.5
Warning
30.2
On Track
Down, Unfavorable
This table shows how the trend indicator is calculated based on the previousquarter. The current KPI values are compared to the latest generation date ofKPIs for the previous quarter.
Note
It is possible that the previous period trend and the previous quarter trend arecalculated based on KPI values from the same generation date. This occurs whenthe previous period generation date is the same as the latest generation date inthe previous quarter.
The first three KPI values changed enough since the previous quarter to changethe trend calculator. For example, the current quarter value of PTD ActualInvoice Amount is $3,500, which exceeds the threshold tolerance of 5 percentfrom the previous quarter KPI value of $4,800. Therefore the KPI is in a Criticalstatus, and the trend indicator is Down, Unfavorable. If the current quarter valueis greater than $5,040, which is more than 5 percent higher than the previousquarter, then the trend indicator is Up, Favorable.
A project manager might review the KPI values, statuses, and trends shown inthis table and determine that a transaction was not billed, because the KPIs thatare based on revenue and invoice amounts have both dropped.

2-10 Oracle Fusion Applications Project Management, Project Performance Reporting Guide
The overall project health is critical because of the status of the PTD ActualInvoice Amount.
Calculating Current, Prior Period, and Prior Quarter KPI Values:
Examples
A key performance indicator (KPI), if enabled for use, can be defined against oneof two calendars: accounting calendar or project accounting calendar.
To generate KPI values, you enter a KPI period determination date for theapplication to determine the accounting calendar period and project accountingcalendar period. This example shows you how current period, prior period, andprior quarter KPI values are calculated.
Scenario
InFusion Corporation designs and implements heavy engineering projects forgovernment and private customers. The Finance department is interested inmeasuring revenue and margin on the accounting calendar, and budget to actualvariance of labor effort on the project accounting calendar. The KPIs definedfor this purpose are Period-to-Date (PTD) Revenue Variance Percentage on theaccounting calendar and PTD Labor Effort Variance Percentage on the projectaccounting calendar.
The following table shows the accounting calendar used by InFusionCorporation:
Period Name Period StartDate
Period EndDate
Quarter Name Quarter StartDate
Quarter EndDate
Jun-09 1-Jun-09 30-Jun-09 Q2 1-Apr-09 30-Jun-09
Jul-09 1-Jul-09 31-Jul-09 Q3 1-Jul-09 30-Sep-09
Aug-09 1-Aug-09 31-Aug-09 Q3 1-Jul-09 30-Sep-09
Sep-09 1-Sep-09 30-Sep-09 Q3 1-Jul-09 30-Sep-09
Oct-09 1-Oct-09 31-Oct-09 Q4 1-Oct-09 31-Dec-09
Nov-09 1-Nov-09 30-Nov-09 Q4 1-Oct-09 31-Dec-09
The following table shows the project accounting calendar used by InFusionCorporation:
Period Name Period StartDate
Period EndDate
Quarter Name Quarter StartDate
Quarter EndDate
W1-Apr-09 4-Apr-09 10-Apr-09 Q2 4-April-09 3-Jul-09
W1-Sep-09 2-Sep-09 9-Sep-09 Q3 4-Jul-09 3-Oct-09
W2-Sep-09 10-Sep-09 17-Sep-09 Q3 4-Jul-09 3-Oct-09
W3-Sep-09 18-Sep-09 25-Sep-09 Q3 4-Jul-09 3-Oct-09
W4-Sep-09 26-Sep-09 3-Oct-09 Q3 4-Jul-09 3-Oct-09
W1-Oct-09 4-Oct-09 10-Oct-09 Q4 4-Oct-09 3-Jan-10
W2-Oct-09 11-Oct-09 18-Oct-09 Q4 4-Oct-09 3-Jan-10
Update Project Performance Data and Generate KPIs 2-11
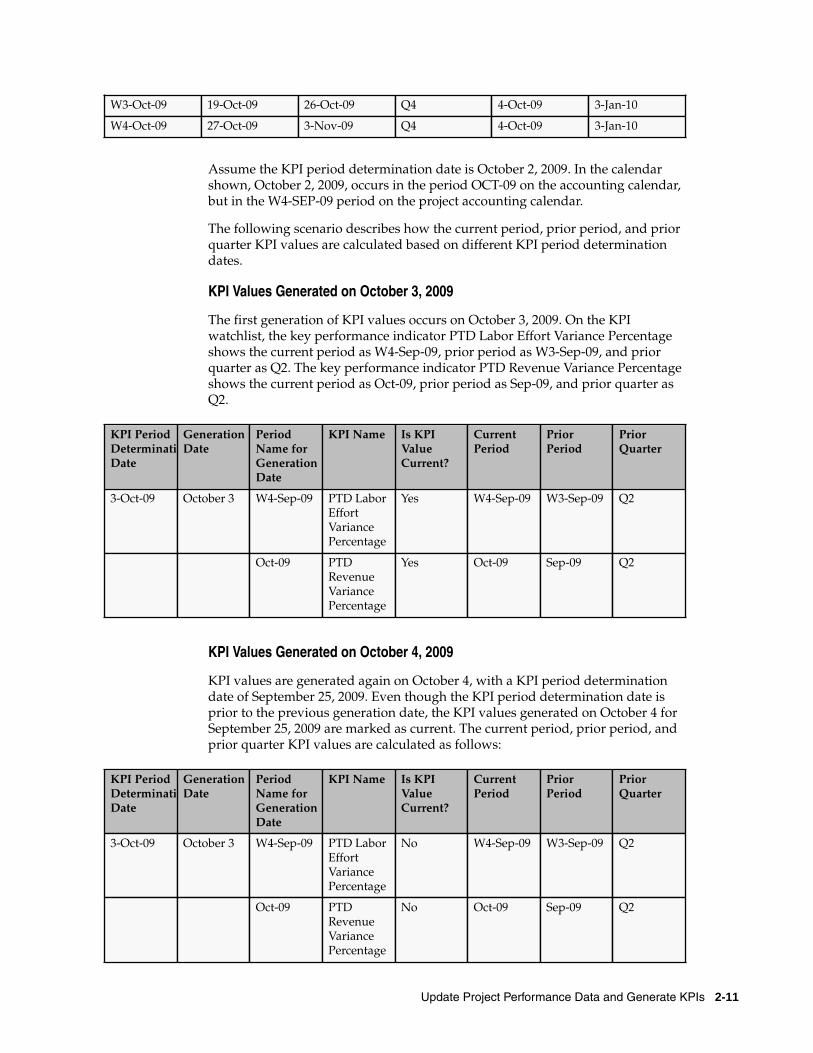
W3-Oct-09 19-Oct-09 26-Oct-09 Q4 4-Oct-09 3-Jan-10
W4-Oct-09 27-Oct-09 3-Nov-09 Q4 4-Oct-09 3-Jan-10
Assume the KPI period determination date is October 2, 2009. In the calendarshown, October 2, 2009, occurs in the period OCT-09 on the accounting calendar,but in the W4-SEP-09 period on the project accounting calendar.
The following scenario describes how the current period, prior period, and priorquarter KPI values are calculated based on different KPI period determinationdates.
KPI Values Generated on October 3, 2009
The first generation of KPI values occurs on October 3, 2009. On the KPIwatchlist, the key performance indicator PTD Labor Effort Variance Percentageshows the current period as W4-Sep-09, prior period as W3-Sep-09, and priorquarter as Q2. The key performance indicator PTD Revenue Variance Percentageshows the current period as Oct-09, prior period as Sep-09, and prior quarter asQ2.
KPI PeriodDeterminationDate
GenerationDate
PeriodName forGenerationDate
KPI Name Is KPIValueCurrent?
CurrentPeriod
PriorPeriod
PriorQuarter
3-Oct-09 October 3 W4-Sep-09 PTD LaborEffortVariancePercentage
Yes W4-Sep-09 W3-Sep-09 Q2
Oct-09 PTDRevenueVariancePercentage
Yes Oct-09 Sep-09 Q2
KPI Values Generated on October 4, 2009
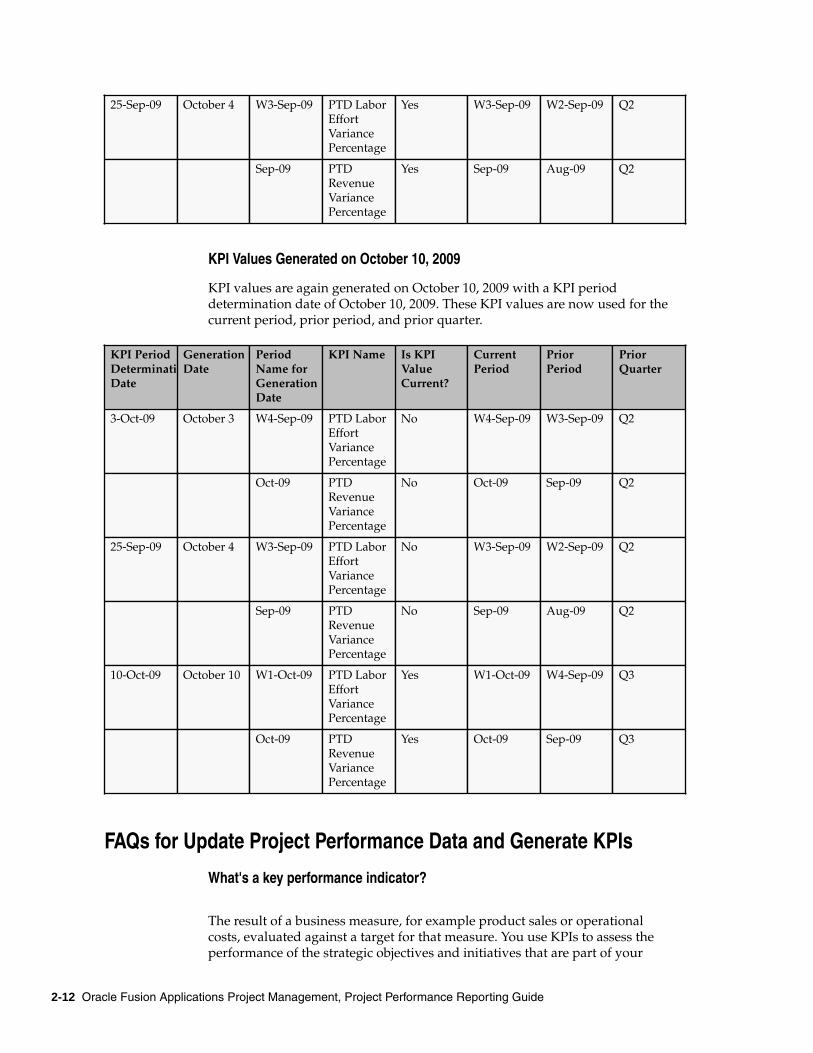
KPI values are generated again on October 4, with a KPI period determinationdate of September 25, 2009. Even though the KPI period determination date isprior to the previous generation date, the KPI values generated on October 4 forSeptember 25, 2009 are marked as current. The current period, prior period, andprior quarter KPI values are calculated as follows:
KPI PeriodDeterminationDate
GenerationDate
PeriodName forGenerationDate
KPI Name Is KPIValueCurrent?
CurrentPeriod
PriorPeriod
PriorQuarter
3-Oct-09 October 3 W4-Sep-09 PTD LaborEffortVariancePercentage
No W4-Sep-09 W3-Sep-09 Q2
Oct-09 PTDRevenueVariancePercentage
No Oct-09 Sep-09 Q2
2-12 Oracle Fusion Applications Project Management, Project Performance Reporting Guide
25-Sep-09 October 4 W3-Sep-09 PTD LaborEffortVariancePercentage
Yes W3-Sep-09 W2-Sep-09 Q2
Sep-09 PTDRevenueVariancePercentage
Yes Sep-09 Aug-09 Q2
KPI Values Generated on October 10, 2009
KPI values are again generated on October 10, 2009 with a KPI perioddetermination date of October 10, 2009. These KPI values are now used for thecurrent period, prior period, and prior quarter.
KPI PeriodDeterminationDate
GenerationDate
PeriodName forGenerationDate
KPI Name Is KPIValueCurrent?
CurrentPeriod
PriorPeriod
PriorQuarter
3-Oct-09 October 3 W4-Sep-09 PTD LaborEffortVariancePercentage
No W4-Sep-09 W3-Sep-09 Q2
Oct-09 PTDRevenueVariancePercentage
No Oct-09 Sep-09 Q2
25-Sep-09 October 4 W3-Sep-09 PTD LaborEffortVariancePercentage
No W3-Sep-09 W2-Sep-09 Q2
Sep-09 PTDRevenueVariancePercentage
No Sep-09 Aug-09 Q2
10-Oct-09 October 10 W1-Oct-09 PTD LaborEffortVariancePercentage
Yes W1-Oct-09 W4-Sep-09 Q3
Oct-09 PTDRevenueVariancePercentage
Yes Oct-09 Sep-09 Q3
FAQs for Update Project Performance Data and Generate KPIs
What's a key performance indicator?
The result of a business measure, for example product sales or operationalcosts, evaluated against a target for that measure. You use KPIs to assess theperformance of the strategic objectives and initiatives that are part of your
Update Project Performance Data and Generate KPIs 2-13
organizational strategy. When you define KPIs you should ensure they havethese characteristics:
• Have measurable objectives that may vary over time.
• Can be evaluated using targets to determine performance status.
• Can be compared over time for trending purposes.
What's the difference between key performance indicator and KPI category?
Key performance indicators (KPIs) measure how well an organization orindividual performs an operational, tactical, or strategic activity that is critical forthe current and future success of the organization. Examples are: Period-to-Date(PTD) Actual Spent Labor Effort Percentage, PTD Actual Spent Equipment EffortPercentage, and PTD Actual Margin Percentage.
A KPI category is a group of KPIs that belong to a specific performance area.Examples are: cost, profitability, financial, and schedule.
From the examples above, PTD Actual Margin Percentage must be in the KPIcategory of profitability.
What actions trigger performance data summarization?
The following actions trigger performance data summarization:
• Run the Update Project Performance Data process for a project from theProject Performance Dashboard or Projects Overview area.
• Run or schedule the Update Project Performance Data process from theprocess scheduler.
• Enable the reporting option on the project unit to summarize project databefore generating key performance indicators.
• Create revenue and invoice transactions.
Important
Summarized revenue and invoice transaction amounts appear in the revenueand invoice work area; however, these transactions do not appear in summarizeddata on the Project Performance Dashboard until the transactions aresummarized using the Update Project Performance Data process.
How can I update project performance data and generate KPI values?
The project manager must run summarization for the selected project using theActions menu in the Project List region on the Project Performance Reportingdashboard. The project manager must use the Important Dates or the Data
2-14 Oracle Fusion Applications Project Management, Project Performance Reporting Guide
Updates window to update project performance data if the data is not current orif there are unprocessed transactions.
To update performance data for all projects in a project unit, the projectsapplication administrator must run the Update Project Performance Dataprocess. After you update project performance data you must generate keyperformance indicator (KPI) values again. If you have not chosen to generateKPI values automatically after updating project performance data, you shouldgenerate KPI values manually.
You must generate KPI values manually when you enable a new KPI for use andwant to view it in the KPI watchlist. You may update data manually if you needto look at the data less frequently, such as, at the end of a period.
Why can't I review project performance?
You cannot review project performance unless you update project performancedata.
Analyze Project Performance 3-1
3Analyze Project Performance
Performance Status for Tasks and Resources: How It Is Calculated
The application calculates performance status for individual tasks and resourcesfor percentage-based key performance indicator (KPI) values.
Settings That Affect Performance Status for Tasks and Resources
When you enable the Track by Task and Track by Resource options on theproject definition, a status indicator appears for the task and resource on projectperformance reports when the individual KPI value is not on track. Enabling thisoption helps you easily identify the troubled tasks and resources in a hierarchicaltask and resource structure in a project.
Note
You can track performance by task and resource only for KPI values that areexpressed as a percentage.
How Performance Status for Tasks and Resources Are Calculated
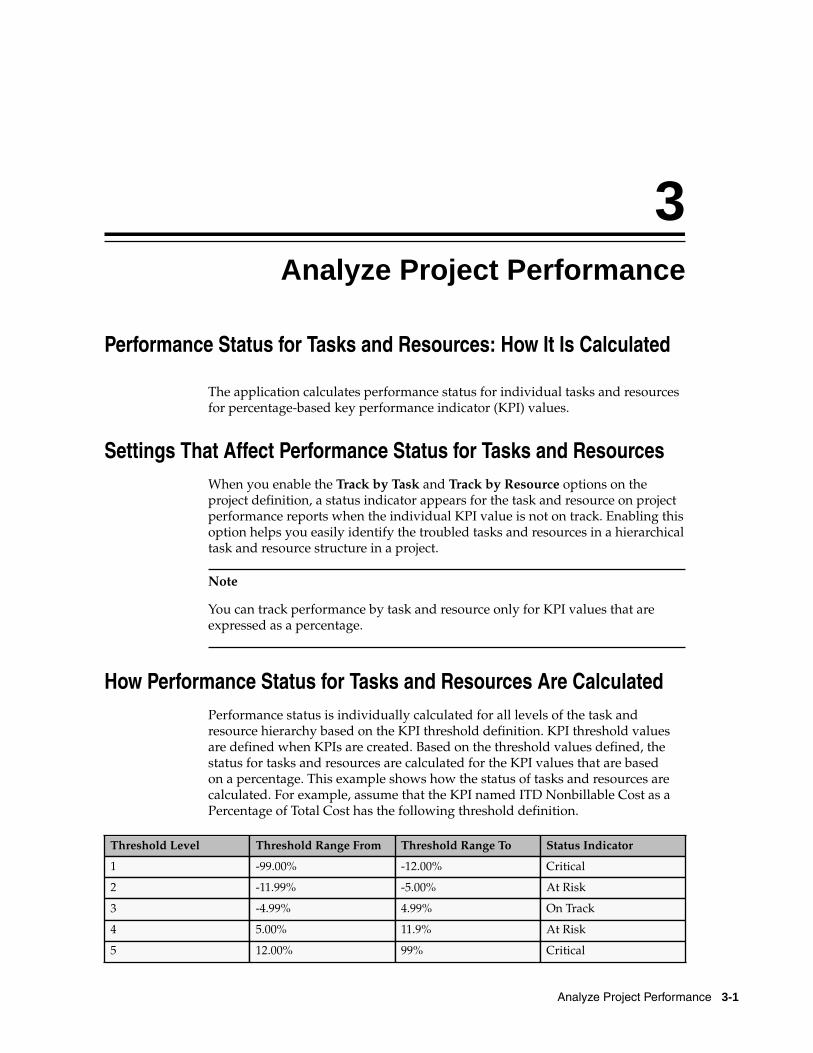
Performance status is individually calculated for all levels of the task andresource hierarchy based on the KPI threshold definition. KPI threshold valuesare defined when KPIs are created. Based on the threshold values defined, thestatus for tasks and resources are calculated for the KPI values that are basedon a percentage. This example shows how the status of tasks and resources arecalculated. For example, assume that the KPI named ITD Nonbillable Cost as aPercentage of Total Cost has the following threshold definition.
Threshold Level Threshold Range From Threshold Range To Status Indicator
1 -99.00% -12.00% Critical
2 -11.99% -5.00% At Risk
3 -4.99% 4.99% On Track
4 5.00% 11.9% At Risk
5 12.00% 99% Critical
3-2 Oracle Fusion Applications Project Management, Project Performance Reporting Guide
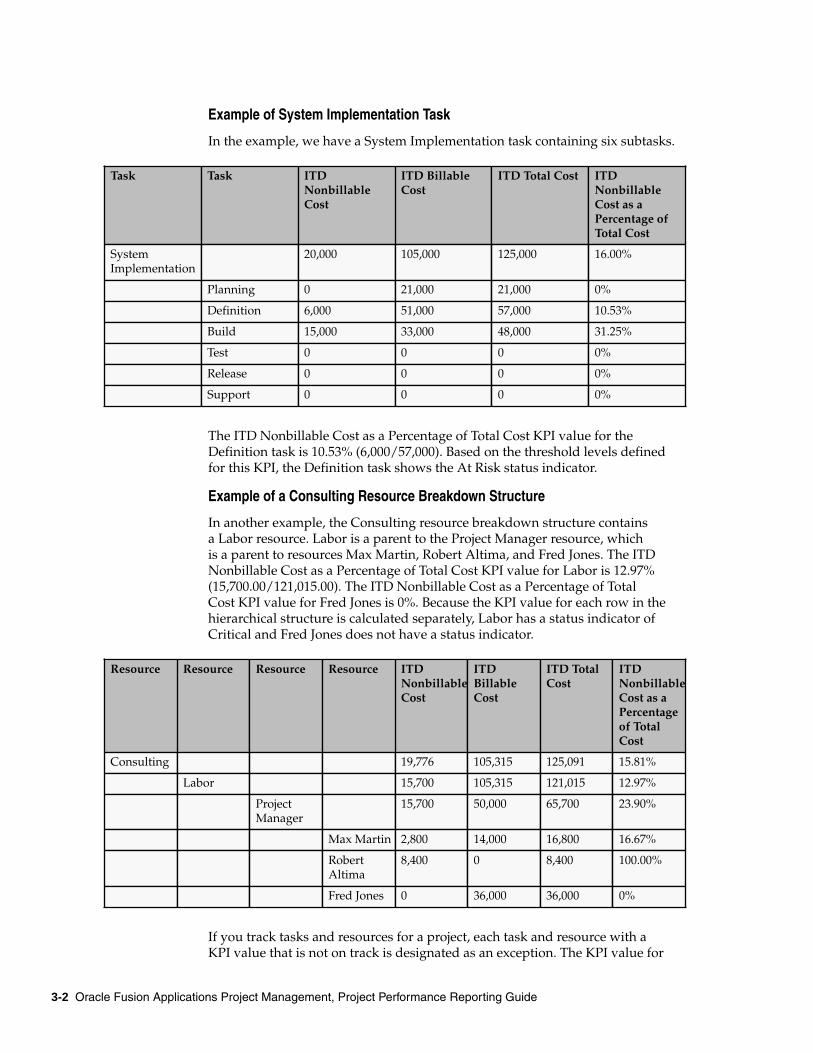
Example of System Implementation Task
In the example, we have a System Implementation task containing six subtasks.
Task Task ITDNonbillableCost
ITD BillableCost
ITD Total Cost ITDNonbillableCost as aPercentage ofTotal Cost
SystemImplementation
20,000 105,000 125,000 16.00%
Planning 0 21,000 21,000 0%
Definition 6,000 51,000 57,000 10.53%
Build 15,000 33,000 48,000 31.25%
Test 0 0 0 0%
Release 0 0 0 0%
Support 0 0 0 0%
The ITD Nonbillable Cost as a Percentage of Total Cost KPI value for theDefinition task is 10.53% (6,000/57,000). Based on the threshold levels definedfor this KPI, the Definition task shows the At Risk status indicator.
Example of a Consulting Resource Breakdown Structure
In another example, the Consulting resource breakdown structure containsa Labor resource. Labor is a parent to the Project Manager resource, whichis a parent to resources Max Martin, Robert Altima, and Fred Jones. The ITDNonbillable Cost as a Percentage of Total Cost KPI value for Labor is 12.97%(15,700.00/121,015.00). The ITD Nonbillable Cost as a Percentage of TotalCost KPI value for Fred Jones is 0%. Because the KPI value for each row in thehierarchical structure is calculated separately, Labor has a status indicator ofCritical and Fred Jones does not have a status indicator.
Resource Resource Resource Resource ITDNonbillableCost
ITDBillableCost
ITD TotalCost
ITDNonbillableCost as aPercentageof TotalCost
Consulting 19,776 105,315 125,091 15.81%
Labor 15,700 105,315 121,015 12.97%
ProjectManager
15,700 50,000 65,700 23.90%
Max Martin 2,800 14,000 16,800 16.67%
RobertAltima
8,400 0 8,400 100.00%
Fred Jones 0 36,000 36,000 0%
If you track tasks and resources for a project, each task and resource with aKPI value that is not on track is designated as an exception. The KPI value for

Analyze Project Performance 3-3
the project does not impact the exception designation for individual tasks andresources. For example, if a task has a Critical status indicator based on the KPIvalue and threshold definition, it is designated as an exception even if the projecthas an On Track status indicator.
Important
Task and resource performance status is based on the latest summarized data,which may not be the same as the summarized data used to generate the latestKPI values.
FAQs for Analyze Project Performance
Why did the overall health indicator not appear for the project?
The overall health indicator is visible after the overall health is calculated. Theoverall health is calculated for a project if key performance indicators (KPIs)are associated to the project and are enabled, and KPI values and summarizedperformance data are generated for the project.
Why is the overall health for the project at risk when most of the KPI statuses
are on track?
The key performance indicator (KPI) with the most severe status determines theoverall health of the project. For example, if three out of four KPIs on a projectare on track, and one is at risk, then the overall health of the project is at risk.
You can also customize the overall health calculation during implementation.
Can a time card be reported as missing and also be included as an
unprocessed transaction?
No, both these situations cannot coexist. Time cards that have not been enteredare considered missing. A time card is an unprocessed transaction after it isentered into the application and before it is included in the Update ProjectPerformance Data process.
How can I evaluate project performance if KPIs are not tracked?
You must use the Review Project Performance page to perform more detailedfinancial performance analysis for a project than is possible on the ProjectPerformance Dashboard. You can review amounts at the task or resource level,and drill down to individual expenditure items.
What happens if KPIs are not tracked?
You can view your projects in the project list and evaluate the financialperformance of your projects. All project comparison graphs are available exceptfor the KPI analysis graph. However, you cannot generate KPI values and
3-4 Oracle Fusion Applications Project Management, Project Performance Reporting Guide
analyze KPI categories and hence the overall project health status indicator is notavailable. The KPI watchlist and notes are also unavailable.
Why can't I view the KPI category analysis?
You cannot view the key performance indicator (KPI) category analysis due tothe following reasons:
• The project unit does not track KPIs.
• No KPIs are associated with the project.
• KPI values are not generated.
FAQs for Review Project Comparison Graphs
Which currency is used on a project comparison graph?
The ledger currency is used if all projects in the project list have the same ledgercurrency. However, if the projects in the project list are represented in more thanone ledger currency, the user-preferred currency is used to bring all projects intothe same currency.
Why can't I see all the KPIs for my project on the project comparison graph?
KPI values that are generated for the project appear on the KPI analysis projectcomparison graphs. The remaining KPIs are excluded.
When does a project appear in the Time Card Exceptions graph?
A project is included in the Time Card Exceptions graph due to any of thesereasons: the project belongs to a project unit that tracks time, one or more of theteam members track time, and one or more of the team members has a time cardthat is in error, pending, or missing.
What's the difference between time card exceptions that are missing, pending,
or in error on the Time Card Exceptions graph?
Time transactions that are in error were received from the transaction source butfailed the posting process.
Pending time transactions were received from the transaction source but havenot completed the posting process.
Time transactions are missing if an expenditure item for a team member doesnot exist for the transaction source, document, and time period specified in thereporting options for the project unit.
Analyze Project Performance 3-5
How many periods can be viewed on the Percent Complete Analysis graph?
The Percent Complete Analysis graph displays data for the last 90 days with amaximum of 13 periods.
FAQs for Review KPI Watchlist Analysis
What happens if I use period-to-date amount-based measures for large
projects?
Period-to-date amount-based measures use the same threshold values for allphases of the project. This may result in a spike in the key performance indicator(KPI) values if the amounts used to calculate the KPI values vary widelythroughout the project. To avoid this problem, consider using different sets ofthreshold values for amount-based KPIs defined in small and large projects.
Why did a performance measure that compares the current and prior approved
forecast show an unfavorable result when there is only one approved forecast?
If you generate key performance indicator (KPI) values when no previousapproved forecast exists, a zero value is used to generate KPI values. Therefore,the trend appears unfavorable because the difference between the current andprior forecast is the same as the current forecast. The results will be accurate oncea new forecast is approved, project performance data is summarized, and KPIvalues are generated.
Can I change the default sort order of KPIs listed in the KPI watchlist?
Yes. You can change the default sort order in the KPI watchlist by modifying thesort order of performance status indicators. By default, KPIs are sorted based onthe current period status, with the least favorable status appearing at the top ofthe list, and the most favorable status appearing at the bottom of the list. If thereis no current period status, the KPIs are sorted by name.
Why are the KPIs visible on the Analyze KPI Categories page after I disabled
them?
Key performance indicators (KPIs) appear on the Analyze KPI Categoriespage if they are active for the project unit and enabled for the project. DisabledKPIs, KPIs past their end date, and KPIs for which future references are deletedcontinue to appear until you generate KPI values.
Important
If you generate KPI values for a date that is prior to the KPI end date, the KPIcontinues to appear in the KPI watchlist. For example, if you delete future
3-6 Oracle Fusion Applications Project Management, Project Performance Reporting Guide
references to a KPI from August 24, and generate KPI values as of August 20, theKPI will appear on the Analyze KPI Categories page. You can view the KPI enddate and determine if the KPI is enabled for the project in the Reporting tab ofthe project definition.
Why can't I see my KPI in regions on the Analyze KPI Categories page?
Key performance indicators (KPIs) appear on the Analyze KPI Categoriespage if they are active for the project unit and enabled for the project. DisabledKPIs, KPIs past their end date, and KPIs for which future references are deletedcontinue to appear until you generate KPI values.
FAQs for Review KPI Historical Trending
What happens if a KPI value exceeds the threshold limits defined for the KPI?
An up or down arrow appears in the Exceeds Threshold column of theKPI History table, and the closest threshold is used to determine the keyperformance indicators (KPIs) status. If KPI values fall outside the thresholdranges, consider extending the upper and lower threshold ranges.
Why did the trend indicator show a downward trend when KPI performance is
improving?
While defining key performance indicators (KPIs), you can determine if apositive increase between the current and previous KPI value is a favorable orunfavorable trend. Therefore, an upward trend may not necessarily indicate thatKPI performance is improving.
For example, for a KPI based on a non-billable percentage of total costs, a lowvalue for non-billable costs is preferred. Hence, a downward trend is favorable.
FAQs for Review Project Financial Performance
Why does the Financial Performance region show only the cost budget and
forecast amounts?
When the cost and revenue budgets are contained in different budget versions,the effort amount represented in project performance reporting is only for thecost budget . The same principle applies to cost and revenue forecasts. When thecost and revenue forecasts are contained in different forecast versions, the effortamount represented in project performance reporting is only for the cost forecast.
Which budget and forecast are the numbers in the Financial Performance region
based on?
The Financial Performance region displays summarized financial data. Thesummarization process always includes the original and current baseline
Analyze Project Performance 3-7
budget, and current and previous forecasts for the financial plan types that aredesignated as approved cost or revenue budgets and forecasts.
Additionally, any other financial plan types enabled for use on the project on theSummarization tab, and KPIs based on custom measures, are included when thesummarization process is run.
Why can't I see all the revenue for my project on the Financial Performance
region?
The revenue amount in the Financial Performance region includes only externaland interproject contracts. It does not include any intercompany revenueassociated with the project.
FAQs for Perform Task and Resource Level Analysis
What happens if I update project performance without generating KPI values?
Information about tasks and resources are out of date with respect to the latestgenerated key performance indicator (KPI) values. The KPIs speedometerdisplays KPI values from the previous time KPI values were generated.
Additionally, the overall project health status indicators are not updated sincethe previous time KPI values were generated. For example, if you generateKPI values at the end of August, and summarize data in the first week ofSeptember, the status displayed is as of the end of August and not the firstweek of September. To view the status of the first week of September, you mustgenerate KPI values again.
To know if you are viewing the updated information in a project you must usethe Important Dates window.
What's the relationship between task structure and resource structure?
The task and resource structure regions share a master-detail relationship. TheAnalyze KPI page allows you to select which structure appears in the masterand detail regions. Depending on your selection the detail structure regionautomatically displays the other structure. For example, if you select the taskstructure to appear in the master region, the detail region displays the resourcestructure. Selecting a row in the Task Structure region displays the assignedresource for that task in the Resource Structure region.

3-8 Oracle Fusion Applications Project Management, Project Performance Reporting Guide
Glossary-1
Glossaryfinancial plan type
Categories or collections of either project budgets or project forecasts.
KPI
Abbreviation for key performance indicator. Key performance indicators (KPIs)measure how well an organization or individual project meets an operational,tactical, or strategic objective that is critical for the current and future success ofthe organization. Examples are: Period-to-Date (PTD) Actual Spent Labor EffortPercentage, PTD Actual Spent Equipment Effort Percentage, and PTD ActualMargin Percentage.
KPI category
A group of key performance indicators that belong to a specific performancearea. Examples are: cost, profitability, financial, and schedule.
KPI period determination date
Date used to determine the accounting calendar and project accounting calendarperiods for performance measure calculations during key performance indicator(KPI) value generation.
scenario dimension members
A scenario dimension is used to differentiate actual cost, current budget, originalbudget, prior forecast, current forecast, and variances between different plantypes within summarization.
summarization
The summarization or update project performance data process extracts datarelated to actual cost, commitment, budget, forecast, revenue, and invoicetransactions and prepares the data for reporting purposes.