options and recommendations to meet the red transport ... energy_red... · options and...
TRANSCRIPT

Options and recommendations to
meet the RED transport target
Final report
Study commissioned by the LowCVP
29/05/2014
Author
Element Energy Limited
2
Disclaimer
While the authors consider that the data and opinions contained in this report are sound, all parties
must rely upon their own skill and judgement when using it. The authors do not make any
representation or warranty, expressed or implied, as to the accuracy or completeness of the report.
Acknowledgments
The authors would like to thank all the industry stakeholders who took part in the consultation, and the
members of the Steering Group, who provided valuable peer-review of the analysis.
Authors
Celine Cluzel, Principal Consultant
Sara de la Serna, Consultant
Reviewer
Alex Stewart, Associate Director

3
• The LowCVP commissioned this study in order to bring clarity over the UK options to meet the
Renewable Energy Directive (RED) 2020 transport target (minimum 10% renewable energy), and it will
provide evidence for the Department for Transport’s current review of the UK biofuel policy framework
• Element Energy investigated four strategies to reach the 10% target through a model able to simulate
different levels of uptake of various fuels and energy vectors. Model inputs were validated by an
industry stakeholder consultation
• The four investigated strategies are:
– NO NEW BLENDS: no blends higher than E10 and B7, and relying on double counting fuels
– DEPOT FOCUS: E10, B7 and high biodiesel blends for trucks and buses refuelling at depots
– NEW FORECOURT BLENDS: bring higher blends to the forecourts (E20 and/or B10 and/or E85)
– COMBINATION: new higher blends at both depots and forecourts
• For each approach, one RED scenario was derived based on analysis of cost effectiveness and
respecting defined constraints. This results in four RED scenarios that differ in their reliance on
feedstock/fuel availability, sensitivities to accounting rules and implementation challenges
• In all cases, the implied uptake of new blends/vehicles and/or supply of double counting
suggest an ambitious implementation program and incentives will be necessary. Industry
consultees highlighted the risk of such a support framework not being developed in time to meet the
2020 target
• In all cases, the supply of double counting fuels (FAME/HVO from waste oils, Ethanol 2G,
Biomass To Liquid diesel) is critical
Executive summary
4
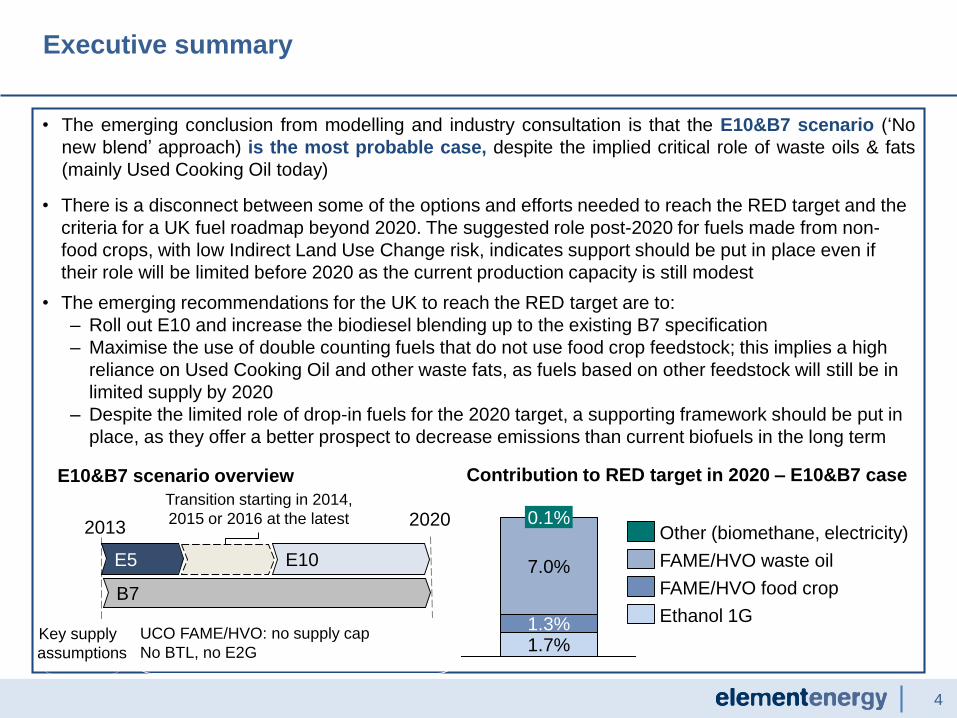
• The emerging conclusion from modelling and industry consultation is that the E10&B7 scenario (‘No
new blend’ approach) is the most probable case, despite the implied critical role of waste oils & fats
(mainly Used Cooking Oil today)
• There is a disconnect between some of the options and efforts needed to reach the RED target and the
criteria for a UK fuel roadmap beyond 2020. The suggested role post-2020 for fuels made from non-
food crops, with low Indirect Land Use Change risk, indicates support should be put in place even if
their role will be limited before 2020 as the current production capacity is still modest
• The emerging recommendations for the UK to reach the RED target are to:
– Roll out E10 and increase the biodiesel blending up to the existing B7 specification
– Maximise the use of double counting fuels that do not use food crop feedstock; this implies a high
reliance on Used Cooking Oil and other waste fats, as fuels based on other feedstock will still be in
limited supply by 2020
– Despite the limited role of drop-in fuels for the 2020 target, a supporting framework should be put in
place, as they offer a better prospect to decrease emissions than current biofuels in the long term
Executive summary
E5 E10
UCO FAME/HVO: no supply cap
No BTL, no E2G
B7
2013
Key supply
assumptions
2020
Contribution to RED target in 2020 – E10&B7 case
0.1%
1.3%1.7%
7.0%FAME/HVO food crop
Other (biomethane, electricity)
Ethanol 1G
FAME/HVO waste oil
E10&B7 scenario overview
Transition starting in 2014,
2015 or 2016 at the latest

5
1. IntroductionIntroduction to the RED target and associated challenges associated and report objectives
2. Scope and approachPowertrain and fuels in scope, modelling approach, main outputs and stakeholder consultation
contribution
3. Fuel pathwaysAssumptions regarding supply caps, costs and WTW GHG emission savings of biofuels
4. RED scenariosApproach to RED scenario design, presentation of four alternative RED scenarios to reach the
target and comparison of their outputs, barriers and challenges for their implementation and
presentation of the most probable and recommended RED scenario
5. RecommendationsActions and next steps for the implementation of the recommended RED strategy
6. References and acronyms
Structure of the report
Technical Appendices are provided in a separate document, published along this report.

6
1. Introduction
2. Scope and approach
3. Fuel pathways
4. RED scenarios
5. Recommendations
6. References and Acronyms

7
• The Renewable Energy Directive (RED) sets a target of 20% of the EU energy to come from
renewable sources by 2020, with a sub-target for the transport sector: at least 10% of the final
energy consumption in transport must come from renewable sources
• Meeting this target is challenging, given that coordinated changes and actions will need to be
undertaken among a wide range of stakeholders (i.e. vehicle manufacturers, refiners, fuel
distributors and retailers; consumers), driven by changes in the policy framework specific to
each Member State that ensure long term certainty
• At the UK level, a clear strategy has not yet been developed, as the current mechanism, the
Renewable Transport Fuel Obligation (RTFO), sets the target at ~5% biofuel blending by
volume. There are some longer term policy measures in place, but they are not directly relevant
to the RED target (e.g. support for electric vehicles and related infrastructure)
• The LowCVP commissioned this study in order to bring clarity over the UK options to meet the
RED transport target by the analysis of ‘RED scenarios’: levels of uptake of different fuels
and energy vectors that would allow the UK to meet the RED transport target, in the most
cost effective way for consumers and avoiding ‘lock in’ effect in a strategy not compatible with
the UK longer term vision for transport
• The analysis aims to provide a clear comparison of options, their associated costs and
challenges, and make recommendations for delivery of the most adequate scenario. It will
provide evidence for DfT’s current review of the UK biofuel policy framework
Introduction and objectives of the study

8
1. Introduction
2. Scope and approach
3. Fuel pathways
4. RED scenarios
5. Recommendations
6. References and Acronyms
A. Powertrain and blends across vehicle class
B. Biofuels scope
C. Model, degrees of freedom, baseline
D. Outputs and related rules
E. Industry consultation

9
A. Vehicles and powertrains in scope for 2020 horizon 1/2
1- NRMM (Non Road Mobile Machinery) case, presented in Appendix B
BEV = Battery Electric Vehicle ; PHEV = Plug-in Hybrid Electric Vehicle; REEV = Range Extended Electric Vehicle
Cars Vans
(up to 3.5t GW)
HGVs
(>3.5t GW)
Buses NRMMs
Spark Ignition (SI) ICE
Compression Ignition (CI) ICE
Dedicated Gas ICE
Hybrid ICE (SI)
PHEV/REEV (SI)
Battery EV (BEV)
• The transport modes in scope for the study are road vehicles (cars, vans, Heavy Goods
Vehicles and buses) and Non Road Mobile Machinery (NRMM)1. Aviation transport is not
covered in this study. The table below shows the modelled powertrains per vehicle class.
• Gas vehicles are modelled only through a dedicated Internal Combustion Engine (ICE)
powertrain. Industry stakeholders see the uptake potential of dual fuel gas vehicles as very
limited, because the EURO 6 specification will severely restrict the supply of these vehicles.
• Two powertrain pathways are proposed: a ‘Base’ and a ‘HighAFV’ case, where there is a
greater uptake of alternative powertrains (hybrid, PHEV and BEV for cars and vans; hybrid and
dedicated gas for HGVs). Powertrain pathways are detailed in Appendix C
Modelled powertrains per vehicle class

10
A. Fuels and fuel blends considered in RED scenarios 2/2
1- B2 and B5 for NRMMs
2- 160,000 cars and vans currently on the road. Source: UKLPG
Cars Vans HGVs Buses NRMMs
E5 and E10
E20
E85
B5 and B71
B10
B30
B100
Biomethane Dedicated Dedicated
Electricity
• Drop in diesel, that can be blended in diesel at higher blend rates (within supply constraints) is also
modelled
• The potential of bio-methanol, an oxygenate already blended in gasoline, is commented on in Appendix K
• Excluded from modelling as their contribution to 2020 RED targets would not be significant (but part of the
existing or longer term UK transport mix):
− LPG / bio LPG, the overall small share of LPG vehicles is <1% of the car and van fleet2.
− Hydrogen. UK H2Mobility results indicate sales of 10,000s H2 Fuel Cell vehicles by 2020,
representing <0.1% of the 2020 fleet
Modelled fuels or blends per vehicle class

111- E4tech, 2013. ‘An harmonised Auto-Fuel biofuel roadmap for the EU to 2030’. 2 - The UK ‘fair share’ is assumed to
be 13%, this is the % of UK transport fuel consumption at EU level as per (ECN, 2011).
Biofuels modelled
• Biofuels currently supplied are considered: Ethanol 1G, FAME (from food crops and non food
crops feedstock), biomethane
• More advanced biofuels not yet supplied in the UK (or in marginal quantities) are also
considered for the 2020 timeframe: Ethanol 2G (made from cellulosic feedstock) and drop-in
diesel, namely Biomass To Liquid (BTL) and Hydrotreated Vegetable Oil (HVO)
The case of HVO
• FAME feedstock can be used to make HVO. Therefore, to avoid double counting of feedstock,
only FAME is modelled while the share of FAME that could be HVO instead is a post-process
calculation
• HVO can also be made from non-food FAME feedstock such as microbial, microalgae and tall
oils. The supply prospect for this type of HVO is however very limited by 20201
• Based on the current and announced plant capacity, projections of future roll out and competition
from the aviation sector, the projected supply of HVO for the EU road transport sector in 2020 is
117 PJ (2.8 Mtoe)1, from which 15 PJ (~450 Ml)2 could be available for UK
Fuels excluded from the 2020 modelling timeframe
• Butanol and drop-in gasoline fuels are not considered for the 2020 timeframe as they are in early
stage of demonstration compared to other new generation fuels that are in early stage of
commercialisation such as HVO, BTL or Ethanol 2G
B. Biofuels in scope 1/2

12Electricity is counted 2.5 times (efficiency factor), the share of renewable electricity is used to calculate electricity
coming from renewable energy
• The categorisation shown below is in line with RED sustainability criteria and accounting rules.
The accounting column shows the factor used to calculate the energy contribution of a given
fuel
• The feedstock shown below are as per the RTFO reports or RTFO guidance in the case of fuels
not yet supplied to the UK market
Biofuel type Feedstock Accounting
Ethanol 1G Barley, corn, sugar beet, sugar cane, wheat 1
Ethanol 2G Agricultural residues (e.g. bagasse, cobs, straw, husks, nut
shells, low grade starch slurry), forestry residues, non-food
cellulosic and ligno-cellulosic material (miscanthus, Short
Rotation Coppice)
2
FAME* food crop Oilseed rape, palm, soy 1
FAME* waste oil Used cooking oil (UCO), tallow category 1, brown grease,
palm oil mill effluent, spent bleached earth
2
BTL Wood energy crops, agricultural residues, municipal waste 2
Biomethane Biogas / waste (e.g. Municipal Organic Waste) 2
B. Biofuels categorisation used in the modelling 2/2
*Same feedstock could be used to make HVO, as presented in the previous slide
13
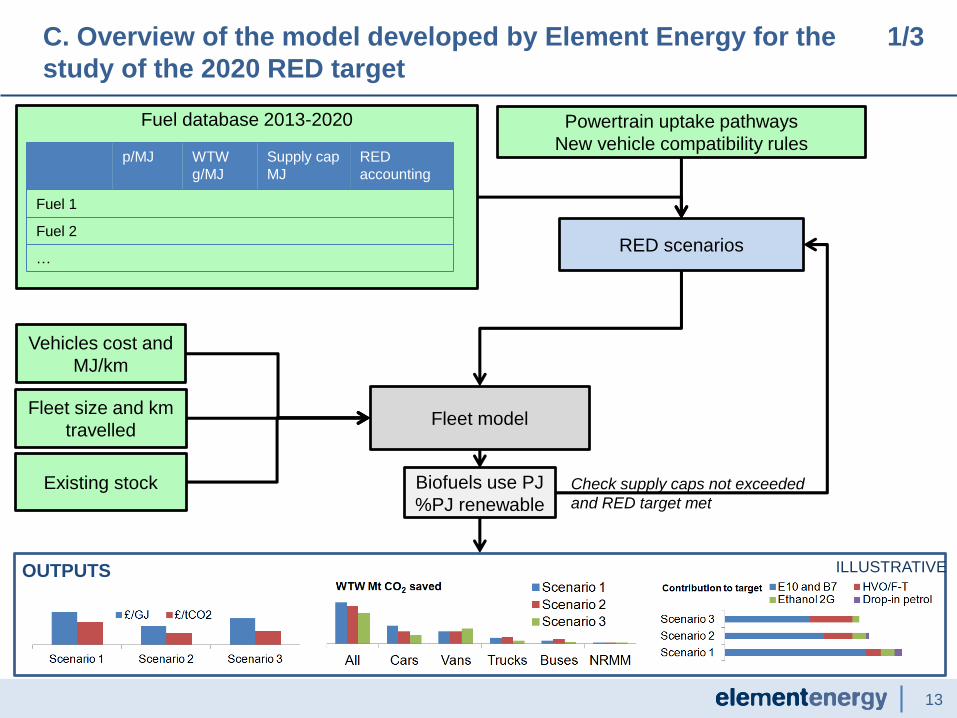
C. Overview of the model developed by Element Energy for the 1/3
study of the 2020 RED target
Fuel database 2013-2020
p/MJ WTW
g/MJ
Supply cap
MJ
RED
accounting
Fuel 1
Fuel 2
…
Powertrain uptake pathways
New vehicle compatibility rules
RED scenarios
Fleet model
Vehicles cost and
MJ/km
Fleet size and km
travelled
Existing stock Biofuels use PJ
%PJ renewableCheck supply caps not exceeded
and RED target met
OUTPUTS ILLUSTRATIVE

14
C. Degrees of freedom for RED scenario design 2/3
For a more detailed description of powertrain pathways, see Appendix C
• A RED scenario is a combination of:
– A fuel pathway, composed of the following biofuel characteristics:
• Cost [Low – Base – High]
• Supply cap for E2G, BTL [High – Stretch] and UCO FAME/HVO [cap or no]
• WTW emissions [Low – Base – High]
– A set of powertrain pathways
• ‘Base’ for cars, vans, HGVs and buses; or
• ‘High AFV’ for cars, vans and HGVs. Under this pathway, there is a greater
uptake of alternative powertrains (HEV, PHEV and BEV for cars and vans;
HEV and dedicated gas for HGVs)
– A level of uptake of high blends (B30, B100) and gas vehicles among depot
refuelling fleets (HVGs and buses)
– A choice of introduction dates for new blends at the forecourts/new vehicles:
E10, E20, E85 and B10

15More detail on the demand modelling is provided in Appendix D
• Overall demand of 1,640 PJ, equivalent to 14.2 billion
litres of petrol and 32.7 billion litres of diesel
• Modest gas demand:
− 110 kt (5 PJ) in base case
− 203 kt (9.3 PJ) in HighAFV case
• Very modest electricity demand:
− 304 GWh (1.1 PJ) in base case
− 1,014 GWh (3.6 PJ) in HighAFV case
2020 UK road transport energy demand, PJ
0
500
1,000
1,500
2,000
High AFV
1,630
Base
1,640
PJ
Gas
Elec
Diesel
Petrol
%(vol.)
biofuels
Average biofuels
WTW savings
Petrol 4.7% 59%
Diesel 1.9% 80%
Baseline modelling assumptions
Current blends (RTFO Apr2012-13)
C. Baseline scenario and 2020 energy demand 3/3
• E5 and B5 from 2014, constant to 2020 (B0 for
NRMM).
• WTW GHG savings of biofuels starting at today’s
performance (see table), varying according defined
pathways for ethanol 1G and biodiesel (blend of FAME
crop and FAME non crop).
• Fuel cost: DECC central fossil fuel prices projections and assume they account for current blends.
Fuel duty and VAT excluded from fuel cost in the modelling.
• For the fossil fuel carbon intensity, the RED values are used to 2020: 83.8 gCO2e/MJ.

16
D. Outputs and related rules
• The contribution of each fuel type to the target is
consistent with the accounting rules in the RED
(2009/28/EC)
• Scenario scores against proposed changes to
RED accounting rules and sub-targets (EU
Parliament Sept. 2013) are also presented, as a
sensitivity test
• The emissions (WTW MtCO2e) are calculated
over the lifetime of vehicles
• The abated emissions are the comparison of a
scenario to the baseline case
• The cost and (‘real world’) energy consumption
of vehicles are based on the projections
compiled by Ricardo-AEA for the Committee on
Climate Change (2012). These account for the
improvement of the ICE, in consistence with the
EC regulations on emissions
OUTPUT: Mt CO2e saved per vehicle class
and scenario
OUTPUT: contribution of each fuel type to the
10% RED target
• Baseline costs are calculated from the
baseline scenario and are the sum of:
− Capital cost of vehicles sales over
2014-2020 (except for NRMMs where
only fuel filter replacement costs are
used)
− Energy expenditure of existing stock
over 2014-2020
− Energy expenditure of vehicles sold
post-2013 over their lifetime
• The cost of scenarios is calculated from
the same components plus marginal
maintenance costs where relevant
• The price of petrol and diesel is higher
than in the baseline when biofuels are
blended in at higher blend than 5%(vol)
• The effectiveness is the delta cost
(scenario-baseline) divided by the delta
GJ or tCO2e (scenario-baseline)
OUTPUTS: cost effectiveness
(£/renewable GJ and £/abated tCO2e)

17
E. Industry consultation: for review of model assumptions and
insights on key barriers and enablers
The consulted organisations and Steering Group (SG) members are listed in Appendix A
Working
Paper|•Compilation of all model assumptions and
proposed approach; presented to SG (16th Oct )
Industry
consultation
•Eleven 60min interviews (21st Oct-12th Nov)
•Presentation to UKPIA members (23rd Oct)
Refine model
inputs
•Main input revisions: approach to supply of
‘double counting’ fuels; cost of biofuels
Analysis•RED scenario analysis
•Derived 4 RED scenarios meeting the 10% target
Results•Presented to SG (14th Nov)
•Circulated to industry stakeholders for feedback
Final report
• The modelling and analysis
carried out for this study is
based on industry feedback
and consultation, through:
− The Steering Group,
that has members from
relevant industries
− A consultation with a
wider number of
industry stakeholders
• The consultation provided
insightful information about
the key enablers which
require government
intervention and/or EC level
decisions, and portrayed
the general agreement
among the most probable
RED scenario

18
1. Introduction
2. Scope and approach
3. Fuel pathways
4. RED scenarios
5. Recommendations
6. References and Acronyms
A. Supply cap assumptions
B. Fuel cost assumptions
C. WTW GHG emission savings assumptions

19
• The UK supply of biofuels already relies
heavily on imports1 and this trend is
expected to continue in the next decades2
• While there is sufficient supply of ethanol
1G, the supply of FAME from food crop
that can meet the 50% threshold is
predicted to become constrained: this is
captured by a high FAME cost in the
modelling
• Results presented next are very
sensitive to the supply assumption of
double counting fuels: waste oils (FAME
or HVO), ethanol 2G, BTL diesel
• There are two main challenges for UCO
(and other waste fats):
– UK share of international supply
– Fuel quality and associated infrastructure
costs (if FAME)
• For ethanol 2G and BTL diesel, the
feedstock supply is not a concern3, but the
investment in production plant is. High and
Stretch supply cases were developed for
measure of scenario feasibility
A1. Supply varies from large supply for ethanol 1G to very limited
supply of drop-in fuels and ethanol 2G – key lever for results 1/3
1 – 77% biofuels were imported in 2012/13, (2012/13 RTFO report) 2 – DECC Bioenergy Strategy 2012. Biomethane supply is also constrained, as
incentives are diverting use to sectors other than transport, see Appendix E3 3 – Notably, supply of waste, Ecofys, “Low ILUC potential of wastes &
residues for biofuels”, 2013, ECF “Wasted, Europe’s untapped resource. An assessment of advanced biofuels from wastes & residues”, 2014
Ethanol 1G – sufficient supply
FAME from food crop – predicted constraint to meet
sust. criteria
FAME/HVO waste oil –competition over supply
E2G,
BTL
High FAME
cost
2 cases: supply cap
or no supply cap
Default: no supply;
‘High’ and ‘Stretch’ cases
defined for reference
Biofuel supply and model impact

20
A2. Opinion was divided among industry stakeholders on the future
supply and use of FAME made from waste oils and fats 2/3
1 – Ecofys, Low ILUC potential of wastes and residues for biofuels, 2013 2– RTFO reports; mostly UCO (80%) and tallow
(16%), see Appendix E4 ISCC: International Sustainability and Carbon Certification
View 1: limited potential for increased use
of UCO
• Limited production potential (estimated at
3,500 million litres / 117 PJ at EU level for
UCO)1 and competition from other Member
States
• Fuel quality if 100% UCO FAME is blended
in diesel, especially in winter
• Concerns over contamination of pipelines
and storage; implies extra costs
• Concerns over fraud and lack of traceability
View 2: the UK can increase its use of FAME made
from UCO and other waste oils
• It is a world market and import from overseas has little
impact on WTW savings
• UCO can be refined into good quality FAME; at least 1
UK supplier has been using 100% UCO FAME in its B7
for the last 3 winters
• Certification standards already in place (e.g. ISCC EU)
and in use by UK importers, developed with EC
• New stream of waste oils beyond UCO are emerging in
the UK (e.g. brown grease, palm oil mill effluent)
•View 1: supply limited at 450Ml UK share of UCO EU production + current UK tallow (16 PJ)
•View 2: No supply limit (10% target ‘easily’ met, thanks to double counting)
Two cases
modelled:
Max potential for UCO and tallow FAME, million litres UCO and tallow FAME from waste oil in UK2,
million litres
0
500
1,000
13/1412/13
461
11/1210/11
514
09/10
225
2008/09
155
810
431
UK Non-EUEU
300
1,000
2,000
3,000
4,000 3,462
EU
480
UK
Max. EU UCO production1
Current tallow supply UK

21
A3. Summary of identified ‘high’ and ‘stretch’ supply for double
counting fuels other than fuels based on waste oils 3/3
Fuel type 2017 2020 Notes
Ethanol
2G
Million
litres [PJ]
High 60
[1.3]
120
[2.5]
• 2017: similar size than Crescentino plant (Italy)
• 2020: ramp up to 2 plants, or 1 plant + import
Stretch 60
[1.3]
240
[5.0]
• Large import / fast ramp up in production globally
BTL
diesel
Million
litres [PJ]
High 32
[1.1]
127
[4.3]
• 2017: 50% of output from UK based Solena plant
• 2020: 1 large FT plant (750kt) at EU level, UK taking ‘fair share’
Stretch 32
[1.1]
253
[8.6]
• 2020: 2 large FT plants at EU level, UK taking ‘fair share’ (13%)
Summary of indicative supply caps (PJ) for RED scenarios
Further details for E2G and BTL diesel in Appendix E1 and E2. 1 – (Ecofys, 2013) and (ECF, 2014)
Reminder: the ‘fair share’ refers to share of UK transport fuel consumption at EU level as per (ECN, 2011).
• Total ‘High’ cases contribution = 6.8 PJ in 2020; this represents 0.8% of transport demand
• Total ‘Stretch’ cases contribution = 13.6 PJ in 2020; this represents 1.6% of demand
• The availability of waste feedstock is not a barrier to the production of E2G and BTL (literature reports
availability in the order of 1000PJ at EU level1), but the investment in production plant is very high
• High and Stretch supply cases developed for measure of scenario feasibility:
– ‘High’ case is an ambitious case: optimistic best case scenario considering regulatory framework and
investment challenges
– ‘Stretch’ case is a very ambitious case that would require very strong intervention
– A scenario that requires supply over Stretch limits is labelled unfeasible.
• Drop-in diesel: only BTL considered, as HVO feedstock already captured in non-food FAME

22
B. Fuel cost assumptions
E2G and BTL assumed to enter UK market in 2017.Error bars show the Low and High costs, used for sensitivity analysis.
Assumptions for gaseous fuels and electricity are provided in Appendix F
6558
829379
72
0
20
40
60
80
100
p/L, 2010 GBP
2013 2020 20202017 20202013
5952
99
4848
0
20
40
60
80
100
2020 20132017 2020
59
2013
p/L, 2010 GBP
2020
Ethanol and gasoline
Biodiesel and diesel
Main assumptions
• Gasoline and diesel costs as per DECC central
projections (DECC,2012); E1G and FAME as per
observed prices (Platts) for 2013 values
• Ethanol 1G cost assumed to be constant for
central scenario
• Common expectation that FAME costs will
increase due to rise in feedstock (oil/protein)
costs and to supply constraints arising from
tighter sustainability criteria
• There is uncertainty on these dynamics, due to
the dependency of fuel costs on a wide range of
factors. This is more pronounced for new
generation biofuels (as shown by the error bars
in the graphs)
Main sources for cost projections
• DfT Impact Assessment, literature projections for
E2G and BTL (sources for assumptions are
provided in Appendix F)
• Cost projections were discussed with industry
stakeholders to understand the current market
dynamics of biofuels
E1G E2G Gasoline
FAME BTL Diesel

23
C. WTW GHG emission savings assumptions. RED sustainability criteria
expected to bring improvement in E1G and FAME WTW emissions
Error bars show the Low and High values, used for sensitivity analysis. Assumptions for WTW emissions of gaseous
fuels are provided in Appendix G1, for grid carbon intensity and share of renewable electricity, see Appendix G2
0
20
40
60
80
100
2017 2020
93%
2020
50%
82%93%
2013
85%
2020
%
40%
2013
0
20
40
60
80
100
2013
70%
58%
2017
76%
2020
%
76%
2020
Ethanol WTW emission savings over gasoline
Biodiesel WTW emission savings over diesel
Ethanol 1G and 2G
• Current value for E1G as per RTFO 2012/13 weighted
average.
• 2020 value for E1G based on observed best values and
possible improvement reported by industry during the
consultation. E1G from wheat produced in the UK
achieves c. 70% WTW emission savings; this can be
achieved by tracking feedstock origin, lowering use of
fertilisers, maximising process efficiency or capturing
CO2
• E2G as per average RED default values
FAME and BTL diesel
• Current value for FAME, as per RTFO 2012/13
weighted average. Last reported RTFO values for
oilseed rape, palm and soy derived FAME have been
below 50%
• 2020 FAME food as per RED 50% threshold after 2017,
this implies existing plants will report on their real
performance (as opposed to use default values) and
implement improvement measures
• 2020 FAME non-food based on RED default UCO
values
• BTL as per RED default value (‘farmed wood FT diesel’)
E1G
FAME food
E2G
FAME non-food BTL

24
1. Introduction
2. Scope and approach
3. Fuel pathways
4. RED scenarios
5. Recommendations
6. References and Acronyms
A. Renewable energy shortfall and approach to
RED scenario design
B. Presentation of four RED scenarios to reach
target
C. Model outputs and comparison
D. Comparison of barriers and challenges to
implementation
E. Conclusion: presentation of most probable and
recommended RED scenario
25
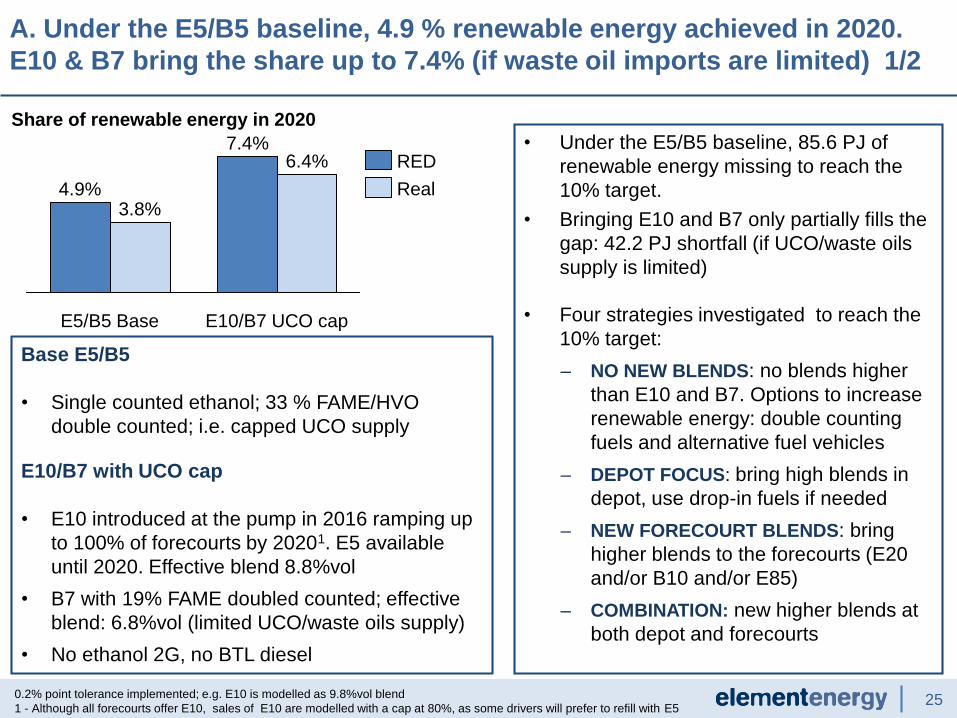
• Under the E5/B5 baseline, 85.6 PJ of
renewable energy missing to reach the
10% target.
• Bringing E10 and B7 only partially fills the
gap: 42.2 PJ shortfall (if UCO/waste oils
supply is limited)
• Four strategies investigated to reach the
10% target:
– NO NEW BLENDS: no blends higher
than E10 and B7. Options to increase
renewable energy: double counting
fuels and alternative fuel vehicles
– DEPOT FOCUS: bring high blends in
depot, use drop-in fuels if needed
– NEW FORECOURT BLENDS: bring
higher blends to the forecourts (E20
and/or B10 and/or E85)
– COMBINATION: new higher blends at
both depot and forecourts
A. Under the E5/B5 baseline, 4.9 % renewable energy achieved in 2020.
E10 & B7 bring the share up to 7.4% (if waste oil imports are limited) 1/2
0.2% point tolerance implemented; e.g. E10 is modelled as 9.8%vol blend
1 - Although all forecourts offer E10, sales of E10 are modelled with a cap at 80%, as some drivers will prefer to refill with E5
Share of renewable energy in 2020
Base E5/B5
• Single counted ethanol; 33 % FAME/HVO
double counted; i.e. capped UCO supply
E10/B7 with UCO cap
• E10 introduced at the pump in 2016 ramping up
to 100% of forecourts by 20201. E5 available
until 2020. Effective blend 8.8%vol
• B7 with 19% FAME doubled counted; effective
blend: 6.8%vol (limited UCO/waste oils supply)
• No ethanol 2G, no BTL diesel
E10/B7 UCO cap
6.4%7.4%
E5/B5 Base
3.8%4.9% Real
RED
26
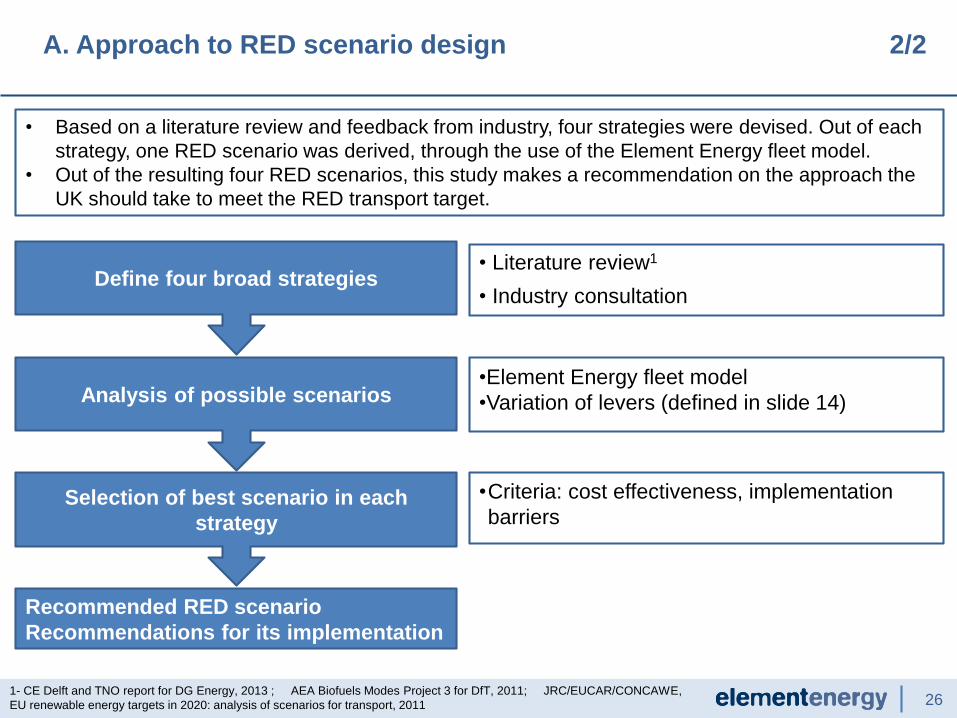
A. Approach to RED scenario design 2/2
1- CE Delft and TNO report for DG Energy, 2013 ; AEA Biofuels Modes Project 3 for DfT, 2011; JRC/EUCAR/CONCAWE,
EU renewable energy targets in 2020: analysis of scenarios for transport, 2011
Define four broad strategies• Literature review1
• Industry consultation
Analysis of possible scenarios•Element Energy fleet model
•Variation of levers (defined in slide 14)
Selection of best scenario in each
strategy
•Criteria: cost effectiveness, implementation
barriers
Recommended RED scenario
Recommendations for its implementation
• Based on a literature review and feedback from industry, four strategies were devised. Out of each
strategy, one RED scenario was derived, through the use of the Element Energy fleet model.
• Out of the resulting four RED scenarios, this study makes a recommendation on the approach the
UK should take to meet the RED transport target.

27
B. Presentation of scenarios: incremental scenarios 1/3Achieving the target is highly dependant on the volume of double counting
fuels, either waste oils based fuels or E2G/ BTL diesel
Strategy Lever Findings Resulting scenario
and key assumption
NO NEW
BLENDS
no blends
higher than
E10 and B7
■ Powertrain
pathway
■ Supply of UCO:
capped or not
capped
■ Supply of E2G and
BTL
■ The HighAFV powertrain pathway
offers little and not cost effective
contribution to target
■ Meeting the target with E2G and
BTL would require volumes beyond
the ‘Stretch’ limits
Name: E10&B7
■ Target met through
high use of FAME
waste oil (1.7 bl,
which is 50% of
identified EU UCO
FAME production
potential)
DEPOT
FOCUS
higher blends
in depots, for
HGVs and
buses
■ B30 or B100
■ Share of uptake
among depot
fuelling vehicles
■ Supply of E2G and
BTL
■ If depot uptake is limited at 10%,
required volumes of E2G / BTL are
beyond the ‘Stretch’ limits
■ B30 more cost effective than B100
■ Depot uptake of B30 must be 36%
if ‘Stretch’ supply of BTL is
available
Name: DepotB30
■ Target met through
high B30 uptake at
depot (36% of depot
refuelling vehicles)
and ‘Stretch’ E2G
and BTL supply
The NRMM gas oil blend is at kept at B2 in all scenarios – the level where impact on storage and engines and thus
associated costs are estimated to be manageable, based on industry feedback

28
B. Presentation of scenarios: high blends at forecourt scenarios 2/3Double counting still key to meeting the 10% target.
Strategy Levers Findings Resulting scenario and
key assumption
NEW
FORECOURT
BLENDS
Higher blends
than E10 or B7
■ New blend: E20,
B10, E85
■ % fleet
compatible
■ Supply of E2G
and BTL
■ Scope for E20 and B10 too
limited for 2020, would require
supply of E2G and BTL over
‘Stretch’ limits
■ E85 most promising option but
still relies on some E2G or BTL
Name: E85case
■ Target met through 6%
of fleet using E85 (10%
forecourts offering E85)
and ‘High’ level of E2G
(5%vol of total ethanol)
and ‘Stretch’ BTL
COMBINATION
new higher
blends at both
depot and
forecourts
■ Share of B30
uptake among
depot fuelling
vehicles
■ % fleet
compatible with
E85
■ Supply of E2G
and BTL
■ Possibility to meet the target
within Stretch supply at a cost
effective level
■ High challenges associated
with implementation of
measures both in forecourts
and depots
Name: Depot&E85
■ Target met through ‘High’
E2G level and BTL level
in between ‘High’ and
‘Stretch’. 10% forecourts
offering E85 and 10%
depot refuelling vehicles
using B30
See Appendix I4 for the E85 deployment assumptions
29
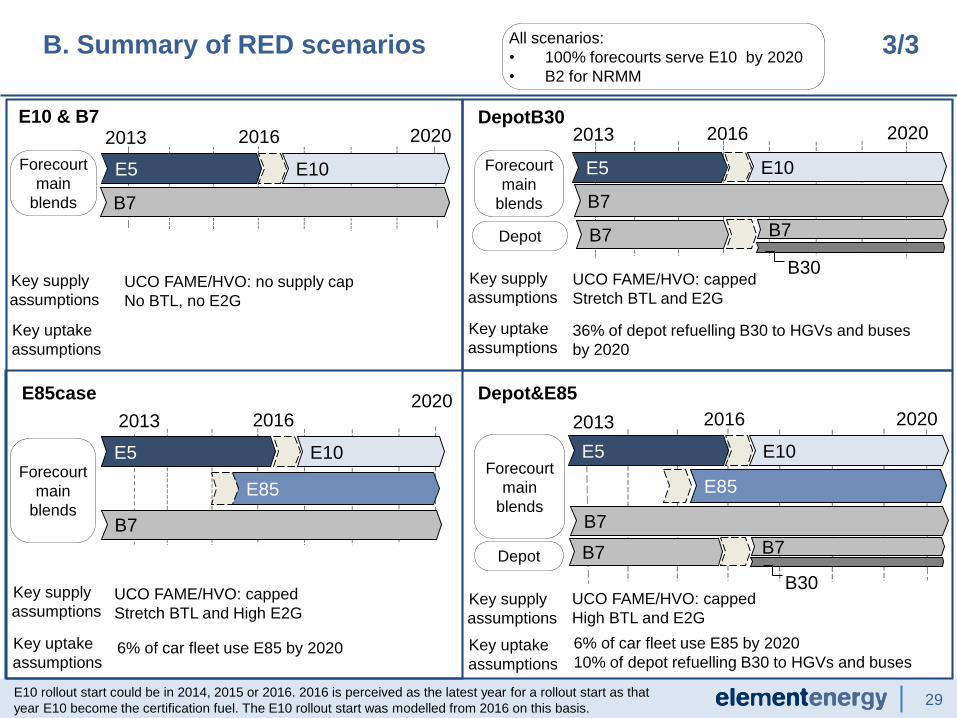
B. Summary of RED scenarios 3/3
E5 E10
UCO FAME/HVO: no supply cap
No BTL, no E2G
B7
E10 & B7
E85
DepotB30
E85case Depot&E85
2013 2020
Forecourt
main
blends
Depot
2016
E5 E10
B7
2013 2016 2020
All scenarios:
• 100% forecourts serve E10 by 2020
• B2 for NRMM
E5 E10
20202013
Forecourt
main
blends
2016
B7
E85
E5 E10
20202013
Forecourt
main
blends
2016
B7
Depot
B7
B7
Forecourt
main
blends
E10 rollout start could be in 2014, 2015 or 2016. 2016 is perceived as the latest year for a rollout start as that
year E10 become the certification fuel. The E10 rollout start was modelled from 2016 on this basis.
Key supply
assumptions
Key uptake
assumptions
B7
B30UCO FAME/HVO: capped
Stretch BTL and E2G
Key uptake
assumptions36% of depot refuelling B30 to HGVs and buses
by 2020
Key supply
assumptions
UCO FAME/HVO: capped
Stretch BTL and High E2G
Key uptake
assumptions6% of car fleet use E85 by 2020
Key supply
assumptions
B7
B30UCO FAME/HVO: capped
High BTL and E2G
6% of car fleet use E85 by 2020
10% of depot refuelling B30 to HGVs and buses
Key supply
assumptions
Key uptake
assumptions

30
C. Contribution to RED target comparison 1/4
Contribution to RED target
• The high use of FAME from waste oils differentiates the E10&B7 case from other scenarios,
that all see a significant contribution of
• FAME made from food crop (1.9 -2.5 billion litres)
• E2G and BTL diesel (E2G: 120-240 million litres; BTL: 162-253 million litres)
HVO case
• Under the projection of 15 PJ (~450 Ml) of HVO for the UK road transport sector1, ~15-20% of
the FAME used for the RED scenarios could be HVO, where ~5% would be HVO coming from
non-food feedstock and ~15% from food feedstock2
1 – See slide 11
2 – Split HVO from food vs. non food feedstock based on current EU plant capacity, Element Energy analysis
Depot&E85 2.9%
0.2%
4.1%
0.1%
1.9%
0.3%
0.7% 0.1%
0.0%
7.0%
DepotB30 1.3% 4.9% 1.9% 0.6% 1.0%
E85case 2.9% 1.0%3.8% 1.9% 0.3%
1.7%E10&B7 1.3% 0.1%
0.0%
Other (biomethane, electricity)E2GFAME food crop FAME waste oilEthanol 1G BTL

31
C. RED targets comparison: E10&B7 has lowest real renewable energy %
but only case immune to proposed change in RED accounting rules 2/4
EP: European Parliament
Proposed RED sub-targets (EP, Sept. 2013) - %energy in 2020
RED targets comparison, % renewable energy in 2020• The reliance on double counting
fuel means the real renewable
energy share is only 6-8%
• Only one scenario (E10&B7)
would meet the 10% target
under the proposed change in
RED accounting rules
(European Parliament Sept.
2013)
• However, the proposed RED
sub-targets (EP Sept. 2013) are
proving challenging in all cases:
− Advanced fuel target is
never met
− Cap on crop fuel respected
only under E10&B7
− Ethanol target met only
through use of E85
0
5
10
Depot&E85E85caseDepotB30E10&B7
Real shareRED Proposed RED (EP, Sept. 2013)
12%
10%
4%
2%
8%
6%
0%
E85caseDepotB30E10&B7
Min. Adv. target
Max. crop
Min. ethanol target
Depot&E85
Ethanol in petrolAdv. BiofuelCrop

32
C. Cost effectiveness is similar across the scenarios with the
exception of the more expensive Depot30 case. 3/4
Reminder: costs captured include vehicle capital & marginal costs and energy expenditure (excl. tax).
Costs do not include cost of incentives nor potential infrastructure upgrade
Cost effectiveness comparison – cost sensitivity Cost effectiveness comparison – cost sensitivity
Cost effectiveness comparison
• Only Depot30 case is significantly
more expensive, as it accumulates
vehicle conversion costs and marginal
maintenance costs.
• Cost effectiveness is sensitive to cost
inputs as a high range of biofuels cost
is used to capture uncertainty around
future fuel costs. All scenarios are
equally sensitive to cost inputs.0
2
4
6
8
10
0
50
100
150
£/GJ £/tCO2e
Depot&E85E85caseDepotB30E10&B7
£/tCO2e£/GJ
0
5
10
15
£/GJ
Depot&E85E85caseDepotB30E10&B7
0
50
100
150
200
250
£/tCO2e
Depot&E85E85caseDepotB30E10&B7

33
C. Comparison of scenarios: as expected the scenario with high
reliance on double counting achieves lowest emission savings 4/4
Cumulative 2014-2020 WTW emission savings, MtCO2eBaseline cumulative 2014-2020 WTW emissions = 1,066 MtCO2e
Cumulative 2014-2020 WTW emission savings, MtCO2e
• Highest WTW savings achieved in
scenarios involving E85 blends,
related to cars’ high contribution to
WTW emissions
• Results not very sensitive to WTW
saving inputs as possible range for
WTW savings is limited by
sustainability criteria thresholds
• Cumulative WTW savings represent
1.3%-1.6% of total cumulative WTW
emissions
Cost effectiveness in £/tCO2e – WTW sensitivity
20
15
10
5
0
All
1716
15
13
NRMMsBusesHGVsVansCars
Depot&E85
E85case
DepotB30
E10&B7
20
15
10
5
0
Depot&E85E85caseDepotB30E10&B7
0
50
100
150
DepotB30 E85case Depot&E85E10&B7

34
• All scenarios face the following barriers of challenges – albeit to different degrees:
– Supply of E2G and drop-in fuel or securing high volume of waste oils (mainly UCO today)
– Reliance on FAME from food crop when the regulatory framework is uncertain for 2020
(e.g. share of food crop based fuels, ILUC factors) and undefined post-2020
– Introduction of E10 at the forecourts
– Stimulating the demand of new blends
• The DepotB30, E85 and Depot&E85 cases face extra challenges (e.g. further demand
support, supply of new vehicles, infrastructure cost, use of E2G and BTL) and the emerging
conclusion from discussions with industry is that the E10&B7 case is the most probable
case, despite the critical role of waste oils supply.
• Consultation revealed a general frustration and scepticism of stakeholders, coming from:
– Lack of UK government support for E10 and action towards meeting the target
– Uncertain EC regulatory 2020 framework and undefined post-2020 framework
– Inconsistent transposition of RED across Member States
as key enablers virtually all require government intervention and/or EC level decisions
D. Common challenges to the implementation of RED scenarios and
emerging conclusions from industry consultation 1/4
35
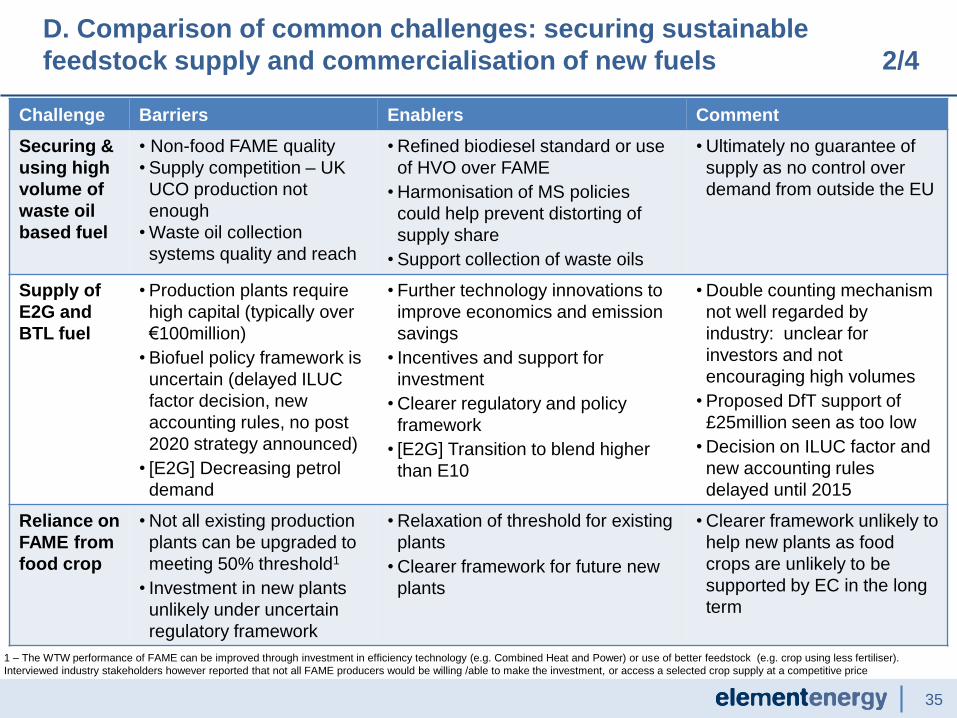
D. Comparison of common challenges: securing sustainable
feedstock supply and commercialisation of new fuels 2/4
1 – The WTW performance of FAME can be improved through investment in efficiency technology (e.g. Combined Heat and Power) or use of better feedstock (e.g. crop using less fertiliser).
Interviewed industry stakeholders however reported that not all FAME producers would be willing /able to make the investment, or access a selected crop supply at a competitive price
Challenge Barriers Enablers Comment
Securing &
using high
volume of
waste oil
based fuel
• Non-food FAME quality
• Supply competition – UK
UCO production not
enough
• Waste oil collection
systems quality and reach
• Refined biodiesel standard or use
of HVO over FAME
• Harmonisation of MS policies
could help prevent distorting of
supply share
• Support collection of waste oils
• Ultimately no guarantee of
supply as no control over
demand from outside the EU
Supply of
E2G and
BTL fuel
• Production plants require
high capital (typically over
€100million)
• Biofuel policy framework is
uncertain (delayed ILUC
factor decision, new
accounting rules, no post
2020 strategy announced)
• [E2G] Decreasing petrol
demand
• Further technology innovations to
improve economics and emission
savings
• Incentives and support for
investment
• Clearer regulatory and policy
framework
• [E2G] Transition to blend higher
than E10
• Double counting mechanism
not well regarded by
industry: unclear for
investors and not
encouraging high volumes
• Proposed DfT support of
£25million seen as too low
• Decision on ILUC factor and
new accounting rules
delayed until 2015
Reliance on
FAME from
food crop
• Not all existing production
plants can be upgraded to
meeting 50% threshold1
• Investment in new plants
unlikely under uncertain
regulatory framework
• Relaxation of threshold for existing
plants
• Clearer framework for future new
plants
• Clearer framework unlikely to
help new plants as food
crops are unlikely to be
supported by EC in the long
term

36
D. Comparison of common challenges: the 2-grade system calls for a
(currently lacking) coordinated roll out of E10 3/4
1 – E10 was introduced in January 2011 and by December 2011 represented 51% of gasoline sales, a success
partly attributed to a education and communication campaign (CE Delft and TNO, 2013)
Challenge Barriers Enablers Comment
Introduction
of E10 at the
forecourts
• Most fuel retailers are non-obligated
• Consumer acceptance: see below
• Lack of government support (to address
consumer acceptance, lack of
endorsement, RTFO capped at 4.75%)
• Lack of rollout coordination – 2 grade
system means rollout must be quick
• Address non-obligated
retailers, e.g. mandate
• Coordinated roll-out
• Address demand: see below
• In all cases, strong role for
central government and/or
affiliated agency
• Consumer
acceptance:
refrain non
obligated as
well as
obligated
retailers
Stimulating
the demand
for a new
blend –
consumer
acceptance
• End users unwilling to pay price premium
for CO2e savings
• End user concern over impact on engine
• End user rejecting biofuel sustainability
credential
• Incentive address cost
premium over lower blends,
e.g. energy based taxation
and preferential differential
• Fuel labelling
• Information communication
• Finland
provides
example of
successful
communication
campaign1
• The UK gasoline distribution is a 2-grade system; it means a maximum of 2 gasoline grades using the
distribution infrastructure can be offered at the forecourts. Further blends would rely on truck delivery and
thus be volume limited.
• In a 2-grade system, a new blend (e.g. E10) is expected to become the main grade while the protection
grade (E5) would become the premium grade. This implies the roll-out within a region / fuel distribution area
will be quick, as opposed to E10 being slowly introduced alongside other blends like in France.
• This creates challenges for ‘first movers’, i.e. retailers taking the risk of selling E10 when the demand is not
in place yet – barriers are detailed below.

37
D. Additional challenges specific to DepotB30, E85 and Depot&E85
cases 4/4
Introduction of B30 for fleet vehicles
► Demand:
− No tax differential or incentive in place at the moment making the adoption of biodiesel cost effective
for users – only a marginal number of users will pay a premium for cost savings. Past support
program (20p/l fuel duty rebate in 2002-2010) yielded less than 10% uptake of biodiesel fuel among
commercial fuel sales1.
− Beyond costs, there are consumer acceptance issues (fuel quality and sustainability credential)
► Supply of vehicles:
− EURO 6 specification hard to meet for wide range of biodiesel blends – OEMs unlikely to optimise
and certify for one blend type. CEN fuel standard in development for B30
► Distribution*: dedicated channels required or additional cleaning procedure to avoid contamination.
► Storage*: conversion to compatible materials required. Impact on low usage storage unknown.
1 – Source: UKPIA
*Associated cost not included in cost effectiveness calculation
Introduction of E85 at forecourts
► Demand:
− Beyond fuel demand, vehicle demand must be incentivised
► Supply of vehicles:
− OEMs already make FlexFuel Vehicles (FFVs) but unclear how easy it is to bring to UK market. EC
CO2 regulation does not reward OEMs for FFVs anymore.
− Risk of FFVs being refuelled with E5/E10, giving sub-optimal fuel consumption and lower emission
savings
► Distribution*: only 2 petrol grades available, E85 will stay niche to 2020 (supply by road from refinery)
► Poor post-2020 prospect for E85 considering petrol/diesel unbalance and unlikely status of grade fuel:
barrier for refuelling infrastructure investment and OEMs effort to supply

38
E. Decision on recommended RED scenario to be taken forward:
the E10&B7 approach is the recommended strategy for the UK 1/2
Criteria (slide number for quantitative values) E10&B7 DepotB30 E85 case Depot&E85
WTW emission saved (slide 33)
£/tCO2e and £/GJ (slide 32)
Sensitivity to double counting changes (slide 31)
Reliance on waste oils supply (slide 27)
Reliance on high volumes of BTL and/or E2G (slide 30)
Reliance on FAME/HVO from food crop (slide 30)
Requires support for new vehicles and/or new blend adoption
Requires transformation/upgrade of distribution infrastructure
Overall industry preference
• When comparing the four RED scenarios in terms of cost effectiveness, sensitivity to double counting
rules, reliance on commercialisation of new fuels, reliance on FAME/HVO made from food crop, and
implementation challenges, the E10&B7 case emerges as the best approach.
• The E10&B7scenario achieves less cumulative WTW emission savings over 2013-2020 than the other
scenarios (c. 3Mt or 20% difference with E85case), due to its higher use of double counting fuel. However
its overall much reduced implementation challenges, notably around investment in infrastructure upgrade
and new vehicle introduction, make the E10&B7 case the most plausible pathway for the UK to meet the
RED transport target, with the lowest risk of ‘lock in’ with fuel blends not desirable or sustainable in the
long term.
• Industry stakeholders also believe the E10&B7 is the most realistic approach.

39
• The recommended trajectory implies:
– c. 1,300 Ml of E1G (or slightly less if
some double counting E2G is also
supplied)
– c. 650 Ml of FAME/HVO from food crop
– c. 1,700 Ml of FAME/HVO from double
counting fuels (expected to be mostly
UCO), or less if BTL is also supplied
– 4,600 t of biomethane
E. Decision on recommended RED scenario to be taken forward:
summary of fuel contributions 2/2
1- At the moment FAME from non food feedstock is produced mainly from UCO and tallow, whereas HVO
processes are characterised by a greater feedstock flexibility
Contribution to RED target in 2020 – E10&B7 case
0.1%
1.3%
1.7%
7.0% FAME/HVO food crop
Other (biomethane, electricity)
Ethanol 1G
FAME/HVO non food
3600
500
1,000
1,500
2,0001,700
Food crop
1,610
90
Non food crop
290
Ml
650
HVO
FAME
Biodiesel volumes required to achieve RED target and
potential HVO contribution – E10&B7 case • Under the projection of 15 PJ (~450 Ml) of HVO available
for the UK road transport sector, up to 20% of the
FAME/HVO required to meet the RED target could be
HVO:
– up to 5% of the fuel made from non food crops
– up to 55% of the fuel made from food crops
• Despite modest projected values of HVO from non food
feedstock for 2020, a higher contribution for the longer
term could help to minimise the risks associated with the
traceability, security of supply and technical issues
associated to FAME non food1

40
1. Introduction
2. Scope and approach
3. Fuel pathways
4. RED scenarios
5. Recommendations
6. References and Acronyms

41
• From considerations such as cost effectiveness, sensitivity to double counting rules, reliance on
commercialisation of new fuels, reliance on FAME made from food crops, and implementation challenges,
the emerging recommendation for the UK to reach the RED target is to pursue the E10 & B7 approach,
namely:
– Roll out E10 and increase the biodiesel blending up to the existing B7 specification
– Maximise the use of double counting fuels that do not use food crop feedstock; this implies a high
reliance on Used Cooking Oil and other waste oils, as fuels based on other feedstock will still be in
limited supply by 2020
• Despite the limited role of drop-in fuels for the 2020 target, a supporting framework should be put in place,
as they offer a better prospect to decrease emissions, and could make up for supply shortfall of waste oils
feedstock and displace FAME based on food crops over time
• Some of these actions can be taken by UK actors (e.g. the introduction of E10), while other enablers require
actions at European level, such as reaching a final decision on the sustainability criteria and accounting
rules to bring the regulatory clarity currently lacking for investment in new biofuels
• An overarching issue for the industry players that are meant to implement the changes required to reach the
RED target is the inconsistent transposition of the RED across Member States. The UK should therefore
communicate its chosen strategy, in order to give the EC the opportunity to consider actions that could
harmonise policies across the EU
• The next slides discuss the actions or next steps required to implement the recommendations for the UK to
achieve 10% of renewable energy in road transport
Recommendations for the UK to meet the RED transport target

42
• While the RTFO incentivises fuel suppliers to blend ethanol in gasoline, this is not sufficient for the
introduction of E10, as the RTFO is capped at 4.75%vol blend and the non obligated fuel retailers (>60% of
retail operators, with supermarkets selling c.40% of retail petrol and diesel) have no incentive to propose a
product that might not be in demand.
• The recommended actions to facilitate the introduction of E10 are:
1. Support the uptake of E10 among fuel suppliers and retailers
► Establish a biofuel pathway to at least 2020, e.g. raise the RTFO blend cap, clarify what
feedstocks are supported in the long term
► Incentivise non-obligated retailers, e.g. mandate adoption for large retailers
2. Stimulate the consumer demand and acceptance
► Establish an information campaign, including harmonised fuel labelling1, that makes
customers aware of changes in biofuels, clarify compatibility aspects as well as biofuel
sustainability benefits. Finland provides an example of a successful campaign and roll-out
► Make E10 a commercial proposition, e.g. through changes in fuel duty taxation, to be based
on energy rather than in volume terms or/and preferential differential taxation
3. Organise a coordinated rollout of the blend to minimise the risk of pioneer retailers bringing the
blend to the market
• Stakeholders that can deliver these actions are the government (or affiliated agency) and the fuel suppliers
& retailers. Vehicles OEMs also have a role to play in the communication campaign on vehicle compatibility.
The successful introduction of E10 at UK forecourts will require a
dedicated programme and actions from government and industry
1 – Fuel labelling is already defined in the British Standard

43
• As diesel vehicles are already compatible with B7*, increasing the blend level of biodiesel up to 7% presents less
barriers than introduction E10. It does however require incentives for the fuel supply chain and ironing out
concerns regarding fuel quality reported by some industry stakeholders.
• The recommended actions to reach 7% blending in diesel and maximise the use of UCO & other waste oils are:
1. Support the uptake of B7 among fuel suppliers and retailers
► Establish a biofuel pathway to at least 2020, e.g. raise the RTFO blend cap, clarify what feedstocks are
supported in the long term
► Elaborate refined biodiesel standards that ensure an appropriate quality level of FAME made from
UCO/waste oils, that does not compromise engine behaviour under winter conditions, e.g. by updating BS
EN14214 standard. Revision of the diesel standard (BS EN590) could also be required, e.g. for cold flow
properties. The case of NRMM might require special consideration*.
2. Improve the security of a sustainable supply of UCO and other waste feedstock
A consolidated supply chain needs to be developed that secures the 2020 UK levels of non-food FAME/HVO,
expected to be highly reliant on imports. Enabling actions:
► Maximise the collection of traceable waste oils at EU level
► Continue take action to mitigate the risks of fraud, through the establishment of a traceability framework
that ensures the verification of the supply chain1
► Harmonise MS policies to prevent the distortion of the supply share of waste fuels within the EU
The overall need for biodiesel could be decreased (by a modest amount, c. 55Ml) by limiting the obligated
volumes to transport fuels (the current obligated volume includes non-transport gas oil2).
* NRMMs fleet and related fuel storage are not compatible with B7.
Increasing the biodiesel blend to the 7% limit will require safeguards
around fuel quality and both UK and EU action to secure waste oils supply
1- A chain of custody already needs to be in place in order for biofuels to receive RTFCs and the Year 6 RTFO guidance
part 2 points to the establishment of further traceability procedure for double counted feedstock. 2 – See Appendix B

44
• To support the investment in new production capacity of new fuels (E2G, drop-in fuels), the recommended
actions are:
► At EU level
Provide short-term certainty in the regulatory framework towards 2020 (clarifying the position
around ILUC factors, accounting rules and introduction of sub-targets if relevant), as well as long
term certainty, by defining a post-2020 framework.
► At UK level
Attract investment in commercial-scale biofuel plants (E2G, drop-in fuels).
This will require an assessment of efficient mechanisms that bring the most clarity to investors.
Consulted stakeholders commented loan guarantees proved efficient in the US, that the £25million
grant offered in the UK was too low and that double counting for RTFCs was not as clear as setting
volume targets
Supporting the commercialisation of new biofuels will require actions
both at UK and EU level

45
1. Introduction
2. Scope and approach
3. Fuel pathways
4. RED scenarios
5. Recommendations
6. References and Acronyms

46
• AEA, Biofuels Modes Project 3, for the DfT, 2011
• AEA, Assessment of the existing UK infrastructure capacity and vehicle fleet capability for the use of
biofuels, for the DfT, 2011
• CE Delft and TNO, Bringing biofuels on the market. Options to increase EU biofuels volumes beyond
the current blending limits, 2013
• DECC, DfT and Defra, UK Bioenergy Strategy, 2012
• DECC, DECC Updated Energy & Emissions Projections, October 2012
• DECC, DECC/HM Treasure Green Book Appraisal guidance, September 2013
• DfT, RTFO annual reports, 2008-2013
• DfT, Impact Assessment: Motor Fuel Composition and Content Regulations – Extension of petrol
protection grade requirement, 2013
• ECN, Renewable Energy Projections as Published in the National Renewable Energy Action Plans of
the European Member States, 2011
• Ecofys, Low ILUC potential of wastes and residues for biofuels, 2013
• ECF, Wasted, Europe’s untapped resource. An assessment of advanced biofuels from wastes &
residues, 2014
• ECUK, Transport data tables, DECC, 2013
• Element Energy, The role of biofuels beyond 2020, for BP, 2013
• Element Energy, Influences on the Low Carbon Car Market 2020–2030, for LowCVP, 2011
References (1/2)
47
• E4tech, An harmonised Auto-Fuel biofuel roadmap for the EU to 2030, 2013
• Irena, Production of bio-methanol. Technology Brief, 2013
• Jesper Brauer, Master of Science thesis, When will hybrid technologies dominate the heavy-duty vehicle
market? Forecasting Using Innovation Diffusion Models, 2011
• JEC - Joint Research Centre-EUCAR-CONCAWE collaboration, Well-to-Wheels Analysis of Future
Automotive Fuels and Powertrains in the European Context, version 4, 2013
• JRC/EUCAR/CONCAWE, EU renewable energy targets in 2020: analysis of scenarios for transport,
2011
• Littlewood et al., 2013. Importance of policy support and feedstock prices on economic feasibility of
bioethanol production from wheat straw in the UK. Renewable and Sustainable Energy Reviews 17
(2013) 291–300
• NNFCC, Market Review: Biofuels, Issue 19, October 2013
• Marvel et al., 2012. Economic Optimization of a Lignocellulosic Biomass-to-Ethanol Supply Chain.
Chemical Engineering Science 67(2012) 68–79
• Patterson et al., 2011. An evaluation of the policy and techno-economic factors affecting the potential
for biogas upgrading for transport fuel use in the UK. Energy Policy 39 (2011) 1806–1816
• Ricardo-AEA, A review of the efficiency and cost assumptions for road transport vehicles to 2050, for
the Committee on Climate Change, 2012
• TTR, Evaluating the opportunities for high blend liquid and gaseous biofuel penetration in the UK, for the
LowCVP, 2009
• TTR, Biomethane for Transport - HGV cost modelling, for the LowCVP, 2011
References (2/2)

48
AFV Alternative Fuel Vehicle
BEV Battery Electric Vehicle
BTL Biomass To Liquid
CBG Compressed Biomethane Gas
CCC Committee on Climate Change
CEN European Committee for Standardization
CNG Compressed Natural Gas
DECC Department of Energy and Climate
Change
DEFRA Department for Environment, Food and
Rural Affairs
DfT Department for Transport
EC European Commission
ECUK Energy Consumption in the UK
EP European Parliament
EV Electric Vehicle
E1G First Generation Ethanol, see slide 12
E2G Second Generation Ethanol, see slide 12
FAME Fatty Acid Methyl Ester
FCEV Fuel Cell Electric Vehicle
FIT Feed-in-Tariff
FQD Fuel Quality Directive
FT Fischer-Tropsch
FV Flexi Fuel Vehicle
GHG Green House Gas
HGV Heavy Goods Vehicles
HVO Hydrotreated Vegetable Oil
IA Impact Assessment
ICE Internal Combustion Engine
ISCC International Sustainability and Carbon
Certification
LGV Light Goods Vehicles
LNG Liquefied Natural Gas
LPG Liquefied Petroleum Gas
MEP Member of European Parliament
MS Member State
NNFCC National Non-Food Crops Centre
NRMM Non Road Mobile Machinery
OEM Original Equipment Manufacturer
PHEV Plug-in Hybrid Electric Vehicle
RAC Royal Automobile Club (Foundation)
REA Renewable Energy Association
Acronyms 1/2

49
Acronyms 2/2
RED Renewable Energy Directive
REEV Range Extended Electric Vehicle
RHI Renewable Heat Incentive
ROC Renewable Obligation Certificate
ROW Rest of the World
RTFC Renewable Transport Fuel Certificate
RTFO Renewable Transport Fuel Obligation
SG Steering Group
SMMT Society for Motor Manufacturers and
Traders
UCO Used Cooking Oil
UK United Kingdom
UKPIA UK Petroleum Industry Association
WTW Well To Wheel