optimum cropping pattern based on alternative price
TRANSCRIPT
Int.J.Curr.Microbiol.App.Sci (2018) 7(9): 257-271
257
Original Research Article https://doi.org/10.20546/ijcmas.2018.709.033
Optimum Cropping Pattern based on Alternative Price Scenarios in Semi-
Arid Eastern Plain Zone of Rajasthan State, India
M.K. Jangid*, Latika Sharma, S.S. Burark and D.C. Pant
Department of Agricultural Economics and Management, RCA, MPUAT, Udaipur, India
*Corresponding author
A B S T R A C T
Introduction
Rajasthan with its huge geographical area of
342.7 lakh hectares is the largest state of India.
The state is predominantly an agriculture state
with 75 per cent population living in rural
areas. Agriculture and allied activities
contributed 21.71 per cent of Net State
Domestic Product at constant price 2004-05
while its share in Gross State Domestic
Product is 20.27 per cent during 2013-14.
Agriculture is the single largest sector of the
state economy employing 70 per cent labour
force directly and indirectly. Rajasthan state
has witnessed an extreme level of groundwater
over-exploitation. Total annual groundwater
draft in the state is 15.71 billion cubic meter
which is higher than the sustainable limit of
11.26 billion cubic meter. Central ground
water board has categorized 164 blocks out of
International Journal of Current Microbiology and Applied Sciences ISSN: 2319-7706 Volume 7 Number 09 (2018) Journal homepage: http://www.ijcmas.com
The present study has analyzed the Optimum Cropping Patterin Semi-Arid Eastern Plain
Agro-climatic Zone of Rajasthan state by using alternative three price scenarios namely
market prices, economic prices (net out effect of subsidy) and natural resource valuation
(NRV) considering environmental benefits like biological nitrogen fixation and
greenhouse gas costs. In this study, unit-level cost of cultivation data for the triennium
ending 2013-14 which were collected from Cost of Cultivation Scheme, MPUAT, Udaipur
(Raj.) has been used. It has analyzed crop-wise use of fertilizers, groundwater, surface
water, subsidies and optimum crop plan by using linear programming with the help of
GAMS. Results from the present study indicated that even after netting out the input
subsidies and effect on environment and natural resources, clusterbean-vegetable crop
sequence produced the higher net return of ` 215187 per hectare followed by clusterbean-
chillies (` 108590/ha) crop sequence under the set of marketing infrastructure, minimum
support prices, agricultural technological know-how, climatic conditions and available
irrigation facilities existed in this semi-arid eastern plain. Optimum crop plan model of this
zone indicated that area shifted from sorghum, maize, cowpea and mothbean towards
blackgram, greengram and clusterbean in kharif season whereas in rabi season, area shifted
from cumin and onion towards the chillies, vegetables, gram and fenugreek and towards
the rapeseed and mustard and wheat to some extent. Therefore, existing gross cropped area
has increased at all the three price scenario by 13.49 per cent from 2719.13 thousand
hectares to 3086.00 thousand hectares in optimal crop plan.
K e y w o r d s Market price, Economic
price, Natural resource
valuation, Semi-arid
eastern plain and
optimum cropping pattern
Accepted:
04 August 2018
Available Online: 10 September 2018
Article Info
Int.J.Curr.Microbiol.App.Sci (2018) 7(9): 257-271
258
248 blocks as over-exploited which is 68.33
per cent of total assessment unit. Only 17.74
per cent (44 blocks) of the total blocks were
categorized in safe category. Gross area
irrigated by all sources during 2013-14 was
98.65 lakh hectares against 94.55 lakh
hectares during 2012-13 registering an
increase of 4.10 lakh hectare i.e. 4.34 per cent
in Rajasthan.
Semi-arid eastern plain agro-climatic zone
comprises four districts of Rajasthan state
namely Ajmer, Dausa, Jaipur and Tonk. One
third (33.82%) of gross cropped area is
irrigated in this zone. Average annual rainfall
is 500-700 mm. The depth of ground water
level is on an average 21 meter below ground
level (mbgl) and out of 31 block, 27 block in
this zone have been classified as over
exploited by the Central Ground Water Board
(CGWB). The area produces bajra, sorghum
and clusterbean in the kharif season. In the
rabi season, wheat, barley and rapeseed &
mustard are the dominant crops, especially in
irrigated areas. Cropping pattern is inefficient
in terms of resource use and unsustainable
from natural resource use point of view. This
leads to serious misallocation of resources,
efficiency loss, indiscriminate use of land and
water resources, and it adversely affecting
long term production prospects. Crop selection
at zonal level is one such challenge which can
be addressed using optimum crop planning.
As such regional crop planning is very crucial
that helps to formulate zonal specific crop
planning which would optimize the level of
each activity of different crops, level of input
use and output produced under different
resource endowments and price scenarios. It
involves area allocation for each of these
crops, the sequencing of crops, and the
irrigation plans. Best suitable crops and other
enterprises should be selected so as to achieve
some set of goals particular to the region.
Typically, these goals involve the
maximization of net income, the minimization
of cost, the maximization of total area
cultivated, and/or the minimization of
irrigation water. Keeping in view the above
considerations, a research study entitled
“Optimum Cropping Pattern based on
Alternative Price Scenarios in Semi-Arid
Eastern Plain Zone of Rajasthan state” was
conducted.
Materials and Methods
The study was conducted based on plot level
secondary data. The data were collected from
the 600 representative households of 60
cluster villages during each year of the block
period (2011-12 to 2013-14) from the Cost of
Cultivation Scheme, Rajasthan.
The comparative performance of different
crops was assessed by comparing net returns
under alternative price scenarios. These are:
(i) Market Price (ii) Economic Price and (iii)
Natural Resource Valuation Technique (Raju
et al., 2015).
Net Returns at Market Prices (NRMP)
Net returns at market price was defined as the
gross return (value of main product and by
product) less variable costs (Cost A1 +
imputed value of family labour) at market
price actually paid and received by the farmer
or imputed in some cases.
NRMP = GR – VC (i)
Where,
NRMP – Net return at market price,
GR- Gross Returns and
VC- Variable Cost.
Cost A1 as defined in Manual on Cost of
Cultivation Scheme, DES, New Delhi includes
all actual expenses in cash and kind in
production by the farmer. Some of the
Int.J.Curr.Microbiol.App.Sci (2018) 7(9): 257-271
259
components of cost A1 directly retrieved from
the unit level data set of cost of cultivation
scheme, while few are estimated for example:
depreciation of implements and farm building,
interest on working capital has been computed
by using the method elaborated in the manual
on CCS.
The imputed value of family labour has been
calculated as:
Imputed Value of Family Labour = Working
Hours of Family Labour × Labour Wage Rate
per Hour
Net Returns at Economic Price (NREP)
Net return at economic price was defined as
the difference between net return or income at
market price and subsidies on inputs like
fertilizers and irrigation used in crop
production.
i.e. NREP = NRMP – Subsidy (ii)
Thus, subsidy component has internalized into
the model, by covering two aspects viz.,
fertilizer subsidy and irrigation subsidy.
Fertilizer subsidy consisted subsidy on
nitrogen (N) and combination of Phosphorous
(P) and Potassium (K). The total irrigation
subsidy included canal, electricity and diesel
subsidy and has been distributed over selected
crops based on area under irrigation of each
crop. Crop wise irrigation subsidy has two
components: Ground water subsidy and
Surface water subsidy. Ground water subsidy
was estimated by initially calculating the crop-
wise ground water use, i.e.
Groundwater use (cubic metre) = Irrigation
hours (hrs/ha) × Groundwater draft (cum/hr)
The irrigation hours (hrs/ha) for each crop
were taken from plot-wise CCS data. CCS
does not collect information of ground water
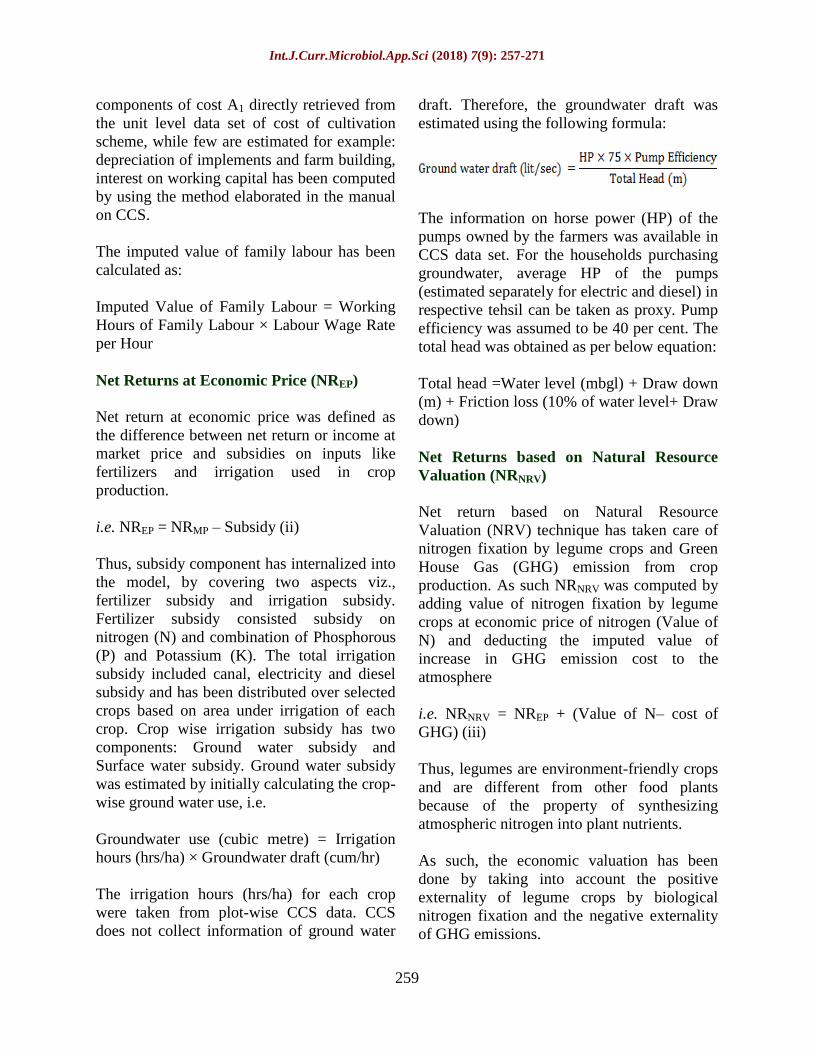
draft. Therefore, the groundwater draft was
estimated using the following formula:
The information on horse power (HP) of the
pumps owned by the farmers was available in
CCS data set. For the households purchasing
groundwater, average HP of the pumps
(estimated separately for electric and diesel) in
respective tehsil can be taken as proxy. Pump
efficiency was assumed to be 40 per cent. The
total head was obtained as per below equation:
Total head =Water level (mbgl) + Draw down
(m) + Friction loss (10% of water level+ Draw
down)
Net Returns based on Natural Resource
Valuation (NRNRV)
Net return based on Natural Resource
Valuation (NRV) technique has taken care of
nitrogen fixation by legume crops and Green
House Gas (GHG) emission from crop
production. As such NRNRV was computed by
adding value of nitrogen fixation by legume
crops at economic price of nitrogen (Value of
N) and deducting the imputed value of
increase in GHG emission cost to the
atmosphere
i.e. NRNRV = NREP + (Value of N– cost of
GHG) (iii)
Thus, legumes are environment-friendly crops
and are different from other food plants
because of the property of synthesizing
atmospheric nitrogen into plant nutrients.
As such, the economic valuation has been
done by taking into account the positive
externality of legume crops by biological
nitrogen fixation and the negative externality
of GHG emissions.
Int.J.Curr.Microbiol.App.Sci (2018) 7(9): 257-271
260
Optimization of crop model
The Mathematical Programming was used for
developing optimum crop or land use
planning. The present study attempted to
develop different crop planning strategies by
using linear programming (LP). The above
linear programming model has been executed
under General Algebraic Modeling System
(GAMS, Version: 12/2016). It develops the
crop model which increases the productivity
with minimum input cost under the constraints
of available resources like water usage and
also labour, fertilizers, seeds, etc., and
ultimately getting maximum net benefits.
Multi-crop model for two seasons are
formulated in LP for maximizing the net
returns, minimizing the cost and minimizing
the water usage by keeping all other available
resources (such as cultivable land, seeds,
fertilizers, human labour, pesticides, capital
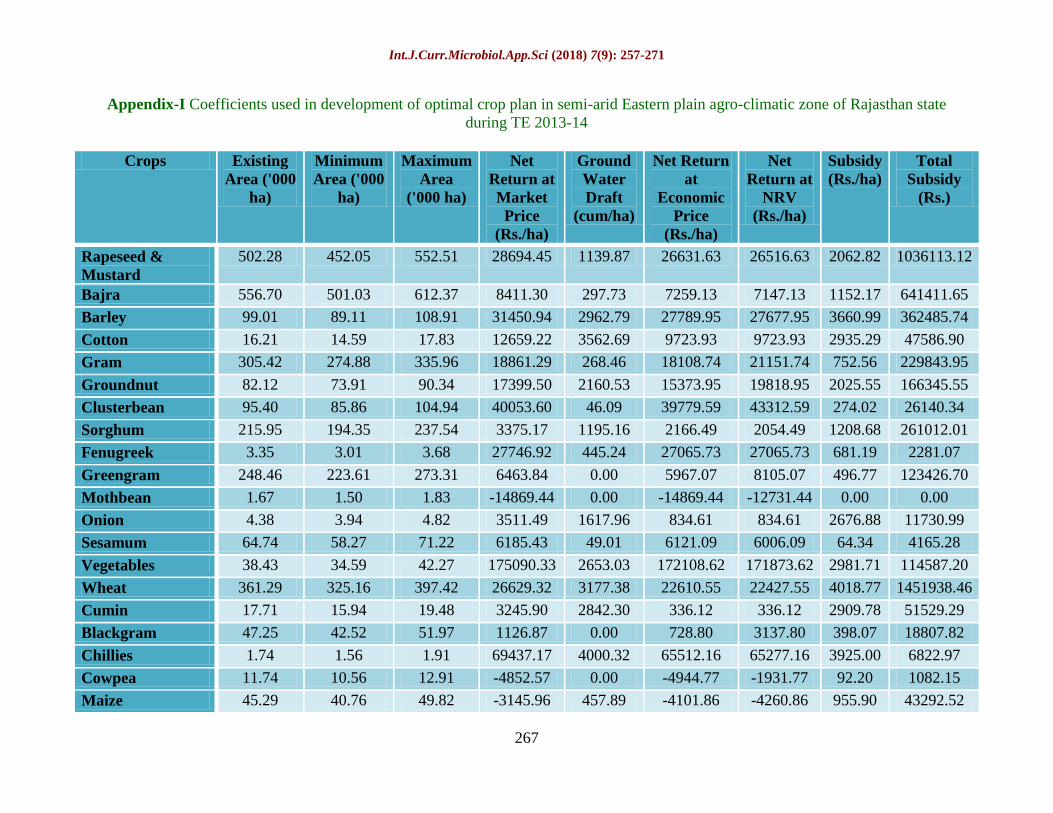
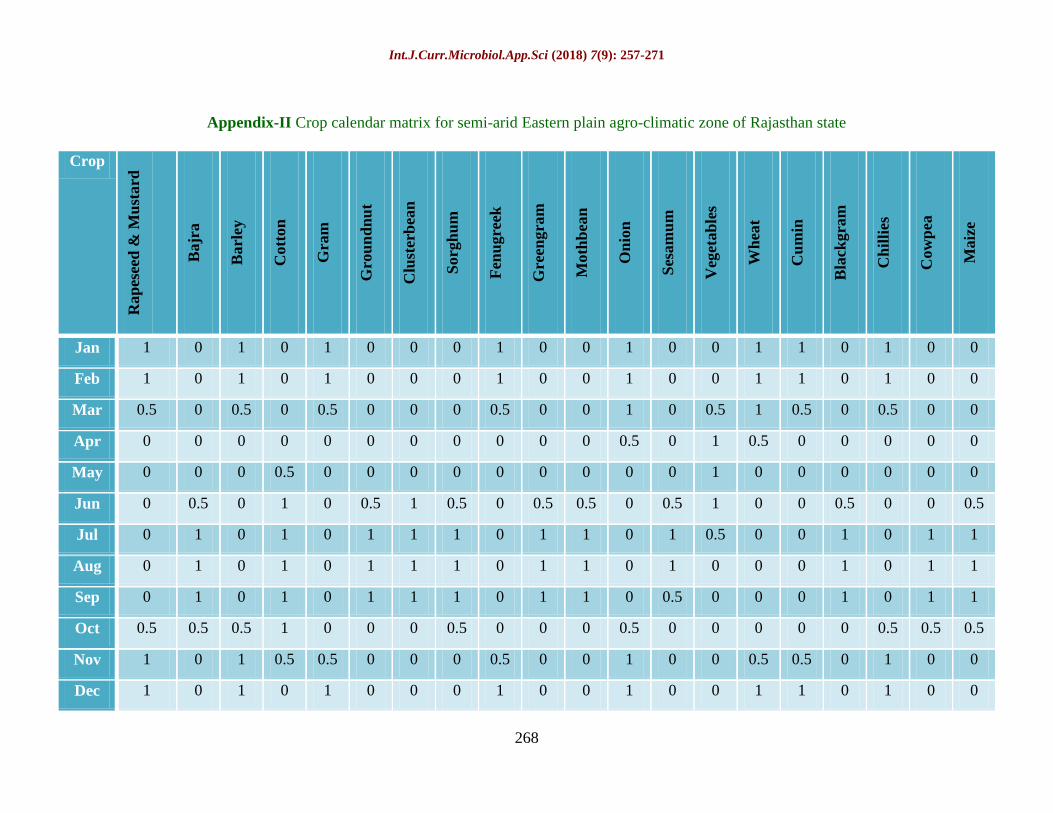
etc.) as constraints (Appendix I and II).
Theoretical formulation of the LP model
The present study made an attempt to develop
different crop planning strategies by using
linear programming (LP). Multi-crop model
for two seasons were formulated in LP for
maximizing the net returns by keeping
cultivable land and available ground water.
Mathematical specifications of the model
Mathematically, model specification for semi-
arid eastern plain agro-climatic zone of
Rajasthan state were presented by Equations
1-6 followed by equation wise description.
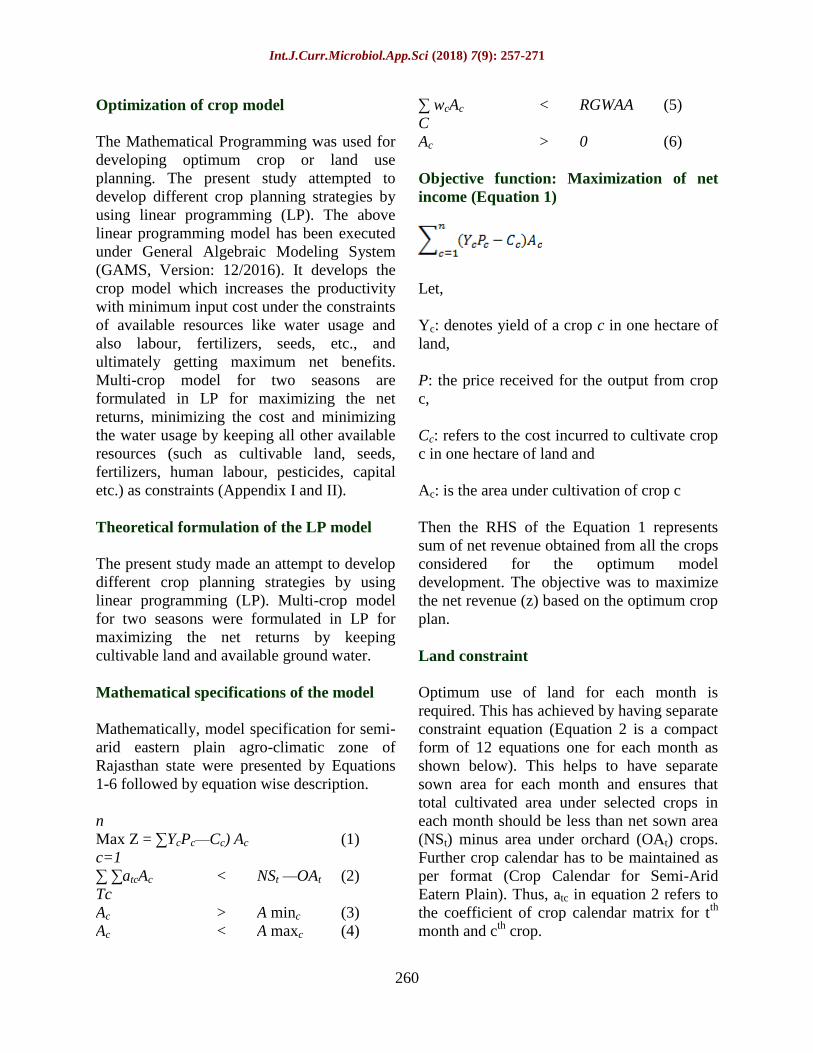
n
Max Z = ∑YcPc—Cc) Ac (1)
c=1
∑ ∑atcAc < NSt —OAt (2)
Tc
Ac > A minc (3)
Ac < A maxc (4)
∑ wcAc < RGWAA (5)
C
Ac > 0 (6)
Objective function: Maximization of net
income (Equation 1)
Let,
Yc: denotes yield of a crop c in one hectare of
land,
P: the price received for the output from crop
c,
Cc: refers to the cost incurred to cultivate crop
c in one hectare of land and
Ac: is the area under cultivation of crop c
Then the RHS of the Equation 1 represents
sum of net revenue obtained from all the crops
considered for the optimum model
development. The objective was to maximize
the net revenue (z) based on the optimum crop
plan.
Land constraint
Optimum use of land for each month is
required. This has achieved by having separate
constraint equation (Equation 2 is a compact
form of 12 equations one for each month as
shown below). This helps to have separate
sown area for each month and ensures that
total cultivated area under selected crops in
each month should be less than net sown area
(NSt) minus area under orchard (OAt) crops.
Further crop calendar has to be maintained as
per format (Crop Calendar for Semi-Arid
Eatern Plain). Thus, atc in equation 2 refers to
the coefficient of crop calendar matrix for tth
month and cth
crop.
Int.J.Curr.Microbiol.App.Sci (2018) 7(9): 257-271
261
Minimum and maximum constraints
(Equation 3-4)
Crop planning model using LP primarily
captures the supply side behavior specifically
area response based on net returns and
resource constraints ignoring the demand
aspect. Such models tend to over-estimate or
under-estimate the area allocations for some
crops. As consequences, a single crop may
cover infeasible larger area (over-estimation)
or null/negligible area (under-estimation).
In some modelling solutions, some major
crops may drastically lose their relevance and
the corresponding area allocations may
become negligible. Then, even though
estimates are robust and mathematically
proven, such allocations may not be desirable
and practically possible from the view point of
food security of the country and livelihood
security of the farmer because appropriate
changes are required in policy framework of
the country to adopt the optimum sustainable
model. Similarly, area allocations for some
crops may be over-estimated ignoring the
demand. Such an area allocation is again
undesirable as it may lead to glut in the
market. To avoid such undesirable over-
estimation or under estimation, assigning
values to minimum and maximum area of the
selected crops become essential in the model.
To eliminate such practically undesirable
solutions, concept of min, max constraints was
used in the model as specified by equation 3-
4.
Groundwater constraints
Water is a scarce natural resource. The ground
water usage should be less than or equal to
replenishable ground water available for
agriculture (RGWAA) for making the
agriculture sustainable. Data of RGWAA was
published by Central Ground Water Board.
RGWAA was estimated by deducting water
consumed by industries and other non-farm
sectors from total replenishable ground water.
Ground water constraint to be used in linear
programming (LP) model for Semi-Arid
Eastern Plain Zone of Rajasthanian agriculture
was as follows:
∑wcAc<RGWAA
Where,
wc: actual water drafted for a crop c in recent
years based on Cost of Cultivation data.
Ac: refers to the area allocation for a crop c.
Existing land area allocations under different
crops are useful to make comparison with
C ∑a
Jan c Ac <
NSJan
— OAJan
C ∑a
Feb c Ac <
NSFeb
— OAFeb
C ∑a
Mar c Ac <
NSMar
— OAMar
C ∑a
Apr c Ac <
NSApr
— OAApr
C ∑a
May c Ac <
NSMay
— OAMay
C ∑a
Jun c Ac <
NSJun
— OAJun
C ∑a
Jul c Ac <
NSJul
— OAJul
C ∑a
Aug c Ac <
NSAug
— OAAug
C ∑a
Sep c Ac <
NSSep
— OASep
C ∑a
Oct c Ac <
NSOct
— OAOct
C ∑a
Nov c Ac <
NSNov
— OANov
C ∑a
Dec c Ac <
NSDec
— OADec
C
∑ ∑ atcAc < NSt —OAt
Int.J.Curr.Microbiol.App.Sci (2018) 7(9): 257-271
262
optimum crop plan model. The data is
available from statistical abstracts of
Rajasthan. This data is further useful for
defining minimum and maximum area
allocation limits for the selected crops.
Existing area is based on the three years
average land use under the crops. Minimum
and maximum area has been determined based
on expert elicitation method.
Results and Discussion
Cost and returns of various crops in semi-
arid eastern plain zone of Rajasthan state
during TE 2013-14
The cost and returns of various crops on
alternative price scenario i.e. based on market
price, based on economic price and based on
natural resource valuation are estimated and
presented separately for Semi-Arid Eastern
Plain Zone of Rajasthan state during TE 2013-
14:
Comparative cost and returns based on
Market Price (MP)
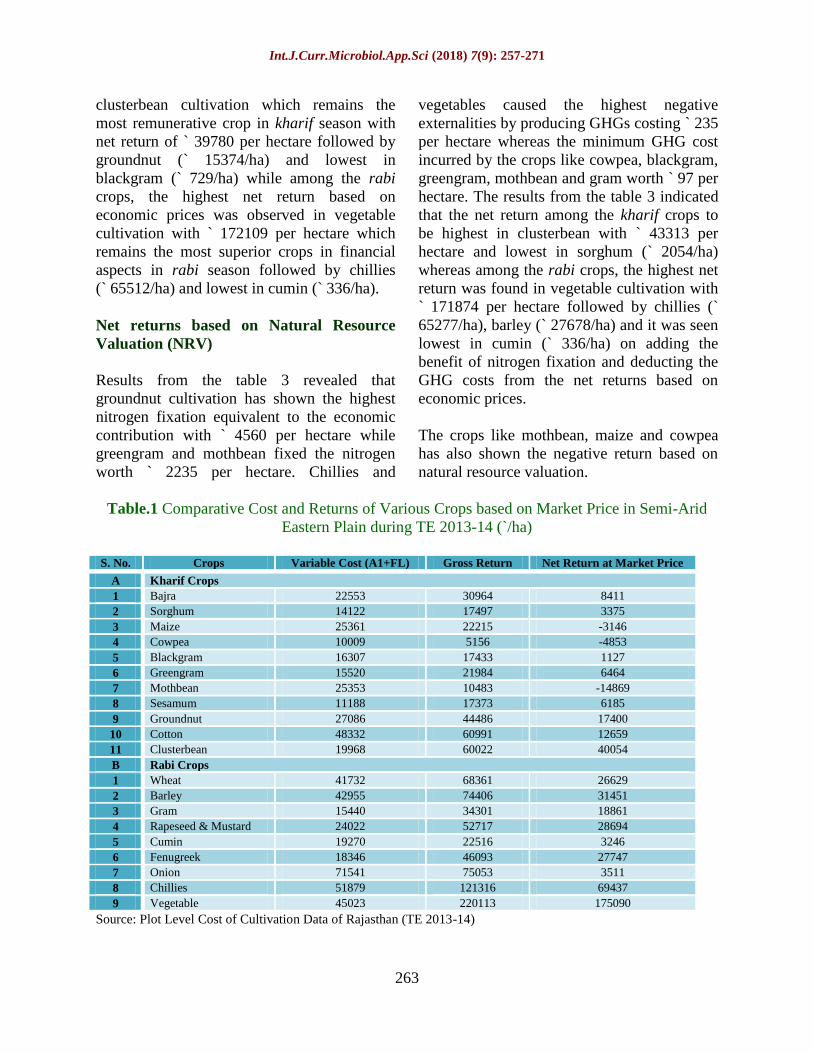
The comparative returns at market price along
with variable cost for various crops in Semi-
Arid Eastern Plain during TE 2013-14 were
analyzed and presented in Table 1. The cost
structure varied across various crops. Among
the kharif crops, cotton cultivation was at the
higher end with variable cost of ` 48332 per
hectare followed by groundnut (` 27086/ha),
maize (` 25361/ha), mothbean (` 25353/ha)
and it was lowest in cowpea i.e.` 10009 per
hectare while variable cost among the rabi
crops was found highest in onion i.e.` 71541
per hectare followed by chillies (` 51879/ha),
vegetables (` 45023/ha), barley (` 42955/ha),
wheat (` 41732/ha) and it was seen lowest in
gram (` 15440/ha).Among the kharif crops,
cotton has shown the highest gross return
(` 60991/ha) followed by clusterbean
(` 60022/ha), groundnut (` 44486/ha) and it
was lowest in cowpea (` 5156/ha) whereas
among the rabi crops, vegetables has shown
the highest gross return (` 220113/ha)
followed by chillies (` 121316/ha) and it was
lowest in cumin (` 22516/ha). The return
depends on the cost of cultivation as well as
on productivity of crop and its prices existed
in the market during the harvesting period.
Among the kharif crops, the net return over
variable cost was found highest in clusterbean
cultivation i.e.` 40054 per hectare because of
lesser the variable cost as per competing crops
like cotton (` 12659/ha) and groundnut
(` 17400/ha) and lowest in blackgram
(` 1127/ha) while in rabi crops, the net return
over variable cost was highest in vegetable
cultivation of ` 175090 per hectare followed
by chillies (` 69437/ha) and it was lowest
found in cumin (` 3246/ha). The crops like
mothbean, cowpea and maize have shown the
negative net return over the variable cost.
Net returns based on Economic Price (EP)
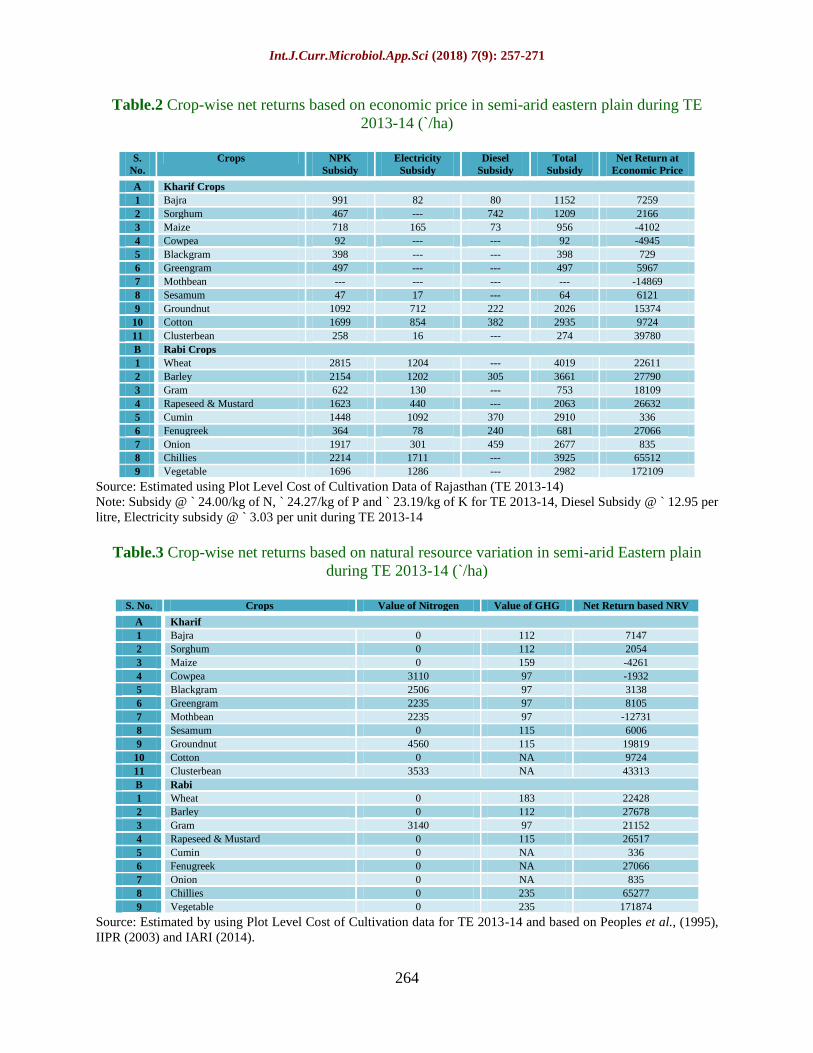
The results presented in table 2 indicated that
the NPK subsidy was use highest in wheat
cultivation of ` 2815 per hectare followed by
chillies (` 2214/ha), barley (` 2154/ha) and it
was lowest in sesamum cultivation (` 47/ha).
Electricity subsidy was found highest in
chillies cultivation of (` 1711/ha) followed by
vegetables (` 1286/ha) and lowest in
clusterbean (` 16/ha). Cultivation of sorghum
has shown the highest use of diesel subsidy of
` 459 per hectare followed by onion
(` 459/ha). Thus, overall total subsidy was
used highest in wheat of ` 4019 per hectare
followed by chillies (3925/ha) and barley
(` 3661/ha) because of the higher use of
fertilizer component in the cultivation of these
crops. Among the all crops, the minimum
subsidy was used in cultivation of sesamum of
` 64 per hectare because of lesser use of
fertilizers and irrigation facilities. The table 2
revealed that among the kharif crops, the net
returns at economic prices was highest in
Int.J.Curr.Microbiol.App.Sci (2018) 7(9): 257-271
263
clusterbean cultivation which remains the
most remunerative crop in kharif season with
net return of ` 39780 per hectare followed by
groundnut (` 15374/ha) and lowest in
blackgram (` 729/ha) while among the rabi
crops, the highest net return based on
economic prices was observed in vegetable
cultivation with ` 172109 per hectare which
remains the most superior crops in financial
aspects in rabi season followed by chillies
(` 65512/ha) and lowest in cumin (` 336/ha).
Net returns based on Natural Resource
Valuation (NRV)
Results from the table 3 revealed that
groundnut cultivation has shown the highest
nitrogen fixation equivalent to the economic
contribution with ` 4560 per hectare while
greengram and mothbean fixed the nitrogen
worth ` 2235 per hectare. Chillies and
vegetables caused the highest negative
externalities by producing GHGs costing ` 235
per hectare whereas the minimum GHG cost
incurred by the crops like cowpea, blackgram,
greengram, mothbean and gram worth ` 97 per
hectare. The results from the table 3 indicated
that the net return among the kharif crops to
be highest in clusterbean with ` 43313 per
hectare and lowest in sorghum (` 2054/ha)
whereas among the rabi crops, the highest net
return was found in vegetable cultivation with
` 171874 per hectare followed by chillies (`
65277/ha), barley (` 27678/ha) and it was seen
lowest in cumin (` 336/ha) on adding the
benefit of nitrogen fixation and deducting the
GHG costs from the net returns based on
economic prices.
The crops like mothbean, maize and cowpea
has also shown the negative return based on
natural resource valuation.
Table.1 Comparative Cost and Returns of Various Crops based on Market Price in Semi-Arid
Eastern Plain during TE 2013-14 (`/ha)
S. No. Crops Variable Cost (A1+FL) Gross Return Net Return at Market Price
A Kharif Crops
1 Bajra 22553 30964 8411
2 Sorghum 14122 17497 3375
3 Maize 25361 22215 -3146
4 Cowpea 10009 5156 -4853
5 Blackgram 16307 17433 1127
6 Greengram 15520 21984 6464
7 Mothbean 25353 10483 -14869
8 Sesamum 11188 17373 6185
9 Groundnut 27086 44486 17400
10 Cotton 48332 60991 12659
11 Clusterbean 19968 60022 40054
B Rabi Crops
1 Wheat 41732 68361 26629
2 Barley 42955 74406 31451
3 Gram 15440 34301 18861
4 Rapeseed & Mustard 24022 52717 28694
5 Cumin 19270 22516 3246
6 Fenugreek 18346 46093 27747
7 Onion 71541 75053 3511
8 Chillies 51879 121316 69437
9 Vegetable 45023 220113 175090
Source: Plot Level Cost of Cultivation Data of Rajasthan (TE 2013-14)
Int.J.Curr.Microbiol.App.Sci (2018) 7(9): 257-271
264
Table.2 Crop-wise net returns based on economic price in semi-arid eastern plain during TE
2013-14 (`/ha)
S.
No.
Crops NPK
Subsidy
Electricity
Subsidy
Diesel
Subsidy
Total
Subsidy
Net Return at
Economic Price
A Kharif Crops
1 Bajra 991 82 80 1152 7259
2 Sorghum 467 --- 742 1209 2166
3 Maize 718 165 73 956 -4102
4 Cowpea 92 --- --- 92 -4945
5 Blackgram 398 --- --- 398 729
6 Greengram 497 --- --- 497 5967
7 Mothbean --- --- --- --- -14869
8 Sesamum 47 17 --- 64 6121
9 Groundnut 1092 712 222 2026 15374
10 Cotton 1699 854 382 2935 9724
11 Clusterbean 258 16 --- 274 39780
B Rabi Crops
1 Wheat 2815 1204 --- 4019 22611
2 Barley 2154 1202 305 3661 27790
3 Gram 622 130 --- 753 18109
4 Rapeseed & Mustard 1623 440 --- 2063 26632
5 Cumin 1448 1092 370 2910 336
6 Fenugreek 364 78 240 681 27066
7 Onion 1917 301 459 2677 835
8 Chillies 2214 1711 --- 3925 65512
9 Vegetable 1696 1286 --- 2982 172109
Source: Estimated using Plot Level Cost of Cultivation Data of Rajasthan (TE 2013-14)
Note: Subsidy @ ` 24.00/kg of N, ` 24.27/kg of P and ` 23.19/kg of K for TE 2013-14, Diesel Subsidy @ ` 12.95 per
litre, Electricity subsidy @ ` 3.03 per unit during TE 2013-14
Table.3 Crop-wise net returns based on natural resource variation in semi-arid Eastern plain
during TE 2013-14 (`/ha)
S. No. Crops Value of Nitrogen Value of GHG Net Return based NRV
A Kharif
1 Bajra 0 112 7147
2 Sorghum 0 112 2054
3 Maize 0 159 -4261
4 Cowpea 3110 97 -1932
5 Blackgram 2506 97 3138
6 Greengram 2235 97 8105
7 Mothbean 2235 97 -12731
8 Sesamum 0 115 6006
9 Groundnut 4560 115 19819
10 Cotton 0 NA 9724
11 Clusterbean 3533 NA 43313
B Rabi
1 Wheat 0 183 22428
2 Barley 0 112 27678
3 Gram 3140 97 21152
4 Rapeseed & Mustard 0 115 26517
5 Cumin 0 NA 336
6 Fenugreek 0 NA 27066
7 Onion 0 NA 835
8 Chillies 0 235 65277
9 Vegetable 0 235 171874
Source: Estimated by using Plot Level Cost of Cultivation data for TE 2013-14 and based on Peoples et al., (1995),
IIPR (2003) and IARI (2014).
Int.J.Curr.Microbiol.App.Sci (2018) 7(9): 257-271
265
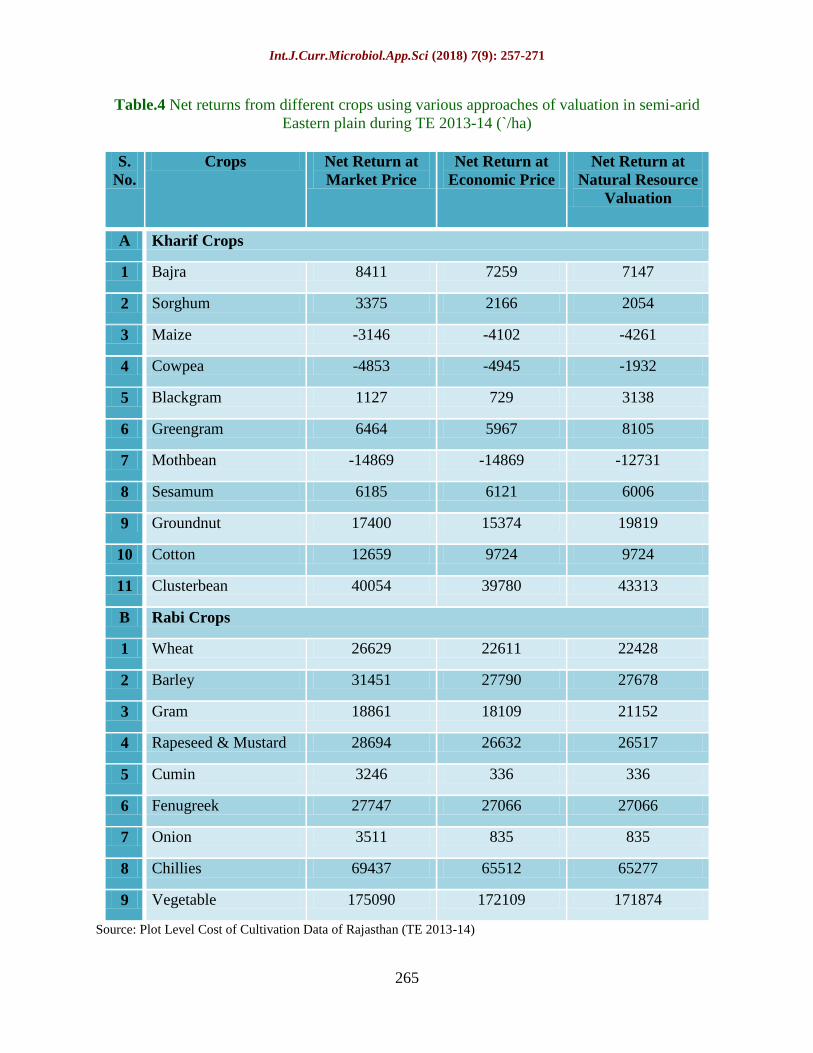
Table.4 Net returns from different crops using various approaches of valuation in semi-arid
Eastern plain during TE 2013-14 (`/ha)
S.
No.
Crops Net Return at
Market Price
Net Return at
Economic Price
Net Return at
Natural Resource
Valuation
A Kharif Crops
1 Bajra 8411 7259 7147
2 Sorghum 3375 2166 2054
3 Maize -3146 -4102 -4261
4 Cowpea -4853 -4945 -1932
5 Blackgram 1127 729 3138
6 Greengram 6464 5967 8105
7 Mothbean -14869 -14869 -12731
8 Sesamum 6185 6121 6006
9 Groundnut 17400 15374 19819
10 Cotton 12659 9724 9724
11 Clusterbean 40054 39780 43313
B Rabi Crops
1 Wheat 26629 22611 22428
2 Barley 31451 27790 27678
3 Gram 18861 18109 21152
4 Rapeseed & Mustard 28694 26632 26517
5 Cumin 3246 336 336
6 Fenugreek 27747 27066 27066
7 Onion 3511 835 835
8 Chillies 69437 65512 65277
9 Vegetable 175090 172109 171874
Source: Plot Level Cost of Cultivation Data of Rajasthan (TE 2013-14)
Int.J.Curr.Microbiol.App.Sci (2018) 7(9): 257-271
266
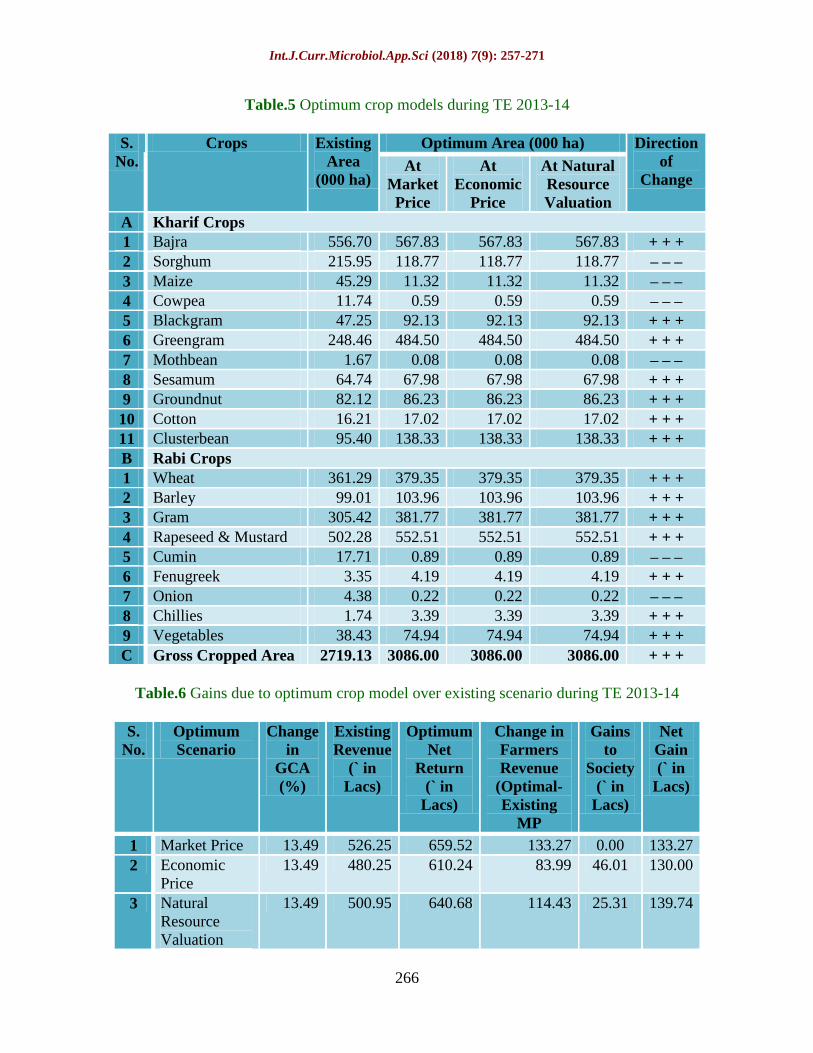
Table.5 Optimum crop models during TE 2013-14
S.
No.
Crops Existing
Area
(000 ha)
Optimum Area (000 ha) Direction
of
Change At
Market
Price
At
Economic
Price
At Natural
Resource
Valuation
A Kharif Crops
1 Bajra 556.70 567.83 567.83 567.83 + + +
2 Sorghum 215.95 118.77 118.77 118.77 – – –
3 Maize 45.29 11.32 11.32 11.32 – – –
4 Cowpea 11.74 0.59 0.59 0.59 – – –
5 Blackgram 47.25 92.13 92.13 92.13 + + +
6 Greengram 248.46 484.50 484.50 484.50 + + +
7 Mothbean 1.67 0.08 0.08 0.08 – – –
8 Sesamum 64.74 67.98 67.98 67.98 + + +
9 Groundnut 82.12 86.23 86.23 86.23 + + +
10 Cotton 16.21 17.02 17.02 17.02 + + +
11 Clusterbean 95.40 138.33 138.33 138.33 + + +
B Rabi Crops
1 Wheat 361.29 379.35 379.35 379.35 + + +
2 Barley 99.01 103.96 103.96 103.96 + + +
3 Gram 305.42 381.77 381.77 381.77 + + +
4 Rapeseed & Mustard 502.28 552.51 552.51 552.51 + + +
5 Cumin 17.71 0.89 0.89 0.89 – – –
6 Fenugreek 3.35 4.19 4.19 4.19 + + +
7 Onion 4.38 0.22 0.22 0.22 – – –
8 Chillies 1.74 3.39 3.39 3.39 + + +
9 Vegetables 38.43 74.94 74.94 74.94 + + +
C Gross Cropped Area 2719.13 3086.00 3086.00 3086.00 + + +
Table.6 Gains due to optimum crop model over existing scenario during TE 2013-14
S.
No.
Optimum
Scenario
Change
in
GCA
(%)
Existing
Revenue
(` in
Lacs)
Optimum
Net
Return
(` in
Lacs)
Change in
Farmers
Revenue
(Optimal-
Existing
MP
Gains
to
Society
(` in
Lacs)
Net
Gain
(` in
Lacs)
1 Market Price 13.49 526.25 659.52 133.27 0.00 133.27
2 Economic
Price
13.49 480.25 610.24 83.99 46.01 130.00
3 Natural
Resource
Valuation
13.49 500.95 640.68 114.43 25.31 139.74
Int.J.Curr.Microbiol.App.Sci (2018) 7(9): 257-271
267
Appendix-I Coefficients used in development of optimal crop plan in semi-arid Eastern plain agro-climatic zone of Rajasthan state
during TE 2013-14
Crops Existing
Area ('000
ha)
Minimum
Area ('000
ha)
Maximum
Area
('000 ha)
Net
Return at
Market
Price
(Rs./ha)
Ground
Water
Draft
(cum/ha)
Net Return
at
Economic
Price
(Rs./ha)
Net
Return at
NRV
(Rs./ha)
Subsidy
(Rs./ha)
Total
Subsidy
(Rs.)
Rapeseed &
Mustard
502.28 452.05 552.51 28694.45 1139.87 26631.63 26516.63 2062.82 1036113.12
Bajra 556.70 501.03 612.37 8411.30 297.73 7259.13 7147.13 1152.17 641411.65
Barley 99.01 89.11 108.91 31450.94 2962.79 27789.95 27677.95 3660.99 362485.74
Cotton 16.21 14.59 17.83 12659.22 3562.69 9723.93 9723.93 2935.29 47586.90
Gram 305.42 274.88 335.96 18861.29 268.46 18108.74 21151.74 752.56 229843.95
Groundnut 82.12 73.91 90.34 17399.50 2160.53 15373.95 19818.95 2025.55 166345.55
Clusterbean 95.40 85.86 104.94 40053.60 46.09 39779.59 43312.59 274.02 26140.34
Sorghum 215.95 194.35 237.54 3375.17 1195.16 2166.49 2054.49 1208.68 261012.01
Fenugreek 3.35 3.01 3.68 27746.92 445.24 27065.73 27065.73 681.19 2281.07
Greengram 248.46 223.61 273.31 6463.84 0.00 5967.07 8105.07 496.77 123426.70
Mothbean 1.67 1.50 1.83 -14869.44 0.00 -14869.44 -12731.44 0.00 0.00
Onion 4.38 3.94 4.82 3511.49 1617.96 834.61 834.61 2676.88 11730.99
Sesamum 64.74 58.27 71.22 6185.43 49.01 6121.09 6006.09 64.34 4165.28
Vegetables 38.43 34.59 42.27 175090.33 2653.03 172108.62 171873.62 2981.71 114587.20
Wheat 361.29 325.16 397.42 26629.32 3177.38 22610.55 22427.55 4018.77 1451938.46
Cumin 17.71 15.94 19.48 3245.90 2842.30 336.12 336.12 2909.78 51529.29
Blackgram 47.25 42.52 51.97 1126.87 0.00 728.80 3137.80 398.07 18807.82
Chillies 1.74 1.56 1.91 69437.17 4000.32 65512.16 65277.16 3925.00 6822.97
Cowpea 11.74 10.56 12.91 -4852.57 0.00 -4944.77 -1931.77 92.20 1082.15
Maize 45.29 40.76 49.82 -3145.96 457.89 -4101.86 -4260.86 955.90 43292.52
Int.J.Curr.Microbiol.App.Sci (2018) 7(9): 257-271
268
Appendix-II Crop calendar matrix for semi-arid Eastern plain agro-climatic zone of Rajasthan state
Crop
Rap
esee
d &
Mu
stard
Bajr
a
Barl
ey
Cott
on
Gra
m
Gro
un
dn
ut
Clu
ster
bea
n
Sorg
hu
m
Fen
ugre
ek
Gre
engra
m
Moth
bea
n
On
ion
Ses
am
um
Veg
etab
les
Wh
eat
Cu
min
Bla
ckgra
m
Ch
illi
es
Cow
pea
Maiz
e
Jan 1 0 1 0 1 0 0 0 1 0 0 1 0 0 1 1 0 1 0 0
Feb 1 0 1 0 1 0 0 0 1 0 0 1 0 0 1 1 0 1 0 0
Mar 0.5 0 0.5 0 0.5 0 0 0 0.5 0 0 1 0 0.5 1 0.5 0 0.5 0 0
Apr 0 0 0 0 0 0 0 0 0 0 0 0.5 0 1 0.5 0 0 0 0 0
May 0 0 0 0.5 0 0 0 0 0 0 0 0 0 1 0 0 0 0 0 0
Jun 0 0.5 0 1 0 0.5 1 0.5 0 0.5 0.5 0 0.5 1 0 0 0.5 0 0 0.5
Jul 0 1 0 1 0 1 1 1 0 1 1 0 1 0.5 0 0 1 0 1 1
Aug 0 1 0 1 0 1 1 1 0 1 1 0 1 0 0 0 1 0 1 1
Sep 0 1 0 1 0 1 1 1 0 1 1 0 0.5 0 0 0 1 0 1 1
Oct 0.5 0.5 0.5 1 0 0 0 0.5 0 0 0 0.5 0 0 0 0 0 0.5 0.5 0.5
Nov 1 0 1 0.5 0.5 0 0 0 0.5 0 0 1 0 0 0.5 0.5 0 1 0 0
Dec 1 0 1 0 1 0 0 0 1 0 0 1 0 0 1 1 0 1 0 0
Int.J.Curr.Microbiol.App.Sci (2018) 7(9): 257-271
269
Comparative returns of crops using
various approaches of valuation
Table 4 indicated that there was moderate to
high decline in net return from the various
crops after subtracting the subsidies on
fertilize, electricity and diesel. The impact of
subsidy was so large in the cultivation of
wheat, chillies, barley, cotton and groundnut.
The withdrawal of the subsidies has reduced
the net income. Due to the high rate of
profitability in cultivation of vegetables,
chillies, clusterbean, the removal of subsidies
reduced the net income marginally. The
positive impact of biological nitrogen fixation
through the legume crops, the profitability in
legume crops has increased and the deduction
of GHG costing reduced the net income of
various crops. After netting out the subsidies,
adding the positive benefits to environment
by legume crops and deducting the GHG
costing from various crops, the clusterbean-
vegetable cropping pattern was found the
most superior, stable and produces the higher
financial net return of ` 215187 per hectare
followed by clusterbean-chillies (` 108590/ha)
cropping pattern under the set of marketing
infrastructure, irrigation facilities, higher the
productivity, minimum support prices and
available modern technologies for the
cultivation of these crops.
Optimum crop model
The optimum crop plan during TE 2013-14 at
existing ground water scenario are presented
in Table 5. The gross cropped area was
2719.13 thousand hectares during TE 2013-
14. In kharif season, bajra (556.70 thousand
hectares), greengram (248.46 thousand
hectares), sorghum (215.95 thousand
hectares), clusterbean (95.40 thousand
hectares) and groundnut (82.12 thousand
hectares) were the major crops during the
study period. Area under blackgram and
greengram has been increased by 95 per cent
followed by clusterbean (45%), sesamum,
groundnut and cotton by 5 per cent and bajra
by 2 per cent while the area share in
mothbean and cowpea has declined by 95 per
cent followed by maize (75%) and sorghum
(45%). It was observed that area in optimum
crop plan at all three price scenario shifted
from mothbean, cowpea, maize and sorghum
towards blackgram, greengram and
clusterbean. In rabi season, rapeseed &
mustard (18.47 per cent of GCA), wheat
(13.29 per cent of GCA), gram (11.23 per
cent of GCA) and barley (3.64 per cent of
GCA) were the major crops in the zone
during the study period. The optimal plan has
allocated about 95 per cent more area to
chillies and vegetables followed by gram
(25%), fenugreek (25%), rapeseed & mustard
(10%) and wheat by 5 per cent whereas area
under cumin and onion have declined by
almost 95 per cent. Under the optimal crop
plan, the area from cumin and onion has been
shifted towards chillies and vegetables.
Gain due to optimum crop plan at existing
ground water scenario during TE 2013-14 is
presented in Table 6. The gross cropped area
has increased at all the three price scenario by
13.49 per cent from 2719.13 thousand
hectares to 3086.00 thousand hectares in
optimal crop plan. The farmer’s revenue has
increased at market price, economic price and
natural resource valuation of ` 133.27 lakh, `
83.99 lakh and ` 114.43 lakh, respectively.
Estimated net gains to the farmer’s
perspective amounted to ` 133.27 lakh which
went up to 139.74 lakh at natural resource
valuation. At economic prices and natural
resource evaluation, the society has gained by
46.01 lakh and 25.31 lakh, respectively.
Finally, it can be concluded that even after
netting out the input subsidies and effect on
environment and natural resources,
clusterbean-vegetable crop sequence
produced the higher net return of ` 215187 per
Int.J.Curr.Microbiol.App.Sci (2018) 7(9): 257-271
270
hectare followed by clusterbean-chillies (`
108590/ha) crop sequence under the set of
marketing infrastructure, minimum support
prices, agricultural technological know-how,
climatic conditions and available irrigation
facilities existed in the zone. Optimum crop
plan model of this zone indicated that area
shifted from sorghum, maize, cowpea and
mothbean towards blackgram, greengram and
clusterbean in kharif season whereas in rabi
season, area shifted from cumin and onion
towards the chillies, vegetables, gram and
fenugreek and towards the rapeseed and
mustard and wheat to some extent. Therefore,
existing gross cropped area has increased at
all the three price scenario by 13.49 per cent
from 2719.13 thousand hectares to 3086.00
thousand hectares in optimal crop plan. The
factors that are not captured by the market
like subsidies is the direct cost to the society,
factors affecting the natural resources and
environment as nitrogen fixation and
greenhouse gas costs, need to be considered
and should be internalized through
appropriate policies. Reckoning such costs
and return alters the level of net income from
various crops.
References
Abdelaziz, H. H., Abdalla, A. A. and
Abdellatif, M. A. 2010. Optimizing the
Cropping Pattern in North Darfur State,
Sudan: A Study of Dar Elslam District.
Journal of Applied Sciences Research, 6
(2): 156-164.
Agriculture Statistics at a Glance (Various
Issues), Government of Rajasthan.
Available at: http://www.krishi.
rajasthan.gov.in.
Ahmad, F. R., Basavaraja, H., Kunnal, L. B.,
Mahajanashetti, S. B., and Megeri. S. N.
2014. An Economic Analysis of
Changes in Cropping Pattern in
Karnataka. Karnataka Journal of
Agricultural Science, 27 (3): 312-315.
Burark, S.S., Sharma, L., Meena, G.L. and
Jat, S. 2017. ICAR-Social Science
Network Project Report “Regional Crop
Planning for Improving Resource Use
Efficiency and Sustainability in
Rajasthan”. Department of Agricultural
Economics and Management, RCA,
MPUAT, Udaipur (Raj).
Deokate, T. B. and Bandgar, D. P. 2013.
Changes in Land-use and Cropping
Pattern in Maharashtra. Agricultural
Economics Research Review. 26: 257.
GoI. 2013. Dynamic Ground Water Resources
of India. Central Ground Water Board,
Ministry of Water Resources, River
Development & Ganga Rejuvenation
Government of India, New Delhi.
IARI. 2014. GHG Emission from Indian
Agriculture: Trends, Mitigation and
Policy Needs. Centre for Environment
Science and Climate Resilient
Agriculture, Indian Agriculture
Research Institute, New Delhi, pp: 16.
IIPR. 2003. Pulses in New Perspective. In:
Proceedings of the National Symposium
on Crop Diversification and Natural
Resource Management, Indian Institute
of Pulses Research, Kanpur (U.P.), pp:
20-22.
Indian Fertilizer Scenario. 2013. Department
of Fertilizers, Ministry of Chemicals
and Fertilizers, Government of India,
New Delhi.
Jain, R., Kingsly, I., Chand, R., Kaur, A.P.,
Raju, S.S., Srivastava, S.K. and Singh,
J. 2017. Farmers and Social Perspective
on Optimal Crop Planning for Ground
Water Sustainability: A Case of Punjab
State in India. Journal of the Indian
Society of Agricultural Statistics, 71 (1):
75–88.
Kaur, B., Sidhu, R.S. and Vatta, K. 2010.
Optimal Crop Plans for Sustainable
Water Use in Punjab. Agricultural
Economic Research Review, 23: 273-
284.
Int.J.Curr.Microbiol.App.Sci (2018) 7(9): 257-271
271
Pal, S. and Kar, S. 2012. Implications of the
Methods of Agricultural Diversification
in Reference with Malda district:
Drawback and Rationale. International
Journal of Food, Agriculture and
Veterinary Sciences, 2 (2): 97-105.
Peoples, M.B., Ladha, J.K. and Herridge, D.F.
1995. Enhancing Legume N2 Fixation
though Plants and Soil Management.
Development in Plant and Soil Sciences,
174: 83-101.
Rajasthan Electricity Regulatory
Commission, Government of Rajasthan
(Various Issues).
Raju, S.S., Chanda, R., Srivastava, S.K.,
Kaur, A.P., Singh, J., Jain, R., Kingsly,
I. and Kaur, P. 2015. Comparing
Performance of Various Crops in
Punjab Based on Market and Economic
Prices and Natural Resource
Accounting. Agricultural Economics
Research Review, 28 (Conference
Number): 189-198.
Yadav, D.B., Gavali, A.V. and Kamble, B.H.
2017. ICAR-Social Science Network
Project Report “Regional Crop Planning
for Improving Resource Use Efficiency
and Sustainability in Maharashtra”.
Department of Agricultural Economics,
MPKV, Rahuri (M.S.).
How to cite this article:
Jangid, M.K., Latika Sharma, S.S. Burark and Pant, D.C. 2018. Optimum Cropping Pattern
based on Alternative Price Scenarios in Semi-Arid Eastern Plain Zone of Rajasthan State,
India. Int.J.Curr.Microbiol.App.Sci. 7(09): 257-271.
doi: https://doi.org/10.20546/ijcmas.2018.709.033