optimization of performance and emissions of a diesel...
TRANSCRIPT
Asian Journal of Applied Sciences (ISSN: 2321 – 0893)
Volume 04 – Issue 02, April 2016
Asian Online Journals (www.ajouronline.com) 401
Optimization of Performance and Emissions of a Diesel Engine
Fuelled with Rubber Seed- Palm Biodiesel Blends using Response
Surface Method
Ibrahim K. Adam1*
, A.Rashid A.Aziz1, Suzana Yusup
2, Morgan Heikal
1 and Ftwi Hagos
3
1Centre for Automotive Research and Electric Mobility, Mechanical Engineering Department, Universiti Teknologi PETRONAS
32610, Seri Iskandar, Perak, Malaysia
3Center of Biofuel and Biochemical Research, Biomass Processing Laboratory, Chemical Engineering Department, Universiti
Teknologi PETRONAS
32610, Seri Iskandar, Perak, Malaysia
3Automotive Engineering Center, Faculty of Mechanical Engineering, Universiti Malaysia Pahang
26600, Pekan, Malaysia
*Corresponding Author email: ibrahim_g02238 [AT] utp.edu.my
________________________________________________________________________________
ABSTRACT— The effects of engine speed and load, and fuel blend ratio on the emissions and performance of an
IDI (indirect injection) diesel engine were investigated. A 50:50 vol. blend of rubber seed and palm oils was used for
the biodiesel production to reduce costs and enhance properties. Oil acid was reduced from 33.4 to 1.42 mg KOH/g oil
by esterification followed by a transesterification in a hydrodynamic cavitation reactor. Blends of 0- 40 vol. %
biodiesel to a diesel with 10% increments were prepared. Statistical tool, BBD (Box-Behnken design) based on a RSM
(response surface methodology) was used to assess the combined effects of variables on parameters such as BT
(torque), BP (power), BSFC (brake specific fuel consumption), BTE (brake thermal efficiency), CO, CO2, NOx, EGT
(exhaust gas temperature) and O2. The engine load was found to be the most influential parameter compared to the
engine speed and fuel blend. The engine speed was found to have a strong effect on performance and emissions
except on BT and O2. The fuel blend effect was less significant except for BSFC, BTE, CO and CO2. On average
biodiesel blends showed lower BT (0.97- 1.6%), BP (0.94- 1.4%), BTE (0.76-1.5%) and CO (0.93-6.7%) but higher
BSFC (0.93- 1.7%), CO2 (0.95- 1.1%), NOx (0.97- 1.2%), EGT (1.1- 1.3%) and O2 (0.3- 1.2%) compared to diesel
fuel. An optimum desirability value of 0.96 was achieved with fuel blend of 18 % (biodiesel to diesel), engine speed of
2320 rpm and engine load of 82% for the tested IDI engine.
Keywords— Response surface methodology, hydrodynamic cavitation reactor, biodiesel, performance, emissions
_________________________________________________________________________________
1. INTRODUCTION
The Fossil fuel depletion and carbon dioxide emissions are increasing due to the accelerated urbanization and
industrialization [1]. Biodiesel consists of mono alkyl esters of fatty acids produced by chemical conversion of vegetable
oils or animal fats [2]. The use of biodiesel fuels in diesel engines has both environmental and economic advantages such
as reduction in emissions, local availability of raw material and improved energy security. Currently, most of the
biodiesel productions come from edible sources such as soybean, palm and sunflower oils. However, due to land
limitation, food verses fuel issues and energy policies, their industrial expansion has been limited [3]. Although biodiesel
productions from these sources are inevitable for their availability and large production levels, reducing their amounts
using non- edible sources will relieve them for other uses. Blending edible/non-edible oils is a solution that will have
significant contribution towards the advancement of the industry. Jatropha-palm oil, Jatropha- soapnut and Mahua-
simarouba oil blends have been investigated [4-8] and observed to be good potential sources for biodiesel productions. In
Malaysia, there are 1,229,940 hectares of rubber plantation according to the association of NRPC (Natural Rubber
Producing Countries) and the projected annual production is estimated to be 1.2 million metric ton per year [9]. Each tree
yields 1.3 kg on average twice a year. The kernel has an average oil of 40- 50 wt. % and can be used for biodiesel
synthesis [10]. Comprehensive literature on the rubber seed oil based biodiesel production process is available in [11-15].
Recently, the palm oil based biodiesel usages in diesel engines was studied by many researchers [16, 17]. Liaquat et al.
[18] investigated the PB20 effect during an endurance test. CO and THC were found to be lower by 11% and 11.71%,
respectively whereas BSFC and NOx were higher by 3.88% and 3.31%, respectively compared to their diesel

Asian Journal of Applied Sciences (ISSN: 2321 – 0893)
Volume 04 – Issue 02, April 2016
Asian Online Journals (www.ajouronline.com) 402
counterparts. Satyanarayana and Muraleedharan [19] studied the rubber seed oil biodiesel in a single cylinder diesel
engine at difference loads and a constant speed of 1500 rpm. They reported less torque and power, 4.95% lower BTE,
higher BSFC, 0.037% lower CO, lower THC and higher NOx compared to diesel fuel. Raheman et al. [7] investigated
the performance and emissions of the Mahua-simarouba oil mixture biodiesel using a single cylinder diesel engine. The
results showed higher BSFC and NOx while BTE, CO and THC were lower compared to diesel fuel. Michael et al. [20]
investigated the soybean-soapstock biodiesel in a diesel engine and observed a reduction in CO and THC. Due to the
slightly chemical composition differences, biodiesel fuel combustion may differ from the actual diesel fuel and results in
different emissions and performance. Investigations of different oils blended biodiesels in a diesel engine in the literature,
mostly focused on examining one parameter effect such as the engine speed, engine load, blends ratio, IT (injection
timing) or IP (injection pressure) at a time as presented in Supplementary 1. However, the diesel engine combustion
process is influenced by the combined effects of all the above mentioned parameters. Therefore, a multi-variation
investigation could provide clear knowledge on the combustion behaviour rather than one variable at a time. Multi-
variation studies, methods such as DoE (Design of experiments), ANN (artificial neural network) and fuzzy logic are
suitable to explore the combination effects of input parameters. DoE is accepted the most effective and economical
technique compared to ANN and fuzzy logic. Bhattacharya et al. [21] investigated the effects of load, speed and injection
timing on the BSFC, exhaust emissions and noise. BSFC limitation is reported by lower load, noise being limited with
higher speed and advance timing, whereas THC and NOx are limited by advance timing. Pandian et al. [22] studied the
effects of injection parameters such as nozzle tip protrusion, IP and IT in a twin cylinder diesel engine fuelled with
Pongamia biodiesel. They found that advancing the IT from 18° to 30° BTDC (before top dead center) and increasing IP
from 150 to 250 bar reduced the THC, CO and smoke emission and increased NOx. Better BTE and lower BSFC were
reported at moderated nozzle tip protrusion. Sivaramakrishnan and Ravikumar [23] optimized the operating parameters
such as fuel blends and CR (compression ratio) using a single cylinder diesel engine. The results showed that advancing
CR reduced the CO and THC while decreasing the fuel blend ratio resulted in better BTE, lower BSFC, NOx, THC and
CO. Jagannath and Atul [24] optimized the effect of CR and IP in a single cylinder diesel engine using waste fried oil
biodiesel. Increasing CR and IP increased the BTE, EGT and decreased the BSFC. There is a lack of knowledge, in the
literature on the optimization of engine emissions and performance of rubber seed and palm oil blend biodiesels.
Therefore, new biodiesel fuel with improved properties was developed by blending the rubber seed and palm oil at an
equal blend ratio. The RSM method was utilized to investigate the parametric effects on the transesterification process,
engine performance and emissions characteristics. Methyl ester at optimized conditions was produced using two-steps,
acid esterification and transesterification process in a HC (hydrodynamic cavitation reaction) and thermo physical
properties were studied. The individual and combined effects of the engine load and speed, and fuel blend ratio on the
emissions and performance of an IDI were examined.
2. MATERIAL AND METHODS
2.1 Material
Rubber seed/palm oil mixture at a blend ratio of 50:50 vol. % was characterized following the AOCS (American Oil
Chemistry Society) standard method [39]. Oil blend property values such as acid value, iodine value, free fatty acid,
density, viscosity, calorific value, sulfur and nitrogen content were 33.4 mg KOH/g oil, 95.1 mg/I2/g oil, 12%, 914.64
kg/m3, 43.8 cSt at 25°C, 38182 J/g, 0.55 wt.% and 0.41 wt.% respectively.
2.2 Transesterification process optimization
Transesterification is a chemical conversion process in which the triglycerides are converted to fatty acid alkyl esters. An
oil blend with acid value of 33.4 mg KOH/g oil was reduced to 1.42 mg KOH/g oil in a pre-treatment process (acid
esterification). The treated oil was used in the transesterification process. A three-neck round bottom flask of 250 ml
attached to a condenser to avoid alcohol losses was used. Input factors and their ranges were, (-1) low level, (+1) high
level and on the axial direction were (-2) low level and (+2) high level as presented in Table 1. The required temperature,
mixing time and amount of methanol and catalyst (potassium hydroxide) followed the experimental plan in
Supplementary 2. After the specified time, the reaction process was stopped and the product was left for separation
gravitationally. Two layers of liquids such as methyl ester upper and glycerol lower were formed after 12 hours and
deionized warm water was used to wash the methyl ester. The optimized conditions for 92% conversion yields were
reaction temperature and time of 64°C and 2.5 hours, catalyst amount of 1.3 and a methanol to oil ratio of 6:1.

Asian Journal of Applied Sciences (ISSN: 2321 – 0893)
Volume 04 – Issue 02, April 2016
Asian Online Journals (www.ajouronline.com) 403
Table 1: Independent variables and levels used for transesterification study
Process parameters Symbols Levels -2 -1 0 +1 +2
Alcohol to oil molar ratio A 4.64 6 8 10 11.36
Catalyst amount (wt. %) B 0.66 1 1.5 2 2.3
Reaction temperature (°C) C 38 45 55 65 72
Reaction time (hr) D 0.32 1 2 3 3.68
2.3 Biodiesel production
Hydrodynamic cavitation reactor (HC) with a 50 L capacity was used for the biodiesel production. The system
consisted of a double jacketed glass and air compressor with maximum power of 4 kW to operate the double diaphragm
pump as the main device to dissipate the energy in the HC reactor. The previously optimized plate geometry with a 1 mm
diameter, 21 holes, 16.5 mm2 total flow area and 65.98 mm perimeter was used [40]. The inlet pressure of two bars was
regulated using the main line valve and bypass line. The reaction temperature and its desired level were achieved by
circulating liquid glycerine through the jacket surrounding the reactor. A 30 kg of oil mixture per run was pre-treated
using previously optimized conditions [41]. The mixture after esterification was transferred to the transesterification
process and the above mentioned optimizations were used. The reaction was stopped after the specified time and the
product was left for separation gravitationally. After four hours two layers of liquid; methyl ester and glycerol were
formed. Deionized warm water at 40°C was used to wash the methyl ester to remove impurities, whereas the methanol
and remaining water were removed using the rotary vacuum evaporator. To insure the product was water free, 10 g of
anhydrous sodium sulphate was added, shaken for one minute and the product was filtered using a 541 Whatman filter
paper. Finally the produced biodiesel was stored for the properties study and engine testing.
2.4 Fuel preparation
The preparation of the fuels and property study were carried out at Universiti Teknologi PETRONAS. Samples of
pure fossil diesel fuel, B10, B20, B30 and B40 vol. % of biodiesel to diesel fuel were investigated. The blends were
mechanically stirred for 30 minutes at 2500 rpm. The equipment used, and the properties of the methyl ester and blends
followed ASTM and EN standard methods as shown in Tables 2 and 3 respectively.
Table 2: Methods and equipment used for biodiesel characterization
Parameters Methods Equipment Density (kg/m3) ASTM D 5002 and ASTM D4502 DMA 4500M, Anton Paar
Viscosity (mm2/s) DIN 53015 and DIN 12058 2000 M/ME, Anton Paar, Lovis
Calorific value (MJ/kg) DIN 51900 and ASTM D 4868 C5000 IKA Werke, Germany
Cetane Number ASTM D 613 Shatox Octane meter, SX-100K
Oxidation stability (h) EN 14112 standard 873-CH-9101 Metrohm
Flash Point (°C) ASTM D 93 CLA 5, Petrotest
Cloud Point (°C) ASTM D 2500 CPP 5G’s
Pour point(°C) ASTM D 97 CPP 5G’s
Clod Filter Plugging Point (°C) ASTM D 6371 FPP 5G’s
Surface tension (Nm) - Rame Hart model 260
CHNS (wt. %) - Perkin Elmer, Series II CHNS/O 2400
Table 3: Methyl ester and blends properties
Property Biodiesel B10 B20 B30 B40 Diesel Density (kg/m3) at 25°C 872 829.5 832.4 838.1 840.8 825
Viscosity at 40°C (mm2/s) 3.4 3.2 3.25 3.27 3.29 3.21
Calorific value (MJ/kg) 39.5 42.83 42.45 42 41.7 43.2
Cetane Number 51.2 47.4 47.8 48.4 48.61 47
Oxidation stability (h) 8.92 94.1 82.67 76.3 66.72 103.6
Flash Point (°C) 151 80.2 89.12 94.2 102.8 72.4
Cloud Point (°C) 5 -14.6 -12.4 -9.7 -8.01 -17
Pour point(°C) -1 -28.7 -25.6 -21.8 -19.5 -32
Clod Filter Plugging Point (°C) 0 - - - - -
Surface tension (Nm) 29.3 27.3 27.52 27.64 27.96 27.08
Perkin
Elmer,
CHNS,
2400
Carbon (% w/w) 75.38 85.49 84.26 83.6 82.01 86.62
Hydrogen (% w/w) 11.38 13.01 12.8 12.63 12.42 13.21
Nitrogen (% w/w) 0.07 0.015 0.023 0.027 0.032 0.01
Sulfur (%) 0.01 0.144 0.12 0.11 0.1 0.16
Oxygen (%) 12.77 1.4 2.8 3.9 5.12 0.0

Asian Journal of Applied Sciences (ISSN: 2321 – 0893)
Volume 04 – Issue 02, April 2016
Asian Online Journals (www.ajouronline.com) 404
2.5 Engine testing
The experiments were conducted on a multi cylinder, naturally aspirated, water cooled IDI engine (XLD 418D). The
specifications and engine testing setup are presented in Table 4 and Figure 1. A Eddy current dynamometer, model SE
150, water cooled, maximum power of 150 kW, maximum torque of 500 Nm and maximum speed of 8000 rpm was
used. The engine and the dynamometer were controlled using an ECU (engine control unit) equipped with sensors,
logging, thermocouples and data acquisition device. The experiment started with the engine warming up for about 30
minutes using the diesel fuel and the test was conducted at full and part load conditions and various speeds of 1000 to
4000 rpm with 500 rpm intervals. Parameters such as BT, BP, BSFC and fuel flow rate were recorded using a computer
and data logger. The engine was flushed with fossil diesel after every fuel changing and run for 20 minutes to insure
complete consumption of the pervious sample. The experiment was repeated three times to insure stable reading of
performance values. The emissions such as NOx, CO, EGT, O2 and CO2 were measured using VARIO Plus Industrial
exhaust gas analyser following the EN 50379-2 standard. The repeated measured data for each blend were averaged prior
to using them for analysis and discussion.
Table 4: Engine specifications
Engine Diesel engine Model XLD 418D
Type 4 stroke
Rated BT 110 Nm at 2500 rpm
Rated BP 44 kW at 4800 rpm
Cylinder number 4 in line
Engine design OHC
Engine cooling water cooling pressurized circulation
Combustion IDI, natural aspirated
Bore × stroke 82.5×82 mm
Displacement 1753 cc
Compression ratio 21.5:1
Test1
diesel
Test2
B10
Eddy current
dynamometer
ECU
Gas analyzer
Control valve
Engine
control PC
Signal
amplifier
Data
acquisition Data processing PC
Exhaust
Diesel engine
Pressure transducer
Angle encoder
Drain line
Fuel filter Flowmeter
Test3
B20
Figure 1: Schematic diagram of engine testing
2.6 Response surface methodology
In complex variables processes, conducting many experiments would be time consuming and expensive. It is essential
to have a well-designed experimental plan in order to capture more information from fewer experiments compared to the
conventional methods (one factor at a time). RSM is a statistical and mathematical tool useful for analysing, modelling,
optimizing and determining the interactions between the variables and responses. The aim is to build models, evaluate
the effects of variables and establish the optimum performance conditions by means of experimental design and
regression analysis. In the RSM the relationship between the responses and variables is presented by Equation (1).

Asian Journal of Applied Sciences (ISSN: 2321 – 0893)
Volume 04 – Issue 02, April 2016
Asian Online Journals (www.ajouronline.com) 405
1 2 3( , , ....... )ny f x x x x (1)
where y is the dependent variable, ƒ is the response function, xi are the independent variables and ε is the fitting error
[42]. In this study, the design involved the selection of variables that influence the emissions and performance of diesel
engines such as engine load and speed, and fuel blend ratio. The variables were set at three levels and presented as in
Table 5, with five center points and two replication points using Box-Behnken design (BBD) based RSM. The total
experimental runs were 34 as shown in Supplementary 3. The experiments were conducted prior to the plan design and
the data collected was loaded into the Design Expert version 8.0.6 software. The reason for the selecting of BBD was
because of the need for less experimental runs compared to the CCD (Central Composite Design). More so, BBD
generates a combination of experiments within the upper and lower limit of input variables, unlike the CCD that
generates axial points and usually lies outside the limit range which may be outside the controllable range or safety
working limits [43].
Table 5: Factors parameters
Variables Symbols Levels
Lower mean Upper Blend (vol. %) A 0 20 40
Speed (rpm) B 1000 2500 4000
Load (%) C 40 70 100
2.7 Desirability based optimization study
An optimization study was carried out using the RSM. The responses were transformed to a dimensionless desirability
value (d) ranging from 0 to 1. The value of d= 0 suggests that the response is unacceptable, whereas the value of d= 1
suggests that the response is desirable [23]. The goal of each response can be either minimum, maximum, target, in the
range and/ or equal depending on the nature of the problem [22]. The desirability value of each goal was calculated using
the following Equations (2)- (5) [22]. For minimum goal, di =1 when Yi ≤ Lowi; di = 0 when Yi ≥ Highi ; and
i
i i
i i
wtHigh -Y
i High -Lowd =
when Lowi < iY < Highi (2)
For maximum goal, di = 0 when Yi ≤ Lowi; di =1 when Yi ≥ Highi and
i
i i
i i
wtY -Low
i High -Lowd =
when Lowi < iY < Highi (3)
For target goal di = 0 when Yi < Lowi; Yi > Highi
iwt1
id = i i
i i
Y Low
T Low
when Lowi < iY < Ti (4)
i
i i
i i
wt2Y - High
i T - Highd =
when Ti < iY < Highi ; and (5)
For a goal within the range di = 1 when Lowi < Yi< Highi; and di = 0. where i indicates the response, Y is the response
value, Low is the lower limit value, High is the higher limit value, T is the target value and wt. is the response weight.
The weight value was in the range of 0 to 10. Weight values >1 give more emphasis to the goal, whereas weight values <
1 give less emphasis [22]. At the weight value equals to one, the desirability function varies linearly. In a multi response
optimization based desirability approach, multiple responses are combined in a dimensionless overall desirability
function, D (0 ≤ D ≤ 1) and calculated using Equation (6).
1
rin ri
i=1 iD= d
(6)
In the overall desirability function (D), each response is assigned an importance (r) with respect to other responses.
The importance varies from the least important value (1) indicated by (+) and most important value (5) indicated by
(+++++). A high value of D indicates more desirable value and is considered as the optimum solution. The optimum
values of factors are determined from the individual desired function (d) that maximizes D [23, 24].

Asian Journal of Applied Sciences (ISSN: 2321 – 0893)
Volume 04 – Issue 02, April 2016
Asian Online Journals (www.ajouronline.com) 406
3. RESULTS AND DISSCUSSION
3.1 Effects of catalyst, oil to alcohol ratio, reaction time and temperature on fame yield
The parametric effects such as reaction temperature, time, catalyst and oil to alcohol ratio on FAME conversion based
transesterification are presented in Figure 2(a-d). It was observed that by increasing the alcohol to oil ratio and catalyst,
the FAME yield decreased as shown in Figures 2(a), 2(b) and 2(c). The reason behind is due to the saponification
reaction resulting in poor product separation and high glycerol formation [44]. Also, it was noticed that the first 25-30
minutes of reaction time were enough to achieve the maximum amount of FAME yield, whereas the FAME conversion
rate increased as the reaction temperature increased and promoted reaction towards the product side as presented in
Figures 2(b) and 2(d) [45]. Junaid et al. [13] claimed that increasing the alcohol amount increases the ester content to a
certain limit before it decreases as the alcohol ratio increases, whereas the higher amount of methanol ratio hinders the
glycerol separation, hence lowers the FAME yield.
Figure 2: Surface plot of biodiesel conversion, (a) FAME yield verses catalyst amount and alcohol to oil molar ratio,
(b) FAME yield verses reaction time and reaction temperature, (c) FAME yield verses reaction time and catalyst amount
and (d) FAME yield verses reaction temperature and alcohol to oil molar ratio
3.2 ANOVA (analysis of variance) study for the transesterification process
The significance of transesterification output response was statistically studied using the ANOVA test and presented
in Supplementary 4. The model was assumed to be significant if the p value was less than 0.05 at 95% confidence level
[46]. Data fitting goodness was expressed in terms of the determination coefficient (R2) and goodness of prediction
(adjusted-R2) [42]. The influence of oil molar ratio to alcohol, reaction temperature, time and catalyst ratio on FAME
conversion were measured using the F-value [13]. The higher the F values of the variables, the higher their influence, as
shown in Supplementary 4. In this study, B (catalyst) and D (reaction time) were found to be the most influencing

Asian Journal of Applied Sciences (ISSN: 2321 – 0893)
Volume 04 – Issue 02, April 2016
Asian Online Journals (www.ajouronline.com) 407
variables compared to A (alcohol to oil ratio) and C (reaction temperature) as shown in Figure 3(a) as elucidated by
Rashid et al. [47]. Thus, the steepest factor is the most influencing compared to others [48]. However, Junaid et al. [13]
reported that the catalyst amount and alcohol to oil ratio were the most influencing factors compared to the reaction time
and temperature. The predicted trends agreed well with the experimental results suggesting that the model can predicted
the performance responses accurately as shown in Figure 3(b). The points are close towards the centre linear line. From
the regression analysis, a response equation was produced in terms of the actual and the coded terms. The second order
coded polynomial equation in terms of the most influencing variables on yield is given by Equation (7).
2 2FAME yield = +88.86- 6.18B+ 5.05D- 4.61B -4.93D +9.66AB- 5.59AC (7)
Figure 3: Perturbation plot (a) and transesterification predicted vs. actual FAME conversion (b).
3.3 Engine performance model analysis
The models studied were based on the ANOVA that provides numerical information for the p values. The regression
model coefficients with p-value of 0.05 or higher is considered as an insignificant term for the model [22]. The p-values
for different responses such as BT, BP, BTE, CO, CO2, NOx, EGT and O2 are presented in Table 6. The insignificance of
input factors over the output responses as the p value is greater than 0.05 is shown by the bold Time New Roman 10
point font. Using the regression coefficients, a second order polynomial models are developed in terms of the coded
factors. The full second order polynomial function equations that contained all input variables are presented in Equations
(8)- (16).
Table 6: ANOVA analysis of various responses indicating the p values
Source Torque Power BSFC BTE CO CO2 NOx EGT O2 Model <0.0001 <0.0001 <0.0001 <0.0001 <0.0001 <0.0001 <0.0001 <0.0001 <0.0001
A 0.2472 0.0259 0.0128 0.0754 0.0183 0.0294 0.9885 0.2545 0.7733
B 0.3022 <0.0001 <0.0001 <0.0001 <0.0001 <0.0001 <0.0001 <0.0001 0.5185
C <0.0001 <0.0001 <0.0001 0.0022 <0.0001 <0.0001 <0.0001 <0.0001 <0.0001
AB 0.9265 0.2192 0.0541 0.0937 0.7206 0.0004 0.3261 0.3652 0.0369
AC 0.4098 0.2192 0.6666 0.7728 0.0087 0.4200 0.4828 <0.0001 0.0845
BC 0.9265 <0.0001 <0.0001 0.2477 <0.0001 0.4200 0.0111 <0.0001 0.8785
A2 0.0068 0.0589 0.0106 0.2859 <0.0001 <0.0001 <0.0001 0.0583
B2 0.0045 0.0014 <0.0001 <0.0001 <0.0001 <0.0001 0.2042 0.0191
C2 0.0004 0.0002 <0.0001 <0.0001 0.0001 <0.0001 0.0001 0.0007
2 2 2
BT=70.10-1.12A+1.00B+25.13C+0.12AB-1.13AC-0.12BC
+3.89A 4.11B -5.36C- (8)

Asian Journal of Applied Sciences (ISSN: 2321 – 0893)
Volume 04 – Issue 02, April 2016
Asian Online Journals (www.ajouronline.com) 408
2 2 2
BP =18.60-0.50A+10.44B+6.56C-0.38AB-0.38AC+3.50BC
+0.58A 1.05B -1.30C- (9)
2 2 2
BSFC = 271.80+19.63A-80.19B-57.44C-22.25AB+5.50AC+52.88BC
-28.59A +123.54B +54.29C (10)
2 2 2
BTE = 30.17-0.75A+3.76B+1.39C+1.00AB-0.17AC-0.68BC
+0.61A -6.67B -3.72C (11)
2 2 2
CO = 302.00-78.13A-331.50B+629 C+15.75AB-124.75AC-254.50BC
+323.62A +224.88B +197.63C (12)
2
2 2 2
CO =10.00-0.25A+1.00B+2.63C-0.63AB-0.12AC+0.12BC
+0.81A +1.31B -0.94C (13)
xNO = 440.00+0.13A+120.75B-74.63C-12.13AB+8.62AC+33.13BC (14)
2 2 2
EGT = 298.20+2.13A+104.06B+46.06C+2.37AB+27.13AC+28BC
+24.65A +3.27B -11.47C (15)
2
2 2 2
O =7.98+0.050A-0.11B-3.38C-0.54AB-0.44AC+0.037BC
-0.47A -0.60B +0.93C (16)
3.4 Model evaluation
In order to validate the developed models, fitting test, data regression, significance analysis and individual model
coefficients were studied and presented in Table 7. The quality of the fitted polynomial function models was expressed
by the determination of coefficient R2 that represents the proportion of variability of the response as a result of the input
variables. However, as the model variables number increases, the determination coefficient (R2) increases. Hence, it is
recommended to use the adjusted- R2, that decreases if unnecessary terms are added to the model [42]. In this study, R
2
and adjusted- R2
were found to be close to each other, indicating low chances for a none significant terms to be included
in the model [22]. On the other hand, lower values of CV (coefficient of variation) were observed suggesting a better
precision and reliability of the experiments studied. In general, the model is assumed to be reasonably reproducible if its
CV value is not greater than 10% [48]. The adequate precision value is a measure of the signal to the noise ratio of the
response. A ratio greater than four indicates adequate model discrimination [49]. In this study, the response adequate
precision was higher than four in all cases.
Table 7: Response surface model evaluation
Model BT BP BSFC BTE CO CO2 NOx EGT O2 Mean 67.47 17.76 342.03 25.57 653.12 10.56 440 305.94 7.91
Std. Dev. 3.79 0.84 44.74 1.62 123.04 0.43 34.26 7.27 0.69
CV 5.62 4.73 13.08 6.34 18.84 4.08 7.79 2.38 8.67
Model dgr. Quadratic 2FI Quadratic
R2 0.969 0.994 0.884 0.929 0.968 0.974 0.916 0.995 0.948
Adj. R2 0.958 0.991 0.839 0.902 0.956 0.963 0.897 0.993 0.928
Pred. R2 0.929 0.986 0.679 0.829 0.911 0.941 0.827 0.985 0.855
Adeq Prec 29.19 71.93 17.15 17.64 27.46 30.80 23.57 72.75 19.88
3.5 Effects of fuel blend ratio and load
The effects of blend combustion and engine load on the performance and emissions are depicted in Figure 4(a-h). By
increasing the blend ratio of biodiesel to diesel up to 40%, the BT, BP, BTE and CO were reduced by 1.6%, 1.4%, 1.5%
and 6.7% respectively. Whereas the BSFC, CO2, NOx, EGT and O2 increased by 1.7%, 1.1%, 1.2%, 1.3% and 1.2 %
respectively as compared to the diesel fuel. This is due to the higher density, viscosity and surface tension, and lower
heating values of the blend increasing the injected fuel amount [50]. This is turn increases the BSFC and decreases the
BT, BP and BTE as a result of atomization and combustion deterioration [25, 51]. The reduction of CO is attributed to
the decrease of air-fuel equivalence ratio due to an increase in BSFC. An increase in CO2, EGT, NOx and O2 can be
explained from the oxygen content, poor volatile constituent of the fuel and the change of air-fuel equivalence ratio. The

Asian Journal of Applied Sciences (ISSN: 2321 – 0893)
Volume 04 – Issue 02, April 2016
Asian Online Journals (www.ajouronline.com) 409
oxygen content in the biodiesel fuel contributed to the hydrocarbon oxidation and resulted in complete combustion,
leading to higher CO2 emission. On the other hand, an increase in EGT and NOx is attributed to the poor volatile
constitutes in the biodiesel fuel, which led to a continuous burning until the late combustion phase [27, 51]. Similarly, the
change in the air- fuel equivalence ratio as a consequence of higher BSFC advanced the premixed combustion phase and
increased the combustion pressure and temperature, resulting in an increase in NOx and EGT. O2 emission also increased
as the biodiesel percentage increased due to the presence of the chemically bound oxygen in the biodiesel. Hence, more
O2 emission is expected in the exhaust compared to the diesel fuel [52]. The responses of ANOVA in Table 6 indicates
the significance of the blend and load individually. However, their interactive effects are found to be insignificant except
for CO and EGT as the values of p is less than 0.05 [23].

Asian Journal of Applied Sciences (ISSN: 2321 – 0893)
Volume 04 – Issue 02, April 2016
Asian Online Journals (www.ajouronline.com) 410
Figure 4: Interactive effect of blend and load (a) BT verses fuel blend and engine load, (b) BP verses engine load
and fuel blend, (c) BSFC verses fuel blend and engine load, (d) BTE verses fuel blend and engine load, (e) CO
verses engine load and fuel blend, (f) CO2 verses engine load and fuel blend, (g) EGT verses engine load and fuel
blend and (f) O2 verses fuel blend and engine load.
3.6 Effects of engine load and speed
The combined effects of engine speed and engine load on BT, BP, BSFC, BTE, CO, CO2, NOx, EGT and O2 are
shown in Figure 5 (a-h). As the engine speed increased from 1000 rpm to 2500 rpm, there was a reduction in the BSFC
and CO with an increase in the BT, BP, BTE, CO2, NOx, EGT and O2 which is in agreement with [52]. However,
beyond 2500 rpm, an opposite trend was noticed for the responses. More so, lower BSFC and CO, and higher BT and
BTE were observed at 2500 rpm. As the engine load increased, the BT, BP, BTE, CO, CO2 and EGT increased while the
BSFC and O2 decreased. Although the engine load and speed were found to have strong effects on the emissions and
performance characteristics individually, their combined effects were found to be insignificant except for the BP, BSFC,
CO, NOx and EGT as shown in Table 6 with the p values greater than 0.05 (95% confident level). This was in agreement
with the findings of Bhattacharya et al. [21]. Ganapathy et al. [53] investigated the effects of engine speed and load using
Jatropha biodiesel and found strong effect of engine speed and load on the BSFC, BTE, CO, THC and NO individually,
however their interaction effects were found to be insignificant except on BSFC.

Asian Journal of Applied Sciences (ISSN: 2321 – 0893)
Volume 04 – Issue 02, April 2016
Asian Online Journals (www.ajouronline.com) 411

Asian Journal of Applied Sciences (ISSN: 2321 – 0893)
Volume 04 – Issue 02, April 2016
Asian Online Journals (www.ajouronline.com) 412
Figure 5: Interactive effect of load and speed, (a) BT verses engine load and speed, (b) BP verses engine load and
speed, (c) BSFC verses engine speed and load, (e) CO verses engine load and speed, (f) CO2 verses engine speed
and load, (g) EGT verses engine load and speed and (h) O2 verses engine speed and load.
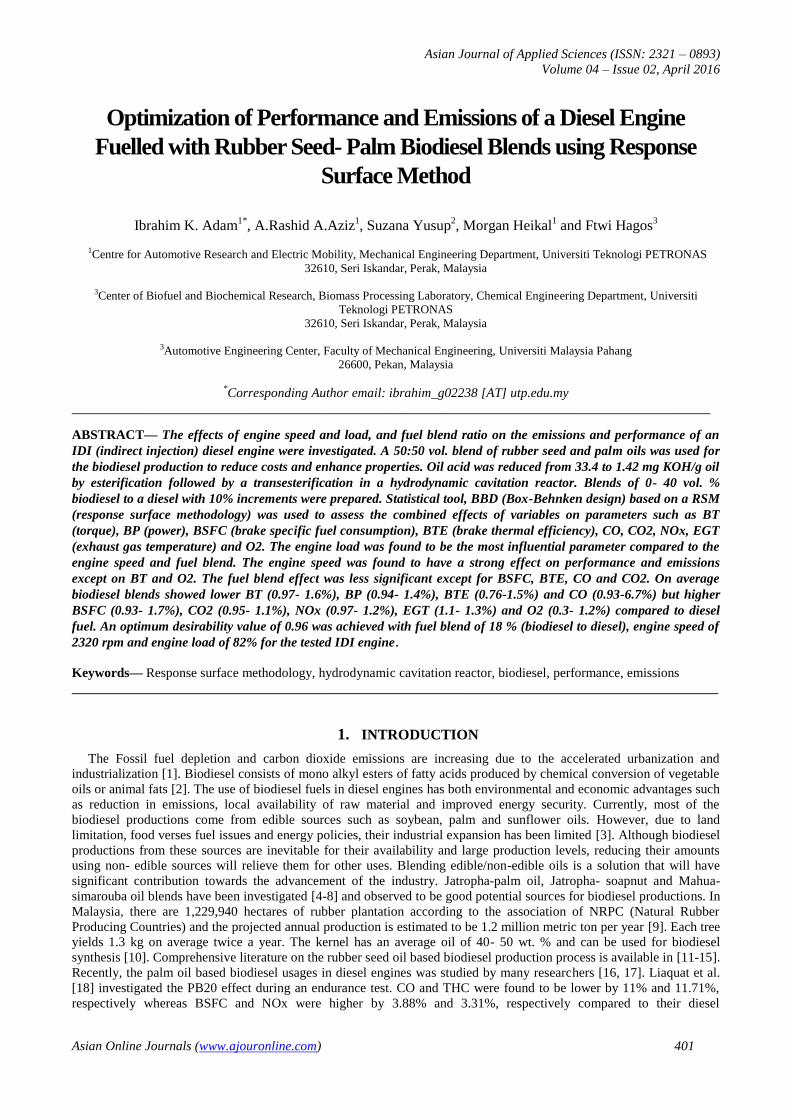
3.7 Effects of engine speed and blend ratio
The effects of the fuel blend ratio and the engine speed on the performance and emissions parameters such as BT, BP,
BSFC, BTE, CO, CO2, EGT and NOx are shown in Figure 6 (a-h). It can be seen that increasing the engine speed from
1000- 4000 rpm and the fuel blend ratio from 0- 40% reduced the BT, BP, BTE, and increased the BSFC, CO and EGT.
The reduction in the BT, BP and BTE is attributed to the biodiesel heating value which is 9.6% lower compared to the
diesel fuel, higher density and higher viscosity [50]. With reference to the effects of fuel blend ratio and engine speed, the
discussion in Sections 3.5 and 3.6 could be used for the stated results. The ANOVA for the responses in Table 6,
indicates that both engine speed and fuel blend ratio have significant effects on the responses, however, their combined
effects are insignificant over all responses except on the CO2 and O2. This is in agreement with results reported by [54,
55], who claimed insignificant combination effects of CO, O2, CO2 and NOx when a methyl tallow blended diesel fuel
was used. Ali et al. [56] also claimed that the fuel blend ratio and engine speed had significant effects on the BT, BP,
BSFC, CO, THC and NOx except CO2 individually, while there was no interaction effect between the fuel blend ratio and
engine speed over the responses being observed.
Asian Journal of Applied Sciences (ISSN: 2321 – 0893)
Volume 04 – Issue 02, April 2016
Asian Online Journals (www.ajouronline.com) 413
Figure 6: Interactive effect of engine speed and fuel blend ratio (a) BT verses fuel blend and engine speed, (b) BP verses
fuel blend ratio and engine speed, (c) BSFC verses engine speed and fuel blend ratio, (d) BTE verses engine speed and
fuel blend ratio, (e) CO verses fuel blend ratio and engine speed, (f) CO2 verses fuel blend ratio and engine speed, (g)
EGT verses fuel blend ratio and engine speed and (h) NOx verses engine speed and fuel blend ratio.

Asian Journal of Applied Sciences (ISSN: 2321 – 0893)
Volume 04 – Issue 02, April 2016
Asian Online Journals (www.ajouronline.com) 414
3.8 Validation of optimization results
The used optimization criteria such as the lower and upper limits, weight, response goal set and importance of each factor
are presented in Supplementary 5. In the optimization based desirability approach, the solution with high desirability is
preferred [22, 23]. A maximum desirability of 0.96 is obtained at a fuel blend ratio of 18%, engine speed of 2320 rpm
and engine load of 82% which can be considered as the optimum parameters for the tested IDI engine which has rated
speed of 2500 rpm, maximum BT of 110 Nm and maximum BP of 44 kW at 4800 rpm. In order to validate the optimized
results, another set of experiments was conducted. The actual data of each response was averaged and presented in Table
8. The validation results are considered to be accurate as the predicted values are in a good agreement with the actual
values. Moreover, the obtained results are compared with previous optimized studies [23, 53, 57] and found to be in a
good agreement.
Table 8: Optimum performance and emissions validation and comparison with previous studies.
Parameters
This study Sivaramakrishnan
and Ravikumar [23]
Jagannath et al.
[57]
Ganapathy et al.
[53]
Values Values Values Values Predicted Actual % error Predicted Actual Predicted Actual Predicted Actual
Blend (%) 18 18 - 10 10 20 20 -
0.1-2%
mean
errors
Speed(rpm) 2320 2320 - - - - - 1801
Load (%) 82 82 - 3.81 3.81 3.5 3.5 11.43
CR - - - 17.9 17.9 16 16 -
BT (Nm) 81 80 -1.2 - - - - -
BP(kW) 20 20 - - - -
BSFC(g/kWhr) 263 264 0.37 271.8 278.3 301 303 287.5
BTE (%) 30 30 - 33.65 33.24 27.1 26.8 30.96
CO (ppm) 665 675 1.48 - - 76
CO2 (%) 11 11 - - - - - -
THC (ppm) - - - 158.03 156.86 - - 5.27
NOx (ppm) 393 391 -0.51 938.3 940.45 321.69
EGT (°C) 300 297 -1.01 - - 250 252 -
O2 (%) 7 7.1 1.3 - - - - -
4. CONCLUSION
In this study, the rubber seed/palm oil biodiesel synthesis was analysed. The methyl ester produced form the blend of
the two oils was characterized and found to be in a good agreement with the ASTM and EN standards. In addition, the
effect of the obtained methyl ester blended diesel on the emissions and performance of IDI engine was investigated.
Increasing the engine speed and the engine load was found to increase the BT, BP, BTE, CO2, NOx and EGT and to
decrease the BSFC and O2. However, increasing the fuel blend ratio had an opposite trend to the engine load and engine
speed. On average, biodiesel blends produced lower BT (0.97- 1.6%), BP (0.94- 1.4%), BTE (0.76- 1.5%) and CO (0.93-
6.7%), but higher BSFC (0.93- 1.7%), CO2 (0.95- 1.1%), NOx (0.97- 1.2%), EGT (1.1-1.3%) and O2 (0.3- 1.2 %) at full
load compared to the diesel fuel. At part engine load, performance and emissions were found to be slightly different but
the differences were relatively small and could be considered. Compared to the engine speed and fuel blend, engine load
was found to be the most influential variable individually and in combination with other variables. A higher desirability
of 0.96 was obtained at an engine load of 82%, engine speed of 2320 rpm and fuel blend ratio of 18%, where the values
of BT, BP, BSFC, BTE, CO, CO2, NOx, EGT and O2 are found to be 81 Nm, 20 kW, 263 g/kWh, 30%, 665 ppm, 11%,
393 ppm, 300°C and 7% respectively. In conclusion rubber seed/ palm oil mixture can be considered as a potential
source for biodiesel production and a fuel blend ratio of 18% is optimum for the tested IDI engine with this biodiesel.
5. ACKNOWLEDGEMENT
The research was conducted under MyRA Grant (No. 0153AB- J19). The authors would like to thank the Universiti
Teknologi PETRONAS for the Graduate Assistantship Scheme (GA), Ministry of Higher Education and Scientific
Research Republic of Sudan and Blue Nile University for their supports.
ABBREVIATIONS
RSM: Response surface methodology
IDI: Indirect injection diesel engine
BBD: Box- Behnken design
RSM: Response surface methodology
BT: Brake torque
BP: Brake power

Asian Journal of Applied Sciences (ISSN: 2321 – 0893)
Volume 04 – Issue 02, April 2016
Asian Online Journals (www.ajouronline.com) 415
BSFC: Brake specific fuel
consumption
BTE: Brake thermal efficiency
CO: Carbon monoxide
CO2: Carbon dioxide
NOx: Oxides of nitrogen
EGT: Exhaust gas temperature
O2: Oxygen
THC: Total hydrocarbon
IT: Injection timing
IP: Injection pressure
DoE: Design of experiments
ANN: Artifical neural network
BTDC: Before top dead center
ID: Direct injection diesel engine
JB: Jatropha methyl ester
MB: Moringa oleifera methyl ester
PB: Palm oil biodiesel
PBJB: Palm- jatropha combined
biodiesel
CIB: Calophyllum inophyllum
biodiesel
RB: Rapeseed methyl ester
HB: Hazelnut methyl ester
SB: Soybean biodiesel
CB: Coconut biodiesel
WSB: Waste sunflower oil biodiesel
CAB: Canola biodiesel
PPB: Pongamia pinnata methyl ester
MOB: Mustard oil biodiesel
KB: Karajan biodiesel
POB: Polanga oil biodiesel
WCB: Waste cooking oil biodiesel
SOB: Sunflower oil biodiesel
CSB: Cotton seed oil biodiesel
AOCS: American Oil Chemistry
Society
HC: hydrodynamic cavitation reactor
B10%: 90% diesel +10% biodiesel
B20%: 80% diesel +20% biodiesel
B40%: 60% diesel + 40% biodiesel
ASTM: American society for testing
and material
EN: European standard
ECU: Engine control unit
CCD: Central composite design
ANOVA: Analysis of variance
R2: Determination coefficient
R2adj: Adjusted coefficient
CV: Coefficient of variation

Asian Journal of Applied Sciences (ISSN: 2321 – 0893)
Volume 04 – Issue 02, April 2016
Asian Online Journals (www.ajouronline.com) 416
6. REFERENCES
[1] Ahmed, K.N., el Dessouky, H. Prospect of biodiesel in Pakistan, Renewable and Sustainable Energy Reviews, 2009. 13: pp.
1576–1583.
[2] Adam, I.K., A.Aziz, A.R., Yusuf, S. Effect of Rubber Seed Oil and Palm Oil Biodiesel Diesel Blends on Diesel Engine
Emission and Combustion Characteristics, Applied Mechanics and Materials, 2014. 695: pp. 323-327.
[3] Wendy, N., Pei Qin, Hon Loong, L., Yusup, S. Supply network synthesis on rubber seed oil utilisation as potential biofuel
feedstock, Energy, 2013. 55: pp. 82-88.
[4] Sarin, R., Sharma, M., Sinharay, S., Malhotra, R.K. Jatropha – Palm biodiesel blends : An optimum mix for Asia, Fuel,
2007. 86: pp. 1365-1371.
[5] Amit, S., Arora, R., Singh, N.P., Sarin, R., Malhotra, R.K., Kundu, K. Effect of blends of Palm-Jatropha-Pongamia
biodiesels on cloud point and pour point, Energy, 2009. 34: pp. 2016-2021.
[6] Amit, S., Arora, R., Singh, N.P., Sarin, R., Malhotra, R.K. Blends of biodiesels synthesized from non-edible and edible oils:
Influence on the OS (oxidation stability), Energy, 2010. 35 (8): pp. 3449-3453.
[7] Jena, R.H., Jadav, P.C., Snehal, S. Performance of a diesel engine with blends of biodiesel ( from a mixture of oils ) and
high-speed diesel, International Journal of Energy and Environmental Engineering, 2013. 4 (1): pp. 1-1.
[8] Yi, C.H., Han, C.T., Hong, C.J. An optimum biodiesel combination: Jatropha and soapnut oil biodiesel blends, Fuel, 2012.
92 (1): pp. 377-380.
[9] Eka, H.D., Tajul, A.Y., Wan, N., W. A. Potential use of Malaysian rubber (Hevea brasiliensis) seed as food, feed and biofue,
International Food Research Journal 2010. 17: pp. 527-534.
[10] Ashraful, A.M., Masjuki, H.H., Kalam, M.A., Rizwanul Fattah, I.M., Imtenan, S., Shahir, S.A., et al. Production and
comparison of fuel properties, engine performance, and emission characteristics of biodiesel from various non-edible
vegetable oils: A review, Energy Conversion and Management, 2014. 80: pp. 202–228.
[11] Ramadhas, A.S., Jayaraj, S., Muraleedharan, C. Biodiesel production from high FFA rubber seed oil, Fuel, 2005. 84: pp.
335-340.
[12] Yang, R., Su, M., Zhang, J., Jin, F., Zha, C., Li, M., et al. Biodiesel production from rubber seed oil using poly ( sodium
acrylate ) supporting NaOH as a water-resistant catalyst, Bioresource Technology, 2011. 102: pp. 2665-2671.
[13] Ahmad, J., Yusup, S., Bokhari, A., Nik Mohammad Kamil, R. Study of fuel properties of rubber seed oil based biodiesel,
Energy Conversion and Management, 2014. 78: pp. 266–275.
[14] Morshed, M., Ferdous, K., Khan R., M., Mazumder, M.S.I., Islam, M.A., Uddin, M.T. Rubber seed oil as a potential source
for biodiesel production in Bangladesh, Fuel 2011. 90: pp. 2981–2986.
[15] Ramadhas, A.S., Jayaraj, S., Muraleedharan, C. Characterization and effect of using rubber seed oil as fuel in the
compression ignition engines, Renewable Energy, 2005. 30: pp. 795-803.
[16] Nagaraja, S., Sakthivel, M., Sudhakaran, R. Combustion and performance analysis of variable compression ratio engine
fueled with preheated palm oil-diesel blends, Indian Journal of Chemical Technology, 2013. 20 (3): pp. 189-194.
[17] Necati, O.A., Mustafa, C., Turkcan, A., Sayin, C. Performance and combustion characteristics of a DI diesel engine fueled
with waste palm oil and canola oil methyl esters, Fuel, 2009. 88 (4): pp. 629-636.
[18] Liaquat, A.M., Masjuki, H.H., Kalam, M.A., Fazal, M.A., Khan, A.F., Fayaz, H., et al. Impact of palm biodiesel blend on
injector deposit formation, Applied Energy, 2013. 111: pp. 882-893.
[19] Satyanarayana, M., Muraleedharan, C. Investigations on Performance and Emission Characteristics of Vegetable Oil
Biodiesels as Fuels in a Single Cylinder Direct Injection Diesel Engine, Energy Sources Part A-Recovery Utilization and
Environmental Effects, 2012. 34 (1-4): pp. 177-186.
[20] Haas, M.J., Scott, K.M., Alleman, T., L., McCormick, R.L. Engine Performance of Biodiesel Fuel Prepared from Soybean
Soapstock: A High Quality Renewable Fuel Produced from a Waste Feedstock, Energy & Fuels, 2001. 15: pp. 1207-1212.
[21] Bhattacharya, M., Jain, S.C., Gakkhar, R.P., Win, Z. Parameter optimization of a diesel engine to reduce noise, fuel
consumption, and exhaust emissions using response surface methodology, Proceedings of the Institution of Mechanical
Engineers, Part D: Journal of Automobile Engineering, 2005. 219 (10): pp. 1181-1192.
[22] Pandian, M., Sivapirakasam, S.P., Udayakumar, M. Investigation on the effect of injection system parameters on
performance and emission characteristics of a twin cylinder compression ignition direct injection engine fuelled with
pongamia biodiesel–diesel blend using response surface methodology, Applied Energy, 2011. 88: pp. 2663–2676.
[23] Sivaramakrishnan, K., Ravikumar, P. Optimization of operational parameters on performance and emissions of a diesel
engine using biodiesel, Int. J. Environ. Sci. Technol., 2014. 11: pp. 949–958.
[24] Hirkude, J.B., Padalkar, A.S. Performance optimization of CI engine fuelled with waste fried oil methyl ester-diesel blend
using response surface methodology, Fuel, 2014. 199: pp. 266–273.
[25] Rahman, M., Md.,, Hassan, M., Hj., Abul Kalam, M., Atabani, A., Emad, Memon, L., Ali , Rahman, A.S.M. Performance
and emission analysis of Jatropha curcas and Moringa oleifera methyl ester fuel blends in a multi-cylinder diesel engine,
Journal of Cleaner Production, 2014. 65: pp. 304-310.
[26] Sanjid, A., Hassan, M.H., Kalam, M.A., Rahman, A.S.M., Abedin, M.J., Palash, S.M. Production of palm and jatropha
based biodiesel and investigation of palm-jatropha combined blend properties, performance, exhaust emission and noise in
an unmodified diesel engine, Journal of Cleaner Production, 2014. 65: pp. 295-303.

Asian Journal of Applied Sciences (ISSN: 2321 – 0893)
Volume 04 – Issue 02, April 2016
Asian Online Journals (www.ajouronline.com) 417
[27] Ashrafur, R., S. M. , Hassan, M., H. , Kalam, M.A., Abedin, M.J., Sanjid, A., Sajjad, H. Production of palm and
Calophyllum inophyllum based biodiesel and investigation of blend performance and exhaust emission in an unmodified
diesel engine at high idling conditions, Energy Conversion and Management, 2013. 76: pp. 362-367.
[28] Çelikten, I., Mutlu, E., Solmaz, H. Variation of performance and emission characteristics of a diesel engine fueled with
diesel, rapeseed oil and hazelnut oil methyl ester blends, Renewable Energy, 2012. 48: pp. 122- 126.
[29] Çelikten, I., Koca, A., Arslan, A.M. Comparison of performance and emissions of diesel fuel, rapeseed and soybean oil
methyl esters injected at different pressures, Renewable Energy 2010. 35: pp. 814– 820.
[30] Habibullah, M., Masjuki, H.H., Kalam, M.A., Fattah, I.M.R., Ashraful, A.M., Mobarak, H.M. Biodiesel production and
performance evaluation of coconut, palm and their combined blend with diesel in a single-cylinder diesel engine, Energy
Conversion and Management, 2014. 87: pp. 250–257.
[31] Arbab, M.I., Varman, M., Masjuki, H.H., Kalam, M.A., Imtenan, S., Sajjad, H., et al. Evaluation of combustion,
performance, and emissions of optimum palm–coconut blend in turbocharged and non-turbocharged conditions of a diesel
engine, Energy Conversion and Management, 2015. 90: pp. 111–120.
[32] Usta, N., Ozturk, E., Can, O., Conkur, E.S., Nas, S., Con, A.H., et al. Combustion of biodiesel fuel produced from hazelnut
soapstock/waste sunflower oil mixture in a Diesel engine, Energy Conversion and Management, 2005. 46 (5): pp. 741-755.
[33] Öztürk, E. Performance, emissions, combustion and injection characteristics of a diesel engine fuelled with canola oil–
hazelnut soapstock biodiesel mixture, Fuel Processing Technology, 2015. 129: pp. 183-191.
[34] Mustafa, O., Hasan, S. Evaluation of soybean/canola/palm biodiesel mixture as an alternative diesel fuel, Journal of
Scientific & Industrial Research, 2011. 70 (6): pp. 466-470.
[35] Srithar, K., Arun, B., K , Pavendan, V., Ashok, K., B Experimental investigations on mixing of two biodiesels blended with
diesel as alternative fuel for diesel engines, Journal of King Saud University-Engineering Sciences, 2014. pp.
[36] Sahoo, P.K., Das, L.M. Combustion analysis of Jatropha, Karanja and Polanga based biodiesel as fuel in a diesel engine,
Fuel, 2009. 88 pp. 994–999.
[37] Süreyya, K.M., Heri, E., Utlu, Z. Experimental Study of Emission Parameters of Biodiesel Fuels Obtained from Canola ,
Hazelnut , and Waste Cooking Oils, Energy &fuel, 2007. 21: pp. 3622-3626.
[38] Rakopoulos, C.D., Rakopoulos, D.C., Hountalas, D.T., Giakoumis, E.G., Andritsakis, E.C. Performance and emissions of
bus engine using blends of diesel fuel with bio-diesel of sunflower or cottonseed oils derived from Greek feedstock, Fuel,
2008. 87: pp. 147-157.
[39] Firestone, D. Offical methods and recommended practices of the AOCS, American Oil Chemists Society 1998. pp.
[40] Chuah, L.F., Aziz, A.R.A., Yusup, S., Bokhari, A., Klemeš, J.J., Abdullah, M.Z. Performance and emission of diesel engine
fuelled by waste cooking oil methyl ester derived from palm olein using hydrodynamic cavitation, Clean Technologies and
Environmental Policy, 2015. pp. 1-13.
[41] Yusup, S., Khan, M.A., Ahmad, M.M. Acid esterification of a high free fatty acid crude palm oil and crude rubber seed oil
blend : Optimization and parametric analysis, biomass and bioenergy, 2010. 4: pp. 3-8.
[42] Bas, D., Boyacı, I.H. Modeling and optimization I: Usability of response surface methodology, Journal of Food Engineering
2007. 78: pp. 836–845.
[43] Bezerraa, M.A., Santelli, R.E., Oliveira, E.P., Villar, L.S., Escaleira, L., Am´elia. Response surface methodology (RSM) as
a tool for optimization in analytical chemistry, Talanta, 2008. 76: pp. 965–977.
[44] Yusup, S., Bokhari, A., Lai Fatt, C., Ahmad, J. Pre-Blended Methyl Esters Production from Crude Palm and Rubber Seed
Oil Via Hydrodynamic Cavitation Reactor, CHEMICAL ENGINEERING TRANSACTIONS, 2015. 43: pp. 517-522.
[45] Bokhari, A., Yusup, S., Nik M. Kamil, R., Ahmad, J. Blending Study of Palm Oil Methyl Esters with Rubber Seed Oil
Methyl Esters to Improve Biodiesel Blending Properties, CHEMICAL ENGINEERING TRANSACTIONS, 2014. 37: pp.
[46] Abuhabaya, A., Fieldhouse , J., Brown, D. The effects of using biodiesel on CI (compression ignition) engine and
optimization of its production by using response surface methodology, Energy, 2013. 59: pp. 56-62.
[47] Umer, R., Farooq, A., Muhammad, A., Muhammad, S., Yusup, S. Application of response surface methodology for
optimizing transesterification of Moringa oleifera oil: Biodiesel production, Energy conversion and Management, 2011. 52
(8): pp. 3034-3042.
[48] Xingzhong, Y., Jia Liu, G.Z., Jingang, S., Jingyi, T., Guohe, H. Optimization of conversion of waste rapeseed oil with high
FFA to biodiesel using response surface methodology, Renewable Energy, 2008. 33: pp. 1678–1684.
[49] Halim Abdul, F.S., Kamaruddin, A.H., Fernando, W.J.N. Continuous biosynthesis of biodiesel from waste cooking palm oil
in a packed bed reactor : Optimization using response surface methodology ( RSM ) and mass transfer studies, Bioresource
Technology, 2009. 100 (2): pp. 710-716.
[50] Sanjid, A., Hassan, M.H., Md Abul, K., SM Ashrafur, R., Md Joynul, A., Ali, S. An experimental investigation of biodiesel
production, characterization, engine performance, emission and noise of Brassica juncea methyl ester and its blends, Journal
of Cleaner Production, 2014. 79: pp. 74-81.
[51] Muralidharan, K., Vasudevan, D. Performance , emission and combustion characteristics of a variable compression ratio
engine using methyl esters of waste cooking oil and diesel blends, Applied Energy, 2011. 88: pp. 3959-3968.
[52] Yuan Lin , C., Ji Li, R. Engine performance and emission characteristics of marine fish-oil biodiesel produced from the
discarded parts of marine fish, Fuel Processing Technology 2009. 90: pp. 883–888.
[53] Ganapathy, T., Gakkhar, R.P., Murugesan K. Optimization of performance parameters of diesel engine with Jatropha
biodiesel using response surface methodology, International Journal of Sustainable Energy 2011. pp. 1-15.

Asian Journal of Applied Sciences (ISSN: 2321 – 0893)
Volume 04 – Issue 02, April 2016
Asian Online Journals (www.ajouronline.com) 418
[54] Yusuf, A., Kent M, E., Milford A, H. Testing of alternative diesel fuel from tallow and soybean oil in Cummins N14-410
diesel engine, Bioresource Technology, 1995. 53 (3): pp. 243-254.
[55] Yusuf, A., Milford A, H., Louis I, L. Emissions and power characteristics of diesel engines on methyl soyate and diesel fuel
blends, Bioresource Technology, 1995. 52 (2): pp. 185-195.
[56] Yusuf, A., Milford A, H., Joseph E, B. Optimization of diesel, methyl tallowate and ethanol blend for reducing emissions
from diesel engine, Bioresource Technology, 1995. 52 (3): pp. 237-243.
[57] Hirkude, J., Padalkar, A., Shaikh, S., Veigas, A. Effect of Compression Ratio on Performance of CI Engine Fuelled with
Biodiesel from Waste Fried Oil Using Response Surface Methodology, International Journal of Energy Engineering, 2013. 3
(5): pp. 227-233.

Asian Journal of Applied Sciences (ISSN: 2321 – 0893)
Volume 04 – Issue 02, April 2016
Asian Online Journals (www.ajouronline.com) 419
Appendix
S 1: Description of oils blend based biodiesel, engine performances and emissions
Fuel used and test condition Engine type Results compared to base diesel fuel Remarks
Performance and emissions Refs. JB (Jatropha biodiesel), MB
(moringaoleifera oil biodiesel), speeds
(1000- 4000 rpm) and blends (JB10,
MB10 and full load).
Mitsubishi Pajero model 4D56T,
IDI, 4 cylinder, 4- stroke, water
cooled, maximum power of 55kW
and CR 21:1
JB and MB shows 4- 5% lower BP, 3- 5% higher
BSFC, 11-14% lower CO, 12- 16% lower THC, 7- 9%
higher NOx and 5- 7% higher CO2 compared to diesel
fuel.
[25]
JB and MB are potential biodiesel
production sources. The properties
were in line with ASTM and EN
standards.
PB (Palm oil biodiesel), JB, varied
speeds (1400- 2200 rpm) and different
blends (PB10, PB20, JB10, JB20, PBJB5
and PBJB10).
Single cylinder, 4-stroke, water
cooled, DI, Yanmar TF 120-M,
rated power of 7.7 kW at 2400 rpm
and CR 17.7:1
Combined PBJB5 and PBJB10 shows 9.53% and
20.49% lower CO, 3.69% and 7.81% lower THC,
7.55% and 19.82 % higher BSFC, 1.07% and 1.12%
lower BP, respectively than diesel fuel.
[26]
Combined biodiesel showed better
emissions compared to diesel fuel
and can be used without engine
modification.
PB, CIB (calophylluminophyllum
biodiesel), varied loads (10, 12, and
15%), varied speeds (1000- 1500 rpm),
blends (PB5, PB10, PB20, CIB5, CIB10
and CIB20).
Mitsubishi Pajero, DI, water cooled,
4 cylinder, maximum torque of 132
Nm at 2000 rpm, maximum power
of 50 kW at 4000 rpm and CR ratio
21:1
PB and CIB have shown higher BSFC and NOx
whereas BTE, CO, EGT and THC are lower compared
to diesel fuel.
[27]
Negligible BSFC difference at idling
speed of 1500 rpm. CIB has
registered BTE better than PB.
RB (rapeseed biodiesel) and HB
(biodiesel hazelnut oils biodiesel)
different speeds (1200- 2200 rpm),
different blends B1 (RB 50%), B2 (HB
50%), B3 (RB 25% + HB 25%) and full
load.
4 cylinder, 4 stroke, DI, maximum
power: 46 kW at 2400 rpm,
maximum torque of 216 Nm at 1400
rpm and CR of 16.1:1
Blends of B1, B2, and B3 have shown 0.78- 1.19%
lower torque, 3.07- 6.97% higher BSFC, 9.04-15.53%
lower CO, 0.39- 2.9% higher CO2, 2.96- 7.82% higher
NOx and 37.18- 46.29% lower smoke compared to
diesel fuel.
[28]
B1 torque and BSFC are shown to
be similar to those of diesel fuel. RB
and HB methyl ester can be used
together in existing diesel engine.
RB and SB (soybean oil biodiesel),
different speeds (1100- 2400 rpm) and
different IPs (250, 300, 350 bar) and full
load).
4 cylinder, 4-stroke, DI, maximum
torque of 216 Nm at 1400 rpm,
maximum power of 46 kW at 2400
rpm and CR of 16.1:1
RB and SB have lesser CO, smoke and higher NOx at
all IPs compared to diesel fuel. BP is shown to be 6-
12% and 5- 10% lower and BSFC is shown to be 6-
14% and 3- 10% higher for RB and SB respectively
than diesel fuel.
[29]
From emissions point of view
SB has lesser exhaust emissions
compared to RB and diesel fuel.
CB (coconut biodiesel), PB, varied
speeds (1400- 2400 rpm), different
blends (PB30, CB30 and PB15CB15)
and full load.
Single cylinder, 4- stroke, water
cooled, DI, Yanmar TF 120M, rated
power of 7.7 kW at 2400 rpm and
CR of 7.7:1
Biodiesel blends have shown 3.92- 4.71% lower BP,
3.84- 5.03% lower BTE, 8.55-9.03% higher BSFC,
3.13- 5.6% higher NOx, 13.75- 17.97% lower CO and
HC respectively compared to diesel fuel. PB15CB15
achieved the lowest BSFC over PB and CB
individually.
[30]
Combined palm coconut blend have
superior emissions and performance
over PB and CB biodiesel
individually.
PB and CB optimized condition (PB:
87.6 and CB: 12.4), blend of 20%,
different speeds (1000- 4500 rpm and full
load).
4 cylinder, IDI turbocharged diesel
engine, water cooled, maximum BT
of 185 Nm at 2000, rated BP of 65
kW at 4200 rpm and CR of 21:1
20% blend has shown 0.3- 1% higher BP, 2% higher
BSFC, 0.5- 6% higher BTE, 10- 60% lower CO, 4-
7.5% lower CO2, 20- 80% lower THC, 3.4- 4.8%
higher NO and 5.6- 10.9% lower smoke compared to
fossil diesel fuel.
[31]
Better overall properties compared
to PB and CB individually.

Asian Journal of Applied Sciences (ISSN: 2321 – 0893)
Volume 04 – Issue 02, April 2016
Asian Online Journals (www.ajouronline.com) 420
HB, WSB (waste sunflower oils
biodiesel) varied blends (B5, B15 and
B25), varied speeds (1500- 3000 rpm)
and different loads (100%, 75% and
50%).
4 cylinder, 4-stroke, water cooled,
IDI, Ford XLD 418T,maximum BT
of 152 Nm at 2200 rpm, maximum
BP of 55 kW at 4500 rpm and CR of
21.5:1
The blended fuel’s BT, PB and BSFC are found to be
higher at full and partial loads. BTE is reported to be
lower at 100% load while higher at partial loads. EGT,
CO2, NOx and CO are found to be higher at full load,
whereas the difference is negligible at partial loads
compared to diesel fuel.
[32]
17.5% blend addition to diesel fuel
is the optimum for higher BP and
BTE.
CAB (canola biodiesel), HB, constant
speed of 2200 rpm (maximum BT speed),
different blends (B5 and B10) and
different loads (25, 50, 75 and 100%).
1 cylinder, 4- stroke, DI, Antor (6
LD400 model), air cooling,
maximum BT of 19.6 Nm at 2200
rpm, maximum BP of 5.4 kW at
3000 rpm and CR of 18:1
BTE and BSFC are found to be similar with B5 while
lesser with B10 compared to diesel fuel. No significant
changes of CO, THC and smoke with B5 at partial
loads. No significant effect was noticed for B5 and B10
over CO2 emission.
[33]
5- 10 vol. % of CAB and HB can
be used without engine
modification.
SB, CAB and PB, varied blends, B1
(SB33.3, CAB33.3, PB33.3), B2 (SB10,
CAB10, PB10), B3 (SB20, CAB20,
PB20), B4 (SB25, CAB25, PB25) and
different speeds (1000- 2400 rpm).
3 cylinder, 4- stroke , Fiat diesel
engine, maximum BT of 195 Nm at
1400 rpm, maximum PB of 36 kW
at 2000 rpm and CR of 17:1
The tested biodiesel fuels have shown, 3.3% lower BP,
8.2% higher BSFC, higher NOx and CO2 and lower
CO as compared to diesel fuel.
[34]
Up to 25% diesel usage can be
substituted by blending SB, CAB
and PB.
PPB (pongamiapinnata biodiesel), MOB
(mustard oils biodiesel), varied blends A
(PPB5, MOB5), B (PPB10, MOB10), C
(PPB20, MOB20), D (PPB30 MOB30),
E (PPB40, MOB 40) and F (PPB50,
MOB 50), speed of 3000 rpm and various
loads (0, 0.4, 0.8, 1.2, 1.6, 2.0, 2.4 and
2.8 kW).
Single cylinder, Kirloskar engine,
maximum speed of 3000 rpm,
maximum BP of 4.5 hp, air cooling
and CR of 18:1
BTE and mechanical efficiency of blend A are noticed
to be higher, whereas for blends B and C are similar to
those of diesel fuel. CO2 and CO are found to be lower
while smoke, THC and NOx are higher.
[35]
Blends A, B and C can be used as an
alternative fuel for diesel engine.
JB, KB (karajan biodiesel), POB
(polanga oil biodiesel), different
blends,JB20, JB50, JB100, KB20, KB50,
KB100, POB 20, POB50, POB100 and
different load (0, 50 and 100%)
Single cylinder, Kirloskar engine
model DAF 8, 4 – stroke, air
cooling, rated BP of 6 kW, rated
speed of 1500 rpm and CR of 17.5:1
Blend of KB, JB and POB have shown lower ignition
delay of 4.5- 6.3°, 4.2- 5.9° and 4.2- 5.7° respectively
compared to diesel fuel.
[36]
POB has higher peak pressure and
shorter ignition delay. However
there was no performance and
emissions work conducted.
CAB, HB, WCB (waste cooking oil
biodiesel), different speeds (1750- 4500
rpm) and full load condition.
4 cylinder, Land Rover turbocharger
DI 110, water cooling, maximum
BT of 235 Nm at 2100, maximum
power 82 kW at 3850 rpm and CR
of 19:1
Biodiesel fuels have shown 25.5 % lower CO, 3.73 %
lower NOx, 23.66- 52.31 % lower smoke density and
9.31 % lower EGT compared to diesel fuel.
[37]
CAB, HB and WCB can be used in
exiting TDI without modification.
However, there was no performance
and combustion work conducted.
SOB (Sunflower oil biodiesel), CSB
(cotton seed oil biodiesel), different
blends (SOB10, SOB20, COB10,
COB20), different speed (800- 2600 rpm)
and different loads (20 %, 40 % and
60%)
6 cylinder, Mercedes- benz, DI, 4-
stroke, water cooled, maximum BT
of 840 Nm at 1250- 1500 rpm,
Maximum BP of 177 kW at 2600
rpm and CR of 18:1.
Biodiesel blends have shown, lower smoke density,
higher NOx, lower CO and higher THC compared to
diesel fuel.
[38]
CSB showed lower emissions
compared to SOB and fossil diesel
fuel.

Asian Journal of Applied Sciences (ISSN: 2321 – 0893)
Volume 04 – Issue 02, April 2016
Asian Online Journals (www.ajouronline.com) 421
S 2: Transesterification design plan, experimental and predicated FAME yield
Exp.
run
Alcohol/
oil ratio
Catalyst amount
(wt. %)
Reaction
temp. (°C)
Reaction
time (hr)
FAME yield (%) Actual Predicted
1 6 1.00 45 1.00 92 90.88
2 8 2.34 55 2.00 71 72.19
3 6 1.00 65 1.00 97 95.37
4 8 1.50 55 2.00 83 84.17
5 10 2.00 45 1.00 85 84.38
6 8 1.50 55 0.32 72 73.39
7 6 2.00 65 3.00 90 88.37
8 8 1.50 55 3.68 80 81.59
9 10 1.00 65 3.00 70 68.37
10 6 2.00 45 3.00 53 51.88
11 11.36 1.50 55 2.00 88 89.91
12 8 1.50 55 2.00 83 84.17
13 10 2.00 65 1.00 84 82.57
14 4.64 1.50 55 2.00 92 93.99
15 10 1.00 45 3.00 79 78.58
16 8 0.66 55 2.00 70 71.59
17 8 1.50 55 2.00 90 84.17
18 8 1.50 38 2.00 77 77.60
19 8 1.50 55 2.00 84 84.17
20 8 1.50 55 2.00 85 84.17
21 8 1.50 72 2.00 87 89.79