optimization of coagulation-flocculation parameters … · optimization of...
TRANSCRIPT

Drink. Water Eng. Sci., 7, 73–82, 2014www.drink-water-eng-sci.net/7/73/2014/doi:10.5194/dwes-7-73-2014© Author(s) 2014. CC Attribution 3.0 License.
Optimization of coagulation-flocculation parametersusing a photometric dispersion analyser
S. R. Ramphal and M. S. Sibiya
Rand Water, Process Technology Department, Glen Vista, South Africa
Correspondence to:S. R. Ramphal ([email protected])
Received: 30 December 2013 – Published in Drink. Water Eng. Sci. Discuss.: 6 February 2014Revised: 19 May 2014 – Accepted: 25 June 2014 – Published: 23 July 2014
Abstract. The size and structural characteristics of floc particles are important design and control parametersin water treatment and should be rapidly monitored with a reasonable amount of accuracy. In this study, a pho-tometric dispersion analyser (PDA) coupled to standard jar test experiments was used to optimize coagulation-flocculation parameters while monitoring floc size and structure as well as the rate of floc formation during co-agulation using alum. The optimal coagulation conditions were as follows: sample pH 8; alum dosage, 3 mg L−1
as Al3+; G value, 172 s−1; rapid mixing time, 20 s. These conditions resulted in unstable treated water having acalcium carbonate precipitation potential (CCPP) of−15 mg L−1 as CaCO3 and required a slaked lime dosageof 17 mg L−1 as CaCO3 to equilibrate CCPP to acceptable levels. PDA data revealed that aggregation rate andsteady-state variance are primary parameters as both have substantial influence on coagulation-flocculation ef-ficiency. However, the average steady state ratio, although an important parameter, had a lessened impact oncoagulation-flocculation efficiency. The results of this study showed that the PDA instrument is an importanttool in coagulation kinetic studies and can be employed as an additional tool in the optimization of coagulationconditions.
1 Introduction
The treatability of a water source, including the determi-nation of optimal conditions for specific parameters (mosteffective coagulant, dosage rates, pH, velocity gradient andmixing time), is conventionally performed at bench-scale us-ing standard jar test experiments. The performance of theseexperiments is generally determined through measuring tur-bidity and/or colour removal. Although this method of per-formance measure can provide sufficient information to per-mit pilot- or full-scale implementation, it does possess inher-ent limitations as it provides no information on floc particlesize and structure.
The size distribution of floc particles is an important de-sign and control parameter during coagulation-flocculation(Spicer et al., 1996). In combination with floc particle struc-ture and density, the size distribution of floc particles is ofgreat significance in solid-liquid separation processes such assedimentation (Selomulya et al., 2001). Floc size and struc-ture are influenced by several operational parameters and di-
rectly impacts floc density which controls solid removal effi-ciency during sedimentation (Spicer and Pratsinis, 1996).
During coagulation-flocculation, both floc particle sizeand structure undergo transitional phases. Initially, upon co-agulant dosage, there is a period of rapid floc growth inwhich the size and structure of the floc aggregates are dy-namic in nature. This is followed by a steady- state region orequilibrium between particle growth and fragmentation fora specific period, during which, the floc particle size doesnot change. The shape of the particle size distribution curveis critical as it influences coagulation-flocculation kinetics,the rate of floc growth, floc characteristics and solid removalprocesses (Selomulya et al., 2001; Spicer et al., 1996). It istherefore very important to rapidly quantify both size andstructure of aggregates to generate a particle size distribu-tion curve with a reasonable amount of accuracy (Selomulyaet al., 2001).
One of the most widely used techniques employed to de-termine aggregate structure and size distribution are lightscattering techniques. These techniques are advantageous as
Published by Copernicus Publications on behalf of the Delft University of Technology.

74 S. R. Ramphal and M. S. Sibiya: Optimization of coagulation-flocculation parameters
Table 1. Raw water characteristics.
Parameter pH Turbidity UV300 Temperature(NTU) (cm−1) (◦C)
Average 7.93 55.57 0.4223 20
they offer an estimation of a wide range of particle sizes ina rapid and non-destructive manner (Selomulya et al., 2001).A photometric dispersion analyser (PDA) has become an im-portant instrument that has been widely used in monitoringcoagulation-flocculation kinetics (Mixon et al., 2013; Ball etal., 2011; Staaks et al., 2011; Zoubolis and Tzoupanos, 2009,2010; Xiao et al., 2009; Huang and Liu, 1996).
A PDA is a fibre-optical monitor which measures the fluc-tuation in the intensity of light transmitted through a flowingsuspension (Huang and Liu; 1996). More specifically, it mea-sures the root mean square of the fluctuating signal (Vrms)
and the average transmitted light intensity (dc). The ratioof Vrms to dc is a valuable tool in coagulation-flocculationstudies as it permits quantification of aggregation or dis-aggregation of the suspension to be monitored (Huang andLiu; 1996). This ratio can be derived as follows (Xiao et al.,2009):
Ratio=
(L
A
)1/2(∑NiC
2i
)1/2(1)
whereL is the optical path length,A is the effective crosssectional area of the light beam,Ni is the number and con-centration class of size classi and Ci is particle scatteringcross-section of size classi respectively. The ratio values ob-
tained from the PDA is affected only by(∑
NiC2i
)1/2, and is
almost entirely unaffected by contamination of the tube wallsin the flow cell and by drift in electrical components (Xiao etal., 2009). This study is an extension of the one presented atthe 12th edition of the International Conference on “Comput-ing and Control for the Water Industry – CCWI 2013” (Ram-phal and Sibiya, 2014). Similar to the CCWI 2013 study, thisstudy used a PDA instrument to optimize coagulation condi-tions and monitor floc size and structure as well as the rateof floc formation using alum as a coagulant. Standard jar testexperiments were performed concurrently with PDA experi-ments to determine the degree of particle destabilization. Inaddition, this study applied operational guidelines used at alarge water utility in Africa for dosage optimization and as-sessed its impact on floc size and structure as well as the rateof aggregation. Further, the impact of alum dosage on thestability of treated water was also evaluated.
Jar stirrer
Tubing
PDA 2000
Peristaltic
pump
Waste
PDA interface
Computer
Figure 1. Experimental set up.
2 Methodology
2.1 Jar tests
Jar test experiments were performed on raw water obtainedfrom the Vaal Dam (South Africa) (Table 1). Jar tests werecarried out using a variable speed ZR 4–6 Jar tester (Zhon-grun Water Industry Technology Development Co. Ltd,China) fitted with six flat paddle impellors. For each jar testthe following procedure was performed: one litre of raw wa-ter was added to each Perspex jar; the pH of samples wereadjusted to the relevant pH using either 0.1 M hydrochloricacid or 0.1 M sodium hydroxide; appropriate dosages of alumwere dosed into each jar using plastic syringes; various ve-locity gradients were applied to the sample using electroni-cally controlled programmes; upon completion of electron-ically controlled programme samples were left to settle for15.5 min.
2.2 Instrumentation
2.2.1 Photometric dispersion analyser
Coagulation-flocculation kinetics was determined using thePDA 2000 (Rank Brothers, England). Clear plastic tubing of3 mm in diameter was used to transport samples from thejar to the fibre optic probes at a flow rate of 22 mL min−1.Sample flow rate was controlled by a peristaltic pump whichwas placed after the PDA instrument to prevent floc breakageprior to analysis (Fig. 1). To ensure comparison of PDA ex-periments, the direct current (DC) output of source water wasmaintained at a constant voltage by adjusting the DC gains onthe instrument. For all experiments, the limit and filter modeswere used as this reduced the effects of large particles and airbubbles and increased the averaging time to obtain smootheroutput values, respectively. All data was recorded using anADC-20 data-logger coupled to the Picolog Software.
Drink. Water Eng. Sci., 7, 73–82, 2014 www.drink-water-eng-sci.net/7/73/2014/

S. R. Ramphal and M. S. Sibiya: Optimization of coagulation-flocculation parameters 75
Mixing intensity
Rat
io v
alu
es
Time
Initial growth phase
Steady state region
Figure 2. Time dependent ratio curve.
2.2.2 Other instrumentation
A HACH 2100Q turbidimeter and a Cary 50-Conc VarianUV-Vis Spectrophotometer was used to measure turbidityand UV300 values respectively. UV300 was used a measureof non-visible colour and is hereby referred to as colour.The temperature and pH were measured using a Metrohm692 pH/ion meter. All titrations were performed using aSchott Titronic 96 auto-titrator while the conductivity wasmeasured using a Labotec 197i conductivity meter.
2.3 Analysis of PDA data
The time dependent ratio values collected during eachcoagulation-flocculation experiment generated aratio curveof similar pattern (Fig. 2). Figure 2 shows that there are twodistinct regions with each indicating the evolution of aggre-gate size with time at various shear rates (Selomulya et al.,2001). In the initial growth region, fluid shear promotes par-ticle collision which results in aggregate growth. As theseaggregates grow, breakage becomes a more significant factoras the size range of the aggregate is more susceptible to frag-mentation by turbulent eddies. This results in the attainmentof steady-state region. During this phase, due to the attain-ment of a dynamic equilibrium between aggregate growthand aggregate fragmentation, aggregates are of equal size,since ratio values remain constant over time (Hopkins andDucoste, 2003; Spicer and Pratsinis, 1996; Oles, 1992).
In this study, three calculations were used to analysethe data obtained during the coagulation-flocculation ex-periments. These calculations included the aggregation rateduring rapid mixing, time-weighted average steady-state ra-tio and time-weighted steady-state variance as described byMixon et al. (2013); Staaks et al. (2011); Xiao et al. (2009)and Hopkins and Ducoste (2003). The aggregation rate (AR)during coagulation was calculated by:
AR =Ratioi − Ratio0
timei
(2)
where Ratio0 is the initial ratio value att0, timei is the whenthe PDA output reaches its maximum value of Ratioi . In
accordance to work performed by Staaks et al. (2011), ini-tial calculations determined the aggregation rate of the firstminute, first to fifth minute and the entire first five minutes.It was found that the aggregation rate for the first minuteyielded the best results; hence, this parameter was used forthe rest of the study. The time-weighted average steady-stateratio was determined by:
ratio=
N∑i=1
(ratioi × timei)
N∑i=1
timei
(3)
Equation (3) represents the state of aggregation during thesteady state period of coagulation-flocculation. The final cal-culation used in this study was the time-weighted steady-state variance, which was also computed using the data fromthe steady state period during coagulation-flocculation as fol-lows:
variance=
N∑i=1
[(ratioi − average. . . ratio)2
× timei
]N∑
i=1timei
(4)
Equation (4) was used as a measure of floc size and struc-tural differences. According to Hopkins and Ducoste (2003),smaller variance is indicative of a tighter floc size distributionand a more homogenous, dense and less porous floc struc-ture.
2.4 Assessment of calcium carbonate precipitationpotential
The stability of treated water was determined by measuringthe calcium carbonate precipitation potential (CCPP) of spe-cific samples. The CCPP was determined using the Stasoft4©
software (version 4) which is a tool for designing, modellingand controlling water treatment processes that involve cal-cium carbonate chemistry. To measure the CCPP, specificwater quality parameters, inclusive of temperature, conduc-tivity, dissolved calcium, pH and total alkalinity were deter-mined.
3 Results and discussion
3.1 Optimization of pH
Jar test experiments were performed to assess turbidity andcolour removal as well as coagulation-flocculation kineticsat various pH values. This was achieved by adding a constantalum dosage of 10 mg L−1 as Al3+ to samples adjusted to pH6–9. According to Pernitsky and Edzwald (2006), favourablepH conditions for alum coagulation generally occur between
www.drink-water-eng-sci.net/7/73/2014/ Drink. Water Eng. Sci., 7, 73–82, 2014

76 S. R. Ramphal and M. S. Sibiya: Optimization of coagulation-flocculation parameters
0.00
0.01
0.02
0.03
0.04
0.05
2.00
2.50
3.00
3.50
4.00
4.50
5.00
5.50
6 7 8 9
Resi
dual
colo
ur (c
m-1
)
Resi
dual
turb
idity
(NTU
)
pH before dosage
NTU
Colour
0
1
2
3
4
5
6
7
5 6 7 8 9
Aver
age
stea
dy st
ate
ratio
pH
0.000
0.002
0.004
0.006
0.008
0.010
0.012
0.014
0.016
0.018
5 6 7 8 9
Ratio
val
ues p
er se
cond
pH
0.00
0.05
0.10
0.15
0.20
0.25
5 6 7 8 9Va
rianc
e
pH
(a)
(c)
(b)
(d)
Figure 3. Optimization of pH –(a) residual turbidity and colour;(b) average steady-state ratio;(c) aggregation rate;(d) steady-state variance.
a pH of 6–7. Figure 3a indicates that the lowest residual tur-bidity and colour was observed at an initial sample pH of 8;corresponding to a coagulation pH of 6.29.
The optimal pH also coincided with the minimal solubil-ity of alum, indicating that sweep flocculation is the primarycoagulation mechanism through the formation of aluminiumhydroxide precipitates (Pernitsky and Edzwald, 2006; Gre-gor et al., 1997). One would expect that the largest floc sizewould correspond to highest coagulation efficiency; in otherwords, the largest floc size and floc growth rate should re-sult in the lowest residual turbidity and colour. However, thiswas not observed as the lowest residual turbidity and colour(Fig. 3a) corresponded to the lowest average steady state ra-tio and aggregation rate (Fig. 3b and c). Further, from Fig. 4b,one can see that at the optimal coagulation pH of 6.29, sweepflocculation should be the primary coagulation mechanism;hence, one can expect the largest floc sizes to form underthese conditions. However, from Fig. 3b, a trend of increas-ing ratio values was observed with decreasing pH, whichaccording to Fig. 4a should shift the aluminium hydrolysisspecies to ionic forms. This strongly suggests the presenceof interfering contaminants within the source water.
Figure 3d shows that the lowest steady-state variance wasobtained at a pH of 8. According to Mixon et al. (2013) andHopkins and Ducoste (2003), low steady-state variance val-ues indicates the existence of a narrow range of floc sizes andstronger flocs at a particular location. This can be expected as
the coagulation pH corresponds to the minimum solubility,indicating the presence of solid aluminium hydroxide pre-cipitates. In contrast, an initial sample pH of 6 displayed thehighest steady-state variance, indicating the occurrence of awide range of floc sizes and placing further significance onthe existence of interfering contaminants within the sourcewater. Although there was a lack of correspondence betweenresidual and PDA data, the residual data provided sufficientevidence to indicate that an initial sample pH of 8 was opti-mal. This sample pH was used for the rest of the study.
3.2 Optimization of dosage
The optimization of alum dosage was performed by adjust-ing sample pH to 8 while varying the alum dosage from2–12 mg L−1 as Al3+. Figure 5a indicates that an alumdosage of 6 mg L−1 as Al3+ resulted in the lowest residualturbidity and colour. This dosage reduced the pH from 8to 6.69 which favoured sweep flocculation through the for-mation of aluminium hydroxide precipitates (Srinivasan etal., 1999). Further, the isoelectric point of alum occurs atpH 8 indicating that pH values less than 8 yield positivelycharged precipitates, which are able to neutralize the neg-atively charged particles in the water sample (Gregory andDuan, 2001).
Drink. Water Eng. Sci., 7, 73–82, 2014 www.drink-water-eng-sci.net/7/73/2014/

S. R. Ramphal and M. S. Sibiya: Optimization of coagulation-flocculation parameters 77
Figure 4. Distribution of aluminium hydrolysis products;(a) dissolved species;(b) amorphous precipitate (adapted from Pernitsky andEdzwald, 2006).
21
2
3
4
5
6
8
9
10
11
12
13
Figure 5. Optimization of dosage - (a) Residual turbidity and colour; (b) Average steady-
state ratio; (c) Aggregation rate; (d) Steady-state variance
0
0.01
0.02
0.03
0.04
0.05
0.06
0.07
1.00
1.50
2.00
2.50
3.00
3.50
4.00
4.50
5.00
5.50
6.00
2 3 4 6 8 10 12
Re
sid
ual
co
lou
r (c
m-1
)
Re
sid
ual
tir
bid
ity
(NTU
)
Dosage (mg/l)
NTU Colour
0
1
2
3
4
5
6
7
1 2 3 4 5 6 7 8 9 10 11 12
Ave
rage
ste
ady
stat
e r
atio
Dosage (mg/l)
0.000
0.002
0.004
0.006
0.008
0.010
0.012
0.014
0.016
0.018
0.020
1 2 3 4 5 6 7 8 9 10 11 12
Rat
io v
alu
e p
er
seco
nd
Dosage (mg/l)
0.00
0.01
0.02
0.03
0.04
0.05
0.06
0.07
0.08
0.09
0.10
1 2 3 4 5 6 7 8 9 10 11 12
Var
ian
ce
Dosage (mg/l)
(c) (d)
(a) (b)
Figure 5. Optimization of dosage –(a) residual turbidity and colour;(b) average steady-state ratio;(c) aggregation rate;(d) steady-statevariance.
www.drink-water-eng-sci.net/7/73/2014/ Drink. Water Eng. Sci., 7, 73–82, 2014

78 S. R. Ramphal and M. S. Sibiya: Optimization of coagulation-flocculation parameters
0.000
0.020
0.040
0.060
0.080
0.100
0.120
0
2
4
6
8
10
12
14
16
18
37 65 115 147 172 214
Resi
dual
colo
ur (c
m-1
)
Resi
dual
turb
idity
(NTU
)
Velocity gradient (s-1)
Turbidity
UV300
37 65 115 147 172 214
0
1
2
3
4
5
6
Aver
age
stea
dy st
ate
ratio
Velocity gradient (s-1)
37 65 115 147 172 214
0.000
0.002
0.004
0.006
0.008
0.010
0.012
Ratio
per
seco
nd
Velocity gradient (s-1)
37 65 115 147 172 214
0.0
0.1
0.2
0.3
0.4
0.5
0.6
0.7
0.8
0.9
1.0
Varia
nce
Velocity gradient (s-1)
(a)
(c)
(b)
(d)
Figure 6. Optimization of velocity gradient –(a) residual turbidity and colour;(b) Average steady-state ratio;(c) aggregation rate;(d)steady-state variance.
Figure 5b shows that the largest average steady-state ra-tios were obtained for alum dosages of 4 and 6 mg L−1 asAl3+. Although an alum dosage of 6 mg L−1 as Al3+ did notrepresent the largest average steady-state ratio value, it dis-played the highest efficiency in terms of turbidity and colourremoval. This indicates that floc size, although important incoagulation-flocculation processes, is not the most impor-tant parameter. Figure 5c and d show that an alum dosageof 6 mg L−1 as Al3+ displayed a higher aggregation rateand lower steady-state variance to that of 4 mg L−1 as Al3+
dosage. This indicates that an alum dosage of 6 mg L−1 asAl3+ resulted in a higher floc growth rate and that the flocssize displayed greater degree of strength and floc size homo-geneity. Based on these results, it is possible that these twoparameters contributed to the enhanced performance of the6 mg L−1 as Al3+ alum dosage and may possibly be primaryparameters for consideration in coagulation-flocculation ki-netic studies.
However, at a large water utility in Africa, to reduce chem-ical costs, an operational guideline using the lowest coagu-lant dosage which yielded a post-sedimentation turbidity ofless than 5 NTU is applied. Under these circumstances, analum dosage of 3 mg L−1 of Al3+ was optimal. This dosagedisplayed inferior PDA data to that of the 6 mg L−1 as Al3+
dosage as it presented the lowest average-steady ratio and ag-gregation rate values signifying the presence of smaller floc
particles formed at moderate rate. However, it did exhibit alower steady-state variance value, indicating that floc particlesizes were more homogenous, denser and less porous in na-ture. A dosage of 3 mg L−1 of Al3+ was used for subsequentexperiments.
3.3 Optimization of velocity gradient
In this experiment, the rapid mixing intensity was variedwhile applying the optimal alum dosage of 3 mg L−1 as Al3+
and initial sample pH of 8. Figure 6a shows that the lowestresidual turbidity and colour was obtained during applicationof a G value of 172 s−1. At this velocity gradient, an opti-mal level of energy was dissipated which warranted efficientcoagulation through the instantaneous and even distributionof alum (Degremont, 2007). It may seem appropriate to usehighG values during rapid mixing to maximise efficient useof a coagulant; however, each application has an upper limit(Bratby, 2006). OnceG values exceed this limit, there is adelay in floc formation and size.
This trend can be observed in Fig. 6b and c in which theaverage steady state ratio and aggregation rate peaked at aspecificG value; with further increases inG values result-ing in lower values. This occurred as higher energy dissipa-tion increases the shear rate and the number of particle colli-sions; hence, increasing the rate of floc break-up (Selomulya
Drink. Water Eng. Sci., 7, 73–82, 2014 www.drink-water-eng-sci.net/7/73/2014/

S. R. Ramphal and M. S. Sibiya: Optimization of coagulation-flocculation parameters 79
0
0.02
0.04
0.06
0.08
0.1
4
5
6
7
8
9
10
5 10 15 20 25 30 40
Resi
dual
turb
idity
(NTU
)
Rapid mixing time (s)
NTU
UV300
5 10 15 20 25 30 40
2.20
2.30
2.40
2.50
2.60
2.70
2.80
2.90
3.00
3.10
Aver
age
stea
dy st
ate
ratio
Rapid mixing time (s)
5 10 15 20 25 30 40
0
0.001
0.002
0.003
0.004
0.005
0.006
0.007
0.008
0.009
Ratio
per
seco
nd
Rapid mixing time (s)
5 10 15 20 25 30 40
0.010
0.011
0.012
0.013
0.014
0.015
0.016
0.017
0.018
0.019
0.020
Varia
nce
Rapid mixing time (s)
(a)
(c)
(b)
(d)
Figure 7. Optimization of rapid mixing time –(a) residual turbidity and colour;(b) average steady-state ratio;(c) aggregation rate;(d)steady-state variance.
et al., 2001). This resulted in the formation of smaller; denserand less porous aggregates which are structurally tolerant tohigher shear forces, leading to a lower steady state meanfloc size attained in a shorter period of time (Hopkins andDucoste, 2003; Spicer and Pratsinis, 2001, Oles, 1992). Thistrend has been observed by various researchers (Hopkins andDucoste, 2003; Selomulya et al., 2001; Spicer and Pratsinis,1996).
Figure 6d shows that the steady-state variance was sub-stantially higher at lower velocity gradients (≤ 115 s−1).Mixon et al. (2013) and Hopkins and Ducoste (2003) ex-plained that high steady-state variance at lowerG values wasdue to larger aggregates being sheared due to settling intothe impellor region. Further, in this study, it was observedthat as theG value increased, the steady-state variance de-creased. This indicates that at higher shear rates, the forma-tion of a more homogenous floc suspension was favoured(Mixon et al., 2013). As observed in prior experiments, thelargest average steady-state ratio obtained at a velocity gradi-ent of 37 s−1 did not result in the highest efficiency in termsof turbidity and colour removal. Rather, a velocity gradientof 172 s−1 displayed the highest efficiency as it exhibitedthe highest aggregation rate and lowest steady-state variancewhen compared to other velocity gradients. A velocity gradi-ent of 172 s−1 was used for the rest of the study.
3.4 Optimization of rapid mixing time
For this phase of the study, rapid mixing time was variedwhile applying the optimal alum dosage of 3 mg L−1 as Al3+,sample pH of 8 and aG value 172 s−1. Figure 7a shows thatthe lowest residual turbidity and colour was obtained whena rapid mixing time of 20 s was applied. This signifies that avelocity gradient of 172 s−1 was applied for an optimal pe-riod to ensure efficient coagulation through the instantaneousand even distribution of alum.
Similar to rapid mixing intensity, it may be desirable toapply an optimal velocity gradient for an extended periodof time to maximise efficient use of coagulants. However,according to Bratby (2006), extended periods of rapid mix-ing may give rise to deleterious effects in the coagulation-flocculation process. As such, each application will have anoptimal rapid mixing time which is dependent on the rapidmixing intensity and coagulant concentration. The negativeeffect of prolonged rapid mixing time can be seen in Fig. 7aas higher residual turbidity and colour values were obtainedduring longer rapid mixing times.
Figure 7b shows that the average steady state ratio val-ues gradually decrease with increasing rapid mixing times.This was anticipated as prolonged rapid mixing times will ex-pose aggregates to shear rates for longer periods of time. Thiswill delay the floc growth process and allow for a longer pe-riod of particle collision; increasing the rate of floc breakup.
www.drink-water-eng-sci.net/7/73/2014/ Drink. Water Eng. Sci., 7, 73–82, 2014

80 S. R. Ramphal and M. S. Sibiya: Optimization of coagulation-flocculation parameters
24
-40
-35
-30
-25
-20
-15
-10
-5
0
0 1 2 3 4 5 6 8 10 12
CC
PP
(m
g/l a
s C
aCO
3)
Alum dosage (mg/l)
(c) (d)
(b) (a)
Figure 8. Impact of alum dosage on CCPP of treated water.
Selomulya et al. (2001) explained that higher circulationtimes reduces the time aggregates have to form larger sizesdue to high shear stress, hence, a decrease in average steady-state ratio was observed.
In line with observations from previous experiments, thehighest average steady-state ratio value, obtained from arapid mixing time of 15 s, did not result in the highestcoagulation-flocculation performance in terms of turbidityand colour removal. Rather, a rapid mixing time of 20 s dis-played the highest removal efficiency. PDA data representedin Fig. 7c and d indicate that a rapid mixing time of 20 s pro-duced a higher aggregation rate and lower steady-state vari-ance than that of 15 s. This places further significance on theimportance of the aggregation rate and steady-state variancein coagulation-flocculation studies. A rapid mixing time of20 s was used for subsequent experiments.
3.5 Impact of alum dosage on CCPP
The impact of alum dosage on CCPP was investigated at analum dosage range of 2–4 mg L−1 as Al3+, sample pH of8; G value of 172 s−1 and rapid mixing time of 20 s. Fig-ure 8 shows that the CCPP of treated water decreased withincreasing alum dosage. To ensure stability of treated water,the production specification for CCPP at a large water util-ity is −2 to+3 mg L−1 as CaCO3. However, Fig. 9 indicatesthat at an alum dosage range of 2–4 mg L−1 as Al3+ and asample pH of 8, the coagulation, flocculation and sedimenta-tion process reduces the CCPP to−10.4 to−19.8 as mg L−1
as CaCO3, respectively. These values demonstrate the corro-sive nature of treated water and a high probability of damageto infrastructure occurring. As a result, it is imperative thatwater treated with alum is stabilized using appropriate pro-cesses.
Lime is used widely during potable water treatment as acoagulant, to adjust coagulation pH or for stabilization oftreated water. As a result, this study used slaked lime toequilibrate the CCPP of treated water. Figure 9 illustratesthat three experiments were performed to optimise the slaked
-30
-20
-10
0
10
20
30
40
50
2 3 4
CC
PP
(m
g/l a
s C
aCO
3)
Alum dosage (mg/l)
After settling Experiment 1 Experiment 2 Experiment 3
Target range
Figure 9. Equilibration of CCPP.
lime dosage required to increase the CCPP of treated waterto +3.0 mg L−1 as CaCO3. Experiment 3 demonstrates thatfor alum dosages of 2, 3 and 4 mg L−1 as Al3+, the CCPPwas adjusted to 3, 2.5 and 2.9 mg L−1 as CaCO3, respec-tively. This corresponded to slaked lime dosages of 13, 17and 23 mg L−1 for alum dosages of 2, 3 and 4 mg L−1, re-spectively.
3.6 Impact of dosage sequence
This experiment was performed to assess the effect of dos-ing slaked lime on water quality during coagulation, as wellas the sequence of chemical dosage on the turbidity of set-tled water. It should be reiterated that slaked lime was usedprimarily for pH/CCPP adjustment in this study. Two exper-imental scenarios were performed:
1. Alum dosed first, followed by slaked lime
2. Slaked lime dosed first, followed by alum
Figure 10a and b show that lower residual turbidity andcolour levels were obtained when slaked lime was dosedbefore alum. Additionally, one should note that under bothexperimental scenarios, both turbidity and colour removalswere enhanced at higher slaked lime dosages. As such, it ap-pears that slaked lime functions as a coagulant chemical inaddition to a pH adjustment chemical.
To gain further understanding on the coagulation-flocculation kinetics, samples from both experimental sce-narios were passed through the PDA monitor. When alumwas dosed first, the ratio output values were very low and didnot produce a ratio profile as shown in Fig. 2. As a result,the root mean square (RMS) gain on the instrument was ad-justed accordingly to amplify the signal. These instrumentalsettings were kept constant for both experimental scenariosto allow for data comparison. However, in the case of ex-perimental scenario two (lime addition first); the amplifiedinstrumental settings resulted in a ratio overload during thesteady-state growth region. A ratio overload occurs when the
Drink. Water Eng. Sci., 7, 73–82, 2014 www.drink-water-eng-sci.net/7/73/2014/
S. R. Ramphal and M. S. Sibiya: Optimization of coagulation-flocculation parameters 81
0
5
10
15
20
25
30
35
40
45
2 3 4
Re
sid
ual
tu
rbid
ity
(NTU
)
Alum dosage (mg/l)
Alum first Lime first
2 3 4
0
0.01
0.02
0.03
0.04
0.05
0.06
0.07
Rat
io p
er
seco
nd
Alum dosage (mg/l)
2 mg/l - Lime first 2 mg/l - Al first
3 mg/l - Lime first 3 mg/l - Al first
4 mg/l - Lime first 4 mg/l - Al first
0.00
0.05
0.10
0.15
0.20
0.25
0.30
0.35
2 3 4
Re
sid
ual
co
lou
r (c
m-1
)
Alum dosage (mg/l)
Alum first Lime first
(a) (b)
(c)
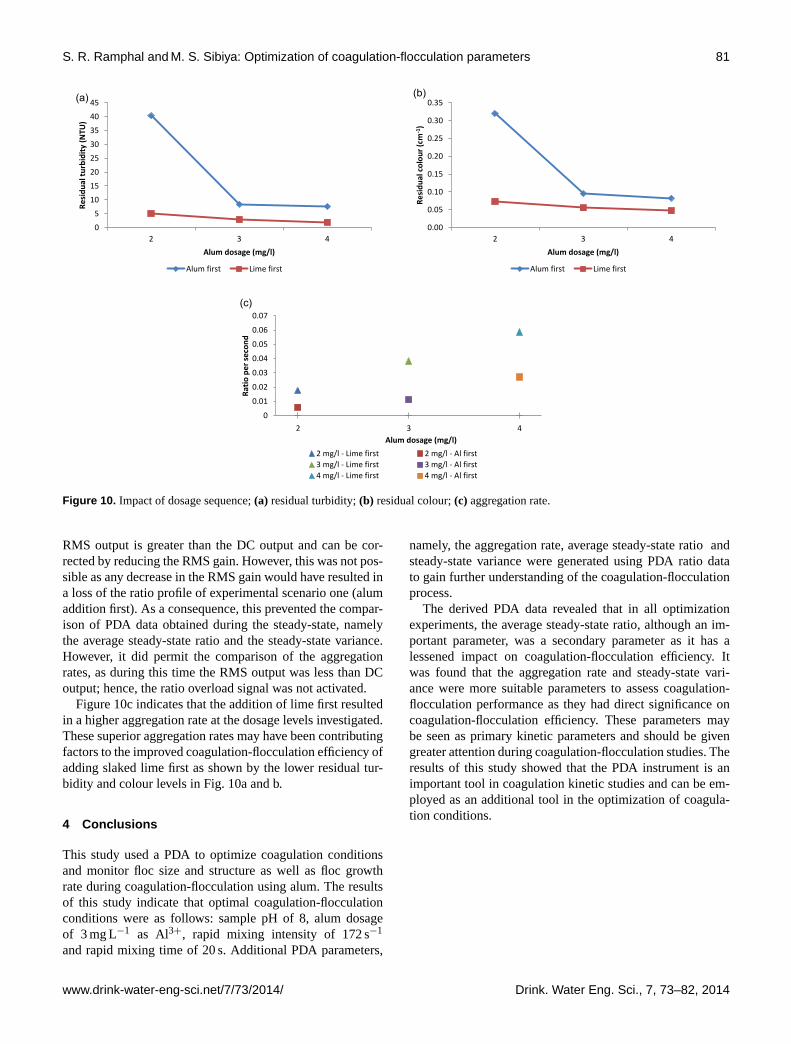
Figure 10. Impact of dosage sequence;(a) residual turbidity;(b) residual colour;(c) aggregation rate.
RMS output is greater than the DC output and can be cor-rected by reducing the RMS gain. However, this was not pos-sible as any decrease in the RMS gain would have resulted ina loss of the ratio profile of experimental scenario one (alumaddition first). As a consequence, this prevented the compar-ison of PDA data obtained during the steady-state, namelythe average steady-state ratio and the steady-state variance.However, it did permit the comparison of the aggregationrates, as during this time the RMS output was less than DCoutput; hence, the ratio overload signal was not activated.
Figure 10c indicates that the addition of lime first resultedin a higher aggregation rate at the dosage levels investigated.These superior aggregation rates may have been contributingfactors to the improved coagulation-flocculation efficiency ofadding slaked lime first as shown by the lower residual tur-bidity and colour levels in Fig. 10a and b.
4 Conclusions
This study used a PDA to optimize coagulation conditionsand monitor floc size and structure as well as floc growthrate during coagulation-flocculation using alum. The resultsof this study indicate that optimal coagulation-flocculationconditions were as follows: sample pH of 8, alum dosageof 3 mg L−1 as Al3+, rapid mixing intensity of 172 s−1
and rapid mixing time of 20 s. Additional PDA parameters,
namely, the aggregation rate, average steady-state ratio andsteady-state variance were generated using PDA ratio datato gain further understanding of the coagulation-flocculationprocess.
The derived PDA data revealed that in all optimizationexperiments, the average steady-state ratio, although an im-portant parameter, was a secondary parameter as it has alessened impact on coagulation-flocculation efficiency. Itwas found that the aggregation rate and steady-state vari-ance were more suitable parameters to assess coagulation-flocculation performance as they had direct significance oncoagulation-flocculation efficiency. These parameters maybe seen as primary kinetic parameters and should be givengreater attention during coagulation-flocculation studies. Theresults of this study showed that the PDA instrument is animportant tool in coagulation kinetic studies and can be em-ployed as an additional tool in the optimization of coagula-tion conditions.
www.drink-water-eng-sci.net/7/73/2014/ Drink. Water Eng. Sci., 7, 73–82, 2014

82 S. R. Ramphal and M. S. Sibiya: Optimization of coagulation-flocculation parameters
Acknowledgements. The authors would like to express gratitudetowards both the Experimental Facility at the Process TechnologyDepartment as well as the Analytical Services Department at RandWater for their role in this project.
Edited by: S. Meniconi
References
Ball, T., Carriere, A., and Barbeau, B.: Comparison of two onlineflocculation monitoring techniques for predicting turbidity re-moval by granular media filtration, Environ. Technol., 32, 1095–1105, 2011.
Bratby, J.: Coagulation and flocculation in water and wastewatertreatment, 2nd Edn., IWA Publishing, London, United Kingdom,2006.
Degremont: Water treatment handbook, 7th Edn., Lavoisier SAS,France, 2007.
Gregor, J. E., Nokes, C. J., and Fenton, E.: Optimizing natural or-ganic matter removal from low turbidity waters by controlledpH adjustment of aluminium coagulation, Water Res., 31, 2949–2958, 1997.
Gregory, J. and Duan, J.: Coagulation by hydrolyzing metal salts,Pure Appl. Chem., 73, 2017–2026, 2001.
Hopkins, D. C. and Ducoste, J. J.: Characterizing flocculation underheterogeneous turbulence, J. Colloid Interf. Sci., 264, 184–194,2003.
Huang, C. and Liu, C.: Automatic control for chemical dosing inlaboratory scale coagulation process by using an optical monitor,Water Res., 30, 1924–1929, 1996.
Mixon, M., Staak, C., Fabris, R., Vimonses, V., Chow, C. W. K.,Panglisch, S., van Leeuwen, J., and Drikas, M.: The impact ofoptimized coagulation on fouling for coagulation/ultrafiltrationprocess, Desalin. Water Treat., 51, 2718–2725, 2013.
Oles, V.: Shear induced aggregation and break up of polystyrenelatex particles, J. Colloid Interf. Sci., 154, 351–358, 1992.
Pernitsky, D. J. and Edzwald, J. K.: Selection of alum and polyalu-minium coagulants: principles and applications, J. Water SupplyRes. T., 55, 121–141, 2006.
Ramphal, S. and Sibiya, S. M.: Optimization of time requirementfor rapid mixing during coagulation using a photometric disper-sion analyzer, Proc., 12th Int. Conf. on “Computing and Controlfor the Water Industry – CCWI2013”, Perugia, Elsevier, Proc.Engin., 70, 1401–1410, 2014.
Selomulya, C., Amal, R., Bushell, G., and Waite, T. D.: Evidenceof shear rate dependence on restructuring and breakup of latexaggregates, J. Colloid Interf. Sci., 236, 67–77, 2001.
Spicer, P. T. and Pratsinis, S. E.: Shear induced flocculation: TheEvolution of Floc Structure and Size Distribution during Shear-Induced Flocculation, Water Res, 30, 1049–1056, 1996.
Spicer, P. T., Pratsinis, S. E., and Trennepohl, M. D.: Coagulationand fragmentation: The variation of shear rate and the time lagfor attainment of steady state, Ind. Eng. Chem. Res., 35, 3074–3080, 1996.
Srinivasan, P. T., Viraraghavan, T., and Subramanian, K. S.: Alu-minium in drinking water: An overview, Water SA, 25, 47–55,1999.
Staaks, C., Fabris, R., Lowe, T., Chow, C. W. K., van Leeuwen,J. A., and Drikas, M.: Coagulation assessment and optimizationwith a photometric dispersion analyzer and organic characteriza-tion for natural organic matter removal performance, Chem. Eng.J., 168, 629–634, 2011.
Xiao, F., Huang, J. C. H., Zhang B. J., and Cui, C. W.: Effects of lowtemperature on coagulation kinetics and floc surface morphologyusing alum, Desalination, 237, 201–213, 2009.
Zoubolis, A. I. and Tzoupanos, N. D.: Polyaluminium silicate chlo-ride – A systematic study for the preparation and application ofan efficient coagulant for water and wastewater treatment, J. Haz-ard. Mater., 162, 1379–1389, 2009.
Zoubolis, A. I. and Tzoupanos, N. D.: Alternative cost-effectivepreparation methods of polyaluminium chloride (PAC) coagula-tion agent: Characterization and comparative application for wa-ter/wastewater, Desalination, 250, 339–344, 2010.
Drink. Water Eng. Sci., 7, 73–82, 2014 www.drink-water-eng-sci.net/7/73/2014/