optimization of biohydrogen production from beer lees using anaerobic mixed bacteria
TRANSCRIPT
i n t e r n a t i o n a l j o u r n a l o f h y d r o g e n e n e r g y 3 4 ( 2 0 0 9 ) 7 9 7 1 – 7 9 7 8
Avai lab le a t www.sc iencedi rec t .com
j ourna l homepage : www.e lsev ier . com/ loca te /he
Optimization of biohydrogen production from beer lees usinganaerobic mixed bacteria
Maojin Cui, Zhuliang Yuan, Xiaohua Zhi, Jianquan Shen*
Beijing National Laboratory for Molecular Sciences (BNLMS), Laboratory of New Materials, Institute of Chemistry, Chinese Academy
of Sciences, Zhongguancun North First Street 2, Beijing 100190, PR China
a r t i c l e i n f o
Article history:
Received 15 June 2009
Received in revised form
6 August 2009
Accepted 8 August 2009
Available online 27 August 2009
Keywords:
Beer lees
Anaerobic mixed bacteria
Biohydrogen production
Acidic pretreatment
Ferrous iron concentration
Initial pH value
* Corresponding author. Tel.: þ86 10 6262090E-mail address: [email protected] (J. Sh
0360-3199/$ – see front matter ª 2009 Profesdoi:10.1016/j.ijhydene.2009.08.022
a b s t r a c t
Beer lees are the main by-product of the brewing industry. Biohydrogen production from
beer lees using anaerobic mixed bacteria was investigated in this study, and the effects of
acidic pretreatment, initial pH value and ferrous iron concentration on hydrogen produc-
tion were studied at 35 �C in batch experiments. The hydrogen yield was significantly
enhanced by optimizing environmental factors such as hydrochloric acid (HCl) pretreat-
ment of substrate, initial pH value and ferrous iron concentration. The optimal environ-
mental factors of substrate pretreated with 2% HCl, pH¼ 7.0 and 113.67 mg/l Fe2þ were
observed. A maximum cumulative hydrogen yield of 53.03 ml/g-dry beer lees was achieved,
which was approximately 17-fold greater than that in raw beer lees. In addition, the
degradation efficiency of the total reducing sugar, and the contents of hemicellulose,
cellulose, lignin and metabolites are presented, which showed a strong dependence on the
environmental factors.
ª 2009 Professor T. Nejat Veziroglu. Published by Elsevier Ltd. All rights reserved.
1. Introduction hydrogen will be of great significance in solving environ-
In recent years, a large amount of cellulosic biomass such as
crop straws, leaves, weeds and beer lees have been burned or
discarded, which is not only a waste of resources, but also
pollutes the environment. Only in China, the annual yield of
waterish beer lees is about 10 million tons [1]. Most of them
were discarded as environmental pollutions, except that some
of them were utilized for feedstuff of livestock and fowl.
Processes which can convert cellulosic biomass into useful
products, e.g. methanol, ethanol, methane and hydrogen,
have attracted much attention. Compared with alcohols and
methane, hydrogen is superior because of its cleanness and
high energy-density (122 kJ/g) [2], which is the highest of all
known fuels. Therefore, converting cellulosic biomass into
3; fax: þ86 10 62559373.en).sor T. Nejat Veziroglu. Pu
mental pollution and energy shortage.
Recently, some studies on biohydrogen from cellulosic
biomass such as wheat straw, corn stalk, bulrush, and wheat
bran [3–8] have been carried out, however, the key issues
restricting the production of biohydrogen from cellulosic
biomass in these studies were selection of the optimal
pretreatment and the development of efficient hydrogen-
producing bacteria. Generally, the direct conversion of raw
cellulosic biomass into hydrogen by microorganisms is very
difficult due to the complicated polymer structure of hemi-
cellulose and cellulose, therefore, it is necessary to pretreat
the substrate in order to enhance hydrogen yield [9]. Nowa-
days, the main methods for pretreatment of cellulosic
biomass include steam explosion, mechanical, thermal,
blished by Elsevier Ltd. All rights reserved.
i n t e r n a t i o n a l j o u r n a l o f h y d r o g e n e n e r g y 3 4 ( 2 0 0 9 ) 7 9 7 1 – 7 9 7 87972
acidic, alkaline, ammonia, and oxidative pretreatments [3-8].
The hydrogen-producing bacteria using cellulosic biomass for
fermentation were mainly isolated from cow dung compost
[3,4], fistulated goat feed [5] and an anaerobic digester sludge
[6]. In addition, pure strains and mixed microflora were also
used as hydrogen-producing bacteria [7,8,10–12].
Bacterial metabolism during fermentation requires essen-
tial metals such as magnesium, zinc and iron. Among these
metals, iron is very important in the formation of hydrogenase
or other enzymes which are necessary for biohydrogen
production [13]. Our previous studies showed that SO42� had
no remarkable effect on hydrogen production [14,15], there-
fore, FeSO4$7H2O was used to study the influence of iron on
biohydrogen from beer lees.
According to the above background, the availability of
abundant beer lees coupled with anaerobic fermentation
resulting in hydrogen production is considered to be ideal as it
not only utilizes a renewable resource but also produces clean
hydrogen in a sustainable manner. The objective of this study
was to investigate the feasibility of producing hydrogen from
beer lees. For this purpose, the effects of HCl concentration,
initial pH value and ferrous iron concentration on hydrogen
production from beer lees were studied by anaerobic
fermentation in batch cultivation.
2. Materials and methods
2.1. Seed microorganisms
The hydrogen-producing mixed cultures used here were
enriched from cracked cereals and were dominated by Clos-
tridium pasteurianum following identification of the bacteria in
culture [16]. The cultures were acclimated in a completely
stirred tank reactor (CSTR) in a chemostat for approximately
one month. The CSTR was operated at 35 �C, with an 8 h
hydraulic retention time, and stirred by gas circulation [14]. 1 l
of culture medium used to ferment contained NH4HCO3,
3770 mg; K2HPO4, 125 mg; NaHCO3, 2000 mg; CuSO4$5H2O,
5 mg; MgCl2$6H2O, 100 mg; MnSO4$4H2O, 15 mg; FeSO4$7H2O,
25 mg; CoCl2$6H2O, 0.125 mg.
2.2. Acidic pretreatment of beer lees
The beer lees used in this study were obtained from the Five-
star Brewery, Beijing, China. 1.2 g of dry beer lees were mixed
with 20 ml of dilute HCl aqueous solution at different
concentrations (0.5%, 1%, 2%, 4%, w/v) separately (6% (w/v)
solids loading) and boiled for 30 min in serum vials. The
mixture was then neutralized to pH 7.0 by the addition of
dilute NaOH aqueous solution at different concentrations
(0.5%, 1%, 2%, 4%, w/v), respectively.
2.3. Experimental procedures
Batch experiments were carried out in 120 ml serum vials. The
total work volume was 80 ml (approximately 1.5% (w/v) solids
loading) in each case, which included approximately 40 ml of
mixture after pretreatment (20 ml of dilute HCl used to
pretreat substrate and approximately 20 ml of dilute NaOH
used to adjust pH), 20 ml inoculum, 10 ml nutrient solution (1 l
contained NH4HCO3, 30 160 mg; K2HPO4, 1000 mg; NaHCO3,
16 000 mg; CuSO4$5H2O, 40 mg; MgCl2$6H2O, 800 mg;
MnSO4$4H2O, 120 mg; FeSO4$7H2O, 200 mg; CoCl2$6H2O, 1 mg),
and approximately 10 ml distilled water. The air was removed
from the solution and the headspace by argon gas for 3 min
before the vials were capped with rubber septum stoppers and
placed in a reciprocal shaker (120 rpm). The batch experi-
ments were performed at 35 �C in the dark. Each experimental
condition was carried out in triplicate. All chemicals used in
the experiments were of AR grade.
2.4. Analytical methods
The hydrogen content was determined by a gas chromato-
graph (Techcomp. Co., China, 7890II) equipped with a thermal
conductivity detector (TCD) and a 2-m stainless steel column
packed with Porapak Q (80–100 mesh). The operating
temperatures of the injection port, the oven and the detector
were set at 70, 50 and 70 �C, respectively. Argon was used as
the carrier gas at a flow rate of 30 ml/min. At each time
interval, the total volume of biogas production was measured
by a plunger displacement method using appropriately sized
glass syringes, ranging from 10 to 100 ml [17]. The cumulative
hydrogen volume was calculated by equation (1) [18]:
VH;i ¼ VH;i�1 þ CH;i
�VG;i � VG;i�1
�þ VH;0
�CH;i � CH;i�1
�(1)
where VH, i and VH, i � 1 are cumulative hydrogen volumes at
the current (i) and previous (i� 1) time intervals, VG, i and VG,
i � 1 are the total biogas volumes in the current (i) and previous
(i� 1) time intervals, CH, i and CH, i � 1 are the fraction of
hydrogen in the headspace of the bottle at the current (i) and
previous (i� 1) intervals and VH,0 is the total volume of
headspace in the bottle. Detection of the alcohols and volatile
fatty acids (VFAs, C2–C5) were measured by a gas chromato-
graph using a flame ionization detector (FID) and a 2-m glass
column packed with Unisole F-200 (30–60 mesh). The
temperatures of the injection port, the oven and the detector
were set at 200, 165 and 200 �C, respectively. The carrier gas
was argon at a flow rate of 30 ml/min. The concentration of
the total reducing sugar was determined by the phenol–
sulfuric acid method using glucose as a standard [19]. The
contents of hemicellulose, cellulose and lignin were deter-
mined according to Van Soest’s method [20].
2.5. Model analysis
The cumulative hydrogen production in the batch experi-
ments followed the modified Gompertz equation [21]:
H ¼ P
�exp
�Rme
Pðl� tÞ þ 1
��(2)
where H is the cumulative hydrogen production (ml), P is
hydrogen production potential (ml), Rm is the maximum
hydrogen production rate (ml/h), e¼ 2.71828, l is the lag-phase
time (h), and t is the incubation time (h).The corresponding
values of P, Rm and l for each batch were estimated using
Origin 7.5, which is a scientific graphing and data analysis
software.

0 10 20 30 40 50 600
10
20
30
40
50
60
70
Cu
mu
la
tiv
e h
yd
ro
ge
n (m
l)
Time (hour)
UP
0.5%
1%
2%
4%
Fig. 2 – Cumulative hydrogen volumes from 1.2 g of dry
beer lees without pretreatment and pretreated by different
HCl concentrations (from 0.5% to 4%, w/v) versus
corresponding fermentation time. The operation was at
35 8C, 13.67 mg/l Fe2D and initial pH 7.0.
i n t e r n a t i o n a l j o u r n a l o f h y d r o g e n e n e r g y 3 4 ( 2 0 0 9 ) 7 9 7 1 – 7 9 7 8 7973
3. Results and discussion
3.1. Effect of HCl pretreatment on hydrogen production
3.1.1. Effect of HCl concentration on the saccharification oflignocellulosic biomassIt is known that the main components of cellulosic biomass
are hemicellulose, cellulose and lignin. Previous studies have
shown that pretreatment had some influence on the contents
of hemicellulose, cellulose and lignin [4,22–24]. It was reported
that the major compositions of total sugars such as xylose,
glucose and arabinose were produced after the hydrolysis of
hemicellulose in acidic environments [25]. To investigate the
effect of HCl concentration on the cellulosic biomass, the
compositions and contents in raw beer lees and pretreated
samples were analyzed and are shown in Fig. 1. As shown in
Fig. 1, it can be seen that the contents of hemicellulose
apparently decreased (43.54–1.72%) after the pretreatment
process. The contents of hemicellulose after 2% and 4% HCl
pretreatment were 6.08% and 1.72%, respectively. It was
apparent that the contents of cellulose and lignin decreased
after HCl pretreatment. Therefore, it can be concluded that
the major reaction during acidic pretreatment was the
hydrolysis of hemicellulose, which was accompanied, to some
extent, by the hydrolysis of cellulose and lignin. This showed
that dilute HCl had an excellent effect on the degradation of
hemicellulose. The content of total reducing sugar was only
3.12% in raw beer lees. After HCl pretreatment, the total
reducing sugar significantly increased, and continued to
increase (30.80–37.39%) with increased HCl concentrations
(0.5–4%). The amount of total reducing sugar with acidic
treatment was approximately 10-fold to 12-fold compared
with that of the raw substrate, indicating that HCl pretreat-
ment increased the amount of total reducing sugar. The
soluble sugar from beer lees pretreated with 4% HCl was
highest (37.39%), so the cumulative hydrogen yield was
maximal (Fig. 2).
UP 0.5% 1% 2% 4%0
10
20
30
40
Co
nte
nt
(%
dry
we
ig
h)
HCl concentration (w/v)
Hemicellulose
Cellulose
Lignin
Total reducing sugar
Fig. 1 – Contents of hemicellulose, cellulose, lignin and
total reducing sugar in beer lees without pretreatment and
pretreated by different HCl concentrations (from 0.5% to
4%, w/v) before and after pretreatment. UP means
unpretreatment.
3.1.2. Effect of HCl pretreatment on hydrogen production andhydrolysis of lignin and carbohydratesIt was reported that biohydrogen production from cellulosic
materials could be greatly increased by pretreatment [3,4,7,9].
In our previous work, the anaerobic mixed bacteria used here
appeared to have a good capacity for producing hydrogen
using monosaccharides, disaccharides and polysaccharides
as substrates [14,26,27]. In the present study, hydrogen
production from 1.2 g of pretreated beer lees and 1.2 g of raw
beer lees were compared. The cumulative hydrogen volumes
are presented in Fig. 2. As shown in Fig. 2, the hydrogen
volume from raw beer lees was only 3.79 ml, however,
a significant enhancement of hydrogen volume was achieved
after HCl pretreatment. Maximal hydrogen volumes of 62.59–
63.64 ml were observed at HCl concentrations of 2–4%. The
increment of hydrogen, however, was only 1.68%, thus 2% HCl
was considered the best choice to pretreat beer lees in view of
hydrogen yield and production costs. It is worth noting that
the excess Cl� produced did not significantly inhibit hydrogen
production. These results were different from those of
previous studies [3,4,9], which showed that high Cl� concen-
trations greatly inhibited biohydrogen production. This
inconsistency may be attributed to the different hydrogen-
producing bacteria used.
To further investigate the effect of HCl concentrations on
hydrogen production, the data in Fig. 2 were simulated using
equation (2), and the hydrogen production characteristics are
shown in Table 1. According to the data in Table 1, all R2 were
more than 0.999, indicating that the fitted curves matched
well with the experimental points. The maximum specific
hydrogen rate of 6.68 ml/h was observed at 2% HCl, indicating
that 2% HCl was the best concentration to pretreat the
substrate. The shortest duration time of 6.03 h occurred with
the raw substrate, and the changes in duration time were
small with increased HCl concentrations. This may have
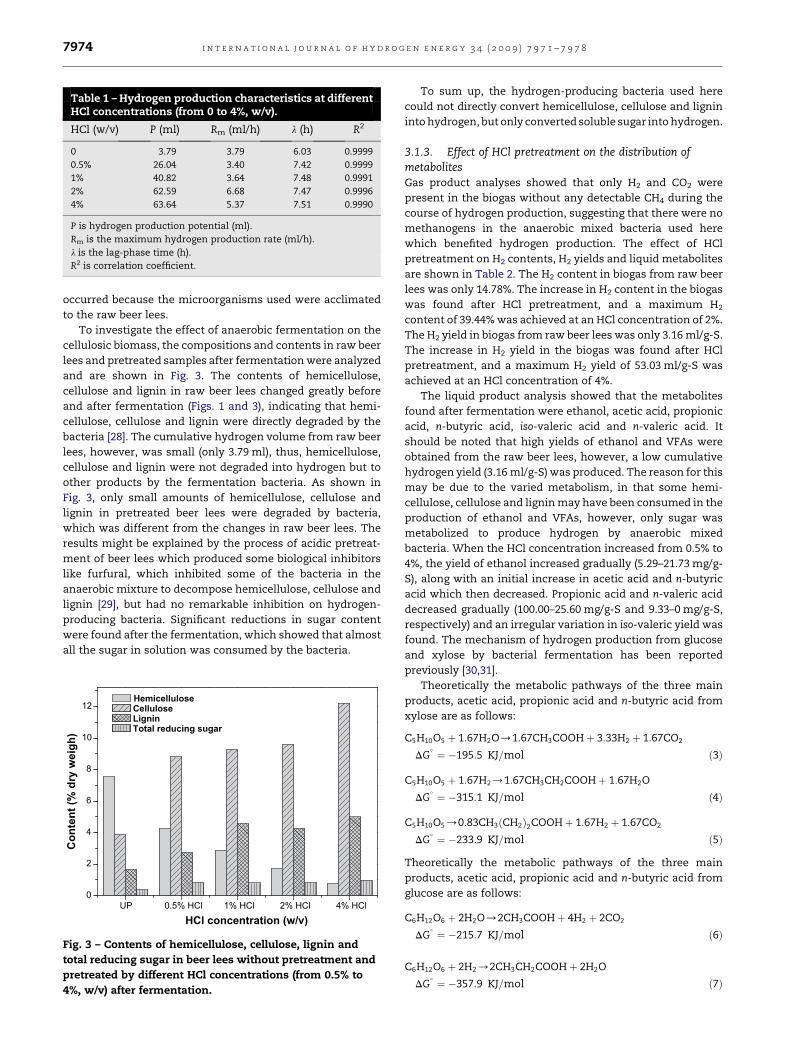
Table 1 – Hydrogen production characteristics at differentHCl concentrations (from 0 to 4%, w/v).
HCl (w/v) P (ml) Rm (ml/h) l (h) R2
0 3.79 3.79 6.03 0.9999
0.5% 26.04 3.40 7.42 0.9999
1% 40.82 3.64 7.48 0.9991
2% 62.59 6.68 7.47 0.9996
4% 63.64 5.37 7.51 0.9990
P is hydrogen production potential (ml).
Rm is the maximum hydrogen production rate (ml/h).
l is the lag-phase time (h).
R2 is correlation coefficient.
i n t e r n a t i o n a l j o u r n a l o f h y d r o g e n e n e r g y 3 4 ( 2 0 0 9 ) 7 9 7 1 – 7 9 7 87974
occurred because the microorganisms used were acclimated
to the raw beer lees.
To investigate the effect of anaerobic fermentation on the
cellulosic biomass, the compositions and contents in raw beer
lees and pretreated samples after fermentation were analyzed
and are shown in Fig. 3. The contents of hemicellulose,
cellulose and lignin in raw beer lees changed greatly before
and after fermentation (Figs. 1 and 3), indicating that hemi-
cellulose, cellulose and lignin were directly degraded by the
bacteria [28]. The cumulative hydrogen volume from raw beer
lees, however, was small (only 3.79 ml), thus, hemicellulose,
cellulose and lignin were not degraded into hydrogen but to
other products by the fermentation bacteria. As shown in
Fig. 3, only small amounts of hemicellulose, cellulose and
lignin in pretreated beer lees were degraded by bacteria,
which was different from the changes in raw beer lees. The
results might be explained by the process of acidic pretreat-
ment of beer lees which produced some biological inhibitors
like furfural, which inhibited some of the bacteria in the
anaerobic mixture to decompose hemicellulose, cellulose and
lignin [29], but had no remarkable inhibition on hydrogen-
producing bacteria. Significant reductions in sugar content
were found after the fermentation, which showed that almost
all the sugar in solution was consumed by the bacteria.
UP 0.5% HCl 1% HCl 2% HCl 4% HCl0
2
4
6
8
10
12
Co
nte
nt (%
d
ry
w
eig
h)
HCl concentration (w/v)
Hemicellulose
Cellulose
Lignin
Total reducing sugar
Fig. 3 – Contents of hemicellulose, cellulose, lignin and
total reducing sugar in beer lees without pretreatment and
pretreated by different HCl concentrations (from 0.5% to
4%, w/v) after fermentation.
To sum up, the hydrogen-producing bacteria used here
could not directly convert hemicellulose, cellulose and lignin
into hydrogen, but only converted soluble sugar into hydrogen.
3.1.3. Effect of HCl pretreatment on the distribution ofmetabolitesGas product analyses showed that only H2 and CO2 were
present in the biogas without any detectable CH4 during the
course of hydrogen production, suggesting that there were no
methanogens in the anaerobic mixed bacteria used here
which benefited hydrogen production. The effect of HCl
pretreatment on H2 contents, H2 yields and liquid metabolites
are shown in Table 2. The H2 content in biogas from raw beer
lees was only 14.78%. The increase in H2 content in the biogas
was found after HCl pretreatment, and a maximum H2
content of 39.44% was achieved at an HCl concentration of 2%.
The H2 yield in biogas from raw beer lees was only 3.16 ml/g-S.
The increase in H2 yield in the biogas was found after HCl
pretreatment, and a maximum H2 yield of 53.03 ml/g-S was
achieved at an HCl concentration of 4%.
The liquid product analysis showed that the metabolites
found after fermentation were ethanol, acetic acid, propionic
acid, n-butyric acid, iso-valeric acid and n-valeric acid. It
should be noted that high yields of ethanol and VFAs were
obtained from the raw beer lees, however, a low cumulative
hydrogen yield (3.16 ml/g-S) was produced. The reason for this
may be due to the varied metabolism, in that some hemi-
cellulose, cellulose and lignin may have been consumed in the
production of ethanol and VFAs, however, only sugar was
metabolized to produce hydrogen by anaerobic mixed
bacteria. When the HCl concentration increased from 0.5% to
4%, the yield of ethanol increased gradually (5.29–21.73 mg/g-
S), along with an initial increase in acetic acid and n-butyric
acid which then decreased. Propionic acid and n-valeric acid
decreased gradually (100.00–25.60 mg/g-S and 9.33–0 mg/g-S,
respectively) and an irregular variation in iso-valeric yield was
found. The mechanism of hydrogen production from glucose
and xylose by bacterial fermentation has been reported
previously [30,31].
Theoretically the metabolic pathways of the three main
products, acetic acid, propionic acid and n-butyric acid from
xylose are as follows:
C5H10O5 þ 1:67H2O/1:67CH3COOHþ 3:33H2 þ 1:67CO2
DG� ¼ �195:5 KJ=mol ð3Þ
C5H10O5 þ 1:67H2/1:67CH3CH2COOHþ 1:67H2O
DG� ¼ �315:1 KJ=mol ð4Þ
C5H10O5/0:83CH3ðCH2Þ2COOHþ 1:67H2 þ 1:67CO2
DG� ¼ �233:9 KJ=mol ð5Þ
Theoretically the metabolic pathways of the three main
products, acetic acid, propionic acid and n-butyric acid from
glucose are as follows:
C6H12O6 þ 2H2O/2CH3COOHþ 4H2 þ 2CO2
DG� ¼ �215:7 KJ=mol ð6Þ
C6H12O6 þ 2H2/2CH3CH2COOHþ 2H2O
DG� ¼ �357:9 KJ=mol ð7Þ
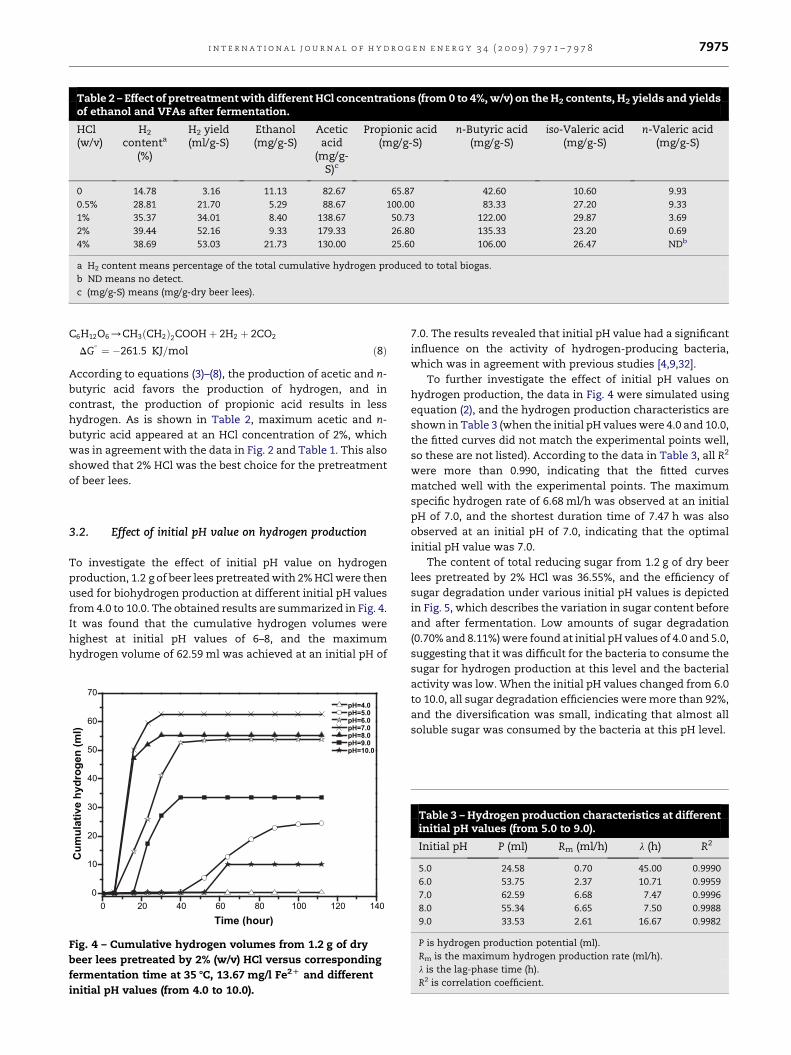
Table 2 – Effect of pretreatment with different HCl concentrations (from 0 to 4%, w/v) on the H2 contents, H2 yields and yieldsof ethanol and VFAs after fermentation.
HCl(w/v)
H2
contenta
(%)
H2 yield(ml/g-S)
Ethanol(mg/g-S)
Aceticacid
(mg/g-S)c
Propionic acid(mg/g-S)
n-Butyric acid(mg/g-S)
iso-Valeric acid(mg/g-S)
n-Valeric acid(mg/g-S)
0 14.78 3.16 11.13 82.67 65.87 42.60 10.60 9.93
0.5% 28.81 21.70 5.29 88.67 100.00 83.33 27.20 9.33
1% 35.37 34.01 8.40 138.67 50.73 122.00 29.87 3.69
2% 39.44 52.16 9.33 179.33 26.80 135.33 23.20 0.69
4% 38.69 53.03 21.73 130.00 25.60 106.00 26.47 NDb
a H2 content means percentage of the total cumulative hydrogen produced to total biogas.
b ND means no detect.
c (mg/g-S) means (mg/g-dry beer lees).
i n t e r n a t i o n a l j o u r n a l o f h y d r o g e n e n e r g y 3 4 ( 2 0 0 9 ) 7 9 7 1 – 7 9 7 8 7975
C6H12O6/CH3ðCH2Þ2COOHþ 2H2 þ 2CO2�
DG ¼ �261:5 KJ=mol ð8Þ
According to equations (3)–(8), the production of acetic and n-
butyric acid favors the production of hydrogen, and in
contrast, the production of propionic acid results in less
hydrogen. As is shown in Table 2, maximum acetic and n-
butyric acid appeared at an HCl concentration of 2%, which
was in agreement with the data in Fig. 2 and Table 1. This also
showed that 2% HCl was the best choice for the pretreatment
of beer lees.
3.2. Effect of initial pH value on hydrogen production
To investigate the effect of initial pH value on hydrogen
production, 1.2 g of beer lees pretreated with 2% HCl were then
used for biohydrogen production at different initial pH values
from 4.0 to 10.0. The obtained results are summarized in Fig. 4.
It was found that the cumulative hydrogen volumes were
highest at initial pH values of 6–8, and the maximum
hydrogen volume of 62.59 ml was achieved at an initial pH of
0 20 40 60 80 100 120 1400
10
20
30
40
50
60
70
Cu
mu
la
tiv
e h
yd
ro
ge
n (m
l)
Time (hour)
pH=4.0
pH=5.0
pH=6.0
pH=7.0
pH=8.0
pH=9.0
pH=10.0
Fig. 4 – Cumulative hydrogen volumes from 1.2 g of dry
beer lees pretreated by 2% (w/v) HCl versus corresponding
fermentation time at 35 8C, 13.67 mg/l Fe2D and different
initial pH values (from 4.0 to 10.0).
7.0. The results revealed that initial pH value had a significant
influence on the activity of hydrogen-producing bacteria,
which was in agreement with previous studies [4,9,32].
To further investigate the effect of initial pH values on
hydrogen production, the data in Fig. 4 were simulated using
equation (2), and the hydrogen production characteristics are
shown in Table 3 (when the initial pH values were 4.0 and 10.0,
the fitted curves did not match the experimental points well,
so these are not listed). According to the data in Table 3, all R2
were more than 0.990, indicating that the fitted curves
matched well with the experimental points. The maximum
specific hydrogen rate of 6.68 ml/h was observed at an initial
pH of 7.0, and the shortest duration time of 7.47 h was also
observed at an initial pH of 7.0, indicating that the optimal
initial pH value was 7.0.
The content of total reducing sugar from 1.2 g of dry beer
lees pretreated by 2% HCl was 36.55%, and the efficiency of
sugar degradation under various initial pH values is depicted
in Fig. 5, which describes the variation in sugar content before
and after fermentation. Low amounts of sugar degradation
(0.70% and 8.11%) were found at initial pH values of 4.0 and 5.0,
suggesting that it was difficult for the bacteria to consume the
sugar for hydrogen production at this level and the bacterial
activity was low. When the initial pH values changed from 6.0
to 10.0, all sugar degradation efficiencies were more than 92%,
and the diversification was small, indicating that almost all
soluble sugar was consumed by the bacteria at this pH level.
Table 3 – Hydrogen production characteristics at differentinitial pH values (from 5.0 to 9.0).
Initial pH P (ml) Rm (ml/h) l (h) R2
5.0 24.58 0.70 45.00 0.9990
6.0 53.75 2.37 10.71 0.9959
7.0 62.59 6.68 7.47 0.9996
8.0 55.34 6.65 7.50 0.9988
9.0 33.53 2.61 16.67 0.9982
P is hydrogen production potential (ml).
Rm is the maximum hydrogen production rate (ml/h).
l is the lag-phase time (h).
R2 is correlation coefficient.
4 5 6 7 8 9 10
0
20
40
60
80
100
Deg
rad
atio
n efficien
cy o
f to
tal red
ucin
g
su
gar (%
)
Initial pH
Fig. 5 – Degradation efficiency of total reducing sugar in
beer lees pretreated by 2% (w/v) HCl at different initial pH
values (from 4.0 to 10.0) after fermentation.
0 10 20 30 400
10
20
30
40
50
60
70
Cu
mu
la
tiv
e h
yd
ro
ge
n (m
l)
Time (hour)
13.67 mg/l
113.67 mg/l
213.67 mg/l
313.67 mg/l
413.67 mg/l
513.67 mg/l
Fig. 6 – Cumulative hydrogen volumes from 1.2 g of dry
beer lees pretreated by 2% (w/v) HCl versus corresponding
fermentation time at different Fe2D concentration (from
13.67 mg/l to 513.67 mg/l). The operation was at 35 8C and
initial pH 7.0.
i n t e r n a t i o n a l j o u r n a l o f h y d r o g e n e n e r g y 3 4 ( 2 0 0 9 ) 7 9 7 1 – 7 9 7 87976
The changes in initial pH values not only affected the
physical conditions of microorganisms and the dynamic
balance of NADH/NADþ in the cells, but also the types and
quantity of dominant bacteria in the mixed microbial culture
medium. The final pH, H2 contents, H2 yields and yields of
metabolites after fermentation are shown in Table 4. The
maximal hydrogen content was found to be 42.67% at pH 8.0,
and the maximal hydrogen yield was 52.16 ml/g-S at pH 7.0.
The metabolites after fermentation were ethanol, acetic acid,
propionic acid, n-butyric acid, iso-valeric acid and n-valeric
acid. As shown in Fig. 5 and Table 4, when the initial pH values
were 4.0 and 5.0, the degradation of total reducing sugar from
beer lees pretreated with 2% HCl was small, and the yields of
all the metabolites were low, thus, the activity of mixed
bacteria was low at this pH level; when the initial pH value
changed from 6.0 to 8.0, the yield of n-butyric acid was highest
(86.67–135.33 mg/g-S), indicating that n-butyric acid was the
main fermentative product at this pH level; when the initial
pH values were 9.0 and 10.0, ethanol and acetic acid were the
main fermentative products. This might be because the
activity of homoacetogens increased at high initial pH values
(9.0 and 10.0). It was reported that the concentration of acetic
acid was maximum at pH 11.0 using homoacetogens [33].
Table 4 – Effect of initial pH values (from 4.0 to 10.0) on the finaafter fermentation.
InitialpH
FinalpH
H2
content(%)
H2 yield(ml/g-S)
Ethanol(mg/g-S)
Acetic acid(mg/g-S)
Pro
4.0 3.51 1.47 0.34 8.87 17.00
5.0 4.55 23.01 20.48 6.32 55.67
6.0 4.80 37.66 44.79 8.20 64.20
7.0 6.56 39.44 52.16 9.33 179.33
8.0 7.15 42.67 46.12 8.47 250.00
9.0 7.21 32.55 27.94 12.20 331.33
10.0 7.70 41.35 8.51 11.40 456.67
In this study, hydrogen can be consumed by HCO3� to produce
acetic acid at high pH values (9.0 and 10.0) according to
equation (9), thus, the hydrogen yields decreased [34]. In
addition, with the increased yield of acetic acid, it could react
with hydrogen to produce ethanol according to equation (10),
thus decreasing the hydrogen yields [34].
4H2 þ 2HCO�3 þHþ/CH3COO� þ 2H2O DG� ¼ �70:3 KJ=mol
(9)
CH3COOHþH2/C2H5OHþ 4H2O DG� ¼ �49:51 KJ=mol
(10)
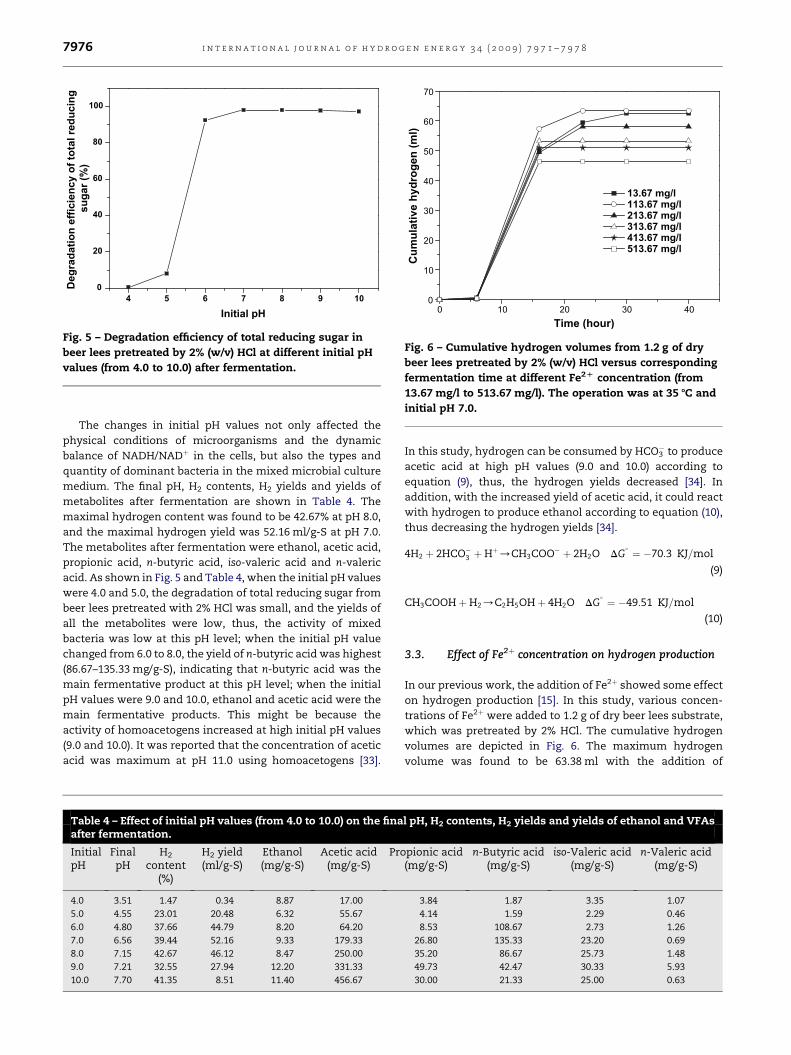
3.3. Effect of Fe2þ concentration on hydrogen production
In our previous work, the addition of Fe2þ showed some effect
on hydrogen production [15]. In this study, various concen-
trations of Fe2þ were added to 1.2 g of dry beer lees substrate,
which was pretreated by 2% HCl. The cumulative hydrogen
volumes are depicted in Fig. 6. The maximum hydrogen
volume was found to be 63.38 ml with the addition of
l pH, H2 contents, H2 yields and yields of ethanol and VFAs
pionic acid(mg/g-S)
n-Butyric acid(mg/g-S)
iso-Valeric acid(mg/g-S)
n-Valeric acid(mg/g-S)
3.84 1.87 3.35 1.07
4.14 1.59 2.29 0.46
8.53 108.67 2.73 1.26
26.80 135.33 23.20 0.69
35.20 86.67 25.73 1.48
49.73 42.47 30.33 5.93
30.00 21.33 25.00 0.63

Table 5 – Effect of Fe2D concentrations (from 13.67 mg/l to 513.67 mg/l) on the degradation efficiency of total reducing sugar,H2 contents, H2 yields and yields of ethanol and VFAs after fermentation.
Fe2þ
(mg/l)DESa
(%)H2
content(%)
H2 yield(ml/g-S)
Ethanol(mg/g-S)
Acetic acid(mg/g-S)
Propionic acid(mg/g-S)
n-Butyric acid(mg/g-S)
iso-Valeric acid(mg/g-S)
n-Valeric acid(mg/g-S)
13.67 97.47 39.44 52.16 9.33 179.33 26.80 135.33 23.20 0.69
113.67 97.43 41.86 52.82 21.07 166.00 22.53 106.00 24.40 7.13
213.67 97.59 39.43 48.43 20.00 168.00 21.53 120.00 22.33 5.55
313.67 97.70 46.87 44.37 16.33 195.33 23.20 140.00 20.33 2.97
413.67 97.76 45.89 42.49 11.53 154.67 17.33 108.67 17.40 2.53
513.67 97.67 42.61 38.56 11.07 199.33 21.00 133.33 14.73 0.47
a DES means degradation efficiency of total reducing sugar.
i n t e r n a t i o n a l j o u r n a l o f h y d r o g e n e n e r g y 3 4 ( 2 0 0 9 ) 7 9 7 1 – 7 9 7 8 7977
113.67 mg/l Fe2þ. However, concentrations exceeding this
level reduced the cumulative hydrogen volume, suggesting
that excessive Fe2þ was unfavorable for enhancing hydrogen
volume. These results were consistent with our previous
findings where we added Fe2þ to a soluble starch substrate for
hydrogen production [15].
The sugar degradation efficiency, H2 contents, H2 yields
and metabolites after fermentation are summarized in Table
5. It was found that the sugar degradation efficiency reached
more than 97% at different concentrations of Fe2þ, indicating
that almost all the sugar was consumed by the bacteria.
Hydrogen content in the biogas varied from 39.43% to 46.87%.
The maximal hydrogen yield was 52.82 ml/g-S with the addi-
tion of 113.67 mg/l Fe2þ. The metabolites in solution were
ethanol, acetic acid, propionic acid, n-butyric acid, iso-valeric
acid and n-valeric acid. The metabolic pathways of the three
main products, acetic acid, propionic acid and n-butyric acid
followed equations (3)–(8). As shown in Table 5, increased Fe2þ
concentrations thus affected the production of ethanol, iso-
valeric acid and n-valeric acid, which initially increased then
decreased, and the production of acetic acid, propionic acid
and n-butyric acid, which were found to vary irregularly. This
variation might be because the bacterial activity was influ-
enced by the Fe2þ concentration in the substrate. On the one
hand, Fe2þ which was the main component of ferredoxin or
iron–sulfur protein in the hydrogenase system directly
affected the microbial bio-oxidation and dehydrogenation
process; on the other hand, the strong reduction capacity of
Fe2þ played an important role in reducing the ORP value of the
fermentation environment and improved the metabolic
activity of hydrogen-producing bacteria [35]. Excessive Fe2þ
concentration, however, inhibited the activity of hydrogen-
producing bacteria, thereby resulting in a decline in hydrogen-
producing capability.
4. Conclusions
In this work, hydrogen production from beer lees using
anaerobic fermentation was demonstrated in batch experi-
ments. It was found that acidic pretreatment of substrate and
initial pH value was important in hydrogen production.
Maximum hydrogen yield (53.03 ml/g-dry beer lees) was ach-
ieved under 4% HCl pretreatment conditions, and was
enhanced by approximately 17-fold compared with that from
raw beer lees. Fe2þ iron was also added to the substrate to
investigate its effect on hydrogen production. The results
showed that moderate addition of Fe2þ at 113.67 mg/l
enhanced the hydrogen yield and excessive Fe2þ inhibited
hydrogen production. In conclusion, from the analysis of the
contents of hemicellulose, cellulose, lignin and total reducing
sugar before and after fermentation, we found that acidic
pretreatment may convert hemicellulose into soluble sugar
which can be consumed by bacteria for hydrogen production.
In addition, some hemicellulose, cellulose and lignin could be
directly utilized by the bacteria to produce alcohols, VFAs and
other products. Therefore, cumulative hydrogen production,
amounts of metabolites and the bacterial metabolic pathway
were strongly dependent on environmental factors.
r e f e r e n c e s
[1] Lin J, Hu Y, Wang C, Cai J. Study on producing protein feedfrom brewers grain through solid fermentation. Anhui AgriSci Bull 2009;15:56–7 [in Chinese].
[2] Boyles D. Bioenergy technology-thermodynamics and costs.New York: Wiley; 1984.
[3] Fan Y, Zhang Y, Zhang Y, Hou H, Ren B. Efficient conversionof wheat straw wastes into biohydrogen gas by cow dungcompost. Bioresour Technol 2006;97:500–5.
[4] Zhang M, Fan Y, Xing Y, Pan C, Zhang G, Lay JJ. Enhancedbiohydrogen production from cornstalk wastes withacidification pretreatment by mixed anaerobic cultures.Biomass Bioenergy 2007;31:250–4.
[5] Yue Z, Liu R, Yu H, Chen H, Yu B, Harada H, et al. Enhancedanaerobic ruminal degradation of bulrush through steamexplosion pretreatment. Ind Eng Chem Res 2008;47:5899–905.
[6] Datar R, Huang J, Maness PC, Mohaghehi A, Czernik S,Chorent E. Hydrogen production from the fermentation ofcorn stover biomass pretreated with a steam-explosionprocess. Int J Hydrogen Energy 2007;32:932–9.
[7] Ren N, Wang A, Gao L, Xin L, Lee DJ, Su A. Bioaugmentedhydrogen production from carboxymethyl cellulose andpartially delignified corn stalks using isolated cultures. Int JHydrogen Energy 2008;33:5250–5.
[8] Hawkes FR, Forsey H, Premier GC, Dinsdale RM, Hawes DL,Guwy AJ, et al. Fermentative production of hydrogen froma wheat flour industry co-product. Bioresour Technol 2008;99:5020–9.
[9] Fan Y, Zhang G, Guo X, Xing Y, Fan M. Biohydrogen-production from beer lees biomass by cow dung compost.Biomass Bioenergy 2005;31:493–6.

i n t e r n a t i o n a l j o u r n a l o f h y d r o g e n e n e r g y 3 4 ( 2 0 0 9 ) 7 9 7 1 – 7 9 7 87978
[10] Wang A, Ren N, Shi Y, Lee DJ. Bioaugmented hydrogenproduction from microcrystalline cellulose using co-culture-Clostridium acetobutylicum X9 and Ethanoigenens harbinense B49.Int J Hydrogen Energy 2008;33:912–7.
[11] Lin CY, Hung WC. Enhancement of fermentative hydrogen/ethanol production from cellulose using mixed anaerobiccultures. Int J Hydrogen Energy 2008;33:3660–7.
[12] Liu Y, Yu P, Song X, Qu Y. Hydrogen production fromcellulose by co-culture of Clostridium thermocellum JN4 andThermoanaerobacterium thermosaccharolyticum GD17. Int JHydrogen Energy 2008;33:2927–33.
[13] Junelles AM, Janati-Idrissi R, Petitdemange H, Gay R. Ironeffect on acetone–butanol fermentation. Curr Microbiol 1988;17:299–303.
[14] Zhang Y, Liu G, Shen J. Hydrogen production in batchculture of mixed bacteria with sucrose under differentiron concentrations. Int J Hydrogen Energy 2005;30:855–60.
[15] Yang H, Shen J. Effect of ferrous iron concentration onanaerobic bio-hydrogen production from soluble starch. Int JHydrogen Energy 2006;31:2137–46.
[16] Liu G, Shen Q. Effects of culture and medium conditions onhydrogen production from starch using anaerobic bacteria. JBiosci Bioeng 2003;98:251–6.
[17] Owen WF, Stuckey DC, Healy JB, Young LY, McCarty PL.Bioassay for monitoring biochemical methane potential andanaerobic toxicity. Water Res 1979;13:485–93.
[18] Logan BE, Oh SE, Kim IS, Ginkel SV. Biological hydrogenproduction measured in batch anaerobic respirometers.Environ Sci Technol 2002;36:2530–5.
[19] Dubios M, Gilles KA, Hamilton JK, Rebers PA, Smith F.Colorimetric method for determination of sugars and relatedsubstances. Anal Chem 1956;28:350–6.
[20] Lay JJ, Li YY, Noike T. The influences of pH and moisturecontent on the methane production in high-solids sludgedigestion. Water Res 1997;31:1518–24.
[21] Zwietering MH, Jongenburger I, Rombouts FM, Riet KV.Modeling of the bacterial-growth curve. Appl EnvironMicrobiol 1990;56:1875–81.
[22] Ramos LP. The chemistry involved in the steam treatment oflignocellulosic materials. Quim Nova 2003;26:863–71.
[23] Liu C, Wyman CE. The effect of flow rate of compressed hotwater on xylan, lignin and total mass removal from cornstover. Ind Eng Chem Res 2003;42:5409–16.
[24] Shevchenko SM, Beatson RP, Saddler JN. The nature of ligninfrom steam explosion/enzymatic hydrolysis of softwood.Appl Biochem Biotechnol 1999;79:867–76.
[25] Lavarack BP, Griffin GJ, Rodman D. The acid hydrolysis ofsugarcane bagasse hemicellulose to produce xylose,arabinose, glucose and other products. Biomass Bioenergy2002;23:367–80.
[26] Yuan Z, Yang H, Zhi X, Shen J. Enhancement effect ofL-cysteine on dark fermentative hydrogen production.Int J Hydrogen Energy 2008;33:6535–40.
[27] Zhi X, Yang H, Yuan Z, Shen J. Bio-hydrogen production ofanaerobic bacteria in reverse micellar media. Int J HydrogenEnergy 2008;33:4747–54.
[28] Shen J, Liu G, Hua Y, Chen S, Shen T. Preparation method offermentation broth using to biohydrogen production fromplant straws. Patent (Notice No. CN 1422956A), 2003 [inChinese].
[29] Laser M, Schulman D, Allen SG, Lichwa J, Antal MJ, Lynd LR.A comparison of liquid hot water and steam pretreatmentsof sugar cane bagasse for bioconversion to ethanol. BioresourTechnol 2002;81:33–44.
[30] Lin CY, Lay CH. Carbon/nitrogen-ratio effect on fermentativehydrogen production by mixed microflora. Int J HydrogenEnergy 2004;29:41–5.
[31] Zhu Y, Yang ST. Effect of pH on metabolic pathway shift infermentation of xylose by Clostridium tyrobutyricum.J Biotechnol 2004;110:143–57.
[32] Lo YC, Bai MD, Chen WM, Chang JS. Cellulosic hydrogenproduction with a sequencing bacterial hydrolysis and darkfermentation strategy. Bioresour Technol 2008;99:8299–303.
[33] Nie Y, Liu H, Du G, Chen J. Enhancement of acetate productionby a novel coupled syntrophic acetogenesis withhomoacetogenesis process. Process Biochem 2007;42:599–605.
[34] Oh SE, Ginkel S, Logan B. The relative effectiveness of pHcontrol and heat treatment for enhancing biohydrogen gasproduction. Environ Sci Technol 2003;37:5186–90.
[35] Lee YJ, Miyahara T, Noike T. Effect of iron concentration onhydrogen fermentation. Bioresour Technol 2001;80:227–31.