biohydrogen production by dark fermentation: from
TRANSCRIPT

!UNIVERSITÀ DEGLI STUDI DI MILANO
Facoltà di Agraria Dipartimento di Scienze Agrarie e Ambientali
Corso di Dottorato in Ecologia Agraria XXVI ciclo
Tesi di Dottorato
Biohydrogen production by dark fermentation: from laboratory to full scale
Ester Manzini Matr. R09019
Tutor: Prof. F. ADANI Coordinatore: Prof. G. ZOCCHI
Anno accademico 2013/2014

1.Introduction……………………………………………………………….…….. 1 1.1 Energy from biomass……...…………………………………………………. 2 1.2 Anaerobic digestion (AD)……………………………………………………. 4 1.3 Hydrogen…………………………………………………………………….. 7 1.3.1 Characeristics……………………………………………………………... 7 1.3.2 Hydrogen in fuel cells…………………………………………………….. 8 1.3.3 Hydrogen production……………………………………………………… 9 1.3.4 Hydrogen from biomass…………………………...……………………… 10 1.4 Hydrogen from AD………………………………………………………….. 11 1.4.1 Hydrogen-producting microorganisms……………………………………. 13 1.4.2 Substrate for AD…………...……………………………………………… 14 1.4.3 Process variables…………..……………………………………………… 15 1.5 Two-stage anaerobic digestion………………..……………………………. 17 1.6 References…………………………………………………………………… 19 2. Predicting biohydrogen production by dark fermentation using biomass chemical composition…………………………………………………………….. 23 2.1 introduction…………………..……………………………………………… 24 2.2 Materials and methods…………………………..…………………….…….. 25 2.2.1 Organic matrices…………………………..……………………………… 25 2.2.2 Bio-H2 potential production (BHP)…………………….………..……….. 26 2.2.3 Chemical characterization…………………..……………………………. 26 2.2.4 Statistical approach……………………………..………………………… 27 2.3 Results and discussion……...………………………...……………………… 28 2.4 Conclusions………………………………………………………………..…. 31 2.5 References……………………………………………………………………. 31 2.6 Addendum……………………………………………………………………. 35
3. Two-stage instead of one-stage anaerobic digestion can really increase energy recovery from biomass……………………………………………….………….
37 3.1 Introduction……………………………..…………………………………… 38 3.2 Materials and Methods…………………………………..………………….. 39 3.2.1 Hydrogenic process optimization (1st stage)………………………………. 40 3.2.2 Methanogenic process (2nd stage and single-stage)………………………. 43 3.2.3 Measurements and analytical methods………………………………...….. 44 3.2.4 Total energy recovery calculation……………………………………….... 44 3.3 Results ……………………………………………………………………..… 45 3.3.1 Biohydrogen productions and yields……………………………………... 45 3.3.2 Chemical characterization of raw and treated materials………………….. 50 3.3.3 Methanogenic process yields……………………..………………………. 53 3.3.4 Energy recovery…………………………………..………………………. 53 3.4 Discussion………………………………………..………………………….. 55 3.5 Conclusions………………………………………………………..…………. 57 3.6 Reference list……………………………………………………...…………. 57 4. Three-stage technology to couple anaerobic digestion and microbial fuel cells. 60 4.1 Introduction…………………………………………..……………………… 60 4.2 Materials and methods…………………………………………..…………… 62 4.2.1 Anaerobic Digestion (Single-, First- and Second stage)…………………. 62

4.2.2 Third stage: Electrodes and bioreactors……………………..…….……… 64 4.2.3 Chemical analysis………………………….……………………….……. 65 4.3 Results and discussion……………………………………..………………… 65 4.3.1 AD reactors…………………………………..………..………………….. 65 4.3.2 MFC……………………………………….………….………………….. 70 4.5 Conclusions………………………………………...………………………… 73 4.6 References…………………………………………………………….……… 73
5. Anaerobic digestion for the production of hydrogen and methan: from laboratory to full scale…………………………………...……………………… 77 5.1 Introduction…………………………………………………………….…….. 77 5.2 Materials and methods……………………………………………...….…….. 81 5.2.1 Lab reactors……………………………………………..……..………….. 81 5.2.2 The plant….…………………………………………………..…………… 83 5.2.3 Chemical analysis…………………………………….…………..……….. 86 5.3 Results…………………………………………………………………….….. 86 5.4 Conclusions……………………………..…………………………….……… 94 5.5 Supporting informations……………………………………...……………… 95 5.6 References……………………………………………………………………. 96 6. Conclusions………………………………………………………….…………. 98 7. Acknowledgements…………………………………………………………….. 100 !

! 1!
1. INTRODUCTION
The need for energy worldwide has been increasing exponentially, especially in these last years; the
reserves of fossil fuels have decreased, and their combustion has serious adverse effects on the
environment due to CO2 emissions.
Fossil fuels are causing massive climate changes and are thus seriously upsetting the ecosystem in
all world regions, in particular considering the modification in the average temperature of Earth's
atmosphere, a phenomenon influenced by many factors, included greenhouse effect.
To some extent, this is a natural phenomenon meant to heat the planet’s surface, but over the last
decades human activities have become the major contributor to a worrying increase of this process.
After the Industrial Age, human activities caused the atmosphere’s composition to change. While
the most abondant atmospheric gases (nitrogen and oxygen) are not involved in the increase of
greenhouse effect, other compounds such as CO2, methane, nitrogen oxides absorb infrared
radiations and contribute to the effect.
To reduce greenhouse gases emissions a transition to large-scale production of energy from
renewable sources is required.
This step is not yet feasible in the short term, because the current state of technology to produce
renewable energy is not competitive compared to fossil fuels.
Before obtaining a significative transition to these technologies is therefore necessary to ensure
affordability and thus lower production costs.
For these reasons, many researchers have been working to explore new sustainable energy sources
to replace fossil fuels.
In ordert to cope with climate change, in 2007 the European Union adopted an energetic plan,
knowk as “20-20 by 2020 plan”, wich states:
- an independent EU commitment to achieve a reduction of at least 20% of greenhouse gas

! 2!
emissions compared to 1990 levels by 2020, and the goal of reducing emissions by 30% by 2020,
subject to the conclusion of an international agreement on climate change;
- a binding target for the EU of 20% of energy from renewable sources by 2020, including a 10%
target for biofuels.
Renewable energy sources can be used in a continuous way withous exhaustion and can renew their
availability in short time; unlike fossil fuels, their use produces less environmental pollution.
According to italian regulations ((DL 29 dicembre 2003, n.387, Art.2), the following can be
considered renewable sources:
- Solar energy (thermal and photovoltaic);
-Hydropower;
-Wind energy;
-Wave energy;
-Tidal energy;
-Geothermal energy;
-Energy from biomass (biogas, vegetal oils and biodiesel, bioethanol, chips).
Biohydrogen production from microbial anaerobic digestion allows to obtain a high-quality fuel
with very low dangerous emissions (its combustion only produces water).
1.1 Energy from biomass
The concern about the instability of supply of fossil fuels, the limits of their reserves and, not least,
environmental pollution and climate change have brought a new vision of the use of biomass for
biorefinery concepts where biomass is used as a raw material in place of fossil fuels for the
production of biofuels, chemicals, solvents, etc. by biological conversion processes.
Biomass is the natural, more complex form of solar energy storage.
This, in fact, allows the plants to convert atmospheric carbon dioxide into organic matter through
the process of photosynthesis.

! 3!
Biomass also has the important property of preserving intact its energy until it is used, although in
general it has a moderate calorific value. The use of biomass as an energy source is considered
"clean" because it is assumed that the inorganic carbon produced by combustion is then fixed into
organic carbon through photosynthesis during the reforming of biomass that need to be restored in
order to achieve a carbon balance and zero net emissions.
The term “biomass” refers both to energy crops and byproducts as wastes, manure, vegetable and
pruning wastes, organic fraction of municipal wastes and many more, suitable for a forther energy
esctraction.
The main energy uses of biomass are aimed at the direct production of energy, usually by
combustion (bioenergy), the synthesis of biofuels and the synthesis of solid products derived from
the fibers present in the biomass (building materials, bioplastics ...).
Biomass can be exploited through processes of biochemical conversion (for biomass with C/N ratio
of less than 30 and humidity higher than 30% when collected) which allow to obtain energy from
chemical reactions with the help of enzymes, fungi and micro-organisms. If C/N ratio is higher than
30 and humidity is low, as in ligno-cellulose rich products, thermochemical conversion processes
are preferred.
Regarding biofuels, ethanol, which can be used as fuel for internal combustion engines in lieu of
gasoline, can be derived by fermentation of plants rich in sugar, such as sugar cane, beet and corn.
By squeezing of oil-rich plants (sunflower, soy, rapeseed) biodiesel is obtained.
Some types of biomass, such as wood, do not need to undergo treatment; others, such as vegetable
or municipal waste, must be processed, for example in a digester.
Biomass also have limitations that are related to their own production:
-Availability: with the exception of solid municipal wastes, cultivated biomass (crops) are not
available throughout the year and therefore require large areas for the storage of material;
-Yield per hectare: in contrast to traditional fuels, which are generally found in large deposits, the
production of biomass generally occurs on wide areas and this is perhaps the main limitation to the

! 4!
use of biomass.
Since conventional energy resources (oil and natural gas) are being depleted, it is necessary to
exploit these new alternative energy sources through a policy that encourages research and
development.
1.2 Anaerobic digestion (AD)
Methane formation is a biological process that takes place naturally when the organic material
(biomass) is decomposed in a humid atmosphere and in absence of oxygen by a group of
metabolically active microorganisms (methanogens). Methane gas, poorly soluble in water, passes
to the gaseous phase, while the carbon dioxide is distributed in the gas phase and in the!liquid.
Fig.1.1: AD phases

! 5!
Degradation and hydrolysis.
Degradation and hydrolysis are processes that lead to the breaking and solubilization of complex
organic molecules to soluble substrates. The starting substrates are complex mixtures of
particulates, macromolecules of carbohydrates, proteins and lipids. The degradation, therefore,
includes a series of steps as the lysis, the non-enzymatic decomposition, phase separation and
rupture molecular physics. The process is catalyzed by enzymes that degrade carbohydrates,
proteins and lipids, respectively, to monosaccharides, amino acids and long chain fatty acids.
The enzymatic hydrolysis is actually a complex multi-stage process for carbohydrates, proteins and
lipids, which may include the production of multiple enzymes, and the steps of diffusion,
adsorption, reaction and enzymatic inactivation.
Acidogenesis
The degradation of soluble sugars and amino acids, resulting from the previous hydrolytic step to a
series of simpler compounds.
Given that the yields in free energy are usually quite high, acidogenic reactions can occur at high
concentrations of hydrogen or formate and at rather high biomass levels.
Acetate, propionate and butyrate are the major end products of monosaccharides’ acidogenesis and
will be degraded differently from subsequent reactions.
Lactate and ethanol are two intermediates of the digestion process, in particular with regard to the
great influence of pH on the production of hydrogen (Zheng e Yu, 2005; Chen et al., 2002).
In fact lactic acid has a low pKa (3.08) and a large effect on pH; ethanol, on the other hand, with its
lower pKa value and less influence the pH, is significantly present in the production of biohydrogen
as a product of direct monosaccharides degradation and often as an alternative acetate at low
operative pH values (pH < 5; Ren et al., 1997).
The lactate is then further degraded, always for acidogenesis, to propionate and acetate.

! 6!
Acetogenesis
Starting from the substrates formed during the hydrolysis and acidification steps, acetogenic
bacteria produce acetic and formic acid, carbon dioxyde and hydrogen.
During the production of acetic acid, the presence of molecular hydrogen in the medium can lead
to problems of inhibition.
Methanogenesis
The production of methane can occur through two different pathways of reactions:
- dismutation of acetic acid by anaerobic acetoclastic bacteria with formation of methane and
carbon dioxide
-by hydrogenotrophic bacteria, with the reduction of carbon through anaerobic oxidation of
hydrogen to methane.
As was previously mentioned, the hydrogen and formate created in the acetogenic phase must be
kept at low concentrations and thus are consumed by the methanogenic microorganisms.
With their activities, methanogenic bacteria have two important functions in the anaerobic food
chain: they degrade acetic acid and formic acid to methane by removing acids from the medium and
thus preventing the inhibition of degradation of the substrates organic due to excessive acidity, and
on the other hand they maintain the hydrogen concentration at low levels so as to allow the
conversion of long chain fatty acids and alcohols to acetate and hydrogen. In fact, if
hydrogenotrophic pathway is slowed down, an accumulation of hydrogen in the mean is observed,
with consequent inhibition of methane production, while the way acetoclastic pathway can undergo
phenomena of substrate inhibition in presence of high concentrations of acetic acid.
Inside a reactor, therefore, the low energy yield of methanogenesis forces the involved
microorganisms to co-operate very efficiently and to establish sintrophic relationships, a
thermodynamical sinergy. This is defined as the cooperation between two organisms in which both
depend on each other and this mutual dependence can not be replaced by the addition of nutrients.

! 7!
Anaerobic digestion can be used for production purposes through bio-reactors,
structures to nurture and maintain a productive and viable bacterial consortium in
able to degrade continuous biomass to obtain biogas.
The production of methane by anaerobic fermentation of sewage and waste (including
pig slurry, manure, and the organic fraction of separated waste) is a process already
widely applied. In this system, hydrogen is an intermediate of the process which, however, is not
available as it is quickly used and converted to methane by methanogenic microorganisms.
1.3 Hydrogen
The interest around the hydrogen was born in the early 70s after the first oil crisis and growing
concerns about the environment, seeing significant benefits in terms of improved air quality and
reduction of energy dependence on oil imports.
That interest quickly subsided after the decline of oil prices in the mid-80s, and then reappear in the
early 2000s, driven in particular by the search for energy strategies to reduce greenhouse gas
emissions and the new surge in energy prices fossil.
1.3.1 Characteristics
Hydrogen has the following characteristics:
- It is the most present element in the universe, constituting three-quarters of all matter, but in a free
form it represents only 0.07% of atmosphere and 0.14% of the earth's surface;
- Has a high calorific value (3042 cal/m3) and the highest energy content per unit mass of all the
known fuel (143 GJ / t);
- Is the only common fuel is not chemically bound to carbon and can be used for energy generation
in technologies characterized by a very low rate of emissions. Especially in fuel cells, a particular
form of electrolytic cell, hydrogen can generate heat and electricity with only emission of water
vapor, which can be recycled to produce additional hydrogen(Nath e Das, 2003). Its combustion is

! 8!
thus free of emissions of oxides of carbon, even if the high temperatures produce high rates of
nitrogen oxides (Zurawski et al., 2005). In conclusion, it is generally harmless to human health and
environment, since it does not contribute to the greenhouse effect, the consumption of ozone and
acid rains.
1.3.2 Hydrogen in fuel cells
Currently the principal use of hydrogen is the synthesis of ammonia, which absorbs 49% of the
production, 37% is employed in the processes of petroleum refining, 8% for the production of
methane and about 6% for the production of various substances (Stiegel and Ramezan, 2005). A
promising technology for the use of hydrogen is that of the fuel cells (fuel cells, FC), able to
directly transform the energy of the fuel into electrical energy by electrochemical pathway. Even in
devices of small size (on the order of 10 kW), this process achieves higher yields than the
thermodynamic cycles used in conventional conversion systems, comparable to the best generation
technologies currently used in large power plants (combined cycle). The high electrical yields lead
to savings in terms of primary resources (fuel), but also to a reduction in emissions of greenhouse
gases (carbon dioxide) and a substantial elimination of pollutant emissions. A fuel cell is an
electrochemical generator in which a fuel (typically hydrogen) and an oxidant (oxygen or air) enter
and it produces continuous electric current, water and heat. Differently from common batteries, in
the fuel cell, the active material is renewed continuously and therefore the direct electric current can
be delivered indefinitely if you keep the supply of fuel and oxidant gases.
An aspect of fundamental importance for the applications of fuel cells, is represented by the fact
that the effluents (water and exhaust gases), which must be continually removed from the cell, do
not contain pollutants and are not harmful to the environment. Despite its enormous potential, fuel
cells techinolgy is not yet considered mature: performances are to be improved and production costs
are not yet compatible with commercial applications of reference.
Even if it is currently being used as fuel for rocket motors, there is no doubt that in the future the

! 9!
greater use of hydrogen will reside in the transport sector. In fact, in addition to reducing the
emission of pollutants, hydrogen fuel cells show yields two to three times greater than the current
gasoline-powered engines (Nath e Das, 2003).
1.3.3 Hydrogen production
Although hydrogen is the most abundant element in the universe, it does not exist naturally in large
quantities or concentrations on Earth, but it must be produced from other substances, such as fossil
fuels, water, biomass, etc. Currently, hydrogen can be produced in different ways.
From fossil fuels:
- Steam reforming;
- Thermal cracking;
- Partial oxydation;
- Coal gasification;
From biomass:
- Pyrolisis;
- Gasification;
- Microbial conversion;
From water:
- Electrolysis;
- Photolysis;
- Thermochemical processes;
- Thermolysis or direct thermical decomposition;
The biological production of hydrogen seems to be particularly promising: it is a set of those
technologies that use microorganism-lead processes.
This kind of process shows several advantages:
- It primarily operates at temperature and pressure valuse similar to ambiental ones (30-50 ° C, 1

! 10!
atm) and has therefore a low energetic impact;
- It Is a process of considerable environmental compatibility pointing to tread a new path for the use
of inexhaustible energy resources;
- Can take advantage of various waste materials, facilitating the reuse of waste, at least in their
organic fraction.
This technology fits perfectly among the strategies of sustainable development, since it is an
integrated technology that combines the energy recovery with waste treatment (Li, 1999).
Considering that the reserves of fossil fuels (especially oil) are being consumed at an alarming rate,
the production of hydrogen through the exploitation of alternative sources seems to be an
imperative for the immediate future.
1.3.4 Hydrogen from biomass
Biomass is the most versatile renewable source and can be used, as seen above, for the production
of biohydrogen(Nath e Das, 2003). The biomass has the fundamental characteristic of being a
renewable source, but thanks to its versatility the list of species of plants, of the intermediates and
of waste materials potentially suitable as a substrate is almost unlimited.
The main biomass resources include agricultural crops and their waste products, ligno-cellulosic
products such as wood and wood waste, waste from food processing, algae and aquatic plants and
waste products in anthropic environments.
Numerous processes allow the production of hydrogen from biomass:
1. Thermochemical gasification coupled to the reaction of "water-gas shift";
2. Fast pyrolysis followed by reforming of bio-oil carbohydrates fractions ;
3. Solar direct gasification;
4. New and different gasification processes;
5. Conversion of syngas derived from biomass;

! 11!
6. Supercritical conversion;
7. Microbial conversion .
The latter process is widely varied, depending on the microorganisms and the physical and
metabolical conditions in which H2 production occurs.
Some microorganisms in nature can in fact produce hydrogen: through biotechnology is not only
possible to take advantage of the work of these microorganisms, but also change the key enzymes
through genetic engineering techniques or transfer such components to more efficient and
productive bacteria.
Overall, the microbial production of hydrogen can be classified as follows:
-Direct and indirect biopyrolysis of water through algae and fotobacteria;
- Microbial water shift reaction
- Photodegradation of organic compounds by photosynthetic bacteria;
- .Hydrogen production by fermentation of organic compounds;
- Hybrid systems using photosynthetic and fermenting bacteria.
In general, if the organic compounds are the sole source of carbon and energy to provide metabolic
energy, the process is called "dark fermentation", but if additional light energy is required, the
process belongs to the category of photobiological processes.
1.4 Hydrogen from AD
Biological production of hydrogen by microbial fermentation of biomass at first was not considered
promising by scientists, when compared to photosynthetic techniques, despite its general lower
complexity(Zurawski et al., 2005).
Das and Vaziroglu (2001) and Nath and Das (2004) point out three factors in favour of the
fermentative process:
1. the fermentative bacteria have very high production rates of hydrogen;
2. these bacteria can produce hydrogen from organic substrates steadily, day and night, not

! 12!
requiring additional light.
3. they have good growth rates without suffering the inhibitory effects of oxygen.
The current growing worldwide interest in the "dark hydrogen fermentation" is even more evident
when considering that:
-all power plants in the past were centralized systems with a power of not higher than 30 MW; on
the contrary today the development of fuel cells has made decentralized systems more attractive. In
this case, power plants can be located close to sources of raw material, reducing the cost for
material transport;
- Hydrogen and methane can be produced by a consortium of microorganisms, using different
sources of carbohydrate;
- The carbon dioxide resulting from the process is emitted exclusively in the production site, which
facilitates its subsequent use;
- The accumulation of knowledge and advances in genetic research may allow a better control of
cellular metabolism.
The term “fermentation “generally indicates a process in which the initial organic compound is
partly oxidized and partly reduced. In absence of electron acceptors supplied from the outside,
balanced redox reactions of organic compounds are carried out, with release of energy. (Brock et
al., 1996).
Microbial hydrogen production is a ubiquitous phenomenon in conditions of anoxia or
anaerobically, or in the absence of oxygen as the electron acceptor. A large variety of bacteria uses
the reduction of protons to hydrogen to eliminate the reducing equivalents derived from the primary
metabolism. In aerobic conditions, oxygen is reduced to water; in anaerobic environments, other
elements must act as electron acceptors(Nandi and Sengupta, 1998).
Despite the microbial production of hydrogen is a ubiquitous phenomenon, generally the release of
hydrogen from organic waste batteries or sewers is not evident. The reason is that in natural
environments, numerous bacteria consume hydrogen, using H2 as a source of reducing power; for

! 13!
this reason in nature is not normally possible to witness a net production of hydrogen.
1.4.1 Hydrogen-producting microorganisms
From a practical point of view, controlling fermentative microorganisms means maximizing the
amount of hydrogen producible. Even isolation and possible enrichment steps are delicate
processes, as much as the correct choice of the composition of the culture medium anaerobic.
Hydrogen-producing microorganisms can be divided into three categories (obligate anaerobes,
facultative anaerobic and aerobic) on the basis of their dependence on oxygen. Obligate anaerobes
are organisms that do not require oxygen for their vital functions, do not use it as an oxidizing agent
for the demolition of nutrients and can not live in the presence of oxygen. Microorganisms of the
genus Clostridium were found to be dominant in the process of anaerobic fermentation of hydrogen.
These organisms are anaerobic bacilli, capable of forming spores in the case of adverse
environmental conditions, ubiquitous (present in the soil, water, sewers ...) and for the most part are
harmless forms of saprophytes.
The facultative anaerobic microorganisms are resistant to oxygen (and therefore able to live both in
the presence and absence of O2), they can quickly consume oxygen, restoring anaerobic conditions
inside the fermenter. This feature represents a major technical advantage of facultative anaerobes
compared to obligate anaerobes: the latter, being very sensitive to oxygen, often do not survive in
minimal concentrations of O2. Enterobacter is the most abundant genus among the facultative
anaerobes, it has high rates of growth, using a wide range of sources of carbon and its hydrogen
production is not inhibited by high partial pressures of H2. Compared to Clostridia, however, it
normally provides lower yields in H2/mol mol glucose.
With the term “termophilic” refers to a collection of organisms, belonging to the broader class of
extremophiles, which can live and multiply at relatively high temperatures, i.e. above 45 ° C. The
ideal habitat of thermophilic is represented by the regions of the Earth characterized by geothermal
activity, as in the case of thermal waters and estuaries of deep sea hydrothermal vents, and where

! 14!
there is decaying organic matter, as in the case of peat bogs and compost. Thermophiles can be
either forced and optional: obliged termophilic bacteria necessarily require high temperatures in
order to grow, while facultative ones can develop both at high and lower values of temperature.
In case of the isolation of microflora from different sources (eg soils, anaerobic digesters or from
organic waste and sludge from waste water of the kitchens) the obtained population will be a mixed
colture. This system usually requires the preparation of enrichment cultures by forced aeration of
sludge or heat treatment to inhibit the activity of hydrogen-consuming microorganisms present and
ensure the survival of anaerobic bacteria spores. Considering how likely contamination of pure
coltures is, the use of mixed cultures obtained from organic waste seems to be particularly
advantageous for purely industrial applications.
1.4.2 Substrate for AD
The two main aspects to consider when choosing a substrate to produce hydrogen through dark
fermentation are the range of organic compounds availability and the quality of the material used.
From a thermodynamic point of view it is preferred the conversion of carbohydrates to organic
acids and hydrogen, as this ensures the highest yields of hydrogen per mol of substrate. These
carbohydrates can be monosaccharides (glucose, isomers of hexoses, etc..) but also polymers.
Considering the large number of microbial species able to produce hydrogen, it is possible to
generalize that most of the carbohydrates are a suitable substrate to dark fermentation while
proteins, peptides and amino acids are less adequate.
According to some studies ((Noike and Mizuno, 2000; Yu et al., 2002) different forms of organic
wastes are usable, from solid ones like hay to liquids like industrial wastewaters. The use of waste
and sewage rich in carbohydrates and low in nitrogen from the agricultural and food industries
seems a viable option, considering the problem of the cost of raw materials.
It is expectable that the production of economically interesting substrates will require, in time, the
development of methods of pre-treatment with low-cost and low energy demand.

! 15!
it is clear that from a practical and applicative point of view waste products containing cellulose,
easily degradable sugars (such as sawdust or prunings and clippings) and in expansion with the
increase of industrial and agricultural processes are preferable to substrates pure glucose and
sucrose.
Tsygankov (2007) suggests in particular two distinct strategies for the treatment of waste cellulose
for the production of hydrogen: the integration of the processes of degradation of cellulose and
production of hydrogen in a single bioreactor or preliminary hydrolysis (chemical or enzymatic) of
waste to give sugars, followed by the transfer of output to bioreactor.
1.4.3 Process variables
Much of the latest research on the possibility of maximizing the production of hydrogen by
fermentation have focused on the optimization of the process and the determination of the best
choices of sources of inoculum, pretreatment methods of inoculum itself, of fermentable substrates
and environmental conditions of the reactors.
The main possibilities for intervention to improve the fermentation process is the adjustment of the
variables that affect microorganisms.
Nutritional limitations
First of all, cell growth can be restrained by nutritional limitations, leading to higher yields of
hydrogen through the increase in catabolic activity. Putting the coltures under unbalanced nutrition
conditions can lead to growth difficulties for the microflora, but at the same time it can prolong the
conversion of the substrate to hydrogen (Benemann, 1996).
Thermical shock
Zurawski et al. (2005) analyzed the effect of heat shock pre-treatment on the microflora of sludge
from waste water, a strategy to inhibit the bioactivity of hydrogen-consuming bacteria, such as
methanogens, and to enrich the concentration of spore-producing bacteria. In fact, most of the
hydrogen-producing bacteria can form endospores in the presence of unfavorable environmental

! 16!
conditions (temperature, chemical toxicity, etc.).. The treatment is carried out in a water bath at 80 °
C for 30 minutes.
Other authors such as Kim et al., 2004 tried a thermical shock at 90°C for 10 minutes, while Van
Ginkel et al., 2001 tried 104°C for 120 min.
pH
The optimum pH for the production of hydrogen ranges from 5 to 6; an active control of the pH
within the reaction’s environment appears to be essential, since pH tends to fall below the correct
range due to the formation of VFA during fermentation processes. Lee et al (2002) show how the
batch reactors without pH control rapidly decrease the production of hydrogen, due to inhibition by
pH.
One of the most recent proposals in the context of the production of H2 in a two-stage reactor,
separating the methanogenic phase from the hydrogenic one, is that of Kraemer and Bagley (2005)
that reduces by 40% NaOH necessary to control pH through the recirculation of the effluent from
the methanogenic stage to the hydrogenic one.
Methanogens’ inhibition
Several studies on hydrogen production by fermentation processes, traditionally single-stage, have
dealt with the problem of inhibition of methanogens, identified as the main responsible for the rapid
consumption of hydrogen. The three most used strategies are:
-heat shock : inoculum is heated to 100°C or higher to inactivate hydrogenotrophic bacteria and
concentrate sporigens anaerobic ones;
-pH control: inhibition/inactivation of methanogens through low pH values;
-use of bromoetansulphate (BES): supposed inhibitor of methanogens, it did not provide expected
results; too high concentrations required.
Research to maximize hydrogen yields led to identify the use of two stages reactors, with the
physical separation of hydrogen-producing bacteria and methanogens; this is a possible fourth way
to control the bacterial consortia in the digestors. Still, heat shock and low pH are advised.

! 17!
Nitrogen blowing
If already in 2000, Mizuno et al. (2000 ) reported an increase in the production of hydrogen of 68%
after the injection with nitrogen, Liu et al . (2006 ) reported an even higher increase of 88% thanks
to the injection of treated biogas (carbon dioxyde- and sulphide-free) at a constant flow rate of 120
ml h – 1.
This phenomenon is explained by the decrease of the partial pressure of hydrogen and the carbon
dioxide concentration in the reactor . In fact, these two factors greatly influence the synthesis
pathway : high hydrogen partial pressures lead to a greater production of reduced substrates (such
as lactate , ethanol , acetone, or alanine ) , while high concentrations of carbon dioxide favor the
production of fumarate or succinate . Another possible explanation is related to the removal of
carbon monoxide from the system, which affects the bacterial metabolism by pushing it from the
production of hydrogen to the production of solvents (eg ethanol) .
1.5 Two-stage anaerobic digestion
As already mentioned the two-stage anaerobic digestion is an interesting application of the
fermentation process as it allows to obtain, from the two stages, separate production of two types of
biogas, one characterized by a high content of methane (second stage) and the 'other characterized
by a high content of hydrogen (the first stage).
!

! 18!
Fig.1.2: two-stage process.
This process is a recent discovery (Kyazze et al., 2007; Liu et al., 2006; Ueno et al., 2007); the
separation of hydrolysis/acetogenesis and methanogenesis allows to enhance the single processes,
thus leading to higher speed and reaction yields ((Fox and Pohland, 1994).
This system has proven to be particularly reliable and stable for waste with high biodegradable
wastes such as fruits and vegetables.
This is due to the fact that the rapid hydrolyzation and acidification which would lead to a lowering
of the pH, with accumulation of volatile fatty acids inhibiting the methanogenic biomass, takes
place in the first reactor, while preserving the second from this kind of problems(Pavan et al.,
2000).
Many other studies proved the feasibility of this method (Cai et al., 2004; Liu et al., 2006), but they
are more focused on the optimization of both single stages (Antonopoulou et al., 2008; Venetsaneas
et al., 2009).
It is necessary to optimize the entire system to a higher overall energy production. In addition, the
mechanisms involved in the two-stage process and the microbial communities have not been
investigated and clarified yet, because they are crucial points to a deeper understanding of the
process.
The interest for the two stage systems grew in response to some studies that report that, in addition
to the production of hydrogen on the first stage, the use of pre-digested material in the second stage
maximize the production of methane(Lay et al., 1999).
If the traditional single-stage process lead to generate biogas with a CH4 content of 55-60%, the
biogas produced in the second stage may in fact contain up to 80%. Managing separately microbial
environments of the two stages allows to optimize the production of each also acting on the
different volumetric ratios, in order to take into account the different speeds of individual metabolic
phases and avoid choking typical process of a "cascade".

! 19!
At the end of hydrogenic phase the effluent presents a high content in
VFA, and this represents an ideal substrate for the subsequent methanogenic phase; having separate
stages so makes it possible to dose the amount of effluent input, without acting directly on the
metabolism of the first stage.
It was also demonstrated that the combined production of H2 and CH4 in two-stage AD has the
potential to produce 30% more energy compared to the traditional single-stage process(Liu et al.
2006, Luo et al. 2011).
Furthermore, the mixture of methane and hydrogen has many advantages compared to only
methane: it can improve engine efficiency and reduce emissions of CO2 and CO (Akansu et al.,
2004).
1.6!References
Zheng, X.J., Yu, H.Q. (2005) Inhibitory effects of butyrate on biological hydrogen production with
mixed anaerobic cultures. Journal of Environmental Management, 74, pp.65–70.
Chen C.C., Lin C.Y., Lin M.C., 2002. Acid-base enrichment enhances anaerobic hydrogen
production process. Appl Microbiol Biotechnology, 58, 224-228
Ren N.Q., Wang B., Huang J.C., 1997. Ethanol-Type Fermentation from Carbohydrate in High
Rate Acidogenic Reactor. Biotechnology and Bioengineering, 54(5), 428-433
Nath K., Das D., 2003. Hydrogen from biomass. Current Science, 85(3), 265-271
Zurawski D., Meyer M., Stegmann R., 2005. Fermentative production of biohydrogen from
biowaste using digested sewage sludge as inoculum. Tenth International Waste Management and
Landfill Symposium, Cagliari, 3-7 october 2005

! 20!
Stiegel G.J., Ramezan M., 2005. Hydrogen from coal gasification: An economical pathway to a
sustainable energy future. International Journal of Coal Geology, 65(3-4), 173-190
Das D., Veziroglu T.N., 2001, Hydrogen production by biological processes: a survey of literature,
International journal of hydrogen energy, 26, pp. 13-28.
Nath K., Das D., 2004. Improvement of fermentative hydrogen production: various Approaches.
Appl Microbiol Biotechnol, 65, 520-529
Brock T. D., Madigan M. D., Martino J. M., Parker J., 1996. Microbiologia batteri, archea,
eucarioti. Ed. CittàStudiEdizioni, Milano
Nandi R., Sengupta S., 1998. Microbial production of hydrogen: an overview. Crit. Rev. Microbiol.,
24, 61-84
Noike T., Mizuno O., 2000. Hydrogen fermentation of organic municipal waste. Water Science
Technology, 42, 155-162
Yu H., Zhu Z., Hu W., Zhang H., 2002. Hydrogen production from rice winery wastewater in an
upflow anaerobic reactor by using mixed anaerobic cultures. Int. J. Hydrogen Energy, 27, 1359-
1365
Tsygankov A.A., 2007. Biological Generation of Hydrogen. Russian Journal of General Chemistry,
77(4), 685-693

! 21!
Benemann J.R., 1996. Hydrogen biotechnology: Progress and prospects. Nature Biotechnology, 14,
1101-1103
Kim S.H., Han S.K., Shin H. S., 2004. Feasibiliyy of biohydrogen production by anaerobic co-
digestion of food waste and sewage sludge, 29, 1607-1616
Van Ginkel S., Sung S., 2001. Biohydrogen Production as a Function of pH and Substrate
Concentration. Environmental Science & Technology, 35, 4726-4730
Liu D., Liu D., Zeng R.J., Angelidaki I., 2006. Hydrogen and methane production from household
solid waste in the two-stage fermentation process. Water Research, 40, 2230-2236
Kyazze, G., Dinsdale, R., Guwy, A.I., Hawkes, F.R., Premier, G.C., Hawkes, D.L., 2007.
Performance characteristics of a two-stage dark fermentative system producing hydrogen and
methane continuously. Biotechnol. Bioeng. 97, 759-770
Ueno Y., Fukui H., Goto M., 2007, Operation of a two-stage fermentation process producine
hydrogen and methane from organic waste”, Environmental Science e Technology, 41, pp. 1413-
1419.
Fox, P., Pohland, F.G., 1994. Anaerobic treatment applications and fundamentals- substrate-
specificity during phase-separation. Water Envirom. Res. 66, 716-724
Pavan P., Battistoni P., Cecchi F., Mata.Alvarez J., 2000, Twophase anaerobic digestion of source
sorted organic fraction of municipal solid waste. Water Science Tecnology, 41, pp. 111-118.

! 22!
Cai, M.L., Liu, J.X., Wei, Y.S., 2004. Enhanced biohydrogen production from sewage sludge with
alkaline pretreatment. Environ. Sci. Technol. 38, 3195-3202
Antonopoulou G., Stamatelatou K., Venetsaneas N., Kornaros M., Lyberatos G., 2008.
Biohydrogen and methane production from cheese whey in a two-stage anaerobic proces. Ind. Eng.
Chem. Res. 47, 5227-5233.
Venetsaneas, N., Antonopoulou, G., Stamatelatou, K., Kornaros, M., Lyberatos, G., 2009. Using
cheese whey for hydrogen and methane generation in a two-stage continuous process with
alternative pH controlling approaches. Bioresour. Technol. 100, 3713-3717
Lay J.J., LeeY.J., Noike T, 1999, Feasibility of biological hydrogen production from organic
fraction of municipal solid waste, Water Research, 33, pp. 2579-2586.
Luo G., Xie L., Zhou Q., Angelidaki I., 2011. Enhancement of bioenergy production from organic
wastes by two-stage anaerobic hydrogen and methane production process. Bioresource Technol.
Akansu S.O., Dulger Z., Kahraman N., Veziroglu T.N., 2004 Internal combustion
! !

! 23!
2. PREDICTING BIO-HYDROGEN PRODUCTION BY DARK FERMENTATION USING
BIOMASS’ CHEMICAL COMPOSITION
1Manzini E., 1Scaglia B., 1,2Schievano A.∗, 1,2Adani F.
Submitted to Biomass and Bioenergy
1Gruppo Ricicla - DiSAA – Università degli Studi di Milano, Via Celoria 2, 20133 Milano, Italy.
2Gruppo Ricicla DiSAA - Biomass and Bioenergy Lab. - Parco Tecnologico Padano - Via Einstein,
Località Cascina Codazza 26900 – Lodi, Italy.
Abstract
Bio-hydrogen production throughout dark fermentation (DF) is gaining importance for the
production of energy from biomasses. Nevertheless, not all biomasses are suitable to produce H2 as
chemical composition affected this ability. In this work a first attempt to predict H2 production by
DF starting from chemical composition is presented. Different biomasses of different origin were
chemically characterized and tested for H2 productivity in comparison with pure glucose.
Results obtained indicated that H2 production depended, essentially, by soluble sugar and starch
content. The successive application of partial least square analysis (PLS) provided an useful tool to
predict H2 production with good predictability.
Key words: Bio-hydrogen; biomasses; dark fermentation; soluble sugar; partial least square
regression (PLS).
!!!!!!!!!!!!!!!!!!!!!!!!!!!!!!!!!!!!!!!!!!!!!!!!!!!!!!!!!
! 24!
2.1 Introduction
In the latest years a growing interest towards renewable fuels has been developing. Civilized
societies have thus far relied on fossil fuels, whose exhaustibility and environmental impact are
already well known, as scientific community and media are insistently pointing out. In this context
developing methods allowing safe and eco-friendly energetic provision is necessary and urgent [1].
Hydrogen is mostly used for the synthesis of ammonia (49% of production), oil refinery (37%),
methane production (8%), synthesis of other substances (6%) [3]. Only 3% of total hydrogen is
involved in direct energy production. A promising application of hydrogen is its utilization in fuel
cells [2], with conversion efficiencies to electric power of up to 60%. Moreover hydrogen could be
used in new homogeneous charge compression ignition (HCCI) engines (efficiency close to 45%)
[4] [5].
Hydrogen can be produced through different pathways: from fossil fuels (steam reforming, partial
oxidation, coal regasification and thermal cracking), from water (electrolysis, photolysis,
thermolysis, thermochemical processes) and from biomasses (pyrolysis, gasification, microbial
conversion). Biological processes are proving to be quite promising for the production of hydrogen,
due to their low energetic impact (they take place at room temperature and pressure), and their high
environmental sustainability (they can be performed by using waste materials, thus combining the
organic waste disposal).
The growing needs for renewable energy sources, alternative to fossil fuels, and for new
perspectives for agricultural compartment, determined a major interest for energy chain and for the
development of energy farms [6], i.e. farms complementing normal agricultural activities with the
production of renewable energy. One of these energy sources is biogas produced by anaerobic
digestion (AD) of biomasses [7].
While traditional AD allows the production of a biogas with high concentration of methane, more
recent technologies (two-stage AD) allow obtaining two different streams of biogas, rich in

! 25!
hydrogen and methane, respectively. Bio-methane already has a wide array of applications, while
bio-hydrogen, characterized by a high calorific power and virtually no dangerous emissions from
combustion [8], is gaining importance at global level for the production of energy. Still, the process
of adapting AD to product bio-hydrogen needs deeper studies due to technological limitations.
Biomass chemical composition could greatly affect H2 production but few data are available in
literature. For examples, if nitrogen is commonly listed as an important nutrient for bacterial
consortia [9], there is still no evidence about the role of proteins in the increase of hydrogen
production by dark fermentation [10]. Again, it was reported that lipid hydrolysis leads to the
reduction of glycerol, a substrate that bacteria are able to use for growing; in addition the formation
of carbohydrates and VFA (volatile fatty acids) (important substrates for hydrolysis) from lipids
was reported to be involved in hydrogen production [11].
Biogasification tests have been reported to be useful in determining potential biomethane
production of biomasses and in this way they are widely used [12]. On the other hand, there is still
much to investigate about bio-hydrogen potential production of different biomasses. Relatively few
data are available about bio-hydrogen potential test, although a first tentative was recently reported
in literature [13]. In this study, the above reported procedure [13] was re-adapted and potential H2
production was detected for a group of different organic materials. In addition, complete chemical
characterization of the tested biomasses was performed in order to understand how chemical
composition affected H2 production by dark anaerobic digestion.
2.2 Materials and methods
2.2.1 Organic matrices
Seven different organic substrates were used to perform H2 potential biogasification test: corn
silage, malt powder, beet pulp, giant reed (Arundo donax L.), olive pomace, rice middlings and
glucose. Samples were selected in order to obtain a variability in chemical composition and origin.

! 26!
All samples were dried at e40°C until constant weight, then milled at passed through a 0.5 mm
screen.
2.2.2 Bio-H2 potential production (BHP)
Startup inoculum was collected from a 10-l lab-scale reactor producing hydrogen under
thermophilic conditions (55°C) and at pH value between 5 and 6; the reactor was monitored for
several weeks to ensure a stable H2-gas production [13].
Before the test, the inoculum was shocked in oven at 100°C to inhibit methanogen microorganisms
and diluted with water to obtain an optimal volatile fatty acids (VFA) concentration (VFA < 800
mg l-1). H2 production tests were performed under batch-modality by placing 300 ml of inoculum
into 500 ml glass vials, flushed with N2 and incubated at 55°C. Batch reactors were then fed with
0.3 g of dried biomass. All tests were performed in triplicate.
Volumetric production of biogas was daily monitored through graduated syringes. Hydrogen
content was analyzed through a micro gas cromatograph (Micro GC 3000, Agilent Technology,
Santa Clara, CA, USA). The test was carried on till biogas production reached a plateau (no further
H2 was produced).
2.2.3 Chemical characterization
Total Solids (TS) and Volatile Solids (VS) contents were evaluated according to standard
procedures [14] [15]. Total Kjeldhal Nitrogen (TKN) was detected on fresh material, while organic
nitrogen content was used to evaluate the total protein content of samples [16].
Van Soest method [17] was used to evaluate fiber content on dry samples milled at 0.5 mm. NDF
(Neutral Detergent Fiber), ADF (Acid Detergent Fiber) and ADL (Acid Detergent Lignine) data,
were used to calculate the content of lignin-like fraction, cellulose (ADF-ADL), hemicellulose
(NDF-ADF) and soluble cell content (100-cellulose-emicellulose-lignine). Total fats content was
determined by Soxhlet extraction with ether [18]. Hall method [19] was used for the determination

! 27!
of sugar content (TESC, Total Ethanol-Soluble Carbohydrate 80%) while the amyloglucosidase/α-
amylase kit method was used for the determination of total starch [20].
In vitro digestibility was measured according to Robinson et al. [21]: dried samples were placed
into individual in vitro incubation bags (multi-weave polyethylene polyester polymer cloth) and
incubated in a DAISYI in vitro system (Ankom – Macedon, NY, USA).
The gross energy (GE) was measured using the adiabatic bomb calorimeter IKA 4000 (IKA®-
Werke GmbH & Co. KG, Staufen, Germany).
Easily degradable organic matter contents of substrates was measured according to Schievano et al.
[12], by detecting the Specific Oxygen Uptake Rate (SOUR), that is the measurement of the oxygen
uptake rate during microbial degradation of the organic substrate suspended in a continuously
agitated water solution at 37 °C.
2.2.4 Statistical approach
Data set employed to perform statistical study was composed by the chemical and physical
parameters characterizing the seven biomasses. A Pearson correlation matrix was performed by
using the SPSS statistical software (version 17; SPSS, Chicago, IL). Data were transformed to
normality according to the literature [22].
Multiple linear regressions to predict bio-hydrogen potential production (BHP) vs. chemical and
physical variables, were detected using the Partial Least Square method (PLS) [23].
The cross-validation “leave-one-out” approach of scaled variables was applied to calculate the
goodness of regressions (goodness of fit coefficient-R2 and goodness of prediction coefficient-R2cv,
respectively). Taking into consideration all variable values the best PLS regression was calculated
and the importance of each independent variable (importance coefficient) defined. Then PLS
analysis was repeated excluding the variables characterized by the smallest importance coefficient
[23]. This procedure was repeated until a final regression model with high regressions coefficients

! 28!
(R2 and R2cv) and the smallest number of variables was achieved. PLS was performed using SCAN
software (Minitab Inc., State College, PA).
2.3 Results and discussion
A wide diversity in chemical-physical composition in the organic matrices studied was evideced.
Pure glucose, used as reference substrate, as expected showed peculiar characteristics, i.e. VS of
100% TS, soluble sugar of 100% TS, high degradability: OD20 of 250 gO2 kg-1TS *20 h-1. The other
substrates showed low variability in VS contents that ranges from 834 g kg-1 TS for rice middlings
to 950 g kg-1 TS TS for giant reed. Rice middlings were the most protein-content biomass
analyzed, with a content of raw proteins of 15.9 % TS in opposite to beet pulp that showed the
lowest protein content (4.3% TS) (Table 1). Olive pomace showed the highest content of total
lipids, with an ethereal extract of 12.7 % TS and the beet pulp the lowest (0.44 % TS). Olive
pomace had the highest ADL content (38% TS), while malt powder the lowest one (3.5 % TS). The
highest starch content was found, such as expected, in the malt powder (67.7% TS), while the
lowest content was for the rice middlings (0.46 % TS); rice middlings and olive pomace showed
null content of soluble sugars, while corn silage showed a content of this fraction of 14% TS.
The energy content varied from 17,087 kJ kgTS-1 for beet pulp to 23,871 kJ kgTS-1 for olive
pomace, while in vitro digestibility ranged from a minimum of 34.7% TS for giant reed to a
maximum of 94.2% TS, for beet pulp. SOUR test (OD20) results indicated a degradability of
substrates that ranged from 53.4 g O2 kg-1 TS * 20h-1 for giant reed to 128 g O2 kg-1 TS * 20 h-1 for
malt powder.
Pure glucose produced 186±10 NlH2 kg-1 TS, i.e. 1.37 molH2 mol-1glucose; this result, although not as
high as expected, was in line with data reported by Tenca et al. [13].
The BHP test indicated lower H2 production for all matrices when compared with glucose H2-
production. As expected, highest hydrogen yields were obtained for biomasses rich in soluble and
more readily available compounds such as soluble sugars and starch (corn silage and giant reed).

! 29!
On the other hand, matrices with high percentages of recalcitrant components, such as lignin-like
fraction, produced low quantity of H2 (i.e. olive pomace) (see Figure 1).
A series of Pearson correlations between BHP and different chemical components (both by
themselves and combined) were performed on normalized data (Table 2). Pearson analysis showed
strong negative correlations of H2 production vs. recalcitrant compounds, especially with the less
digestible portions of fibers, i.e. ADL (r=-0.96, p < 0.01) and the combination of ADF plus ADL
(r=-0.80; p < 0.05).
A significant positive correlation between H2 production and soluble sugars (r=0.80, p<0.05) was
found. On the other hand, no correlation was found between starch and H2 production. Differently,
when considering the sum of soluble sugars and starch, the positive correlation with H2 production
was stronger than for soluble sugars alone (r=0.87, p<0.05).
No significant correlations were found for other fractions of the organic matter, such as proteins and
lipids, NDF, ADF, cellulose and hemicellulose, confirming that H2 production pathways are
strongly linked to soluble sugars. This may be caused by two factors: a) the chemical component is
hardly available to fermentative microflora, because its hydrolysis has too slow kinetics; b) the
chemical component is quickly hydrolyzed and available to fermentation, but do not follow a
metabolic pathway that drives to H2 production.
To look into this hypothesis, OD20 and digestibility, which are parameters that indicate the short-
term availability of organic matter to biodegradation, didn’t show significant correlation with H2.
This confirm that not all the easily-hydrolysable fractions of organic matter (e.g. proteins), that are
fermented during acidification process, can be related to methabolic pathways driving to H2 release.
At the same time, the H2 production measured for the giant reed was interesting and unexpected, as
soon as typically the low digestibility of this plant (see the relatively low OD20, Table 1) should
have driven to low H2 yield,. Nevertheless, the relatively high soluble sugar content (Table 1)
allowed obtaining H2 production as high as other matrices, i.e. malt powder and rice middlings, for
which high H2 production was expected.

! 30!
Table 2.1. Substrates characterization.
The correlation found confirmed that H2 production is strictly correlated to substrate composition in
terms starch and soluble sugar contents, as previous literature often highlighted [11]. In particular,
Akutsu et al. [24] proved the positive influence of the presence of starch in biomasses on H2
production. Therefore, accessible path to produce bio-hydrogen is the utilization of carbohydrate-
rich biomass, as shown by Noike et Mizuno [25] and Yu et al. [26].
The results here obtained indicate that H2 production should be driven by soluble sugar and starch
contents and that the quantification of these two chemical parameters can be used to predict H2
production.
Doing so, a partial least square analysis (PLS) was performed on normalized data to detect which
chemical components, among those measured, influenced hydrogen production and their relevance.
Multiple PLS resulted in a linear regression model able to predict H2 production according to the
following equation:
BHP = 110.24 – 20.04 arcsin√ADL + 11.4arcsin√soluble sugars + 0.3749*(starch+soluble
sugars)
Sample – Corn silage Malt powder Beet pulp Olive pomace Rice middlings G. cane Glucose
! ! ! ! ! ! !Hydrogen production NLH2 kg-1TS 106±23 107±13 69.9±3.1 48.7±8.9 96.6±5.9 102±10 186±10
Organic matter gTS kg-1TS 914±0 852±0 898±0 940±0 834±0 950±0 1000 Raw proteins gTS kg-1TS 150±1 61.7±0.1 43.2±0.1 131±0 159±0 59.8±3.2 0 Ethereal extract gTS kg-1TS 18.2±0.1 79.8±0.1 4.40±0.02 127±0 32.5±0.2 38±0 0 NDF gTS kg-1TS 522±1 360±2 446±1 669±2 534±2 826±3 0 ADF gTS kg-1TS 301±1 173±1 254±1 584±2 375±2 558±3 0 ADL gTS kg-1TS 57.6±0.3 35±0 120±1 383±1 131±1 128±1 0 Starch gTS kg-1TS 151±0 677±3 30.3±0 8±0.01 4.6±0 28.5±0.1 0 Soluble sugars gTS kg-1TS 140±1 1.5±0 1.72±0.03 0 0 100±0 1000 Energy content kJ/kgTS 19,273±185 17,207±219 17,087±220 23,871±304 17,937±195 18,732±200 14,222±114 Digestibility gTS kg-1TS 771±2 393±1 942±4 362±2 524±2 347±1 100
OD20 gO2 kg-1TS *20 h-1 102±5 128±5 94±4 72±2 95.4±2.2 53.4±1.7 250
!1!

! 31!
In which BHP is expressed as Nl kg-1TS and ADL, soluble sugar and starch as % of TS.
Equation showed good regression coefficient (R2=0.91, p<0.05) and high predictability (R2cv=0.84,
p<0.05), such as the comparison between experimental and calculated data confirmed (Figure 1).
Figure 2.1: Comparison between modelized and measured biohydrogen production.
2.4 Conclusions
This work indicates that H2 productivity depends, essentially, on the presence of consistent fractions
of soluble sugar and starch in the organic matter. The application of partial least square
analysis(PLS) provided an useful tool to predict H2 productivity, with good predictability. Further
efforts in this pathway should provide wider information on this topic.
2.5 References
[1] Turner JA. A realizable renewable energy future. Science 1999; 285: 687–689
[2] Nath K, Das D. Hydrogen from biomass. Curr. Science 2003; 85: 265.
[3] Stiegel GJ, Ramezan M. Hydrogen from coal casification: an economical pathway to a
0!
50!
100!
150!
200!
Corn%silage%Malt%powder%Beet%pulp%Olive%pomace%Rice%middlings%Arundo%donax%Glucose%
NL
H2 kg
TS-1
modelized!measured!

! 32!
sustainable energy future. Int. J. Coal Geolog. 2006; 65: 173-190.
[4] Edwards PP, Kuznetsov VL, David WI. Hydrogen energy. Phil. Trans. R. Soc. A. 2007; 365:
1043–1056.
[5] Gomes Antunes JM, Mikalsen R, Roskilly AP. An investigation of hydrogen-fueled HCCI
engine performance and operation. Int. J. Hydro. Energy 2008; 33: 5823-5828.
[6] Lipinsky EP. Fuels and biomass: integration with food and materials systems. Science 1978;
199: 644-651.
[7] Sharpley A, Meisinger JJ, Breeuwsma A, Sims JT, Daniel TC, Schepers JS. Impacts of animal
manure management on ground and surface water quality, in: Hatfield, J.L., Stewart B.A. (Eds),
Animal waste utilization: Effective use of manure as a soil resource. Lewis Publisher; 1998, p. 173-
242.
[8] Nath K, Das D. Improvement of fermentative hydrogen production: various approaches. Appl.
Microbiol. Biotechnol 2004; 65: 520-529.
[9] Yokoi H, Saitsu A, Uchida H, Hirose J, Hayashi S, Takasaky Y. Microbial Hydrogen production
from sweet potato starch residue. J. Biosci. Bioeng. 2001; 91: 58-63.
[10] Kapdan IK, Kargi F. Bio-Hydrogen production from waste materials. Enzym. Microb.
Technol. 2006; 38: 569-582.
[11] Lay J, Fan K, Chang J, Ku K. Influence of chemical nature of organic wastes on their
conversion to hydrogen by heat-shock digested sludge. Int. J. of Hydrog. Energy 2003; 28: 1361-
1367.
[12] Schievano A, Scaglia B, D’Imporzano G, Malagutti L, Gozzi A, Adani F. Prediction of biogas
potentials using quick laboratory analyses: Upgrading previous models for application to
heterogeneous organic matrices. Bioresour. Technol. 2009; 100: 5777-5782.

! 33!
[13] Tenca A, Schievano A, Perazzolo F, Adani F, Oberti R. Biohydrogen from thermophilic co-
fermentation of swine manure with fruit and vegetable waste: Maximizing stable production
without pH control. Bioresour. Technol. 2011; 102: 8582-8588.
[14] Sluiter A. Determination of Total Solids in Biomass. Natl. Renew. Energy Lab. 2005, Golden,
CO, USA.
[15] Lahav O, Morgan B, Loewenthal RE. Rapid, simple and accurate method for measurement of
VFA and carbonate alkalinity in anaerobic reactors. Environ. Sci. Technol. 2002; 36: 2736–3274.
[16] Bremner JM. Nitrogen – Total. Methods of soil analysis, part 3 – chemical methods. 1996;
1085- 1121.
[17] Van Soest PJ, Robertson JB, Lewis BA. Methods for dietary fiber, neutral detergent fiber, and
nonstarch polysaccharides in relation to animal nutrition. Cornell University, Department of Animal
Science and Division of Nutritional Science, 1991; Ithaca, NY.
[18] AOAC. Official Methods of Analysis, 13th Edition. Association of Analytical Chemist, 1980,
Washington.
[19] Dubois M, Gilles KA, Hamilton JK, Rebers PA, Smith F. Colorimetric method for
determination
of sugar and related substances. Analytical Chemistry 1956; 28: 350-356.
[20] MEGAZYME Assay Procedure (Amyloglucosidase/ α-Amylase method), K-TSTA 04/2009
[21] Robinson PH, Campbell Mathews M, Fadel JG. Influence of storage time and temperature on
in vitro digestion of neutral detergent fibre at 48 h, and comparison to 48 h in sacco neutral
detergent fibre digestion. Anim. Feed Sci. Technol. 1999; 80: 257-266.
[22] Sheskin DJ. Handbook of Parametric and Nonparametric Statistical Procedures, third ed. CRC
press, US. 2003.

! 34!
[23] Andries PMJ, Heyden YV, Buydens LMC. Improved variable reduction in partial least
squares modelling based on Predictive-Property-Ranked Variables and adaptation of partial least
squares complexity. Anal. Chim. Acta 2011; 705: 292-305.
[24] Akutsu Y, Li Y, Harada H, Yu H. Effect of temperature and substrate concentration on
biological hydrogen production from starch. Int. J. of Hydrog. Energy 2009; 34: 2558-2566.
[25] Noike T, Mizuno O. Hydrogen fermentation from municipal wastes. Water Sci. Technol. 2000;
42: 155-162.
[26] Yu H, Zhu Z, Hu W, Zhang H. Hydrogen production from rice winery wastewater in an
upflow anaerobic reactor by using mixed anaerobic cultures. Int. J. of Hydrog. Energy 2002; 27:
1359-1365.

! 35!
2.6$Addendum$!A!new!set!of!samples!was!used!in!an!extension!of!the!previous!study.!!
Ten!samples!of!different!origin!(industrial,!agricultural!and!urban!wastes,!as!well!as!crops)!
underwent!the!same!procedure!shown!above.!
Samples!included!sludge!from!a!depuration!plant,!sugar!blueberry!extract,!citrus!pellet,!a!
mixture!of!vegetables!(potatoes,!peppers,!onions)!from!a!food!factory;!from!a!waste!treatment!
plant!compost!and!a!mixture!of!urban!and!green!wastes!were!obtained;!last,!from!the!
agricultural!compartment!milled!cob,!manure,!marc!and!ryegrass!were!used.!
These!matrices!were!analyzed!as!seen!above;!digestibility!and!energy!content!proved!to!be!
not!interesting!parameters!and!were!therefore!not!measured.!Results!are!shown!in!table!2.2!
!
Tab.2.2:!chemical!characterizations.!
!
The application of the same model as the first data set was not!successful.!A!quicker!statistical!
analysis!was!performed.!A!Pearson!series!of!correlation!was!carried!out;!in!table!2.3!
correlations!between!chemical!parameters!and!hydrogen!production!are!shown.!
!
!
!
!

! 36!
Tab.!2.3:!Pearson’s!correlations!
!! R! R2!Organic!matter! 0,62! 0,38!Raw!proteins! 70,7! 0,49!Ethereal!extract! 70,45! 0,20!NDF! 70,65! 0,42!ADF! 70,62! 0,38!ADL! 70,68! 0,46!Starch! 70,48! 0,23!Soluble!sugars! 0,89! 0,79!OD20! 0,59! 0,35!!Due!to!the!higher!number!of!samples!and!their!wider!differences,!correlations!are!not!as!
immediate.!Still,!a!strong!positive!correlation!(R=0.89,!p<0.01)!was!detected!between!
hydrogen!production!and!soluble!sugars.!A!negative!correlation!is!seen!with!raw!proteins!
(R=T0.7,!p<0.05)!and!ADL!(R=0.68,!p<0.05),!thus!confirming!the!dependence!of!hydrogen!
production!on!the!abundance!of!immediately!available!compounds!such!as!soluble!sugars,!
while!the!most!recalcitrant!ones!proved!again!to!provide!a!negative!influence.!
! !

! 37!
3. TWO-STAGE INSTEAD OF ONE-STAGE ANAEROBIC DIGESTION CAN
REALLY INCREASE ENERGY RECOVERI FROM BIOMASS
Submitted to Applied Energy
A. Schievano*, A. Tenca, S. Lonati, E. Manzini, F. Adani
Gruppo Ricicla – Department of Agricultural Environmental Science (DISAA), Università degli
Studi di Milano. Via Celoria, 2 – 20133 Milano, Italy
Abstract
The supremacy of two-stage on traditional one-stage anaerobic digestion (AD, in terms of
overall energy recovery (ER) from biomass has often been proved. However, the process
conditions ensuring this result, as well as the reasons for higher efficiency, have always been
unclear. In this work, a new standardized approach is proposed: optimization at lab-scale of both
hydrogen and methane generation processes allowed comparing the maximum potential ER of
both two-stage (as H2+CH4) and one-stage AD (as CH4). Relatively high biohydrogen yields
were obtained testing four different organic substrates (ER of 1 – 1.6 MJ kg-1VS-added).
Biomethane generation resulted in ER in the range 9 – 19 MJ kg-1VS-added., similarly for two-stage
and one-stage systems. The overall ER resulted significantly higher (8 – 43%) for the two-stage
in the large majority of experimental conditions and never significantly lower. These preliminary
results should drive further research to better understand the conditions that can drive the two-
stage AD to higher performance.
Keywords: Two-stage anaerobic digestion, biohydrogen, biomethane, biomass, bioenergy

! 38!
3.1 Introduction
The two-stage anaerobic digestion (AD) process has often been reported as a viable way to produce
bio-hydrogen and bio-methane from a wide range of organic materials [1,2]. In the last decade,
several studies were published on this topic and many authors reported different applications of the
two-stage AD, with different organic substrates and different process designs [3,4,5].
Generally, the phase separation of hydrolysis/fermentation from methanogenesis in different
reaction environments has been proposed as a strategy to increase overall process performances, in
terms of stability, degradation efficiencies in both fermentation and methanogenesis phases and
thereby in terms of overall energy recovery (ER) from biomass [6]. A controlled acidogenic
fermentation, that allow efficient bio-hydrogen production, has been thought the best pathway to
pre-treat raw biomass to enhance methanogenic process.
According to various authors, efficient bio-hydrogen production and volatile fatty acids (VFA)
liberation in the liquid during acidogenic phase would at the same time ensure energy recovery as
H2 and favor CH4 production from VFA in the methanogenic reactor [7].
On the other hand, literature has seldom given general and exhaustive explanations to this thesis,
often limiting efforts on particular case studies, with particular substrate types and operational
conditions.
In particular, few studies took into account the overall potential ER of two-stage AD, compared to
single-stage AD, focusing on the reasons and the conditions for actual enhancement of ER by phase
separation. The most important contributions to this topic came from Liu et al. [8], Pakarinen et al.
[9] and Luo et al. [6], that demonstrated the supremacy (from 20 to 60% higher ER) of two-stage
AD at both thermophilic and mesophilic conditions. The reasons for success of two-stage system
were associated, generally, to process advantages, as higher efficiency in converting VFAs into
methane in the second stage [8]. Pakarinen et al. [9] obtained high advantage from two-stage AD
and found significantly higher hydrolysis efficiency after the hydrogen production step, with
increased soluble organic matter and VFA production through fermentation, allowing higher

! 39!
productivity in the methanogenic phase. Luo et al. [6] were more precise and associated the higher
ER of the two-stage to higher performances in the second-stage (methanogenesis) in degradation
kinetics and to the effect of minimizing the loss of relatively ‘‘fresh feed’’ out of the reactor due to
‘‘short-circuiting’’, occurring in single-stage fully mixed reactors.
More recently, Schievano et al. [10] observed two-stage vs single-stage AD in thermophilic
continuously stirred tank reactors (CSTR) fed with a mix of fruit/vegetable waste and swine
manure, focusing on the overall ER and on biological process efficiencies. In this case, equal ER
resulted from the two AD systems, even if the methanogenic reactor in the two-stage system
showed residual un-degraded organic compounds (VFA were 10 times higher than in the single-
stage reactor) and thereby an unexpressed potential [10]. This means that, in this case, if the
methanogenesis in the two-stage wasn’t slightly inhibited, the two-stage would have shown higher
ER, as compared to the single-stage.
In this work, a new approach in investigating this topic is proposed. Both bio-hydrogen and bio-
methane productions should be always optimized to compare the two AD systems. For this reason,
optimization of bio-hydrogen production process was carried out for four different organic mixtures
and the biochemical methane potential (BMP) standard tests were used to obtain optimized ER
from methanogenesis.
3.2 Materials and Methods
To verify the energy recovery two-stage and single-stage AD were simulated in lab-scale
fermenters. The test was run on four different organic mixtures of biomass, diluted with liquid
swine manure (SM) to the desired organic matter concentration, measured as volatile solids (VS)
per g of wet weight (ww). Indeed, SM is a very common liquid material used in biogas plants and
provides both nutrients and buffer capacity to AD environments. In previous studies dealing with
optimization of anaerobic dark fermentation, SM was already used as co-substrate to efficiently
produce bio-hydrogen [11]. The feeding substrates were 4 organic materials, usually available in

! 40!
full-scale agricultural AD facilities: a) maize silage (MS), b) waste rice flour (RF), c) olive pomace
(OP) and d) waste fruit/vegetable (FV).
The first-stage was run (as reported by Tenca et al. [11]) in semi-continuous reactors, fed twice a
day; the optimized H2 production were selected by varying the feeding conditions in two variables:
i) organic matter concentration (OMC) and ii )hydraulic retention time (HRT). The pre-digested
materials, produced in optimized conditions, underwent the methanogenic phase (2nd stage), i.e.
incubated in batch reactors optimized for methanogenesis. The single-stage AD was run in parallel
in batch reactors fed with the untreated organic mixtures. The energy recovered from the double-
stage (H2+CH4) and the single-stage (CH4) AD systems were compared to look for possible
increase in productivity in the double-stage concept.
3.2.1 Hydrogenic process optimization (1st stage)
The hydrogenic phase of two-stage AD system was run in semi-continuously operated reactors of
500 mL capacity, fed 2-times a day, in thermophilic conditions (55±1ºC), as reported in detail in a
recent work by Tenca et al. [11]. A Box-Wilson central composite design (CCD) [12] was applied
to study the effect of two operating parameters (the controllable factors: OMC and HRT) on
biohydrogen production (the experimental response), and therefore to find the optimal region in
which to operate the fermentation.
In a CCD, the experimental values of each controllable factor are defined to be uniformly
distributed around a centerpoint, according to factorial design levels coded from -1 to +1. These
levels are then augmented with star points that, in a two-factor CCD, are axially placed at a coded
distance of -√2 and +√2 from the center of the design. As a result, OMC and HRT were investigated
at five levels, coded as (-√2, -1, 0, +1, +√2). The level code reflects the step change in the actual
value chosen for the two operating parameters.

! 41!
All the evaluated levels were arranged in nine different treatments, hereafter called experimental
conditions (EC), corresponding to nine combinations of OMC with HRT values. Each treatment
consisted of three replicated assays, except for the centerpoint EC, which was replicated six times.
For all substrates, except for FV, the selected ranges for factors were 25 – 65 gVS kg-1ww and 1 – 4 d
for OMC and HRT, respectively, with a design centerpoint of [45 gVS kg-1ww; 2.5 d]. The resulting
investigated range for OLR was from 8.9 to 45 gVS L-1dig. d-1. According to results of experiments
conducted in previous work with a similar substrate [11], for FV the selected factors ranges were 27
– 72 gVS kg-1ww and 1 – 3 d for OMC and HRT, respectively, centerpoint of the design being [50 gVS
kg-1ww; 2 d]. The corresponding range for the organic loading rate is approximately from 12.4 to
52.8 gVS L-1 d-1. All the coded levels and corresponding values of operating variables considered in
the experimental design are summarized in Table 3.1.

! 42!
Table 3.1 - Experimental design of the first stage (hydrogenic) loading in two variables (OMC vs
HRT) and theoretical organic loading rates (OLR) for the organic mixtures studied.
Sample EC OMC gVS kg-1
ww
HRT d
OLR kgVS L-1 d-
1
MS + SM 1 0 45.0 -√2 1 45.0
2 -1 31.0 -1 1.5 20.7
3 1 59.0 -1 1.5 39.3
4 -√2 25.2 0 2.5 10.1
5 0 45.0 0 2.5 18.0
6 √2 64.8 0 2.5 25.9
7 -1 31.0 1 3.5 8.9
8 1 59.0 1 3.5 16.9
9 0 45.0 √2 4 11.3
RF + SM 1 0 45.0 -√2 1 45.0
2 -1 31.0 -1 1.5 20.7
3 1 59.0 -1 1.5 39.3
4 -√2 25.2 0 2.5 10.1
5 0 45.0 0 2.5 18.0
6 √2 64.8 0 2.5 25.9
7 -1 31.0 1 3.5 8.9
8 1 59.0 1 3.5 16.9
9 0 45.0 √2 4 11.3
OP + SM 1 0 45.0 -√2 1 45.0
2 -1 31.0 -1 1.5 20.7
3 1 59.0 -1 1.5 39.3
4 -√2 25.2 0 2.5 10.1
5 0 45.0 0 2.5 18.0
6 √2 64.8 0 2.5 25.9
7 -1 31.0 1 3.5 8.9
8 1 59.0 1 3.5 16.9
9 0 45.0 √2 4 11.3
FV + SM 1 0 50.0 -√2 1 50.0
2 -1 34.0 -1 1.25 27.2
3 1 66.0 -1 1.25 52.8
4 -√2 27.4 0 2 13.7
5 0 50.0 0 2 25.0
6 √2 72.6 0 2 36.3
7 -1 34.0 1 2.75 12.4
8 1 66.0 1 2.75 24.0
9 0 50.0 √2 3 16.7
All reactors were initially inoculated with a digested material collected in a 10 L laboratory-scale
reactor, digesting a mixture of the four organic substrates used in this study. The digester had

! 43!
been continuously operating under thermophilic conditions (55 °C) for approximately 20 days,
prior to the beginning of this study, showing a stable production of biohydrogen. The TS and VS
concentrations and the pH of the inoculum resulted in 36.1 ± 4.3 g kg-1ww, 29.4 ± 3.6 g kg-1
ww
and 5.65 ± 0.23, respectively.
The test was prolonged for almost 10 – 15 days, till the production of biogas conditions was
stable. The last 5 days of stable production were taken into account for data elaboration and for
sampling the pre-digested materials. Biohydrogen production was calculated from volume
measurements of gas accumulated in sample bags and by measuring its hydrogen content.
3.2.2 Methanogenic process (2nd stage and single-stage)
Optimized methanogenic process was applied to raw materials (simulating one-stage process)
and to treated materials (simulating the second stage process). Only the most productive EC
were chosen, i.e. those reaching hydrogen yield (NLH2 kg-1VS) above 30% of the most productive
EC for each biomass type. Treated materials sampled 4 different times from the hydrogenic
reactors at steady state and mixed together in one single sample.
The optimized methanogenic process was performed in batch thermophilic reactors of 500 mL
capacity. This test was adapted from standard procedures of bio-chemical methane potential
(BMP) [13], which ensures optimized conditions for methanogenic activity. In brief, 300 mL of
operating volume were used, with approximately 200 mL of headspace in the batch. The samples
of treated (for double-stage AD) or raw (for single stage AD) substrate were added to inoculum
at a ratio of 1:4 (substrate:inoculum) on wet weight base. The samples were homogenized and
used fresh (without drying) in the methanogenic test, to avoid VFA evaporation. The inoculum
was a digested slurry (around 45 gTS kg-1ww) sampled in a thermophilic AD facility operating in
the agricultural context around Milan, Italy. The digestate was filtered through a stainless steel
sieve (US Mesh No. 10, sieve opening of 2.0 mm) and incubated for 15 days before the
beginning of the test. After sample addition, the batch reactors were sealed with teflon hermetic

! 44!
caps, flushed with a N2 atmosphere and monitored for biogas production (by withdrawing extra-
pressure gas with a tight syringe) till plateau was reached, approximately after 60 days.
Biomethane production was calculated from volume measurements of gas (withdrawn by tight
syringe till equilibrium pressure) and by measuring its methane content.
3.2.3 Measurements and analytical methods
Feeding substrates and treated substrates were characterized in terms of TS and VS (only for
feeding substrates), chemical oxygen demand (COD), pH, total volatile fatty acids (TVFA) and
total alkalinity (TA) content, according to Standard Methods [14]. All analyses were performed
on 4 different samples and the values were expressed as average and standard deviation.
Biogas composition was determined, considering only H2, CH4 and CO2, with a gas
chromatograph (Agilent, Micro GC 3000A) equipped with two thermal conductivity detectors
and two different columns. Hydrogen and methane were analyzed using a Molesieve/5A Plot
column, with nitrogen as the carrier gas at a flow rate of 30 mL/min. Carbon dioxide content was
analyzed using a different column (Alltech HP-Plot U), with helium as the carrier gas at a flow
rate of 30 mL/min. The operational temperature of the injection port was 100 °C, while those of
Molesieve/5A and Plot U columns were maintained at 100 and 55 °C, respectively.
3.2.4 Total energy recovery calculation
Biohydrogen production rate was measured daily for each reactor, and for clarity, the values
were normalized to the fermentation broth volume and then expressed as LH2 L-1 d-1.
Biohydrogen yield was calculated as the specific production per VS mass added in each
treatment and then expressed as LH2 kg-1VS_added. Cumulated biomethane production measured on
each batch reactor was also expressed on kgVS_added to the AD system as a whole, i.e. the kgVS
added to the hydrogenic stage per each kg of untreated substrate loaded, both in the double- and
in the single-stage AD systems.

! 45!
The biohydrogen and biomethane yields (as LH2/CH4 kg-1VS_added) were transformed into total
energy recovery (ER, as MJ kg-1VS_added), by considering H2 and CH4 superior heat of combustion
(12.74 MJ/Sm3 and 35.16 MJ/Sm3, respectively). The sum of the ER from H2 and CH4
represented the total ER from the two-stage AD system, to be compared to the ER obtained by
the sole ER of the methane produced in the single-stage AD.
3.3 Results
3.3.1 Biohydrogen productions and yields
All EC were plotted in a chart (Figure 1a) to visualize the experimental set and the variability (as
standard deviation) of OMC, during the feeding period. Additionally, the OLRs imposed to the
reactors were plotted in Figure1b, to observe that, for the same biomass, each different EC
corresponds to a different OLR.
Figure 3.1 a. Experimental conditions (EC) composed by central composite design on the
variables organic matter concentration (OMC) and hydraulic retention time (HRT). OMC is

! 46!
reported with standard deviation on triple samples. b. Organic loading rate (OLR) corresponding
to each EC.
Biohydrogen productions obtained in all the EC considered in the study are summarized in Table
3.2.

! 47!
Table 3.2 - Hydrogen and methane productions (asSdm3 L-1dig.
d-1), yields (per kgVS-added) and
composition of biogas (as % v/v) produced by the two- and one- stage AD systems.
Mixture EC Two-stage ER One-Stage ER
!! 1st stage (H2) 2nd stage (CH4)
!!Sdm3 L-1
dig. d-1 Sdm3 kg-1
VS-
added
H2:CH4:CO2 Sdm3 kg-1VS-
added
H2:CH4:CO2 Sdm3 kg-1 VS-
added
H2:CH4:CO2
%v/v in biogas %v/v in biogas %v/v in biogas
MS + SM 1 3.66 ± 0.34 87.8 ± 8.2 49.6 : 0 : 50.4 380 ± 25 0.2 : 69.9 : 29.9 431 ± 5 0.4 : 69.2 : 30.4
2 2.37 ± 0.11 120.9 ± 5.6 36.1 : 0 : 63.9 304 ± 18 0.2 : 71.3 : 28.5 403 ± 37 0.3 : 67.2 : 32.5
3 1.84 ± 0.47 42.6 ± 10.9 33.4 : 0 : 66.6 330 ± 97 0.2 : 67.0 : 32.8 379 ± 24 0.5 : 66.4 : 33.1
4 0.08 ± 0.02 12.5 ± 3.1 7.4 : 16.2 : 76.3 -* - - -
5 0.97 ± 0.13 58.2 ± 7.8 42.7 : 0.1 : 57.2 406 ± 95 0.3 : 68.2 : 31.5 431 ± 5 0.4 : 69.2 : 30.4
6 0.62 ± 0.19 22.2 ± 6.8 35.0 : 0.8 : 64.2 - - - -
7 0.84 ± 0.14 100.0 ± 16.7 41.8 : 0 : 58.2 504 ± 11 0.1 : 63.7 : 36.2 403 ± 37 0.3 : 67.2 : 32.5
8 0.85 ± 0.04 46.0 ± 2.2 41.3 : 0 : 58.7 414 ± 4 0.2 : 68.3 : 31.5 380 ± 24 0.5 : 66.4 : 33.1
9 1.02 ± 0.14 97.9 ± 13.4 43.9 : 0 : 56.1 432 ± 15 0.3 : 57.4 : 42.3 431 ± 5 0.4 : 69.2 : 30.4 RF + SM 1 5.74 ± 0.55 128.3 ± 12.3 43.4 : 0 : 56.6 253 ± 18 0.2 : 73.6 : 26.2 295 ± 16 0.4 : 64.9 : 34.7
2 0.37 ± 0.07 20.5 ± 3.9 6.9 : 10.6 : 82.5 - - - -
3 5.29 ± 0.63 126.6 ± 15.1 38.7 : 0.1 : 61.2 246 ± 14 0.2 : 71.2 : 28.5 280 ± 11 0.4 : 66.0 : 33.6
4 0.05 ± 0.03 6.3 ± 3.8 2.7 : 18.7 : 78.6 - - - -
5 2.08 ± 0.09 116.2 ± 5.0 43.3 : 0.1 : 56.6 305 ± 34 0.1 : 70.7 : 29.3 295 ± 16 0.4 : 64.9 : 34.7
6 1.58 ± 1.16 52.7 ± 38.7 40.5 : 0.7 : 58.9 316 ± 3 0 : 67.9 : 32.1 271 ± 15 0.2 : 65.7 : 34.2
7 0.04 ± 0.01 5.2 ± 1.3 4.1 : 19.9 : 76.0 - - - -
8 1.73 ± 0.20 96.6 ± 11.2 40.9 : 0.3 : 58.8 240 ± 10 0.3 : 71.9 : 27.8 280 ± 11 0.4 : 66.0 : 33.6
9 1.23 ± 0.09 109.9 ± 8.0 40.2 : 0.3 : 59.5 240 ± 21 0.1 : 76.7 : 23.2 295 ± 16 0.4 : 64.9 : 34.7 PO + SM 1 0.02 ± 0.01 0.5 ± 0.2 2.2 : 10.3 : 87.5 - - - -
2 0.23 ± 0.04 13.0 ± 2.3 1.3 : 13.9 : 84.8 - - - -
3 0.02 ± 0.01 0.5 ± 0.0 11.1 : 1.1 : 87.8 - - - -
4 0.01 ± 0.01 1.3 ± 0.0 0.9 : 35.0 : 64.1 - - - -
5 0.00 ± 0.01 0.1 ± 0.0 0.3 : 33.4 : 66.3 - - - -
6 0.03 ± 0.01 1.0 ± 0.3 3.3 : 7.4 : 89.4 - - - -
7 0.02 ± 0.01 2.6 ± 1.3 4.7 : 13.4 : 81.8 - - - -
8 0.01 ± 0.01 0.6 ± 0.0 2.9 : 13.6 : 83.5 - - - -
9 0.01 ± 0.01 0.9 ± 0.0 2.1 : 10.8 : 87.1 - - - - FV + SM 1 1.38 ± 0.46 26.4 ± 8.8 18.4 : 0.1 : 81.5 - - - -
2 0.02 ± 0.01 0.7 ± 0.3 0.3 : 18.0 : 81.7 - - - -
3 1.74 ± 0.93 32.7 ± 17.5 29.7 : 0 : 70.2 - - - -
4 0.08 ± 0.02 6.1 ± 1.5 2.3 : 17.5 : 80.2 - - - -
5 3.24 ± 0.57 123.8 ± 21.8 48.4 : 0 : 51.6 373 ± 11 0.2 : 56.3 : 43.5 293 ± 32 0.2 : 56.1 : 43.8
6 1.48 ± 0.53 38.7 ± 13.9 21.3 : 0 : 78.7 345 ± 32 0.1 : 56.7 : 43.3 292 ± 6 0.2 : 56.1 : 43.8
7 0.21 ± 0.23 15.8 ± 17.3 17.5 : 5.6 : 76.8 - - - -
8 2.39 ± 0.13 98.8 ± 5.4 45.6 : 0 : 54.4 347 ± 18 0.2 : 59.4 : 40.4 278 ± 14 0.1 : 58.0 : 41.9
9 2.06 ± 0.46 118.1 ± 26.4 37.7 : 0 : 62.3 328 ± 28 0.2 : 54.9 : 44.9 281 ± 31 0.2 : 56.1 : 43.8

! 48!
* Methane production was not considered for EC where H2 yields resulted lower than 30% of the
maximum H2 yield
Biohydrogen production rates (per unit of digester volume) resulted higher than 5 Sdm3 L-1dig.d-1 for
RF, in EC1 and EC3; contrarily, almost no hydrogen was produced for OP, in every EC. MS and
FV reached as best 3.66 ± 0.34 and 3.24 ± 0.57 Sdm3 L-1dig.d-1, respectively. For all substrates, low
or no biohydrogen production was obtained in all the assays fed with a substrate having VS
concentration below 30 gVS kg-1ww (experimental condition 4). Hydrogen concentration in biogas
was in the range 30 – 50% v/v for the most productive EC, while lower concentrations were found
for the less productive EC (Table 3.2).
The best biohydrogen yields (120 ± 6, 128 ± 12 and 124 ± 22 NLH2 kg-1VS-added) were obtained at
EC2, EC1 and EC5 for MS, RF and FV, respectively (Table 2). They resulted almost equivalent,
even if RF showed similar yields also in many other EC (EC3, EC5, EC8 and EC9), while MS and
FV only in two EC (EC7/ EC9 for MS and EC8/EC9 for FV). On the other hand, hydrogen yield
didn’t achieve at least 30% of the maximum value obtained for each biomass in EC4/EC6,
EC2/EC4/EC7 and EC1/EC2/EC3/EC7 for MS, RF and FV, respectively (Table 2). Interestingly,
the best H2 productions were always obtained were low methane content (< 1% v/v) was present in
the biogas (Table 2), confirming that limiting conditions for hydrogen consumers is a key to
optimized bio-hydrogen generation. Both productions and yields were plotted as color-gradient
charts (Figure 2), which help in focusing the optimized feed conditions for bio-hydrogen
production.

! 49!
Figure 3.2. Interpolation (color-gradient) of H2 yield within the considered areas of EC.

! 50!
3.3.2 Chemical characterization of raw and treated materials
Table 3.3 - Characterization of the raw organic mixtures fed in the 9 points of the experimental
design
Sample EC TS OMC COD pH in VFA Alk VFA/Alk
!! g kg-1ww gVS kg-1
ww g kg-1ww g kg-
1ww g kg-1
ww
MS + SM 1 47.1 ± 4.9 41.7 ± 3.4 80.2 ± 7.5 5.86 2.68 11.7 0.23
2 32.6 ± 2.3 29.4 ± 1.7 43.2 ± 1.0 6.48 2.01 11.83 0.17
3 69.3 ± 5.5 64.8 ± 5.1 95.2 ± 9.7 5.40 3.35 11.58 0.29
4 19.9 ± 1.5 16.0 ± 1.2 27.9 ± 3.4 6.64 1.62 11.9 0.14
5 47.1 ± 4.9 41.7 ± 3.4 80.2 ± 7.5 5.86 2.68 11.7 0.23
6 75.5 ± 7.4 69.8 ± 5.7 119.9 ± 7.1 5.07 3.73 11.51 0.32
7 32.6 ± 2.3 29.4 ± 1.7 43.2 ± 1.0 6.48 2.01 11.83 0.17
8 69.3 ± 5.5 64.8 ± 5.1 95.2 ± 9.7 5.40 3.35 11.58 0.29
9 47.1 ± 4.9 41.7 ± 3.4 80.2 ± 7.5 5.86 2.68 11.7 0.23
RF + SM 1 51.7 ± 4.5 44.8 ± 4.5 64.4 ± 5.3 7.26 0.88 11.45 0.08
2 32.3 ± 2.3 27.0 ± 3.4 47.9 ± 2.4 7.27 0.95 11.88 0.08
3 72.5 ± 6.9 62.7 ± 6.7 96.1 ± 2.9 7.84 0.80 11.21 0.07
4 24.3 ± 3.1 19.8 ± 1.9 44.3 ± 2.6 7.30 0.98 11.76 0.08
5 51.7 ± 4.5 44.8 ± 4.5 64.4 ± 5.3 7.26 0.88 11.45 0.08
6 85.2 ± 9.4 75.0 ± 6.2 116.5 ± 13.5 7.23 0.75 11.05 0.07
7 32.3 ± 2.3 27.0 ± 3.4 47.9 ± 2.4 7.27 0.95 11.68 0.08
8 72.5 ± 6.9 62.7 ± 6.7 96.1 ± 2.9 7.84 0.80 11.21 0.07
9 51.7 ± 4.5 44.8 ± 4.5 64.4 ± 5.3 7.26 0.88 11.45 0.08
OP + SM 1 53.0 ± 4.0 43.9 ± 2.6 53.7 ± 1.5 7.13 0.91 10.82 0.08
2 28.1 ± 7.5 26.5 ± 4.8 113.8 ± 25.1 7.01 0.84 10.27 0.08
3 65.4 ± 5.8 61.4 ± 2.9 106.6 ± 46.6 6.85 0.74 9.41 0.08
4 21.1 ± 2.1 19.4 ± 1.6 46.4 ± 0.6 7.38 1.01 11.64 0.09
5 53.0 ± 4.0 43.9 ± 2.6 53.7 ± 1.5 7.13 0.91 10.82 0.08
6 77.6 ± 5.9 73.5 ± 5.1 102.1 ± 8.8 7.12 0.80 9.95 0.08
7 28.2 ± 7.5 26.5 ± 4.8 113.8 ± 25.1 7.01 0.84 10.27 0.08
8 65.2 ± 5.8 61.4 ± 2.9 106.6 ± 46.6 6.85 0.74 9.41 0.08
9 53.0 ± 4.0 43.9 ± 2.6 53.7 ± 1.5 7.13 0.91 10.82 0.08
FV + SM 1 58.1 ± 4.1 52.3 ± 3.2 97.6 ± 6.2 7.48 2.15 7.32 0.29
2 41.5 ± 2.4 36.5 ± 1.5 74.5 ± 4.8 7.60 1.91 8.42 0.23
3 73.5 ± 5.6 66.5 ± 5.8 111.9 ± 12.6 7.23 2.41 6.85 0.35
4 30.8 ± 1.6 26.1 ± 1.4 63.2 ± 5.1 7.71 1.76 9.21 0.19
5 58.1 ± 4.1 52.3 ± 3.2 97.6 ± 6.2 7.48 2.15 7.32 0.29
6 83.5 ± 7.7 76.4 ± 5.2 148.7 ± 21.2 7.04 2.73 5.66 0.48
7 41.5 ± 2.4 36.5 ± 1.5 74.5 ± 4.8 7.60 1.91 8.42 0.23
8 73.5 ± 5.6 66.5 ± 5.8 111.9 ± 12.6 7.23 2.41 6.85 0.35
9 58.1 ± 4.1 52.3 ± 3.2 97.6 ± 6.2 7.48 2.15 7.32 0.29

! 51!
The chemical characterization of the considered substrates is reported in Table 3, for what
concerns TS, VS, COD, pH, VFA and TA, in all EC. MS and FV showed higher VFA
concentrations compared to RF and OP. In the case of MS, this probably was the cause of a
slightly more acidic initial conditions, as compared to the other substrates. FV showed also lower
TA and thereby higher VFA/TA ratios (Table 3.3). Generally, slight differences in pH were
proportional to the dilution of the biomass with SM, depending on the EC.
More interestingly, Table 4 reports the characterization of the treated materials. Generally, a
slight reduction of COD was observed, as expected, after fermentation process in all EC. pH
diminished in the range 4.5 – 5.3 for those EC that showed high H2 productivities (Table 4).
When pH in the digester was higher than 5.3, H2 productivity dropped below 20 NLH2 kg-1VS-added
(Table 3.4). In parallel, VFA/TA ratio in the range 1 – 2.2 corresponded to high H2 yields, while
for low productive EC, VFA/TA ratio was always found in the range 0.3 – 1.3 (Table 4).
Contrarily, VFA concentration alone was not clearly related to productive EC. In many low-
productive EC, high VFA concentrations were measured (up to 12 gacetate kg-1ww, Table 4), as
well as in some highly yielding EC, VFAs were found below 6 gacetate kg-1ww (Table 4).

! 52!
Table 3.4 - Characterization of the fermented organic mixtures (after 1st stage treatment)
Sample EC TS * COD pH out VFA Alk VFA/Alk
g kg-1ww g kg-1
ww g kg-
1ww
g kg-
1ww
MS + SM 1 41.9 ± 1.0 57.4 ± 5.2 5.06 6.08 5.06 1.20
2 38.8 ± 1.1 41.9 ± 5.4 5.23 5.12 5.54 0.92
3 83.0 ± 3.7 81.7 ± 23.7 5.03 5.70 4.79 1.19
4 13.9 ± 2.1 38.5 ± 6.0 5.57 6.61 5.97 1.11
5 47.4 ± 0.8 76.4 ± 4.1 4.82 7.71 6.24 1.24
6 77.1 ± 4.2 109.5 ± 6.7 4.77 7.55 6.88 1.10
7 62.8 ± 1.3 47.9 ± 6.3 4.71 8.54 7.67 1.11
8 83.7 ± 2.1 104.6 ± 1.3 5.10 10.28 9.19 1.12
9 52.9 ± 1.4 71.9 ± 4.2 4.82 8.44 7.47 1.13 RF + SM 1 46.1 ± 11.0 56.2 ± 10.8 5.11 7.23 4.68 1.54
2 31.8 ± 5.4 32.2 ± 5.1 6.16 4.30 6.7 0.64
3 70.4 ± 18.3 66.1 ± 7.3 4.79 6.98 3.99 1.75
4 18.1 ± 1.1 35.2 ± 6.7 6.46 4.81 4.91 0.98
5 47.4 ± 2.4 57.1 ± 4.7 4.83 7.60 6.64 1.14
6 81.9 ± 1.1 114.6 ± 9.5 4.76 12.24 11.37 1.08
7 29.3 ± 5.4 38.1 ± 5.3 5.57 8.96 8.1 1.11
8 68.1 ± 0.3 59.5 ± 2.0 4.78 10.05 8.75 1.15
9 47.4 ± 2.4 43.3 ± 0.3 4.92 7.00 6.73 1.04 OP + SM 1 49.3 ± 3.7 40.8 ± 2.4 6.99 2.39 4.09 0.58
2 26.1 ± 6.9 24.6 ± 4.5 6.35 3.89 4.72 0.82
3 60.8 ± 5.4 57.1 ± 2.7 6.68 4.11 6.73 0.61
4 19.6 ± 2.0 18.1 ± 1.5 7.72 1.40 3.98 0.35
5 49.3 ± 3.7 40.8 ± 2.4 7.27 3.25 5.00 0.65
6 72.1 ± 5.5 68.4 ± 4.8 6.07 4.19 3.80 1.10
7 26.2 ± 6.9 24.6 ± 4.5 6.72 3.62 6.67 0.54
8 60.6 ± 5.4 57.1 ± 2.7 7.18 2.84 3.85 0.74
9 49.3 ± 3.7 40.8 ± 2.4 7.42 2.22 4.50 0.49 FV + SM 1 52.0 ± 2.7 59.8 ± 3.5 5.07 8.54 6.98 1.22
2 29.2 ± 0.6 44.6 ± 7.2 5.63 10.50 9.14 1.15
3 66.6 ± 3.1 81.7 ± 6.6 4.43 8.36 7.12 1.17
4 28.4 ± 1.5 43.4 ± 3.7 5.64 11.23 8.29 1.35
5 50.8 ± 5.4 66.3 ± 7.9 4.88 12.26 5.93 2.07
6 56.4 ± 2.1 113.9 ± 38.6 4.57 11.27 6.54 1.72
7 29.2 ± 3.1 61.7 ± 9.0 5.40 11.46 8.44 1.36
8 57.2 ± 1.9 96.3 ± 20.9 4.34 11.87 7.29 1.63
9 43.9 ± 3.3 75.5 ± 6.1 4.74 12.93 8.21 1.57
* OMC was not measured as VS, because consistent part of the VS of fermented materials are
evaporated during drying

! 53!
3.3.3 Methanogenic process yields
Optimized methane production was measured in batch reactors for raw (single-stage) and treated
materials (2nd stage), excluding those EC that produced less H2 than 30% of the best performing
EC, in terms of H2-yield (NLH2 kg-1VS-added). OP was completely excluded from the test, as soon
as no H2 was produced in any EC.
Methane yields resulted in the range 380 – 500 NLCH4 kg-1VS-added for MS, 240 – 320 NLCH4 kg-
1VS-added for RF and 280 – 370 NLCH4 kg-1
VS-added for FV (Table 2). Average methane
concentrations in the biogas were always relatively high for both second-stage and single-stage
processes (Table 2). FV showed lower CH4 contents, as compared to the other two substrates (55
– 59% v/v), while for MS and RF, methane concentrations ranges were 57 – 71% and 65 – 77%
v/v, respectively (Table 2). Negligible differences in CH4 concentrations were observed between
second-stage and single-stage methanogenic production, for the same biomass (Table 2).
3.3.4 Energy recovery
Hydrogen and methane produced by the two-stage AD process (only the selected EC) were
compared to the methane produced by the single-stage process, in terms of total energy
recovered (Table 5).

! 54!
Table 3.5 - Energy recovery (ER) per kgVS-added to the two-stage and one-stage AD systems
Mixture EC Two-stage ER One-Stage ER Increase of ER
in two-stage
1st stage (H2) 2nd stage (CH4) Total two-stage CH4 % (MJ /MJ)
MJ kg-1VS-
added % of total Two-
stage MJ kg-1VS-added
% of total Two-stage MJ kg-1
VS-added MJ kg-1VS-added
MS + SM 1 1.12 ± 0.10
7.7% 13.35 ± 0.88 92.3% 14.5 ± 1.0 15.17 ± 0.16 -4.6% b**
2 1.54 ± 0.07 12.6% 10.67 ± 0.62 87.4% 12.2 ± 0.7 14.17 ± 1.32 -13.8% b
3 0.54 ± 0.14 4.5% 11.61 ± 3.40 95.5% 12.2 ± 3.5 13.34 ± 0.84 -8.9% b
4 0.16 ± 0.04 -* -* -* -* -* -*
5 0.74 ± 0.10 4.9% 14.28 ± 3.36 95.1% 15.0 ± 3.5 15.17 ± 0.16 -1.0% b
6 0.28 ± 0.09 - - - - -
7 1.27 ± 0.21 6.7% 17.71 ± 0.37 93.3% 19.0 ± 0.6 14.17 ± 1.32 34.0% a
8 0.59 ± 0.03 3.9% 14.56 ± 0.13 96.1% 15.1 ± 0.2 13.36 ± 0.84 13.3% a
9 1.25 ± 0.17 7.6% 15.19 ± 0.53 92.4% 16.4 ± 0.7 15.17 ± 0.16 8.4% a
RF + SM 1 1.63 ± 0.16 15.5% 8.88 ± 0.62 84.5% 10.5 ± 0.8 10.38 ± 0.55 1.3% b
2 0.26 ± 0.05 - - - - -
3 1.61 ± 0.19 15.7% 8.65 ± 0.48 84.3% 10.3 ± 0.7 9.84 ± 0.40 4.2% b
4 0.08 ± 0.05 - - - - -
5 1.48 ± 0.06 12.1% 10.74 ± 1.19 87.9% 12.2 ± 1.3 10.38 ± 0.55 17.8% a
6 0.67 ± 0.49 5.7% 11.12 ± 0.10 94.3% 11.8 ± 0.6 9.52 ± 0.53 23.9% a
7 0.07 ± 0.02 - - - - -
8 1.23 ± 0.14 12.7% 8.44 ± 0.34 87.3% 9.7 ± 0.5 9.84 ± 0.40 -1.7% b
9 1.40 ± 0.10 14.2% 8.45 ± 0.73 85.8% 9.9 ± 0.8 10.38 ± 0.55 -5.1% b
PO + SM 1 0.01 ± 0.01 - - - - -
2 0.17 ± 0.03 - - - - -
3 0.01 ± 0.01 - - - - -
4 0.02 ± 0.01 - - - - -
5 0.01 ± 0.01 - - - - -
6 0.01 ± 0.01 - - - - -
7 0.03 ± 0.02 - - - - -
8 0.01 ± 0.01 - - - - -
9 0.01 ± 0.01 - - - - -
FV + SM 1 0.34 ± 0.11 - - - - -
2 0.01 ± 0.00 - - - - -
3 0.42 ± 0.22 - - - - -
4 0.08 ± 0.02 - - - - -
5 1.58 ± 0.28 10.7% 13.12 ± 0.39 89.3% 14.7 ± 0.7 10.30 ± 1.14 42.7% a
6 0.49 ± 0.18 3.9% 12.13 ± 1.14 96.1% 12.6 ± 1.3 10.27 ± 0.21 22.9% a
7 0.20 ± 0.22 - - - - -
8 1.26 ± 0.07 9.3% 12.22 ± 0.65 90.7% 13.5 ± 0.7 9.78 ± 0.48 37.8% a
9 1.50 ± 0.34 11.6% 11.52 ± 0.97 88.4% 13.0 ± 1.3 9.88 ± 1.09 31.8% a
* Methane production was not considered for EC where H2 yields resulted lower than 30% of the maximum H2 yield

! 55!
** letter a indicates significant (ANOVA for n=3. p<0.05) increase/decrease in ER for the two-stage AD, while
letter b indicates non-significant differences
H2 productions in the 1st-stage ranged from 0.5 to 1.6 MJ kg-1VS-added, corresponding to 4 – 16%
of the whole two-stage AD system production (Table 5). The 2nd stage produced energy in the
ranges 10 – 18, 8 – 11 and 11 – 14 MJ kg-1VS-added for MS, RF and FV, respectively. The one-
stage process generally produced a similar amount of energy, as compared to the 2nd stage. For
this reason, when both 1st and 2nd stage were considered as sum (H2 + CH4) for the total ER of
the two-stage system, in the majority of the cases, the two-stage resulted more productive than
the one-stage (Table 3.5).
ANOVA was performed on two-stage ER vs one-stage ER, to look for the significant differences
(p < 0.05, n = 3). The only case that showed significantly lower ER in the two-stage system was
MS in EC2, while for all other EC, ER was never significantly higher in the one-stage (Table
3.5). On the other hand, nine EC showed significantly higher ER in the two-stage system, with
the highest increase of 42.7% for FV in EC5 (Table 3.5).
3.4 Discussion
Relatively high bio-hydrogen yields were reached through the optimized first-stage approach.
MS produced up to 120 Sdm3 kg-1VS-added, similarly to that found by previous authors [15, 16].
The same authors [16], reported also biohydrogen yields for various kinds of food waste in the
range 60 – 130 Sdm3 kg-1VS-added and the results of the present work were also coherent with
previous experience by Tenca et al., obtained with the same substrate (FV + SM) [11]. The low
productivity of OP was not a surprise. Other authors have worked on the same substrate and
found similar biohydrogen yields (< 10 Sdm3 kg-1VS-added) [17, 18].
The obtained data give a robust contribution to demonstrate the general supremacy of the two-
stage AD system, as compared to the one-stage approach. The method chosen in this work, i.e. to

! 56!
optimize both hydrogenesis and methanogenesis, allowed overcoming inhibition/inefficiencies
that could hide a general result, as happened in previous experiences (Schievano et al., 2012). In
that paper, two- and one-stage gave the same ER, even if a clear partial inhibition of the two-
stage was observed [10]. In this work, with the same substrate (FV + SM) used by Schievano et
al. [10], the two-stage was demonstrated to be potentially (i.e. when both processes are
optimized) more productive than the one-stage.
Generally, higher ER in the two-stage system didn’t correspond to higher H2 yields and, in any
case, relatively high increases in ER (15 – 30%) were found even if H2 counted for only 5 – 10%
of the total ER. This confirms the hypothesis drawn by Luo et al. [6], according to which the real
advantage created by the two-stage approach should be linked to more efficient methanogenesis,
helped by pre-hydrolysis and pre-fermentation optimized in the first stage. Additionally, ER as
hydrogen helps in increasing this advantage. In fact, to our knowledge, in a traditional one-stage
process, comparable amounts of hydrogen are produced, while simultaneously converted into
methane by hydrogenotrophic communities by the following reaction (12H2 + 4CO2 -> CH4 +
8H2O). This reaction, as all microbial process, require a fraction of energy for microbial
methabolism and, as all microbial process, could sometimes and somehow be inefficient,
depending on many factors. In the two-stage, instead, all energy contained in H2 is recovered,
thanks to physical separation of the fuel from the liquid phase.
This could be confirmed only by performing deeper characterization of the organic matter before
and after the first-stage treatment, such as soluble carbon on total carbon, biodegradability tests
and metabolite speciation.

! 57!
3.5 Conclusions
This study was a first attempt, aimed at creating a new methodology for more comprehensively
demonstrate the potentialities of the two-stage AD system. In future, this approach should be
completed by deeper analytical procedures regarding both chemical and microbiological aspects.
3.6. Reference List
[1] Martinez-Perez N, Cherrymanb SJ, Premier GC, Dinsdale RM, Hawkes DL, Hawkes FR,
Kyazze G, Guwy AJ. The potential for hydrogen-enriched biogas production from crops:
Scenarios in the UK. Biomass Bioenerg 2007; 31: 95–104.
[2] Cavinato C, Bolzonella D, Fatone F, Giuliano A, Pavan P. Two-phase thermophilic anaerobic
digestion process for biohythane production treating biowaste: preliminary results. Water Sci.
Technol 2012: 37:11549–11555.
[3] Gavala HN, Skiadas IV, Ahring BK. Biological hydrogen production in suspended and
attached growth anaerobic reactor systems. Int J Hydrogen Energ 2006; 31:1164–1175.
[4] Antonopoulou G, Gavala HN, Skiadas IV, Angelopoulos K, Lyberatos G. Biofuels
generation from sweet sorghum: Fermentative hydrogen production and anaerobic digestion of
the remaining biomass. Bioresource Technol 2008; 99:110–119.
[5] Park MJ, Jo HJ, Park D, Lee DS, Park JM. Comprehensive study on a two-stage anaerobic
digestion process for the sequential production of hydrogen and methane from cost-effective
molasses. Int J Hydrogen Energ 2010; 35:6194–6202.
[6] Luo G, Xie L, Zhou Q, Angelidaki I. Enhancement of bioenergy production from organic
wastes by two-stage anaerobic hydrogen and methane production process. Bioresour. Technol.
2011;102:8700−8706.
[7] Fox P, Pohland FG. Anaerobic treatment applications and fundamentals: substrate

! 58!
specificity during phase separation. Water Environ Res 1994; 66:716–724.
[8] Liu D, Zeng RJ, Angelidaki I. Hydrogen and methane production from household solid waste
in the two-stage fermentation process. Water Res 2006; 40:2230−2236.
[9] Pakarinen OM, Tahti HP, Rintala JA. One-stage H2 and CH4 and two-stage H2+CH4
production from grass silage and from solid and liquid fractions of NaOH pre-treated grass
silage. Biomass Bioenerg 2009; 33:1419–1427.
[10] Schievano, A, Tenca A, Scaglia B, Merlino G, Rizzi A, Daffonchio D, Oberti R, Adani F.
Two-stage vs single-stage thermophilic anaerobic digestion: comparison of energy production
and biodegradation efficiencies. Environ Sci Technol 2012; 46:8502–10.
[11] Tenca A, Schievano A, Perazzolo F, Adani F, Oberti R. Biohydrogen from thermophilic co-
fermentation of swine manure with fruit and vegetable waste: Maximizing stable production
without pH control. Bioresour Technol 2011; 102:8582–8588.
[12] NIST/SEMATECH e-Handbook of Statistical Methods.
http://www.itl.nist.gov/div898/handbook/, accessed 12 March 2013
[13] Schievano A, Scaglia B, D’Imporzano G, Malagutti L, Gozzi A, Adani F. Prediction of
biogas potentials using quick laboratory analyses: Upgrading previous models for application to
heterogeneous organic matrices. Bioresour Technol 2009; 100:5777–5782.
[14] APHA – American Public Health Association. Standard Methods for the Examination of
Water and Wastewater, 1998; 20th ed. APHA, Washington, DC.
[15] Li YC, Nissila ME, Wua SY, Lin CY, Puhakka JA. Silage as source of bacteria and
electrons for dark fermentative hydrogen production. Int J Hydrogen Energ 2012; 37:15518–
15524.

! 59!
[16] Guo XM, Trably E, Latrille E, Carrere H, Steyer JF. Hydrogen production from agricultural
waste by dark fermentation: A review. Int J Hydrogen Energ 2010; 35:10660–10673.
[17] Kontrouli EC, Gavala HN, Skiadas IV, Lyberatos G. Mesophilic biohydrogen production
from olive pulp. Process Saf Environ 2006; 84:285–289.
[18] Koutrouli EC, Kalfas H, Gavala HN, Skiadas IV, Stamatelatou K, Lyberatos G. Hydrogen
and methane production through two-stage mesophilic anaerobic digestion of olive pulp.
Bioresour Technol 2009; 100:3718–3723.
! 60!
4. THREE-STAGE TECHNOLOGY TO COUPLE ANAEROBIC DIGESTION AND
MICROBIAL FUEL CELLS
To be submitted
Abstract
Two-stage AD (anaerobic digestion) is a promising technology to improve the already well-
established singl-stage process. To analyze the feisability of an amplification of the advantages
coming from two-stage AD, a MFC (microbial fuel cell) system was paired with CSTR AD
reactors, both single- and two-stage.
The use of an already tested biomass in a more realistic lab reactor allowed to prove that, for the
considered conditions, no relevant differences are noticeable between the two technologies. Outputs
coming from these reactors were then used as feeding for MFCs.
The overall energetic yield proved to be indeed higher in two-stage AD output fed MFC if
compared to single-stage fed: MFC technology allows to increase the total volumetric energy
production of 8,77% for two-stage and 4.39% for single-stage AD output fed MFCs.
Keywords: Two-stage anaerobic digestion, biohydrogen, biomethane, biomass, MFC
4.1 Introduction
Now more than ever energetic supplying and environmental impact represent a concern for world
society. Energy consumption practically doubled in the last three decades with 80% of energy
obtained from fossil fuels (IEA, 2005).
This leads to search solutions to some prioritarial problems, such as the exhaustion of limited, non
renewable fossil sources and the consequences of environmental pollution and climate change. In
this context the struggle for efficient, sustainable and renewable sources is becoming a major
concern.
While single stage anaerobic digestion (AD) already proved to be a reliable way to obtain energy in
form of methane gas from bacterial degradation of biomass, the two-stage process is showing

! 61!
interesting perspectives as a viable technology to coproduce hydrogen and methane in two separate,
in-series reactors from a vaste variety of waste materials (Ting and Lee, 2007; Xie et al., 2008).
According to some authors, splitting the reaction at the stages of hydrolysis/acidogenesis and
methanogenesis could enhance the overall reaction rate, maximize biogas yields, and make the
process easier to control, both in meso- and thermophilic conditions (Blonskaja et al., 2003; Liu et
al., 2006).
Hydrogen is emerging as a promising fuel, thanks to its high specific heat and virtually null
dangerous emissions (Nath and Das, 2004). Despite present technological limitations and
challenges, hydrogen is considered to be a possible energy carrier for the future, and developing
sustainable methods to obtain hydrogen from renewable sources, other than fossil-fuel based
technologies, is necessary in order to fully achieve the potential economical and environmental
benefits. The chance to obtain this efficient fuel from a renewable, eco-sustainable process
(compared to the other fossil fuel-based pathways, i.e. steam reforming, thermal cracking, coal
gasification and partial oxydation) enhances its potential in the biological fuel landscape.
While it is vastely known, from previous studies, how operative parameters (temperature, pH etc.)
and possible pretreatments can influence the biomethane production, work is still to be done on the
analysis of how chemical composition of biomass affects hydrogen production.
According to Lay et al. (2003), carbohydrates-rich biomass show a hydrogen yield up to 20 times
higher than proteins- and fat-rich biomass. For the latter, an optimum pH point for hydrogenic
fermentationt is 6, while the former have an optimum at 5.
More recent studies (Kim et al., 2012) focused on improving operative conditions in order to obtain
a good hydrogen production rate from fat substrates. Anaerobic digestion was carried out in reactors
fed with lard (with obvious high lipidic content); these reactors were equipped with a stirring and a
CO2-removal system. Hydrogen production was noticed in both situations; still, the conditions of
production of the system provided with CO2 remover was about 3 times higher than with the stirrer
by itself; also a better consumption of VFA (Volatile Fatty Acids) was noticed. Combining both

! 62!
methods allowed an even higher hydrogen production and no methane in gas. These data proved
how even a lipidic-rich biomass could lead to a significative hydrogen production under specific
operative parameters. Gallert and Winter (1997) analyzed how termophilic bacteria, such as those
implied in two-stage AD hydrogenic phase, can stand higher levels of ammonia from protein
degradation compared to mesophilic ones, thus suggesting a possibile suitability of protein-riche
biomass for hydrogen production.
Another possible source of clean, ready-to-use energy are bioelectrochemical systems (BESs),
especially of the microbiological kind (MBESs), such as microbial fuel cells (MFC) and microbial
electrolysis cells (MEC). They in fact allow the combined production of electric energy (MFC),
biohydrogen (MEC) and the depuration of wastewaters throug organic load reduction(Rabaey et al.,
2010). An additional advantage from this technologies is the lower greenhouse gases emission from
energy production, compared to traditional systems (Rabaey & Verstraete, 2005). At present, MFC
are the most widespread BESs technology (Franks & Nevin, 2010): energy in organic substrates’
chemical bounds is turned to electricity by anaerobic bacteria (Geobacter, Shewanella,
Proteobacter, Pseudomonas) (Du et al., 2007). Organic matter oxydation paired with terminal
electron acceptor (TEA, usually oxygen) allows continuous electric production (Logan, 2008).
Recently, Schievano et al. (2012) compared mono-stage and double-stage AD working on a semi-
continuous system for hydrogen production (first stage) and in a CSTR reactor for the second stage
and single stage AD. This study goes further in the analysis of two-stage anaerobic digestion and
proposes a three-stage concept, using MFCs in series after AD and allowing a comparison of one-
stage, two-stage and three stage anaerobic systems.
4.2 Materials and methods
4.2.1 Anaerobic Digestion (Single-, First- and Second stage)
Three! continuous! flow! stirred! tank! reactors! (CSTR),! in! ‘’wet’’! AD! conditions! (total! solids! <!
10%!w/w),!were!used!in!this!study!and!the!reactor!designs!are!reported!in!Figure!S4.1.!The!

! 63!
wet! CSTR! was! chosen,! as! soon! as! it! is! one! of! the! most! used! type! of! AD! in! fullTscale!
applications.! The! twoTstage! process! consisted! of! a! 0.25! L! hydrogenTproducing! reactor!with!
0.2!L!working!volume!(R1)!and!a!3!L!reactor!with!2!L!working!volume!for!methane!production!
(R2).!The!singleTstage!process!consisted!of!a!3!L!reactor!with!2!L!working!volume!(R3).!The!
same! feeding!mixture!was! added! both! to!R1! and!R3! after! the! removal! of! an! equal! amount!
(measured!as!wet!weight)!of!effluent!from!the!reactors.!Hydraulic!retention!time!(HRT)!were!
of!3,!30!and!33!days!for!the!reactor!R1,!R2!and!R3,!respectively!(Figure!4.1).!!
!
Fig.4.1:!AD!reactors!and!MFC!structure.!
The!feeding!procedure!was!in!semiTcontinuous!regime,!i.e.!twice!a!day!the!digestate!was!
removed!and!equal!volume!of!feeding!mixture!was!inserted!in!each!reactor.!The!operational!
HRT!of!R1!was!chosen!according!to!previous!experiences!on!optimized!bioThydrogen!
production!from!organic!waste!materials!(Schievano!et!al.,!2013).!HRTs!of!the!methanogenic!

! 64!
phases!were!chosen!based!on!the!batch!biochemical!methane!potential!tests!performed!on!the!
same!organic!mixture!by!Schievano!et!al.!(2013).!!The!overall!HRT!of!twoT!and!singleTstage!
processes!were!equal!(33!d),!in!order!to!make!them!comparable.!The!three!digesters!were!
simultaneously!and!continuously!mixed!for!15Tseconds!every!45Tseconds!and!kept!at!a!
temperature!of!55!±!2!°C!via!water!bath!through!water!jackets!surrounding!the!reactors.!!
During!the!trial!period!the!pH!in!the!three!reactors!was!not!actively!controlled!or!adjusted!
and!was!dependent!on!the!process!natural!conditions.!pH!and!temperature!of!the!
fermentative!broth!were!measured!in!continuous!by!three!different!InPro!3253/225/pt1000!
electrodes!(MettlerTToledo!international!inc.).!Gas!flowTmeters!(adm!2000!model,!Agilent!
technologies)!were!installed!in!each!reactor!to!record!automatically!the!gas!production.!
Biogas!volumes!were!registered!as!cumulated!every!minute!and!daily!(over!24!h)!cumulated!
amount!was!accounted.!Biogas!composition,!also,!was!determined!daily,!using!a!gas!
chromatograph:!H2,!CH4!and!CO2!relative!concentrations!(v/v)!were!measured.!Methane!and!
hydrogen!productions!were!calculated!as!daily!cumulated!production!volume.!
4.2.2 Third stage: Electrodes and bioreactors
Single-chamber, air–cathode MFCs containing graphite fiber brush anodes were constructed as
previously described (Logan et al., 2007). Each reactor consisted of a liquid chamber 4 cm long by
5 cm in diameter, with a liquid volume of 28 mL. Brush anodes were made of a core of two
titanium wires with graphite fibers (PANEX33 160 K, ZOLTEK) cut to 2.5 cm in outer diameter
and 2.5 cm long. Each brush had an estimated surface area of 0.22 m or 18, 200 m2 m3-brush
volume for the brush, with 95% porosity (Logan et al., 2007). The cathodes (3.8 cm diameter, 7 cm2
total exposed surface area) were made by applying a platinum catalyst (0.4 mg Ptcm2, BASF) on
the liquid-facing side of a 30 wt.% wet-proofed carbon cloth (type B-1B, BASF, US), while four
PTFE diffusion layers were added on the air-facing side (Cheng et al., 2006). Cells were connected
to an external resistor (Rex = 1 kΩ); the whole system was hence connected to a multimeter (2700;

! 65!
Keithley, United States) to measure outcoming voltage. Data were stocked on a computer.
Digestate from single stage and from second reactor of two-stage AD were centrifuged; the liquid
phase was diluted 1:2 in water and used as feeding for MFC reactors.
All tests were performed in duplicate.
4.2.3 Chemical analysis
Both biomass, feeding mixtures and digestates were characterized. pH and conductivity were
measured using pH meter and conductivity meter (PC 2700, Eutech Instruments, Netherlands).
Total Solids (TS) and Volatile Solids (VS) content was evaluated according to standard procedure
(Sluiter et al., 2003). TKN (Total Kjeldhal Nitrogen) was calculated on fresh material, while N-
NH4+ content was used to evaluate the total protein content of samples (Bremner, 1996).
Total chemical oxygen demand (TCOD), biological oxygen demand (BOD5) were measured
according to Standard Methods (APHA, AWWA, WPCF, 1998).
Polarization curves were obtained by varying the external resistance (10–10,000 Ω) every 30 min.
and measuring the cell voltage (Sciarria et al., 2013)
4.3 Results and discussion
4.3.1 AD reactors
In table 4.1 chemical characterizations of rice middlings and swine manure are shown.
Tab.4.1: biomass characterization
pH TS VS Tot Alk TVFA NH4
+ TN
g kg -1 g kg TS -1 mg CaCO3 l-1 mg CH3COOH l-1 mg l-1 g kg -1
Rice middling -- 890±3 879±1 -- -- -- -- Swine manure 6.93±0.06 21.2±0.3 733±1 7752±153 5285±112 1290±21 1.67±0.08
Rice middlings confirmed to be a particularly dry biomass, with a total solids content of 890 g kg-1,
while for swine manure it was way lower, 2.1 g kg-1; rice middlings volatile solids content was 879
g kg-1of dry matter compared to 733 g kg-1 of swine manure. For the latter pH, VFA, alkalinity and

! 66!
nitrogen content were measured too.
In figure 4.2 results from biogas and chemical analysis of single stage reactor are shown.
Fig. 4.2: Methane content, rate and yield (left) and pH, VFA and alkalinity (right) for single stage
reactor.
CH4 production rate was mainly stable during the whole test, with a value around 17.4 Ndm3 L-1 dig
d-1. CH4 production yield has an average value of 251 Ndm3 kg-1 VS added and reached its
maximum (305 Ndm3 kg-1 VS added) on day 4, while CH4 content in biomass peaked on day 30
(73.5 %v/v). pH was overall stable (pH=8), except for a peak (8.4) on day 31; VFA content was low
(average 1156 mg acetic acid L-1 dig) and alkalinity ranged from 8610 to 11023 mg CaCO3 L-1 dig.
Figures 4.3 and 4.4 show the trends of two-stage AD reactor, first- and second stage respectively.
Fig. 4.3: Hydrogen content, rate and yield (left) and pH, VFA and alkalinity (right) for first stage
reactor.
Single stage
Time (d)
0 10 20 30 40
CH
4 co
nten
t in
biom
ass
(% v
/v)
0
20
40
60
80
100
CH
4 pr
oduc
tion
rate
(N
dm3 L
-1di
g d-1
)0
1
2
3
4
5
6
CH
4 pr
oduc
tion
yiel
d (N
dm3 k
g-1V
S a
dded
)
0
100
200
300
400
500
CH4 content CH4 production rate CH4 production yield
Single stage
Time (d)
0 10 20 30 40
pH
4
5
6
7
8
9
TV
FA
(m
g ac
etic
aci
d L-1
dig)
0
2000
4000
6000
8000
10000
12000
14000
16000
Tot
al a
lkal
inity
(m
g C
aCO
3 L-1
dig)
0
2000
4000
6000
8000
10000
12000
14000
16000
pH TVFA Total alkalinity
First stage
Time (d)
0 10 20 30 40
H2
cont
ent i
n bi
ogas
(%
v/v
)
0
20
40
60
80
100
H2
prod
uctio
n ra
te (
Ndm
3 L-1
d-1
)
0
1
2
3
4
5
6
H2
prod
uctio
n yi
eld
(Ndm
3 kg-1
VS
add
ed)
0
100
200
300
400
500
H2 content
H2 production rate
H2 production yield
First stage
Time (d)
0 10 20 30 40
pH
4
5
6
7
8
9
TV
FA
(m
g ac
etic
aci
d L-1
dig)
0
2000
4000
6000
8000
10000
12000
14000
16000
Tot
al a
lkal
inity
(m
g C
aCO
3 L-1
dig)
0
2000
4000
6000
8000
10000
12000
14000
16000
pH TVFA Total alkalinity

! 67!
For hydrogenic reactor, methane production was nearly null (due to process characteristics) and
thus was not reported. Still, biogas produced proved to be rich in hydrogen, with an average H2
content of 50.9%, with a peak of 53.6%, and a production rate ranging from 2.05 Ndm3 L-1 d-1 to
3.12 Ndm3 L-1 d-1 . Still, H2 production yield was stable and low (0.38 Ndm3 kg-1 VS added). pH
value was lower than single stage (as expected) and hovered around 5. VFA and alkalinity patterns
were similar in trend, with average values of 8221 mg acetic acid L-1 dig and 9397 mg CaCO3 L-1
dig respectively.
Fig 4.4: Methane content, rate and yield (left) and pH, VFA and alkalinity (right) for second stage
reactor.
In figure 4.4, gas production (on the left) and pH, VFA and alkalinity values (right) are shown. CH4
content in biogas reached an average of 66,7 %, with a maximum of 70,7%. Average produtcion
rate was 14.3 Ndm3 L-1 dig d-1, ranging from 10.3 Ndm3 L-1 dig d-1 to 18.4 Ndm3 L-1 dig d-1. As for
CH4 production yield, a peak of 270 Ndm3 kg-1 VS added, with an average of 214 Ndm3 kg-1 VS
added.
pH value was stable (8) while average VFA and alkalinity content were 1756 mg acetic acid L-1 dig
and 9117 mg CaCO3 L-1 dig respectively.
Second stage
Time (d)
0 10 20 30 40
CH
4 con
tent
in
biog
as (%
v/v
)
0
20
40
60
80
100
CH
4 pro
duct
ion
rate
(Ndm
3 L-1
dig
d-1)
0
1
2
3
4
5
6
CH
4 pro
duct
ion
yiel
d (N
dm3 k
g-1VS
add
ed)
0
100
200
300
400
500
CH4 content CH4 production rate CH4 production yield
Second stage
Time (d)
0 10 20 30 40
pH
4
5
6
7
8
9
TVFA
(mg
acet
ic a
cid
L-1di
g)
0
2000
4000
6000
8000
10000
12000
14000
16000
Tota
l alk
alin
ity (m
g C
aCO
3 L-1
dig)
0
2000
4000
6000
8000
10000
12000
14000
16000
pH TVFA Total alkalinity

! 68!
Tab.4.2: chemical analysis on feeding mixtures and digestates
Two-stage Single-stage
Feeding First (F) Second (S)
TS g kg-1 114.3±0.5 107.7±7.8 53±9.0 59.8±6.3
VS g kg-1 TS 857.4±2.05 846.9±9.0 764.6±21.9 769.7±0.6
TS reduction % of fed 5.8±1.1 50.8±6.8
53.6±5.2 (F+S)
47.7±5.5
VS reduction % of fed 5.6±0.9 55.6±7.9
58.6±8.3 (F+S)
53.03±6.1
VS-OLR g VS L-1 d-1 65.3±5.8 2.28±0.08
2.36±0.2�F+S�
2.36±0.3
pH 7.09±0.08 5.16±0.08 8.01±0.09 7.99±0.09
TVFA mgCH3COOH kg-1 4825±96 8221.4±656.5 1755.9±680.9 1156.1±199
TA mgCaCO3 kg-1 7103±155.5 9397.6±579 9116.9±827 9397.6±734
TVFA/TA mgCH3COOH mg-1CaCO3 0.7±0.02 0.88±0.05 0.19±0.06 0.12±0.02
N-NH4+ g kg-1 1.25±0.034 1.19±0.1 1.82±0.1 2.05±0.2
TN g kg-1 2.98±0.05 2.9±0.3 2.5±0.1 2.8±0.1
N-NH4+/TN % 43±2 41±3 74±4 73±2
The two-stage process shows a better total solids reduction when considering both reactors when
compared to the single-stage one. A similar decrease trend is witnessed for volatile solids; this data
are significant to testify that two-stage AD allows a better biomass degradation. Still, the VFA
content in the output from second stage reactor is significantly higher than that from single stage
one, thus pointing out a chance for a better overall degradation, reachable through different, longer
retention times.Total nitrogen and ammonia contents are, on the other hand, similar.
Table 4.3 shows bigas and energy production and comparison between single- and two-stage

! 69!
processes.
Tab.4.3: biogas (volume, composition, rate and yield) production and energetic yield from single-
and two-stage reactors.
Two-stage Single-stage
F A B
Average
(40 d)
Var.
(per d)
Average
(40 d)
Var.
(per d)
Average
(40 d) Var. (per d)
Volumetric biogas
production rate Ndm3 L-1
dig d-1 4.84 0.2 0.74 0.01 0.95 0.01
Hydrogen content in
biogas % v/v 50.9 2.57 �0.1
�0.1
Methane content in biogas % v/v �0.1
66.7 9.3 62.7 10.7
Carbon dioxide content in
biogas % v/v 49.1 2.4 33.1 10.7 37.1 11.6
Volumetric hydrogen
production rate Ndm3
H2 L-1
dig d-1 2.5 0.05 Udl
Udl
Volumetric methane
production rate
Ndm3CH4
L-1dig
d-1 Udl
0.49 0.005 0.59 0.005
Hydrogen/methane
production yield
Ndm3H2/CH4 kg-
1VS added
37.7 10.9 214.5 21 251.4 25
Volumetric energy
production rate kJ L-1 dig d-1 15.65 1.87 14.5 4.8 17.4 4.8
Energetic yield MJ kg-1 VS added 0.38 0.001 6.37
6.75 (F+A)
0.92
0.7 7.39 0.86
These data don’t allow to state that a significant difference in energy production between the two
processes exists. The difference (energetic yield seems higher in single stage than in two-stage
process) may not depend on actual process issues but on the unsufficient number of collected data.
When calculating energy obtained from biogas from the two processes in a cogenerator, both result
in a value of 8 W.

! 70!
4.3.2 MFC
Input and output from MFC underwent a chemical characterization to analyze organic matter
depletion.
Tab.4.4: feeding and output characterization for single stage process.
Average in Average out Δ Δ (%)
COD g l-1 6.80±1.5 5,60±0.4 1.2 17.5
BOD mg l-1 6,70±1.2 5±1.3 1.6 24.5
NH3 mg l-1 772±52 593±50.7 179 23.2
NO3- mg l-1 25.3±2.5 26±6.3 -0.7 -2.9
TKN % 991±31.8 774±72.5 217 21.9
Total Alkalinity mgCaCO3 kg-1 3658±348 3295±59.5 363 9.9
Inorganic Alkalinity mgCaCO3 kg-1 2584±221 2396±207.3 188 7.3
VFA mgCH3COOH kg- 572±7.78 394±73.9 178 31.1
pH 8.10±0.1 8.23±0.22 -0.1 -1.6
Conductivity mS 7.88±0.78 7.16±0.36 0.7 9.2
Data show a diminuition in most of parameters. COD goes from a value of 6.80 g l-1 in feeding to
5.6 g l-1 in output, with a Δ of 1.2 g l-1 (17.5 %). A similar trend is witnessed for most parameters,
with a Δ of 24.5 % for BOD, 23.2 % for NH3 and 21.9% for TKN . Both total and inorganic
alkalinity decrease of 9.9% and 7.3% respectively. VFAs value goes from 572 to 394 mg
CH3COOH l-1, with a depletion of 31.1%. Conductivity shows a diminuition of 9.2%. Opposite
trends witnessed for NO3- and pH (Δ=-2.9% and Δ=-1.6%) may depend not on process but on
collected data.

! 71!
Tab.4.5: feeding and output characterization for second-stage process.
Average in Average
out Δ Δ (%)
COD g l-1 6.90±0.2 5,40±0.3 1,6 22.4
BOD mg l-1 6,53±0.23 4.8±0.1 1.8 27
NH3 mg l-1 771±0.2 629±36.1 142 18.4
NO3- mg l-1 24.10±3.3 21.8±2.4 2.4 9.8
TKN % 912±41.7 739±18.2 173 19
Total Alkalinity mgCaCO3 kg-1 3644±410.2 3216±173 428 11.7
Inorganic
Alkalinity mgCaCO3 kg-1 2233±12.4 2335±324.8 -101.6 -4.5
VFA mgCH3COOH
kg- 803±96 397±80 406 50.5
pH 8.33±0.02 8.23±0.1 0.1 1.1
Conductivity mS 7.72±0.21 7.09±0.5 0.5 8.2
Trend for process running on second-stage output show some differences when compared to single-
stage one. Most parameters decrease during run in MFCs, except for inorganic alkalinity (Δ=-
4.5%). NH3 decrease (18.4%) is lower than that of single-stage process, as well as TKN (19%) and
Conductivity (8.2%). Still, it is interesting to point out that parameters more closely connected to
process’ efficiency (such as COD, BOD and VFA) present an higher Δ (22.4%, 27% and 50.5%
respectively) when compared to the other process.
A better degradation of organic matter, as seen in higher COD and BOD Δ from second stage
feeding, is correlated to a better energy production; this evidence shows a general improved
performance from two-stage process.

! 72!
For every test four voltage cycles were performed. Both experiments allowed to reach similar
voltage peaks (≈ 0.50 V) (data not shown), but different power peaks, as shown in figures 4.5 and
4.6.
Fig.4.5: Polarization and power curves from single-stage output fed MFC
Fig.4.6: Polarization and power curves from single-stage output fed MFC.
As shown in the graphs, second-stage fed MFC resulted in a better performance, with a value of
0!50!100!150!200!250!300!350!400!450!500!
0!100!200!300!400!500!600!700!
0! 200! 400! 600! 800! 1000! 1200! 1400!
Power$density$(m
W$m
52)$
Cell$Voltage$$(m
V)$
Current$density$(mA$cm52)$
Polarization!curve! Power!curve!
0!
100!
200!
300!
400!
500!
600!
0!
100!
200!
300!
400!
500!
600!
700!
0! 200! 400! 600! 800! 1000! 1200! 1400! 1600! 1800!
Power$density$(m
W$cm
52)$
Cell$Voltage$(mV)$
Current$density$(mA$cm52)$
"Polarization!curve"! "Power!curve"!

! 73!
power density of 477 mW/m2 (500 Ω), while single-stage one only 430 mW/m2 (500 Ω). These
values refer to the surface as m2 of the catode used for the essay and are representative of the cell-
system functioning. What is more interesting is to relate energy production to our reactors’ volume,
in order to compare the total energy production from both technologies (AD and MFC). Volumetric
power of our MFC system was determined as described previously by Logan (2006 e 2008), the
volumetric power calculated from polarization curves is 12.2 W/m3 (430 mW/m2, 500 Ω) for single
stage and 13.3 W/m3 (477.37 mW/m2,500 Ω), for second stage fed MFC. To confront the energy
production from the two systems (AD reactors and MFC), volumetric power was evaluated for AD
reactors too (based on volumetric gas production and calorific power), finding values of 182 W/m3
for single stage reactor and 171 W/m3 for two-stage reactor, considering the energy loss due to gas
immission in a cogeneration engine. MFC technology therefore allows an improvement in power
generation of 4.39% for single stage, while for two-stage the increase is of 8.77%. From this point
of view, a three-stage systems shows better performances when run on output from second-stage
AD.
4.5 Conclusions
Single- and two-stage AD don’t show significant differences in energy production if considered
singularly. Still, a better energy production from two-stage AD (deriving from a more performant
organic matter degradation) is visible when digestates coming from AD reactors are used as feeding
mixtures for MFC technologies.
4.6 References
IEA, 2005. Key World Energy Statistics. Ed. IEA (International Energy Agency), OECD Parigi
Ting, C. H.; Lee, D. J. 2007. Production of hydrogen and methane fromwastewater sludge using
anaerobic fermentation. J. Hydrogen Energy, 32 (6), 677−682.

! 74!
Xie, B., Cheng, J., Zhou, J., Song, W., Liu, J., Cen, K. 2008. Production of hydrogen and methane
from potatoes by two-phase anaerobic fermentation. Bioresour. Technol., 99 (13), 5942−5946.
Blonskaja, V.; Menert, A., Vilu, R. 2003. Use of two-stage anaerobic treatment for distillery waste.
Adv. Environ. Res., 7 (3), 671−678.
Liu, D., Zeng, R. J., Angelidaki, I. 2006. Hydrogen and methane production from household solid
waste in the two-stage fermentation process. Water Res., 40 (11), 2230−2236.
Nath, K., Das, D. 2004. Improvement of fermentative hydrogen production: various approaches.
Appl. Microbiol. Biotechnol., 65, 520-529
Lay J., Fan K., Chang J., Ku K., 2003. Influence of chemical nature of organic wastes on their
conversion to hydrogen by heat-shock digested sludge. Int. J. Hydrogen Energy 28, 1361-1367.
Kim H., Moon S., Abug A., Choi S., Zhang R., Oh Y. 2012 Effect of fermentation conditions on
biohydrogen production from lipid-rich food material. Int. J. Hydrogen, 37, 15062-15069.
Gallert C., Winter J. 1997. Mesophilic and termophilic anaerobic digestion of source-sorted
organic waste: effect of ammonia on glucose degradation and methane production. App.
Microbiology Biotechnology, 48, 405-410.
Rabaey, K., Angenent, L., Schroder, U., Keller, J., Bioelectrochemical Systems: from extracellular
electron transfer to biotechnological application, 2010

! 75!
Rabaey, K. and Verstraete, W., Microbial Fuel Cells: novel biotechnology for energy generation,
2005.
Franks, A. E. and Nevin, K. P., Microbial Fuel Cells, A Current Review, 2010.
Du, Z., Li, H., Gu, T., A state of the art review on microbial fuel cells: A promising technology for
wastewater treatment and bioenergy, 2007.
Logan, B. E., Microbial Fuel Cells, 2008.
Sluiter, A.D., Hames, B.R., Ruiz, R.O. 2003. Rapid Biomass Analysis: New Analytical Methods
Supporting Biomass Pretreatment Research. 25th Symposium on Biotechnology for Fuels and
Chemicals, Breckenridge, CO.
Bremner J.M., 1996. Nitrogen – Total. Methods of soil analysis, part 3 – chemical methods. 1085-
1121.
APHA, AWWA, WPCF, 1998. Standard Methods for the Examination of Water and Wastewater,
20th ed. American Public Health Association, Washington, DC.
Sciarria T.P., Tenca A., D’Epifanio A., Mecheri B., Merlino G., Barbato M., Borin S., Licoccia S.,
Garavaglia V., Adani F. 2013. Using olive mill wastewater to improve performance in producing
electricity from domestic wastewater by using single-chamber microbial fuel cell. Bioresource
Technology (147), 246-253.
Logan, B.E., Aelterman, P., Hamelers, B., Rozendal, R., Schröeder, U., Keller, J., Freguiac, S.,
Verstraete, W., Rabaey, K., 2006. Microbial fuel cells: methodology and technology. Environ. Sci.
Technol. 40, 5181–5192

! 76!
Logan, B.E., 2008. Microbial Fuel Cells. Wiley, New York.

! 77!
5. ANAEROBIC DIGESTION FOR THE PRODUCTION OF HYDROGEN AND
METHANE: FROM LABORATORY TO FULL SCALE
5.1 Introduction
Each year in Italy 220 million cubic meters of biogas are produced, against a potential of 54 billion
cubic meters; produced biogas is currently used primarily by co-generators for the production of
electricity and heat in situ.
The term “biomethane" refers to a biogas that underwent a refining process to reach a methane
concentration of 95%; it is used as a biofuel for motor vehicles as much as fossil methane gas.
Biogas is produced by biological breakdown of organic matter without oxygen in a process known
as anaerobic digestion (AD).
AD can take place in a controlled environment (digester) with a methane content in biogas
produced equal to 55-65%, or even in landfills due to the decomposition of waste: in this case the
biogas or landfill gas contains a percentage of methane up to 45%.
The main raw materials used in AD process are:
-Urban wastewaters and sludge;
-Slaughterhouse and farming wastewaters;
-Wastes from markets and food industry;
-Domestic organic wastes;
-Gardening wastes;
Specific crops such as forage or switchgrasstoo can be conveniently used for the process of AD.
However, the most common raw material in Europe is sewer wastewater, used for the integrate
depuration and AD process.
In Great Britain, about 75% of sewage is treated this way, and the resulting gas is used to produce
heat and electricity. In Lille, France, the city's sewer system is a source of raw material to produce
biogas, which is then refined to be used as fuel for buses.
! 78!
Waste and by-products from agriculture, food industry and dedicate crops can be used on-site in
small digesters, as happens in Germany or Italy.
Raw biogas can be combusted directly to produce heat or electricity after having undergone
minimal processing of filtration and purification. The biogas can be used in the same vehicles that
employ commonly natural gas or methane of fossil origin.
Anaerobic digestion is a well established process that has been spreading in recent decades as one
of the best, most versatile and easily reproducible technologies for the production of renewable
energy from biomass, especially from waste biomass of the various sectors of human activity.
Currently, the production of biogas is associated with the production of electrical energy, through
the direct utilization of the biogas in internal combustion engines (on-site). These solutions in the
vast majority of cases do not allow to fully utilize the thermal energy co-generated, which amounts
to about 50% of the total energy in the bio-fuel.
In the future, as already happening in Germany, Sweden, Austria and Switzerland, biomethane will
be distributed as biofuel in the national pipe network and used in cogeneration to obtain 100% of its
energy content and / or as biofuel for vehicles. Biomethane, in fact, is one of the bio-fuels with less
impact on air quality (very low pollutant emissions), even when compared with other biofuels such
as bioethanol and biodiesel.
Hydrogen
The hydrogen sector has long been at the center of important initiatives , thanks to the
characteristics of high sustainability of this energy carrier . Already many promising utilizations for
this gas are reknown.
Hydromethan
The chemical procedures known as hydrogen fuel injection (HFI) are a series of processes that
include various technologies , such as the use of mixtures of molecular hydrogen / methane (
hydromethane ), or molecular hydrogen / octane to improve combustion in internal combustion

! 79!
engines , especially gasoline , through the use of hydrogen (added to the fuel or generated by the
engine through an alternator and a rectifier. Hydromethane is a gas mixture, which currently can be
composed of up to 30 % hydrogen and 70% methane, which has also been proposed as fuel in
internal combustion engines for various means of transport . This mixture has the advantage of a
more rapid ignition and a more complete combustion . It allows to reduce by 50% the emissions of
nitrogen oxide and CO.
In the early Seventies the Jet Propulsion Laboratory of NASA published a series of articles on the
benefits of the addition of hydrogen in the combustion of hydrocarbons in conventional internal
combustion engines . The NASA HFI system generates hydrogen during running and adds it to the
gasoline (composed mainly of but also benzene , cyclohexane, n-decane , toluene) creating a
mixture of fuels with a behavior comparable to a better octane . A better combustion is obtained,
which leads to increased power, lower fuel consumption and less pollution . It also increases the
durability of the engine as it reduces carbon deposits ( anthracenes and fullerenes ) in the cylinders
due to the incomplete combustion.
Biohydrogen
However , the production of hydrogen is currently linked to traditional combustion of fossil fuels;
in this case hydrogen can only be considered an energy carrier , and not a source .
Still, when its production takes place through renewable sources, hydrogen can actually be
considered an energy source.
AD can be used as a biological technology for hydrogen production. The anaerobic fermentation is
thus one of the most studied processes thanks to its high yield potential (Benemann , 1996) .
Biohydrogen production occurs in the acidogenic phase, during which the microorganisms
metabolise simple sugars to produce volatile fatty acids (acetic acid and butyric acid) and, in the
end, hydrogen. Stoichiometrically, each mole of glucose consumed is converted into 4 or 2 moles of
hydrogen, depending on the metabolic product is acetic acid or butyric acid (Levin et al., 2004) .
At the end of hydrogenic phase, the substrate has a high content of volatile fatty acids and therefore

! 80!
represents an ideal matrix to be used in a further, methanogenic fermentation. Hawkes et al. (2002),
talking of two-stage anaerobic digestion, originally thought for the production of methane only,
propose a modification to allocate the first reactor to the production of hydrogen and to use the
effluent of this phase in a second reactor in cascade to produce methane.
The concept has more recently been tested by some research groups with results of great interest.
Kraemer and Bagley (2005) tested the process in a two-stage lab scale reactor using an artificial
glucose-based substrate and obtaining a yield of 180 Nm3 and 320 Nm3 for ton of volatile solids
respectively., Liu et al. (2006) carried out a study with more interesting substrates (diluted urban
wastes). In this case average yields were of about 50 Nm3 ton-1VS of hydrogen and 500 Nm3 ton-1
VS of methane, with unitary gas production respectively of 0.07 Nm3h and 0.11 Nm3 h-1 per m3 of
reaction.
In order to compare the yield of the two stage process with that of the traditional fermentation, the
authors fed the same substrate to a single stage reactor operating in parallel to the double-stage. In
this case, the average production of methane was 0.09 Nm3 h-1 per m3of reaction.
It is truly remarkable to note that, under comparable conditions, the two-stage process has produced
over 25% more energy than the single-stage fermentation.
These results have raised interest in the testing of the two-stage fermentation also on pilot plants.
The AIST (The Japan Institute of Advanced Industrial Science and Technology) has completed in
2005 a plant capable of treating about 60 kg per day of organic residues in food mixed paper.
The average gas productions were 0.5-1 Nm3 d-1 of hydrogen and 5-10 Nm3 d-1 of natural gas
(AIST, 2005). Further analysis showed an increase of energy production by approximately 20%
compared to traditional methanogenic fermentation, in addition to a reduction in process time in the
order of 40%. In conclusion, on the basis of current knowledge documented by the international
scientific literature, it can be said that the two-stage anaerobic fermentation:
• is a reliable technique, although optimizable, for the production of hydrogen from renewable
sources;
! 81!
• is capable of producing significant quantities of bio-hydrogen from organic waste materials,
potentially harmful to the environment;
• is energetically more efficient than the traditional anaerobic fermentation and the amount of
energy generated can be further increased through the optimization of the process;
• promises to be the process of producing renewable hydrogen economically sustainable and
suitable for micro-territorial distribution.
Despite the vast amount of dedicated studies, little is known on how AD could actually work on a
real, full scale (not pilot) plant. Thanks to the cooperation with Cascina Castagna (S. Angelo
Lodigiano, LO) it was possible to analyze the functioning of the first european full-scale plant from
the very beginning of its activation. A lab-scale process was carried out in parallel to ensure an
optimal feeding rate and composition.
5.2 MATERIALS AND METHODS
5.2.1 Lab reactors
To optimize the process and ensure stability from a biological point of view, a lab scale simulation
was carried out. Two digesters (C and D) were fed with two different mixtures based on the
biomass’ availability in the full-scale plant.
Startup inoculum for semicontinuous tests was collected from a 10 l lab-scale reactor fed with
glucose and kept working at termophilic conditions (55°C) for five months in order to ensure a
stable hydrogen production.
Semicontinuous tests were carried out in pirex Wheaton batches with an operative volume of 250
ml (first stage) and 3 l flasks (second stage, single stage). Temperature was kept stable at 55°C with
a syliconic tube sleeve with circulating water connected to an eated bath. Reactors operatad on a
magnetic stirrer (stirring rate=60 rpm) with an hydraulic retention time of 3 days. Rice middlings
was diluted with swine manure.
The volumetric gas production was measured with a tilting system connected to a counter; 500 ml

! 82!
of gas caused one tilt, and the overall number of movements was reported on the counter.
Gas was collected from the reactors with a graduated syringe and analyzed with a micro gas-
cromatograph (µGC; Model 3000A-µGC, AGILENT-SRA Instruments).
Both feeding mixtures are based on swine and bovine sludge from Cascina Castagna, with the
addition of grain.
Mixture 1 provides an addition of corn silage, while mixture 2 of ryegrass silage.
Each of those mixtures has been used in two different conditions, based on different concentrations
of the biomasses.
In table 1 wet weight biomass’ amounts and digester conditions are shown.
Tab.5.1: C and D feeding chemical composition for both experimental phases (1 and 2).
10/04—04/06 08/06—10/07
Lab scale digestors
C1 D1 C2 D2
Swine sludge % (w/w) 45 48 46.8 44.3
Bovine sludge % (w/w) 45 48 46.8 44.3
Grain % (w/w) 1.85 1.85 3.8 2.8
Corn silage % (w/w) 8.0 2 - -
Ryegrass silage % (w/w) - - 2.6 8.6
HRT day 3 3 3 3
Organic load g VS L-1
d
-1
24.9 19.6 25.4 25.9
Organic concentration gVS L-1 74.9 59.8 76.1 77.8
Alkaline load g
CaCO3 L-1 d-1
2.51 2.67 2.61 2.48
Alkalinity g
CaCO3 L-1
7.55 8.03 7.82 7.43
VS/Alk g VS / gCaCO3
9.93 7.44 9.72 10.47

! 83!
All reactors were fed with a mixture of swine and bovine sludge, grain, corn silage (for first test) or
ryegrass (second test). Hydraulic retention time was three days for both trials. Reactor C sported a
higher organic load and concentration and volatile solids/alkalinity ratio in condition 1; its alkaline
load and alkalinity, instead, were inferior than reactor D in first test. In condition 2 these parameters
were inverted.
5.2.2 The plant
The plant consists of two separated reactors. Feeding mixture is conveyed in the first reactor where
a partial hydrolisis takes place. The biogas produced –rich in hydrogen- is collected and the output
used as feeding for a second reactor. Here the second stage of anaerobic digestion leads to the
producion of methane-rich biogas.
This plants allows a cogeneration efficiency up to 90%; 90% of biomass used for alimentation come
straight from Cascina Castagna farm.
Both biogases undergo a process of integrated upgrading to cleanse them from water, CO2, H2S and
other useless compounds. Upgraded biomethane is later used for national web injection (5 bar),
cogeneration and, with hydrogen addition, as a car fuel.
The fuel produced is used in a cogeneration station (see fig.), able to generate 250 kW of electric
and 300 kW of thermical energy (with smoke recovery), clean and eco-friendly. A prototype of a
second, smaller upgrading station is built in the plant to purify the produced gases and use them as
car fuels (bioH2, bioCH4, hydromethane). A small van operating in the farm is already
hydromethane-powered, but the same technology will apply, in the future, for agricultural vehicles.
The plant, operating since February 2013, underwent a process of startup (March-July). In this
period, samplings were carried out on a weekly base for the characterization of biomass, while gas
produced and digestates were sampled more often.
During April, May and June, 2013 the sperimental start-up phase of the biological process of
hydrogen production through dark fermentation was carried out in the full-scale plant in Cascina

! 84!
Castagna (LO).
The plant is composed as shown in the table 2. Pictures from the plant are shown in supporting
informations.
Tab.5.2: plant’s structure.
Function Volume
R1 First stage, acidogenic fermentation 150 m3
R2 Second stage, methanogenesis 1800 m3
From April to July 2013 the plant underwent a startup phase; during this phase feeding and working
conditions were monitored on a daily basis, as shown in table 3.
Tab. 5.3: feeding mixture’s composition and HRT for reactor 1.
10/04—04/06 08/06—10/07
Mixture 1 Mixture 2
Swine sludge % (w/w) 47.1 46.8
Bovine sludge % (w/w) 47.1 46.8
Grains % (w/w) 3.7 3.7
Corn silage % (w/w) 2.1 -
Ryegrass silage % (w/w) - 2.6
HRT (R1) days 2.83 2.71
HRT (R2) days 32 32
Organic load g VS L-1
d-1
26.5 31.91
Organic concentration gVS L-1 74.9 86.6
Alkaline load g CaCO3 L-1 d-1 2.79 2.79
Alkalinity g CaCO3 L-1 7.88 7.57
VS/Alk g VS / gCaCO3 9.51 11.44

! 85!
Feeding parameters show values similar to those of lab scale reactors (C1 and D2), yet adjusted
according to biomass’ availability on field in time.
Hydraulic retention times varied when compared to lab reactors, due to different reactors’ volumes.
In graphs N and N it is possible to see the exact timing feeding trend, both as wet weight and
organic matter.
Fig.5.1: composition of feeding mixture in time.
Fig.5.2: organic composition of feeding mixture in time.
0!
10!
20!
30!
40!
50!
60!
07Tmar! 27Tmar! 16Tapr! 06Tmag!26Tmag! 15Tgiu! 05Tlug! 25Tlug!
Mg$d51$
corn!silage! grains! corn!grains! ryegrass!silage! molasses!
0,0!1,0!2,0!3,0!4,0!5,0!6,0!
07Tmar!27Tmar!16Tapr!06Tmag!26Tmag!15Tgiu! 05Tlug! 25Tlug!
Mg$VS$d51$
$
corn!silage! grains! corn!grains! ryegrass!silage!molasses! swine!sewage! bovine!sewage!

! 86!
Grains were only used for the first period, being later substituted by corn grain. The organic load
from swine and bovime sludge was stable throughout the whole startup period.
5.2.3 Chemical analysis
Total Solids (TS ) and Volatile Solids (VS) content was evaluated according to standard procedure
(Sluiter et al., 2005). TKN (Total Kjeldhal Nitrogen) and N-NH4 content were measured (Bremner,
1996).
Volatile fatty acids (VFA) content and alkalinity were evaluated according to Lahav et al. (2002).
5.3 RESULTS
Biogas productions, VFA concentrations and alkalinity for lab scale reactors are shown in the
following graphs.
Mixture 1 shows an acceptable process stability only in digestor C.
Fig. 5.3: Hydrogen and methane content in biogas from mixture 1 (lab scale)
During phase 1, reactor C showed an higher H2 content and production rate (41% and 0.91 Ndm3
H2L-1d-1), with a methane production nearly null. On the other hand, reactor D not only resulted in
lower H2 productivity, with an average H2 concentration of 19.1% and rate of 0.36 Ndm3 H2L-1d-1,
but the biogas produced was 16.4%.
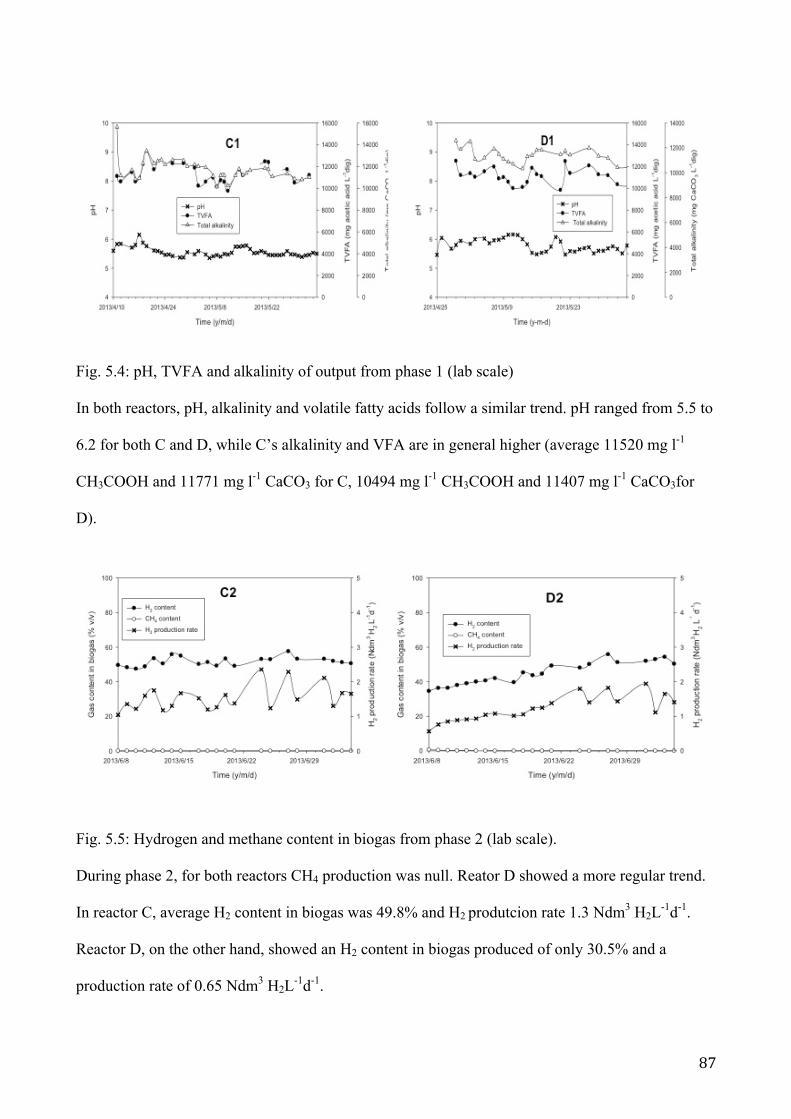
! 87!
Fig. 5.4: pH, TVFA and alkalinity of output from phase 1 (lab scale)
In both reactors, pH, alkalinity and volatile fatty acids follow a similar trend. pH ranged from 5.5 to
6.2 for both C and D, while C’s alkalinity and VFA are in general higher (average 11520 mg l-1
CH3COOH and 11771 mg l-1 CaCO3 for C, 10494 mg l-1 CH3COOH and 11407 mg l-1 CaCO3for
D).
Fig. 5.5: Hydrogen and methane content in biogas from phase 2 (lab scale).
During phase 2, for both reactors CH4 production was null. Reator D showed a more regular trend.
In reactor C, average H2 content in biogas was 49.8% and H2 produtcion rate 1.3 Ndm3 H2L-1d-1.
Reactor D, on the other hand, showed an H2 content in biogas produced of only 30.5% and a
production rate of 0.65 Ndm3 H2L-1d-1.

! 88!
Fig.5.6: pH, TVFA and alkalinity of output from phase 2 (lab scale)
Average pH was 5.44 for reaactor C and 5.64 for reactor D. VFA concentration in reactor C was
10758 mg l-1 CH3COOH and alkalinity 10781 mg l-1 CaCO3, slightly higher than values from D
(10506 mg l-1CH3COOH and 10773 mg l-1 CaCO3). Still, there is less difference between the two
reactors when compared to condition 1.
In parallel, feeding and biogas from full scale plant were anlyzed.
In figures 7 and 8 trend in biogas quality and H2/CH4 and CO2 concentrations in reactor R1 are
shown. Quantitative measurements were only available since June.
Fig 5.7: hourly total and specific biogas volumetric production.
As seen in picture above, biogas volumetric production both total and specific for different

! 89!
compounds (H2, CH4 and CO2) was measured on an hourly base through a blowing system. Daily,
this biogas was sampled through a syringe and measured with a MicroGC; percentages of different
gases are shown in figure N.
Fig. 5.8: percentages of H2, CH4 and CO2 in biogas from R1
It is possible to see that hydrogen and methane productions follow an inverse trend; between 9 and
11 of june an increase in methane volume is witnessed, paired with an equal hydrogen diminuition.
While the trend is not so clearly distributed when considering percentages, it is still evident how H2
and CH4 content follow a similar trend as volumes.

! 90!
Fig.5.9: percentages of H2, CH4 and CO2 in biogas from R2
R2 shows inverted trends for CH4 and CO2 percentages; CH4 never went under a value of 50%,
indicating overall good process conditions. H2production was nearly null.
H2S content is higher in R1 than in R2, as shown in figure 5.10; this may depend on a series of
problems in the reactor structure (leaks and blocked pumps).
Fig.5.10: H2S content in both reactors.
Chemical parameters in digestors were measured as shown in tab 5.4 (R1) and 5.5 (R2).

! 91!
Tab. 5.4: chemical characterization of output from reactor R1
Date pH VFA (mg/kg acetic acid)
Total alkalinity (mg/kg CaCO3)
VFA/alk R1
NH4+
(mg/L) TKN (g/kg) TS g/kg VS
g/kg dry
21-mar 6.83 6064.00 10206.00 0.59 2059 2.70 56.20 17-apr 5.38 6896 7915 0.87 57.87
22-apr 5.05 11575 12055 0.96 1718 2-may 5.4 9891 10217 0.97 37.51 794.30
14- may 5.57 10206 10467 0.98 28- may 4.62 11070 11683 0.95 1745 2.10 58.21 906.81
30- may 4.63 4166 4659 0.89 1528 2.48 35.40 829.79
4-jun 5.34 11825 12330 0.96 1804 2.80 49.25 842.21
7- jun 5 13445 13720 0.98 1805 2.78 85.70 876.39
11- jun 5.49 7237 7865 0.92 1398 2.63 41.53 838.24
13- jun 6.08 8786 9374 0.94 1452 2.65 41.95 837.65
19- jun 5.62 9301 10235 0.91 1461 2.62 36.85 742.46
25- jun 5.43 11761 11208 1.05 1543 0.28 42.73
27- jun 5.41 11291 10991 1.03 1660 0.31 66.43 2-jul 6.38 10109 9872 1.02 1697 0.29 67.47 4- jul 6.45 9533 9966 0.96 1729 0.30 18- jul 6.13 12624 11349 1.11 1875 76.14 85.48
Tab.5.5: chemical characterization of output from reactor R2.
Date pH VFA (mg/kg acetic acid)
Total alkalinity (mg/kg CaCO3)
VFA/alk R1
NH4+
(mg/L) TKN (g/kg) TS g/kg VS g/kg
dry
21-mar 7.99 709 10043 0.07 2295 3.10 39.10 17-apr 7.68 924 7473 0.12 37.12
22-apr 7.66 565 9402 0.06 1731 2-may 7.83 713 10179 0.07 32.86 760.25
14- may 7.59 1958 10524 0.19 28- may 7.39 2052 10731 0.19 2220 2.83 35.17 813.81
30- may 7.55 2621 9932 0.26 2138 2.93 31.83 762.30
4-jun 7.56 2186 10978 0.20 2047 2.98 31.17 769.63
7- jun 8.14 1045 11214 0.09 2195 2.43 29.70 757.30
11- jun 7.6 1786 8879 0.20 2004 2.83 32.48 821.66
13- jun 7.69 1893 9502 0.20 1960 2.88 33.82 782.32
19- jun 7.48 2156 9521 0.23 2133 2.74 30.88 803.67
25- jun 7.64 2835 10672 0.27 1994 0.31 33.36
27- jun 7.54 2731 11023 0.25 2043 0.31 37.31
2-jul 7.71 2224 10645 0.21 2114 0.28 37.74 18-jul 8.27 1074 11177 0.10 2450 34.68 75.35

! 92!
pH values range more widely in R1 (from 4.62 to 6.45); in R2 this variation is less evident (7.48 to
8.27). This is reflected in VFA content, reaching a maximum of 13445 mg kg-1acetic acid in R1
compared to R2 highest, 2731 mg kg-1 acetic acid. Alkalinity range is less dramatic (from 4659 mg
kg-1 CaCO3 to 13720 mg kg-1 CaCO3in R1, from 7473 mg kg-1CaCO3to 11214 mg kg-1CaCO3in
R2). For R1, NH4+ content goes from 1452 mg L-1 to 2059 mg/L and from 1731 mg L-1 to 2450 mg
L-1 for R2; TKN ranges from 0.28 g kg-1 to 2.78-3.10 g kg-1 for both reactors.
Output from R1 shows a higher content of total solids (35.4-85.7 g kg-1) compared to R2 (29.7-39.1
g kg-1).
pH, alkialinity and VFAs trends for both reactors are shown in figures 5.11 and 5.12.
Fig.5.11: VFAs, Alkalinity and pH trend in R1
VFA and alkalinity follow a similar trend, reaching a maximum of 14000 mg/l CH3COOH and
mg/l of CaCO3 on early June. Both find their lower point at the end of May (4000 mg/l CH3COOH
and mg/l of CaCO3 respectively). pH is instead less stable, ranging from 4.6 to 6.9. This irregular
trend reflects the difficulties met in plant’s administration.
4!
4,5!
5!
5,5!
6!
6,5!
7!
7,5!
8!
0!
2.000!
4.000!
6.000!
8.000!
10.000!
12.000!
14.000!
16.000!
7/3! 27/3! 16/4! 6/5! 26/5! 15/6! 5/7! 25/7!
pH$
mg$/kg$
VFA!(mg/l!acetic!acid)! Tot!Alkalinity!(mg/l!CaCO3)! pH!!

! 93!
fig.5.12: VFAs, alkalinity and pH in R2.
Trends are in general more regular in R2, following the overall more linear and already tested
process of AD for methane production only. VFA content is –as expected- lower than in R1, with a
peak of 2900 mg/l CH3COOH; alkalinity ranges from 7700 to 11800 mg/l CaCO3, still higher than
R1. This is consistent with general higher pH and VFA concentration in hydrogenic reactor.
In fig. 5.13 trends for VFA/alkalinity ratio is shown; R1 shows higher values due to general higher
VFA content. Values seem to follow an opposite trend for the two reactors.
Fig 5.13: VFA/alk ratio for reactors R1 and R2
6!
6,5!
7!
7,5!
8!
8,5!
9!
0!
2.000!
4.000!
6.000!
8.000!
10.000!
12.000!
7/3! 27/3! 16/4! 6/5! 26/5! 15/6! 5/7! 25/7!
pH$
mg$/kg$
VFA!(mg/l!acetic!acid)! Tot!Alkalinity!(mg/l!CaCO3)! pH!!
0!
0,2!
0,4!
0,6!
0,8!
1!
1,2!
7/3!
14/3!
21/3!
28/3!
4/4!
11/4!
18/4!
25/4!
2/5!
9/5!
16/5!
23/5!
30/5!
6/6!
13/6!
20/6!
27/6!
4/7!
11/7!
18/7!
25/7!
VFA/alk$
R1!R2!

! 94!
5.4 Conclusions
R1, a smaller reactor expressively meant to produce hydrogen and to provide feeding for R2, a
second, methane-generating reactor, proved tthat two-stage AD is a process feisable in full scale.
Hydrogen is produced and reaching concentrations over 30%, comparable to those found in lab
scale tests; R2 showed to have a behaviour consistent with that of standard, on-stage AD full plants,
thus not . Still, the full-scale posed a constant challenge. The project is expected to continue until
2015.
Where our current studies showed a chance on biohydrogen production, it was not possible to carry
out the experiment longer due to technical issues.
Twice R1 experienced flowing problems caused by punt and pipes otturation; this led to an excess
of pressure and in clefts in the reactor’s walls. Gas leaks and lost of airtightness spoiled the process’
dynamics: gas volume produced decreased (thus making it difficult for the blower pump to measure
it) and hydrogen percentage dropped in favour of CO2 and methane gas.
Much is still to be analyzed in order to understand wether a full-scale two-stage AD plant might
have a role in future green energy production landscape; technical and engineering problems are to
be analyzed, since they proved to be numerous and more frequently occurring than estimated.
Still, the evidence that lab-scale and full-scale processes proved a promising similarity, useful in
order to foretell chemical and biological behaviour in a real plant.

! 95!
5.5 Supporting information
Fig. 5.14: Upgrading station.
Fig. 5.15: Cogeneration plant.

! 96!
5.16: In situ-produced biogas fueled van.
5.6 References
Benemann J.R., 1996. Hydrogen biotechnology: Progress and prospects. Nature Biotechnology, 14,
1101-1103
CE, 1997. Libro bianco della Commissione Europea - Energia per il futuro: le fonti energetiche
rinnovabili.

! 97!
Hawkes F.R., Dinsdale R., Hawkes D.L., Hussy I. (2002). Sustainable fermentative hydrogen
production: challenges for process optimisation. International Journal of Hydrogen Energy, Vol. 27,
Issues 11-12, November-December 2002, pp. 1339-1347
Himmel E.M., Ding S., Johnson D.K. Adney W.S., Nimlos M.R., Brady J.W., Foust T.D., (2007).
Biomass recalcitrance: engineering plants and enzymes for biofuels production. Science Vol. 315,
pp.804-807.
IEA, 2005. Key World Energy Statistics. Ed. IEA (International Energy Agency), OECD Parigi
Kraemer J.T., Bagley D.M., 2005. Continuous Fermentative Hydrogen Production Using a Two-
Phase Reactor System with Recycle. Environmental Science & Technology, 39, 3819-3825
Liu D., Liu D., Zeng R.J., Angelidaki I., 2006. Hydrogen and methane production from household
solid waste in the two-stage fermentation process. Water Research, 40, 2230-2236
Sharpley A., Meisinger J.J., Breeuwsma A., Sims J.T., Daniel T.C., Schepers J.S. (1998). Impacts
of animal manure management on ground and surface water quality. JL Hatfield and BA Stewart
(ed) Animal waste utilization: Effective use of manure as a soil resource Ann Arbor Press, Chelsea,
MI, pp.173-242
UE, 2008. Communication from the Commission to the European Parliament, the Council, the
European Economic and Social Committee and the Committee of the Regions. 20 20 by 2020.
Europe’s climate change opportunity. COM(2008) 30 final, Brussels, 23 january 2008

! 98!
6. CONCLUSIONS
This work aimed at analyzing the process of anaerobic digestion for the production of hydrogen.
We started from a basic, laboratory scale and upgraded the project to reach, in the end, a full scale
plant.
A first step consisted in a fast in batch series of tests in order to evaluate if and how the chemical
composition ofthe various agricultural and waste biomasses used as alimentation was involved in
hydrogen production. Thanks to a successful statistical approach we were able to determine that H2
production is a process positively influenced by highly degradable compounds (sugars and starch)
while high levels of more recalcitrant molecules (e.g. lignine) inhibit fermentation.
The study proceeded then to more realistical representations. First, a semi-continuous test was
carried out on four vegetal biomasses mixed with pig sludge at different concentrations, followed
by a in batch single stage and second stage test for the same feeding mixtures. This test proved
again that not all biomasses are suitable for two-stage anaerobic digestion: olive pomace, for
example, produced no hydrogen. The two-stage process, at this step, showed better performances in
specific conditions of hydraulic retention time and concentration when compared to the single
stage.
A further step forward involved data coming from the previous test: the best performing
experimental point (biomass, HRT and concentration) was replicated in a completely in continuous
test. This better simulated the functioninf of a full scale plant: three reactors (a single stage one and
a two-stage system) were fed with a mixture of rice middlings and swine manure. Output from
single and second stage were later processed and used as fuel for microbial fuel cells (MFC). If the
mere fermentative process showed no significative difference between classical, single stage AD
and two-stage process, the creation of a third stage through MFCs showed promising perspectives
and an higher energy production from the overall two-stage process.
Lastly, data and findings from the first experiments were applied oto the first european full-scale

! 99!
plant. In spite of the many, different issues met during the start-up phase (especially technical and
mechanical problems), there is a clear evidence that also a full scale reactor, when correctly taken
care of and alimentated, allows to produce a biogas with an hydrogen content comparable to a lab
scale simulation. While there is still much work to be done on the subject, it is interesting to note
that an encouraging hydrogen production does not seem to affect the possibility to produce methane
in a second stage. This simple differentiation in fuels is itself a promising improvement of the
anaerobic digestion technology.
! !

! 100!
Acknowledgements
PhD school was an interesting, intense experience. It would not have been possible if not for the
cooperation of the many people I have been working with. I would like to thank the whole
RICICLA group for its support, both scientifical and personal.
Many thanks to Regione Lombardia, General Directorate of Agriculture, for its financial support to
project AGRIDEN, and to Azienda Agricola Castagna, for the chance to work on a full-scale plant.
! !

! 101!
!
!
!
!
!