optimalite - finity
TRANSCRIPT
1
OptimaLite General Insurance Insights
2017
2
Welcome to OptimaLite
Following on from the ten years of success of Pendulum, this key ‘state of the industry’ document has returned in 2017 as Optima.
Optima explores the recent performance of the general insurance industry in Australia, examines emerging trends and provides a three-year forecast of industry performance.
OptimaLite is an easy-to-read summary of the full report – designed for those who would like a concise overview of the report’s key findings.
Like to know more? If you would like to discuss any of the insights in OptimaLite, please don’t hesitate to contact Finity.
Finity Consulting Pty Ltd
Level 7, 68 Harrington Street
The Rocks NSW 2000 Australia
p. +61 2 8252 3300 | www.finity.com.au
3
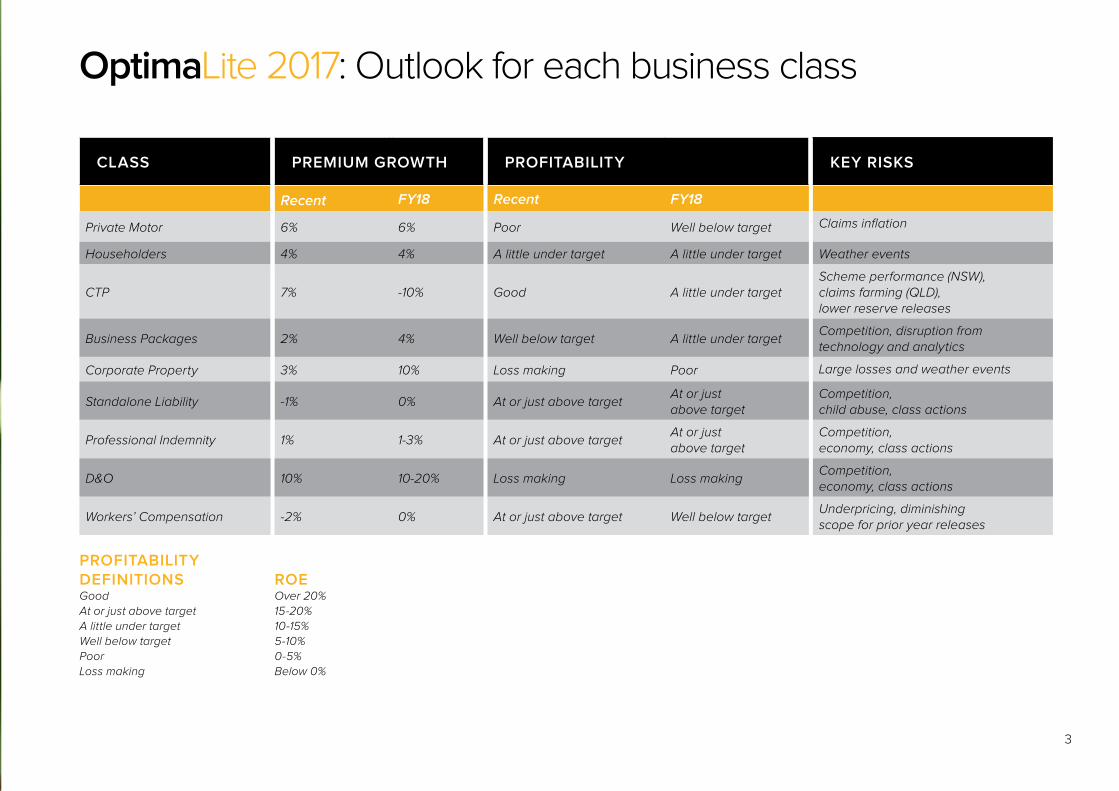
CLASS PREMIUM GROWTH PROFITABILITY KEY RISKS
Recent FY18 Recent FY18
Private Motor 6% 6% Poor Well below target Claims inflation
Householders 4% 4% A little under target A little under target Weather events
CTP 7% -10% Good A little under targetScheme performance (NSW), claims farming (QLD), lower reserve releases
Business Packages 2% 4% Well below target A little under targetCompetition, disruption from technology and analytics
Corporate Property 3% 10% Loss making Poor Large losses and weather events
Standalone Liability -1% 0% At or just above targetAt or just above target
Competition, child abuse, class actions
Professional Indemnity 1% 1-3% At or just above targetAt or just above target
Competition, economy, class actions
D&O 10% 10-20% Loss making Loss making Competition, economy, class actions
Workers’ Compensation -2% 0% At or just above target Well below targetUnderpricing, diminishing scope for prior year releases
PROFITABILITY DEFINITIONS ROEGood Over 20%
At or just above target 15-20%
A little under target 10-15%
Well below target 5-10%
Poor 0-5%
Loss making Below 0%
OptimaLite 2017: Outlook for each business class
OptimaLite 2017
Overall Industry Outlook On the face of it FY17 was a reasonably good year for the industry with an insurance margin
reported of 14% and an ROE at the same level. Looking deeper though, it was apparent that
reserve releases (from CTP in particular) were a major prop to profitability. These releases
added around five points to the reported margin. Adjusting for this, and other factors, the
underlying insurance margin was around 10%.
Headwinds working against the industry in FY17 were poor Motor profitability (with claims
inflation averaging 5% per annum over the last three years), a relatively high cost of cat events
(dominated by Cyclone Debbie) and a level of investment returns that hit an all-time low.
On the other hand, there were signs of a (much needed) hardening of rates in some commercial
lines (Commercial Property and D&O in particular), the soft reinsurance market continues and a
lower expense rate shaved two points off the combined ratio.
Looking forward to FY18, we see the potential for a modest expansion of underlying margins.
This will be driven by further rate hardening in commercial lines, an industry response that
improves profitability in Motor and some ongoing reductions in expense rates.
This will be further supported by the soft reinsurance market which, despite the strength of the
Atlantic hurricane season so far, looks set to continue, and more prior year reserve releases
from long tail classes – although not necessarily at the levels we have seen in the past few
years. The clear fly in the ointment though is CTP where we expect premium volumes and
underlying current year profitability to decrease significantly.
Putting it all together, but noting that weather-related claims costs are difficult to predict, we
estimate an underlying insurance margin of 10% to 11% for FY18, broadly unchanged from FY17.
Adding in some allowance for further prior year reserve releases, we forecast a reported
insurance margin in FY18 of 13% to 15%.
4
5
Premiums
Premium growth in FY17 for the industry as a whole was 4%. While not a particularly strong growth rate, this is nevertheless, a
rebound from the lows of 2% in the previous two years. While rates may not have gone backwards, this suggests they have not
exactly powered forwards either.
There are recent indications of rate increases being achieved in some segments of the market. While this is positive for industry
margins going forward, significant headwinds to premium growth remain – these are low economic growth, low economic inflation,
affordability issues, surplus market capacity and the relative lack of domestic growth opportunities.
Claims
Net of reinsurance, the industry’s reported net loss ratio in FY17 was 66%, three points lower than in FY16. This was despite much
higher weather-related losses in FY17, with Cyclone Debbie by far the most costly event ($1.5bn gross incurred).
Strong prior year reserve releases ($1bn from CTP alone) took five points off the loss ratio. While favourable yield curve movements
reduced the loss ratio by another two points.
At a class of business level, we observed no claims inflation in Householders in FY17 – the first time in five years this was the case.
On the other hand, claims inflation in FY17 for Motor was 6% and has averaged 5% over the last three years. The claims environment
in Liability and Financial Lines remains generally stable, with little evidence of superimposed inflation. However, there are pressure
points in some industries/occupations and class actions are a well-established feature of the environment.
Profitability
The industry remains profitable at an overall level but strong reserve releases have been a crucial support for the third year in a row.
Looking forward to FY18, parts of the Commercial Lines market are hardening, we expect Motor insurers to start addressing profitability
and we expect prior year reserve releases to continue to be a feature. As a result, we see reported insurance margins and ROEs to be
in the low to mid double digits in FY18.
Premiums
Private Motor has delivered good premium growth in the last two years, with the total GWP pool growing
at 6% p.a. over that period. This growth came primarily from rate increases – with an average FY17
premium growth of 5% for private comprehensively insured vehicles, and 4% for TPP policies. However,
these increases were largely absorbed by claims inflation, with little impact therefore on margins.
Future premium growth will likely be lower than that experienced in recent years. With growth in insured
risks still constrained, insurers will continue to rely on rate increases to achieve premium growth – and
this is becoming more difficult.
Claims
Average claims cost for FY17 increased by 5% – the second year in a row that the average claims size
has grown well in excess of inflation levels. Increases in both total losses and in the cost of repairs were
key drivers of the average claims cost growth. Frequency overall has been relatively stable.
Containing claims costs will continue to be a key challenge for insurers. Utilising data more effectively
to identify key claims hotspots, as well as identifying suspicious and fraudulent claims will be required
to contain growth in overall claims costs.
Profitability
After years of profitability there has been a sharp turn downwards in Private Motor. The APRA reported
loss ratio for FY17 blew out a further two points to 78% – up six points since FY14. With expense ratios
also creeping up year on year (up almost two points since FY14), FY17 saw an underwriting loss reported
in this class for the first time in many years. We estimate FY17 ROEs of around 5% only, a far cry from the
20%+ ROEs this class enjoyed a few years back.
With declining demand for Private Motor, and ongoing claims challenges on a number of fronts,
we expect some tough times ahead for this class of business. It will take some time for ROEs to
rebound to acceptable levels and we estimate an ROE in the range 5% to 10% for FY18.
OptimaLite
Future Outlook Private Motor
The pressure on Private Motor continued in FY17. The increasing cost of repairs, an unfavourable exchange rate, and weather events combined to negatively impact profit margins to such an extent that an underwriting loss was delivered for the first time in many years.
While insurers are acting to restore profitability with further rate increases, the outlook for Private Motor remains challenging.
Moving forward this class will continue to face margin squeeze, with premium growth (particularly volumes) constrained, and ongoing claims pressures that will take some time to address.
6
7
Premiums
For FY17 the total premium pool increased about 4% – a result of the 4% average premium rate increases
achieved, with the number of insureds remaining flat.
A low inflation rate combined with a low increase in wage inflation put pressure on exposure growth and
affordability respectively, in turn constraining growth of the overall premium pool.
With competitive pressures maintained (including an increasing – though slowing – growth in the market share
of challenger brands) and the ongoing shift in mix towards units rather than houses (with units having a much
lower propensity to insure contents) we believe that growth in the overall premium pool will remain restrained.
Claims
Claims inflation was a positive news story in FY17, with average claims cost growth for both Buildings and
Contents well below recent averages. Containing claims inflation in future years will be critical both for
maintaining profitability, and for limiting price increase (hence improving affordability for consumers).
Against this, increased weather perils will naturally lead to an increase in overall incurred costs, and there are
some warning signs in this area. For example, the Climate Council has flagged that winter weather conditions
have created ‘above-average’ potential for bushfires this year.
Profitability
According to APRA statistics, Householders insurers recorded a gross loss ratio of 60% and a net loss ratio
of 64% for FY17 (two points higher than FY16). With the underwriting expense ratio stable at 28%, the net
underwriting combined ratio was 92%, two points worse than FY16.
This equates to an ROE of ~13% which, while still profitable, is short of the 15% industry target.
With exposure growth constrained, insurers will need to rely on further rate increases to maintain premium growth
and to return the portfolio to above target return levels. As usual, weather costs are a big unknown and have the
potential to ‘make or break’ profitability in FY18.
OptimaLite
Future Outlook Householders
Though we expect it to remain profitable, the Householders class of business is facing downward pressure on both a growth and profitability front.
Muted premium pool growth along with heightened peril risks result in a slightly less positive outlook than in recent years.
With Private Motor facing headwinds into next year, it will be critical for personal lines insurers to maintain profitability in the Householders class to deliver overall outcomes.
Premiums
Premium growth of 7% in FY17 was due mainly to the privatisation of the SA scheme from 1 July 2016.
In other states, premiums were flat across the year or reduced through a combination of regulator and
competitive pressure.
The future premium pool will shrink by over 10% following changes to the NSW CTP scheme under the
MAIA. We are expecting that regulatory pressure will continue to subdue rate increases in Queensland.
Rates in SA will increase by CPI.
Claims
Claim frequency continues to be impacted by the activities of claim farmers. While in NSW this has
been partially reversed through new limits on plaintiff legal cost recovery for smaller claims and a police
crackdown on fraud, in Queensland we have seen a 10% increase in frequency in the last year.
The settlement environment for CTP claims remains benign with little recent evidence of superimposed
inflation in average claim sizes in any of the CTP schemes. We expect this to continue into next year.
Profitability
Profitability in FY17 was very good due to a reported net loss ratio of 51%. This was driven by significant
prior year reserve releases by insurers (worth 33% of FY17 net earned premium), and a further contribution
from rising discount rates (worth 8%).
Looking forward we expect underlying profitability to decrease significantly. In NSW, the MAIA includes
provisions to ensure that insurers payback ‘excess’ profits while in Queensland premium reductions have
occurred at the same time that frequency is increasing. This will be muted in FY18 to the extent that prior
year reserve releases occur.
OptimaLite
Future Outlook CTP
The industry premium pool is expected to shrink by over 10% with changes to NSW CTP scheme benefits under the Motor Accident Injury Act which covers accidents from 1 December 2017.
Underlying profitability is expected to be significantly lower in future due to excess profit provisions in the MAIA, as well as reductions in Queensland rates at the same time frequency is escalating.
8
9
Premiums
Premium rates started to increase in FY17, particularly in the intermediated segment. The soft market
environment appears to be turning, so we expect to see premium rates continue to increase, but only
by a small percentage each year.
Claims
A lot of cross-subsidies exist across different covers for this product – Fire is far less profitable than
Liability and other covers. We expect these cross subsidies will largely continue going forward.
We estimate the overall loss ratio, normalised for weather and natural perils claims cost and based on
current premium rates, is around 58%. With only small rate increases forecast, loss ratios are expected
to only improve modestly from this level going forward.
The overall claims environment has been benign for both Property and Liability for a number of years now.
This main concern relates to Liability, where frequency increases of 20% or more are coming through in
2015 and 2016 in a number of industries including General Construction, Road Transport, Accommodation,
Cafes and Restaurants.
Profitability
Inclusive of an allowance for the net cost of reinsurance and the terrorism levy, we estimate a current
COR of 103%. This compares to a target COR of 96% required to deliver a 15% ROE.
Hence, this class is currently profitable at industry level, but not meeting a 15% ROE target. We estimate a
10% rate increase is needed to meet target ROE.
Recent premium rate increases have been modest (at around 2% per annum) so a stronger hardening of
rates is needed if this class is to meet target profitability any time soon.
OptimaLite
Future OutlookBusiness Packages
We expect profitability to improve over coming years as insurers continue to push through rate increases, particularly in the intermediated segment.
The direct online distribution channel should continue to grow, although we believe this will be a gradual transition rather than a sudden shift. This is because the complexity of business insurance will mean that brokers will remain relevant for the non-micro SME businesses.
Increasingly granular and sophisticated pricing will benefit those insurers with greater analytics capabilities (which tend to be the larger players and those who can leverage Personal Lines capabilities).
Premiums
Premiums softened slightly in 2016. However, the market appears to have turned in 2017 – with both
Aon and Marsh reporting high hazard and loss affected accounts being particularly targeted.
Increasing rates mean insureds are more likely to consider changing insurer. Corporate Property insurers
will be seeking to maximize the retention of customers whilst at the same time capitalising on the harder
market. Hence strategies for managing the harder market are as important as the strategies for managing
through the soft part of the cycle.
Claims
We estimate the average loss ratio for Corporate Property over the last seven years to be 75%.
Adjusted for average weather and large claims costs and normalised to current premium levels we
estimate the loss ratio to be around 85%.
One of the challenges with this class is that so much of the claims cost relates to natural peril and
large claims, which impact a particular risk infrequently. The natural tendency is to focus on the visible
(attritional) claims, but these tell only a part of the story and can lead to poor rating decisions.
The allocation of reinsurance is also a continuing challenge for many corporate portfolios, with the
large aggregate exposures driving high levels of modelled catastrophe cost. The appropriateness
of these allocations should be challenged. A more robust allocation can emerge from having a good
understanding of how the models are dealing with high sum insured properties and with gaps in the
risk data.
Profitability
Consistent with our assessment last year, we assess the normalised COR to be around 115% at 2016 rate
levels, compared to a target of 95%. To the extent that rates have increased in 2017, the normalised COR
may currently be lower.
While there are signs of a hardening market, to bring the normalised COR down to target levels would
require premium rate increases approaching 20%.
OptimaLite
Future OutlookCorporate Property
Underlying profitability is expected to improve as the market hardens. However it is likely to remain below target profitability in the short to medium term.
While there are signs of a hardening market, we estimate to achieve target profitability would require premium rate increases approaching 20%.
10
11
Premiums
Premiums volume grew by 8% in the CY16, the first time in a number of years, growth was above wage
inflation. CY17, however, is shaping up to be fairly flat based on what we have seen of premiums written to
June 2017.
Average premium rates increased by only 2% in CY16, after a couple of years of softening. While there
was some hardening at the small to medium business level during the first half of CY17, this class remains
highly competitive.
We expect rate increases to be no more than low single digits in what remains of CY17 and through CY18.
Claims
The underlying loss ratio has averaged 61% since accident year (AY)11, around ten points higher than the
period AY06 to AY11. The main driver of the increase has been premium rate reductions as the claims
environment, overall, has remained generally benign.
However, the more recent periods have been impacted by the emergence of large class actions,
particularly in the utilities and manufacturing industries.
AY16 is the first year the overall downward trend in frequency has not continued. The change appears to
be driven mostly by construction industry claims, with work site injury claims likely to be a key driver.
Going forward, the outlook is for the generally benign claims environment to continue. If class actions
continue at the current rate, this will impact some segments of the portfolio.
Profitability
We estimate a COR of 92% (net loss ratio of 57% plus expense ratio of 35%), which translates to a 16%
Return on Equity. Based on this analysis, current premium rates remain adequate for Standalone Liability.
Profitability has historically been in excess of the 15% ROE target. While there has been a downward trend
in recent years, we expect this class to continue to achieve target returns in the next few years.
OptimaLite
Future Outlook Standalone Liability
Standalone Liability, one of the few classes currently achieving target profitability, is expected to remain profitable (and to meet target returns) –although at a lower than current level.
The recent soft market, along with the development of large class action claims, has started to impact profitability for recent claim years and are expected to continue to strain insurers’ results going forward.
While favourable reinsurance terms will continue to contribute to profitability, in the absence of good premium rate increases, the outlook for profitability for this class going forward will not be as good as we have seen in recent years.
Premiums
The market has hardened in the first six months of 2017 with premiums for the Financial Lines class as a whole
increasing by 10%.
D&O is by far the biggest mover, with rate increases in some cases doubling or tripling depending on the
characteristics of the risk. Management Liability has seen rate increases of 10% to 20% while Professional
Indemnity rates are fairly flat.
Claims
For all Financial Lines classes combined, insurers reported a gross loss ratio for FY17 of 80% and a net loss ratio of 65%. This is the highest gross loss ratio reported since the global financial crisis (GFC), and compares to the average of 73% since 2012.
The protection provided by reinsurance has to some extent insulated insurers from excessive losses and this has been a factor contributing to the prolonged soft insurance market in Financial Lines.
Underlying claims experience by product varies materially. While we assess the tort temperature to be ‘warm’, with no change since 2016, there are some pockets of claims activity to keep an eye on.
In Professional Indemnity, while claims experience has been fairly benign since the GFC, real estate and surveying are experiencing the highest loss ratios. In Management Liability, employers practice liability claims, in particular, have escalated.
In D&O, class actions are expected to continue to emerge at levels similar to recent years. There is the potential
for privacy, workplace exploitation and child sexual abuse class actions to arise in the future.
OptimaLite
Future OutlookFinancial Lines
Significant competition remains.
Professional Indemnity premium rates are holding firm. This product has achieved above target returns and the outlook is for this to continue.
There are some signs premium rates are starting to harden materially in D&O and Management Liability – although still not by enough for these products to meet target profitability. We estimate rate increases of 30% and 25% are needed for D&O and Management Liability respectively.
D&O insurers have experienced poor profitability for a number of years now. Given this experience, the need for premium rates to rise materially and the available capacity, some insurers may be assessing whether they can continue to provide coverage.
Profitability
We estimate Professional Indemnity is making returns in excess of target. D&O is loss making and Management Liability is making a small profit (but well below target).
We estimate a combined operating ratio (COR) of 92%, net of reinsurance, is required to make a 15% return of capital. Only Professional Indemnity is managing this with the net CORs of D&O and Management Liability both currently above 100%.
Management Liability rates need to increase by an additional 25% to meet target profitability.
In D&O, we estimate premiums still need to increase by another 30% assuming the currently favourable reinsurance terms continue. However, in a scenario where reinsurance terms adjust and are not as
favourable to insurers, we estimate rate increases of up to 55% are required. 12
13
Premiums Wages growth has been low (or negative) which is holding down premium volumes. Achieved premium
rates also continue to be lower than those recommended by the privately underwritten scheme
regulators, which is also restricting volumes and putting pressure on underlying profitability.
Claims In line with long term trends, reductions in claim frequency are expected. However, the bias toward
reductions coming from small claims means that claim size pressures will generally offset any frequency
based saving.
The tighter economic climate looks set to put pressure on return to work rates, adversely impacting claims
continuance and therefore increasing claims durations and costs. In this context it is hard to see continued
opportunities for prior year reserve releases moving forward.
Profitability The excellent outcome for the net operating ratio in FY17 was primarily due to higher discount rates and
reserve releases from prior years. Given the comments above on premiums and claims it seems more
likely than not that profitability will deteriorate in the year ahead.
OptimaLite
Future OutlookWorkers’
Compensation
Workers’ compensation had an excellent year in FY17 driven by a benign claims environment and significant reserve releases.
Looking forward low wages growth, competitive pressure on premium rates, and emerging claims cost pressures mean future profitability is not assured so careful portfolio management remains key.

14
Andy Cohen Principal
Ph + 61 2 8252 3346Email: [email protected]
David Wilheim Consultant
Ph + 61 2 8252 3317Email: [email protected]
Authors
ContributorsSusie Amos
Principal
Tim Andrews
Principal
Alice Huang
Senior Consultant
Andrew McInerney
Principal
Estelle Pearson
Principal
Lucy Vowels
Senior Consultant
15
Finity is Australia and New Zealand’s largest independent actuarial consulting firm. With
a reputation for innovative and practical advice, Finity has been working closely with the
general insurance and health insurance industries for over three decades.
Powered by smart, results-oriented people with an unrivalled depth of industry
experience, we can provide a unique perspective across a wide range of business
challenges.
With over 130 staff, Finity is the largest employer of actuaries in the Australian general
insurance industry. In FY17, we worked with over 200 different clients, spanning all
categories of insurers. We provide advice across a range of areas including:
• Appointed Actuary and reserving
• Pricing and portfolio management
• Data analytics
• Injury and disability schemes
• Insurer strategy and operations
• Health analytics
• Capital and risk management
• Government schemes
• Self-insurance
• Start-ups, new products
Market-leading technical analysis is a core part of everything we do. But that’s only
part of the picture; ultimately our reputation rests on our delivery of high quality
advice with a focus on practical, commercially-aware solutions that add value.
About Finity
2016 ANZIIF Professional Services Firm of the Year (NZ)2015 ANZIIF Professional Services Firm of the Year (AUS)
Six time winner ANZIIF Service Provider of the Year
ANZIIF Hall of Fame

16
Sydney
Level 7, 68 Harrington Street
The Rocks NSW 2000 Australia
p. +61 2 8252 3300
Melbourne
Level 3, 30 Collins Street
Melbourne VIC 3000 Australia
p. +61 3 8080 0900
Auckland
Level 5, 79 Queen Street
Auckland 1010 New Zealand
p. +64 9 306 7700
Adelaide
Level 30, Westpac House
91 King William Street
Adelaide SA 5000 Australia
p. +61 8 8233 5817