optimal sizing of activated sludge process with asm3 11 i 01/111401-3636...
TRANSCRIPT
International Journal of Civil & Environmental Engineering IJCEE-IJENS Vol: 11 No: 01 19
111401-3636 IJCEE-IJENS © February 2011 IJENS I J E N S
Optimal sizing of Activated Sludge Process
with ASM3
Walid El-Shorbagy1*,
Abdulhameed Arwani2, and Ronald L. Droste
3
1Civil and Environmental Engineering Dept., UAE University, AlAin, UAE (Corresponding Author)
2Parsons International Limited, PO Box 5498, Abu-Dhabi, UAE
3Civil Engineering Dept., Ottawa University, Canada
Abstract-- A mathematical framework is developed for use in
optimal sizing of a wastewater treatment system that includes primary clarification and an activated sludge process. The
International Water Association (IWA) model; ASM3, is used in
the developed framework, as it is among the most comprehensive
models that closely describe the biological reactions taking place
in the activated sludge process. A nonlinear optimization problem is formulated with the objective to produce optimal sizes
of different units with least cost while meeting the effluent
requirements. The optimization model is applied to an
illustrative activated sludge system treating domestic wastewater
of typical strengths. The effect of a number of parameters and conditions on the optimal solution and the associated state
variables is investigated. This includes the solids retention time,
temperature, influent conditions, effluent requirements, in
addition to a number of ASM3 parameters. The findings
indicate that the temperature significantly affects the optimal size of aeration tank. Increase in the soluble components
(biodegradable substrate and ammonia-ammonium nitrogen) of
the influent results in increased volume of the aeration tank, air
flow rate, and the total cost. The system is found to be most
sensitive to variability of influent characteristics and maximum growth rate of autotrophic biomass.
Index Term-- Activated Sludge; ASM3; mathematical
modeling; optimization; model sensitivity.
I. INTRODUCTION
The most widely used biological treatment process for
municipal and industrial wastewater is the activated sludge
(AS) process. Recent developments in process modeling have
resulted in the inauguration of advanced dynamic general-
purpose models. Among the most common and recent applied
AS models is the International Water Association (IWA)
model; ASM3.
The main objective of a treatment plant design, in general, is
to provide a cost effective treatment for a given wastewater.
Mathematical models are usually employed in a trial-and-error
fashion to achieve such an objective. Upon evaluating the
performance, the design is iteratively modified until it
becomes satisfactory. The composite nature of such problems
generally makes it difficult to test all design possibilities.
Moreover, the design process becomes more difficult when
considering the complex biokinetics of treatment operations
and the potential interaction between treatment processes that
may all lead in some cases to counterintuitive performance.
An alternative to this design paradigm is one in which the
design process, essentially a search through design
possibilities, is automated using optimization. In an
optimization-driven design context, the designer supplies
mathematical descriptions of design objectives and
constraints, e.g., minimize total cost while meeting effluent
targets and maintaining system-governing relations. An
optimization algorithm is then used to identify one or more
design alternatives that best meet these criteria. The optimum
design is the one that satisfies certain constraints and is the
best among several alternatives with respect to prescribed
criteria; among which the cost. This approach has the
advantage of being capable of considering design objectives,
constraints, and performance comprehensively and
simultaneously. In addition, it can be extended to provide
system-wide optimization wherein all of the plant’s processes
are optimized together. The most common design parameters
that the designer usually selects are the dimensions of the units
that make up the plant (biological reactors and settlers) and its
operational variables [1] such as hydraulic retention time
(HRT), sludge retention time (SRT), areas, volumes, and
sludge recycle flow from the settlers.
During the last decade, several studies have treated the
problem of wastewater systems optimization following
different approaches. Examples include studies from [1], [2],
[3], [4], [5], [6], and [7]. Reference [1] presented a
mathematical formulation based on ASM1 for the optimum
design of a new AS treatment plant. The minimum volumes of
the biological reactors and the minimum total cost (including
construction and operation costs) have been considered as
optimization criteria. Practical results are also included, as a
case study, using the design of the second stage of the
Galindo-Bilbao wastewater treatment plant.
This study applies recent developments in modeling and
understanding of AS process to develop a mathematical
framework that can optimally size its various units. The model
combines unit processes models and ASM3 for the biological
reactor within an overall optimization framework as an
analysis and design tool. An optimal solution for typical input
conditions and effluent requirements is obtained based on
prescribed constraints and assumptions. The study also
investigates the effect of varying a number of conditions on
the obtained optimal solution. This includes the effect of
International Journal of Civil & Environmental Engineering IJCEE-IJENS Vol: 11 No: 01 20
111401-3636 IJCEE-IJENS © February 2011 IJENS I J E N S
temperature, influent and effluent characteristics, in addition
to a number of ASM3 model parameters.
II. SYSTEM DESCRIPTION
AS Systems constitute two main units, one for biological
treatment and the other for physical treatment or
sedimentation, namely, aeration tank and secondary (final)
settling tank, respectively. In most AS treatment plants,
especially conventional and complete-mix plants, a primary
sedimentation unit is installed before the AS system [8]. The
presence of primary sedimentation unit is necessary for
removing inert organics that may adversely affect the
biological reactions coming after. The proposed optimal sizing
model considers the interaction among primary sedimentation,
biological treatment, and final sedimentation in terms of
process continuity and costs.
Optimizing the AS system separately or incorporating it in a
comprehensive treatment system that includes both liquid and
sludge treatment streams is a controversial research issue. This
study considers optimizing the AS system alone for two main
reasons. First, the system can be optimized alone then
incorporated into a comprehensive optimization model that
includes the sludge-processing streams. Second, it has been
proven that there is a negligible difference in t.
The system layout is shown in Fig. 1. All the streams are
numbered to facilitate the description of the model. Stream 1
represents the system influent while stream 4 is the effluent.
Streams 2 and 3 connect primary clarifier to the aeration tank
and aeration tank to secondary settler, respectively. Stream 5
is the underflow from the secondary settler which is divided
into stream 6 (recirculation of sludge from final settler to
aeration tank) and stream 7 which represents along with
stream 8 the wastage sludge streams that might be subjected to
further treatment or disposal according to the applied
legislations.
III. UNIT PROCESSES PERFORMANCE MODELS
Several models have been developed to describe the
performance of unit processes that make up the AS system.
The incorporation of a particular model into the overall system
model highly influences the system design and the insights
gained from the system analysis as well.
The mathematical formulations describing the system
components utilized in this study are presented below.
Primary Clarification
Modeling the performance of primary clarifiers involves
modeling the two main functions they fulfill, namely,
clarification and thickening. The overflow rate (q) and influent
suspended solids concentration (XSS1) (the subscript number
denotes the stream in Fig. 2) have been identified as two
important parameters that affect the performance of primary
clarifiers.
For the clarification function, several theoretical and empirical
models have been proposed over the last two decades.
Theoretical mathematical models, though helpful in
understanding the sedimentation process, are still far from
being reliable and effective design tools [9]. Empirical models
are more suitable for the design of primary clarifiers in the
absence of more valid theoretical models . The reference
suggests the following expression:
)]exp([111
2 cqX
ba
X
X
SSSS
SS
(1)
where a, b (mg/L), and c (d/m) are positive parameters. q is
the overflow rate (in m/d) and defined as:
pA
Qq 2
(2)
where Q2 is the primary effluent flow rate and Ap is the
primary clarifier surface area.
Thickening function of primary clarifiers is mainly modeled
using the deferential thickening technique, which is based on
the limiting flux theory [10]. This technique proposes that the
primary sludge concentration (XSS8) equals: n
pn
SSQ
A
n
nnkLgX
/1
8
/1
81
)]1([)/(
(3)
where k (m/d) and n are settling constants of primary sludge
and their ranges are (65 – 460 m/d) and (1 – 5), respectively
[11]. Ap and Q8 (underflow rate) are in m2 and m
3/d,
respectively.
In this study, no certain model is considered to predict the
removal of organic matter. Instead, the species distribution of
the suspended solids in the primary effluent is assumed to be
the same as in the primary influent. i.e. Xi2 = Xi1(XSS2/XSS1).
Using Equations 1 to 3 and the flow and mass balance
equations, primary clarifier can be designed. q is usually
chosen as the decision variable, i.e., its specification leads to
complete design of the primary clarifier.
Activated Sludge
Standard biokinetic models are widely accepted in practice for
the design of AS process [10]. However, such models
comprise too many approximations and their prediction of
systems behavior is poor. In contrast, advanced multi-
component models that encompass evolving understanding of
phenomena in biotreatment, like ASM models, are the most
application in the design and research of AS systems [12].
In this study, ASM3 model [13] has been chosen as the basis
for the design of AS process. ASM3 was developed to correct
for some defects noticed in ASM1 and to incorporate latest
advances in the modeling of AS systems. In ASM3, all the
conversion and the decay processes of the two groups of
organisms are clearly separated. The new addition in ASM3 is
the assumption that all substrate passes storage before being
metabolized in the heterotrophic microorganisms. Moreover,
the ammonification known with its difficult quantification,
was eliminated in ASM3 as it is fast and minimally affects
other processes.
In the literature ASM3 is rarely utilized in its full version and
a reduced version is usually adopted [14]. A reduced ASM3
based model is utilized here by considering two reduction

International Journal of Civil & Environmental Engineering IJCEE-IJENS Vol: 11 No: 01 21
111401-3636 IJCEE-IJENS © February 2011 IJENS I J E N S
assumptions that are common in literature and utilized by
several studies. Such assumptions are:
(1) A completely aerobic bioreactor is assumed where
oxygen is controlled all the time to be 2 mg/L.
Therefore, all anoxic reactions are neglected and the
oxygen dynamics are not taken into account [12], [15],
[16].
(2) Alkalinity dynamics are neglected. Hence, the state
variable describing the total alkalinity is excluded [3],
[17]. This assumption is logical since the effect of
alkalinity on other reactions is minor given the small
values of its stoichiometric coefficients in the original
model [13], [18].
More simplifying assumptions beside the aforementioned ones
are considered in other studies [12], [15].
The resulting reduced ASM3 model consists of 10
components and 7 biochemical processes compared to 13
components and 12 processes in the original model. Typical
values for the stoichiometric and composition parameters as
suggested by Reference [19] at 20oC were utilized to produce
the stoichiometric matrix of the reduced ASM3 (Table I). The
stoichiometric matrix was used to write the conversion rate of
each component as explained in Reference [19]. To design the
aeration tank, the stream constituents around the AS system
are calculated using steady state mass balances:
(dxi/dt)V = Q2. xi2 – [Q4. xi4 + Q7. xi7] + rxi V = 0 (4)
where xi is a vector of the state variables [SI, SS, SNH4, SNOX, XI,
XS, XH, XSTO, XA, XSS]. rxi is the component conversion rate of
xi, V is the aeration tank volume, and Q denotes the flow rate.
Solids Retention Time (SRT) is among the most important
design parameters in AS systems and defined as follows:
SRT = V. XH3/[Q7. XH7 + Q4. XH4] (5)
Other important design parameters include the Hydraulic
Residence Time (HRT) defined as V/Q2, the Recycle Ratio (r)
defined as Q6/Q2, and the Waste Ratio (w) defined as Q7/Q2.
The total oxygen requirement is the sum of the oxygen
required for the removal of organic matter (ROH) plus the
oxygen requirement associated with nitrification (ROA) and
defined as follows (Grady et al, 1999):
SRTb
YSRTbfSXSQRO
H
HHXISSSH
1
)1(1)( 3222
(6)
SRTb
YSRTbfSSSQRO
A
AAXINHNOXNHA
1
)1(57.4)( 3222 44
(7)
where fXI is the production of XI in endogenous respiration, YH
is the aerobic yield of heterotrophic biomass, and YA is the
yield of autotrophic biomass per NO3-N, and bH and bA are
identical to bH,O2 and bA,O2.
For diffused air systems, the air requirement can be calculated
from the following dimensional expression (Grady et al,
1999):
e
AH
n
ROROAFR
)(0.6
(8)
where AFR is the air flow rate in m3/min, (ROH + ROA) is the
total oxygen requirement in kg/h, and ne is the field oxygen
transfer efficiency expressed as the percent of the oxygen in
the air actually transferred to the liquid. The value of ne
depends on the nature of the diffuser and the depth at which
the air is released. It typically lies in the range of 6 to 15%
with 10% as an average value.
In AS systems, for economic reasons, the equipment used to
transfer oxygen also provides the turbulence necessary to
maintain solids in suspension. This results in constraints on
process design and operation. The upper and lower feasible
bioreactor volume (in m3) can be related to the AFR and to the
minimum air input rate (AIR) as follows [8]:
LU AIR
AFRV
AIR
AFR 10001000
(9)
where AIRL and AIRU values depend on the type of diffusers
used. Values of 20 and 90 m3/(min1000 m
3) are generally
applied, respectively.
For the types of oxygen trans fer systems typically used
nowadays, the maximum volumetric oxygen transfer rate that
can be achieved economically on a sustainable basis is around
0.10 kg O2/(m3.h). This imposes another constraint on V. The
lower limit based on oxygen transfer can be expressed as
follows [8]:
)]/( [ 10.0
)(3
2 hmOkg
ROROV AH
(10)
Secondary Sedimentation
Like the primary clarifier, the secondary sedimentation tank
performs two functions, clarification and thickening.
Clarification, in this study, is modeled according to [20] where
the effluent suspended solids concentration (XSS4) is given as
follows:
43.26)ln()ln(67.0
)ln(21.6)/(4
SRH
SVIMLSSLmgX SS
(11)
where MLSS is equal to XSS3 (g/L), SVI (Sludge Volume
Index) is in (mL/g), H is the side water depth in the settling
tank (m), and SR is the surface overflow rate (m/h) which is
equal to Q4/Af (Af is the surface area of final settler).
The thickening function is modeled according to the solids
flux theory as given by [11] and presented earlier (Eq. 3). The
settling constants appear in the equation represent thickening
properties of the wastage sludge. The ranges for n and k
considered earlier are applicable also for the final settler [11].
XSS5, Af and Q5 replace XSS8, Ap, and Q8, respectively. One can
choose the SRT, HRT, and r as decision variables to design the
AS system (aeration tank and secondary settler).
IV. OPTIMIZATION PROBLEM FORMULATION
An optimum sizing of the system units is obtained using the
processes models described above along with an optimization
technique. The objective function (total cost function) is
minimized subject to constraints given by design equations
International Journal of Civil & Environmental Engineering IJCEE-IJENS Vol: 11 No: 01 22
111401-3636 IJCEE-IJENS © February 2011 IJENS I J E N S
and variable constraints where the constraints defining a
feasible design space.
The set of constraints described earlier is used to provide a
steady-state solution for the AS system shown in Fig. 1. Any
equation-solving program can be used for this purpose. A
Microsoft Excel program was developed and utilized in
solving the system by selecting feasible values for q, SRT,
HRT, and r (decision variables). The obtained solution
represents a starting point for the optimization model that
proceeds in establishing a search direction and step size
toward new solution points of improved objective function
value.
Cost Functions (objective function)
The total cost of the wastewater treatment system is the sum
of the capital costs of all unit processes and the costs
associated with pumping flow between these units. The cost
functions compiled and developed by [10] were considered in
this study and presented in Table II.
The total annual cost in 2003 dollars is used to express the
total system cost. Since the capital cost is expressed as a lump
sum, a design life of 20 years and a discount rate of 7% are
assumed to amortize the capital costs. The Engineering News
Record construction cost index of 2003 is used to update the
capital costs and the costs for material and supply from the
base year they were developed (1971) into the year of study
(2003). Annual operation and maintenance costs are calculated
by multiplying the person-hour requirement by the hourly
wage rates. The cost for pumping is the product of the power
requirement and the unit power cost.
The objective function f(x) is the summation of capital,
operation, maintenance, material and supply and power costs
for all the units and processes in the system considered.
V. APPLICATION PROBLEM
The model described above is applied to the system shown in
Fig. 1. The influent wastewater characteristics are assumed as
medium strength wastewater as given by [21] and listed in
Table III.
Parameters appear in the model are either ASM3
stoichiometric and kinetic parameters or other parameters
associated with settling models or cost calculation equations.
Stoichiometric and kinetic parameters are assumed to have the
same typical values suggested in the original model as
explained in [19] (Table IV). A number of parameters varying
with the temperature are summarized in Table V. The values
shown in the table were deriven from models’ original studies
as explained before. The CRF is calculated assuming a design
life of 20 years and a 7% discount rate. All capital costs ate
multiplied by CRF to be annual costs. Since the cost functions
are developed in the year 1971, they are updated to the year of
the study. Using Engineering News Record construction cost
index, the cost of 1971 (BCI = 1581) is updated to the cost of
2003 (CI = 6581) as follows, cost on 2003 = cost on 1971 × CI
(BCI)1. OMW and EC are to be defined according to local
practices. In this study, they are assumed to be 8.3 and 0.05
dollars, respectively. PH and PE are used to calculate the
pumping power cost.
Effluent quality is of great importance in the design process.
Three main species are of interest in the effluent, organic
content, TSS, and ammonia/ammonium nitrogen. Effluent
characteristics are to be set according to local regulations. In
this study, they are chosen as usually recommended in
literature. According to [21] in a well-operating AS plant that
is treating domestic wastewater, the soluble carbonaceous
BOD5 in the effluent will usually vary from 2 to 10 mg/L.
Suspended organic material will range from 5 to 15 mg/L, and
non-biodegradable organics will range from 2 to 5 mg/L.
According to the same reference, the AS process can achieve
as low as 10 mg/L of TSS in the effluent. Regarding the
ammonia/ammonium nitrogen, the system is assumed to
achieve complete nitrification. Bounds on variables are very
important to derive the solution to a feasible region. Bounds
are set based on literature findings [21].
The abovementioned constraints are applied to the
optimization problem. Using the General Algebraic Modeling
System (GAMS) program, the optimization problem is solved.
The solution (presented in Fig. 2) is found to be robust to
different starting points, which indicates the possibility of
being a global optimum. The TSS and SS (indicating BOD)
are reduced from 230 and 162 in the influent to 10 and 0.568
in the effluent, respectively. The total annual cost associated
with the optimized sizes is about $598,138; this is 23.3% less
than the total cost associated with the initial solution
($780,258).
The primary clarifier overflow rate is found at its upper limit
indicating a less efficient clarification. This also indicates that
more saving can be attained by eliminating this unit (5.6%
saving is achieved by eliminating the primary clarifier).
However, such a finding does not mean a feasible option from
a practical engineering point of view.
Similarly, since the sludge pumping represents a major capital
cost, the optimal sizes are found associated with minimum
recycle ratio (r = 0.25) indicating that further saving can be
achieved by reducing r as well as HRT. This is obvious since
the obtained effluent quality in terms of SS and SNH4 are far
less than their lower applied limits (0.568 < 2.0 g/m3 for SS
and 0.778 < 1.0 g/m3 for SNH4). Thus an acceptable effluent
can be produced with less cost by reducing HRT and/or r.
According to [8], practically, selection of SRT for domestic
wastewaters is usually controlled by factors other than soluble
substrate removal. This is apparent in the solution where both
effluent soluble COD (SS) and effluent ammonium (SNH4) are
relaxed while the effluent suspended solids (XSS) is at its lower
limit 10 g/m3 and therefore limiting the optimal solution.
Values of the total effluent COD (soluble COD plus
particulate COD) and the total nitrogen (ammonium plus the
nitrate/nitrite) in the obtained solution are 45.2 g/m3
and 30.4
g/m3, respectively. Such values fall within acceptable practical
ranges even though they are not constrained in the original
formulation. This proves again the valid argument made
earlier stating that constraining the TSS is adequate and
should implicitly constrain the total COD. This is due to the
International Journal of Civil & Environmental Engineering IJCEE-IJENS Vol: 11 No: 01 23
111401-3636 IJCEE-IJENS © February 2011 IJENS I J E N S
fact that a major portion of total COD is in particulate form
that is constrained by the TSS. Similarly, the low levels of
total nitrogen are attributed to low level of ammonia in the
influent.
The major portion of the MLSS is heterotrophic biomass
(43.37%) while the inert particulate organics comprises 37%.
The rest is slowly biodegradable substrate (7.69%),
autotrophic biomass (2.54%), and organics stored by
heterotrophs (9.48%). This is compatible with the practical
expectation that the two main portions contributing to the
MLSS are inert organics and active biomass.
VI. EFFECT OF SOLIDS RETENTION TIME
As was mentioned earlier, SRT plays a major role in
determining the performance of AS system. Earlier studies
showed that SRT is usually controlled by flocculation
requirement of suspended solids for proper sedimentation in
the final clarifier and not the removal of soluble substrate.
Reference [8] has stated clearly that once the SRT was
sufficient for effective flocculation and treatment to occur,
further increases had only minor effects on the soluble
substrate removal. This indicates that increasing SRT above
the required value would not affect the effluent quality
significantly. This is investigated here by finding the optimal
solutions at different values of SRT (starting from 3.5 days;
the value considered in the base design).
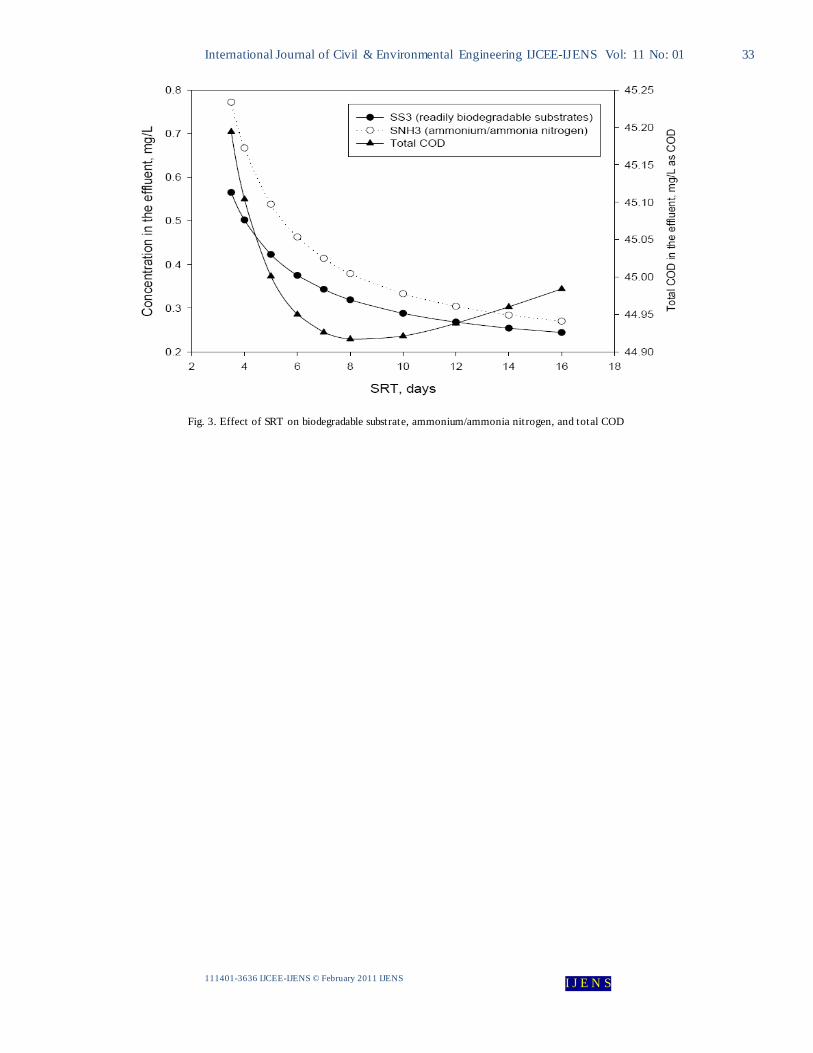
Fig. 3 shows the effect of SRT on the effluent biodegradable
substrate (SS3) and ammonium/ammonia nitrogen (SNH3). For
SRT larger than 8 days, the decrease in effluent soluble
substrate is very small. The same trend is noticed for the
ammonium/ammonia nitrogen. On the other hand, the total
COD in the effluent shows a completely different effect. The
COD decreased rapidly with increased SRT reaching a
minimum value at 8days then increased again. Although such
decrease and increase happened only within a range less than
0.5 mg/L, it is still worthwhile to be noticed. Mathematically,
this is attributed to the low drop in soluble COD after 8 days
while the production of biomass and inert particulates
contributing to the total COD continues to occur. The total
cost system increased with SRT at the same rate even after 8
days. Increase in the cost is mainly due to increase in the
aeration tank volume and oxygen requirement.
VII. EFFECT OF TEMPERATURE
Wastewater treatment systems can operate in a wide range of
ambient temperatures varying from less than 10oC to about
40oC. The temperature is known to significantly affect
different treatment processes with different levels and its
effect on biological treatment is obvious. In AS processes,
such effect is associated with biological growth of different
species of biomass to remove pollutants from the wastewater.
The temperature affects the biological reactions in two ways;
by influencing the rates of reactions and by affecting the rate
of diffusion of substrate to the cells. Quantifying the
temperature effect is usually considered by varying the kinetic
and stoichiometric parameters governing the biological rates.
For ASM Models, a number of kinetic parameters
significantly vary with temperature as shown in Table V at
four temperature values; 10oC, 20
oC, 30
oC, and 40
oC (values
at 10oC and 20
oC are given by [19] and estimated at other
temperatures from Arhenius Equation). Table VI lists typical
values of other kinetic parameters not affected by temperature
[19]. The model performance under different temperatures is
examined by finding the optimal solution for each set of
kinetic parameters at a certain temperature. The results are
summarized in Table VII.
Obviously the temperature change did not affect the optimal
design of the primary clarifier or the secondary clarifier.
Design of both unit operations remains unchanged for the
various temperatures examined. Moreover, the primary
clarifier overflow rate still at its practical upper bound which
indicates that this unit is not effectively participating in the
treatment process and economically a reduction in the total
cost can be achieved by considering a system without such a
unit.
Total system cost increased at low temperatures and at high
temperatures with minimum cost found when operating at
20oC. At low temperatures, the rate of reaction for all
processes is slow especially for the autotrophic biomass which
is known to have lower reaction rate than heterotrophic
biomass. Such low reaction rates of autotrophic biomass
affects the treatment process significantly. This type of
biomass is responsible for the removal of
ammonium/ammonia nitrogen (SNH4); that is at its effluent
requirement limit. This indicates that this component has
dictated the system to operate at higher sludge age and higher
HRT to allow some time for the autotrophic biomass to
remove SNH4. HRT is directly related to volume of aeration
tank, which in turn caused the system cost to increase. This
becomes clear if we compare the design at 10 and 40oC where
the design SRT is almost the same while the HRT at 10oC is
higher and effluent SNH4 is at its limit. Hence the volume of
aeration tank is higher and so is the cost. At low temperature,
the rate is low so the HRT increased to the time required. In
contrast, although HRT at high temperature is much less, the
high rate produced better effluent quality of SS and SNH4.
On the other hand, contrary to the expectation that
the rate of reaction increases dictate a shorter sludge age as the
temperature increases, the increase in reaction rates resulted in
very high concentration of XI and low concentrations of XH
and XA in the aeration tank. Due to the high rate of death at
high temperatures, most of the biomass was converted to XI.
This required higher SRT and HRT to maintain the level of
treatment required. This eventually increased the volume of
aeration tank and the AFR required. Both contributed to the
increase in cost.
Comparing the situation at low and high
temperatures, the particulate substrate apparently controls the
biological process and requires longer sludge age at high
temperatures. In contrast, at low temperatures soluble
substrate controls and this clearly appears if one compares the
soluble effluent characteristics at the both situations. At low
temperatures, soluble components are at their effluent limits

International Journal of Civil & Environmental Engineering IJCEE-IJENS Vol: 11 No: 01 24
111401-3636 IJCEE-IJENS © February 2011 IJENS I J E N S
while these components at high temperatures are at very low
levels.
In summary, temperature affects the AS process design
significantly. According to this study the best operating
temperatures are around 20oC. This is consistent with what is
reported in literature about optimum operating temperature for
the AS process [21]. However, the above discussion is based
on the assumption that the kinetic parameters follow in nature
the Arhenius equation considered in calculating such
parameters at different temperatures
VIII. EFFECT OF INFLUENT CHARACTERISTICS
In this section, the model performance is examined for various
scenarios of influent characteristics.
Influent flow rate
In the base solution the influent flow rate was 40,000 m3/d
(1500 m3/h), which is considered an average for a domestic
wastewater treatment plant. The performance was examined
for other flow rates keeping the concentrations of species the
same. Results are summarized in Table VIII. Clearly, a change
in the flow rate affects the system cost because the sizes of the
units are changed to accommodate the increased flows.
However, biological treatment remains unchanged since the
concentrations of influent organics were not changed. Such
performance is expected.
Strength of wastewater
This section explores the effect of influent strengths different
from the base medium-strength wastewater upon the optimal
cost and design. The influent characteristics were varied one at
a time to observe the effect of each condition on the system
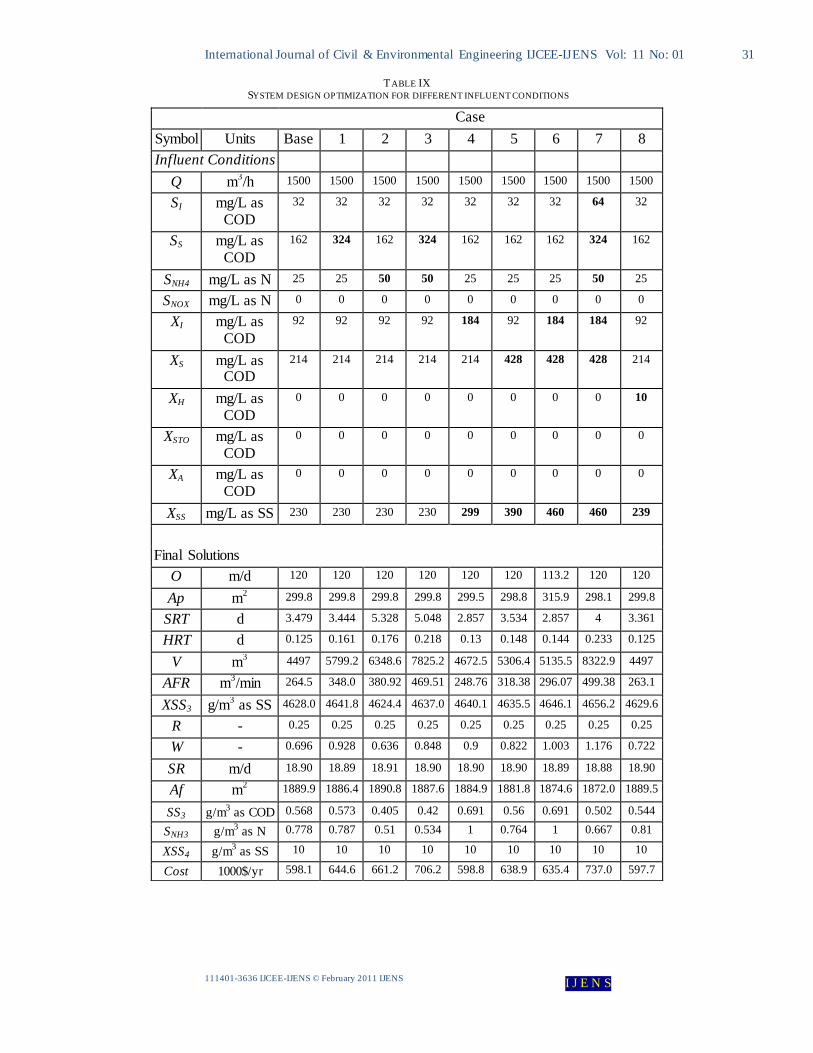
design Table IX reports the optimized solutions for various
influent conditions along with the influent conditions.
In case 1, only the readily biodegradable substrate
(SS) was changed to 324 mg/L as COD while other
characteristics were unchanged. This resulted in a more
expensive system (7.8% increase in cost) which is attributed
mainly to the increase in aeration tank volume and air flow
rate. The volume increase is due to the higher HRT required
for the metabolism of the increased mass of SS and to
eventually higher needed AFR. However it is noted that the
SRT is lower than the base design associated with higher
concentration of heterotrophic biomass maintained in the
aeration tank.
In case 2, only ammonium plus ammonia nitrogen
(SNH4) concentration was changed to 50 mg/L as N. Again
other characteristics were kept at the base design. This
resulted in significant increase in the optimized system cost
(10.6% increase). This is attributed again to the significant
increase in the aeration tank volume and the AFR. In contrast
to case 1, the AFR increase here is due to the increase in the
oxygen requirement of autotrophic biomass while in case 1 it
was due to the increase in the oxygen requirement of
heterotrophic biomass. In this case, the SRT suffers a
significant increase. This is due to the low concentration of XH
maintained in the aeration tank and the low wastage ratio.
However, better quality is noticed in the effluent.
In case 3, both soluble components in case 1 and 2
(SS and SNH4) were changed together to examine their
combined effect. The increase in optimal cost is found to be
major (18.1%) again due to the increase in V and AFR which
is now reach high value due to the increase in the oxygen
requirement for both heterotrophic and autotrophic biomass.
Further increases in HRT, SRT, and are noticed due to the
combined increase.
Comparing the above three cases indicates that SNH4 exerts
more influence on the system than SS. This is expected since
the reaction rate of autotrophic biomass is much lower than
that for heterotrophic biomass , i.e, the treatment of SNH4 is
more expensive than the treatment of SS.
In case 4, only the inert particulate organic matter
concentration (XI) was changed to 184 mg/L as COD. This
component does not undergo any treatment during the process
and some production of XI takes place through the aerobic
endogenous respiration processes of heterotrophic and
autotrophic organisms. So, the amount of XI increases during
the biological treatment and then settles in the final
sedimentation tank. The cost of the system after increasing XI
in the influent is not much different from the base model cost.
However, this increase has altered the effluent quality (SNH4 at
its effluent limit) explained as follows . An increase in XI in the
aeration tank caused a decrease in XH and XA to keep the
MLSS at its level and hence the volume of the tank stays at its
minimum since it affects the cost significantly. In addition,
extra wastage is required to remove the extra amount of XI.
These actions result in lowering the SRT significantly and
hence alter the effluent quality. Increasing the XI further in the
influent has shown an increase in the system cost due the
increased cost associated with waste sludge pumping. The
biological treatment remains unaltered. This trend remains
valid until the system starts to reach its capacity of removing
solids in the primary and secondary clarifiers. Before reaching
the clarifier limit, the extra amount of XI added is wasted with
the wastage sludge out the system.
The situation is completely different in case 5 when
the slowly biodegradable substrate (XS) is increased to 428
mg/L as COD. XS is consumed in the hydrolysis process to
produce SS and a small amount of SNH4. XS does not participate
in other reactions. Thus the influence of increasing XS is very
similar to the influence of increasing SS (case 1) as e
evidenced by examining the system design produced for the
two situations. The only difference comes from the small
amount of SNH4 produced during the hydrolysis. This small
amount has required a small increase in the SRT and the HRT.
However, some amount of XS has been removed in the
primary clarifier and hence not converted to SS or SNH4.
Therefore, the total amount of SS and XS is less than the total in
case 1 and this explains the reduction in AFR required in this
case.
In case 6, combining cases 4 and 5 is explored. The result is a
combination of the results for the two cases. The most notable
point here is the contribution of the primary clarifier. The
huge increase in influent total suspended solids due to the
increase in XI and XS forced the system to rely on the primary

International Journal of Civil & Environmental Engineering IJCEE-IJENS Vol: 11 No: 01 25
111401-3636 IJCEE-IJENS © February 2011 IJENS I J E N S
clarifier to achieve the required treatment. The overflow rate
of primary clarifier is no longer at its upper practical limit in
this case indicating the actual and effective need of this unit.
In order to show the economic importance of primary
clarifiers in situations like case 6, the same influent
characteristics have been considered in a system without a
primary clarifier. There is more load on the secondary clarifier
and more total system cost (0.63% increase in cost). In other
situations, the treatment plant might fail to operate without a
primary clarifier.
Case 7 combines all the aforementioned cases representing a
high-strength wastewater instead of the medium-strength
wastewater considered in the base design. As expected, the
solved system involves an increase in V, AFR, SRT, HRT,
and total system cost. However, it is noticed that the design of
primary clarifier and secondary clarifier have been unaffected
by this change in the strength of influent wastewater
indicating that the biological treatment alone was able to
absorb the increase more economically than the two
sedimentation processes.
The last case shown in Table IX (case 8) examines the
presence of heterotrophic biomass in influent. Results are
design a very close to the base scenario. The presence of
biomass in the influent helps the system achieve better quality
of SS at lower SRT which at the same time altered the effluent
of SNH4 at an acceptable limit. The lower SRT has lowered the
AFR which in turns cause a decrease in the total system cost.
Otherwise the system design is similar to the base system
designThe presence of autotrophic biomass in the influent was
not tested because it is unlikely to happen.
Effect of Effluent Limits
The effluent requirements applied on the base design are
derived from the practical limits recommended in the
literature. Tightening the limits will govern the system
capacity. The system reaches its full capacity when the
effluent suspended solids are set to 6 mg/L. Slightly lower
than this limit, the primary clarifier reaches its full capacity, so
does the secondary clarifier and the biological treatment
system. This indicates that for the conditions applied on the
base design, the system cannot achieve lower concentration
than this in the effluent.
IX. SENSITIVITY TO MODEL PARAMETERS
Uncertainty exists in the kinetic parameters due to their
random nature and their temperature-dependence. In this
section, the sensitivity of model results to kinetic parameters
variations at low and high temperatures is explored. At low
and high temperatures; 20oC and 40
oC respectively, the kinetic
parameters were assigned values suggested by [19] and shown
in Table X. For every parameter, three runs were conducted at
each temperature, one at the suggested parameter value,
another at 50% of this suggested value, and the third at 150%
of it. At each run, other parameters were kept at their original
values Table X shows the percentage change in objective
function (total cost) due to 50% change in parameter value (a
minus sign indicates a reduction in cost).
The table indicates that variability of kinetic parameters has
different effects on the optimum solution. A general or
specific trend for most effects cannot be drawn from the table.
Moreover, all the changes are negligible except those imposed
by the variability of bH, A, and KA. The most apparent change
is due to a reduction in A assumed value by 50% at 20oC. The
assumed value at this temperature is 1.0, which means if A
becomes 0.5 for one reason or another then a system with
11.3% higher cost is required to achieve the same treatment
requirements. Such indicates that the system is very sensitive
to this parameter and poor estimation of it would lead to
system malfunctioning.
The sensitivity of model to A is explained here. The
developed model has been assumed to perform complete
nitrification which requires the concentration of
ammonium/ammonia nitrogen in the effluent to be less than or
equal to one. It is well known that the growth rate of
autotrophic biomass is naturally very slow. Any alteration in
this growth rate (variability of A) would significantly affect
the nitrification process which is limiting the solution most of
the time. In the shown case, the decrease in the growth rate
required the system to increase the SRT to allow more time
for nitrification. Hence the system cost increased significantly.
X. CONCLUSIONS
Significant cost savings can be achieved by utilizing the
concept of optimization in the design of wastewater treatment
facilities. This work presented the formulation and use of an
optimal sizing model for the widely used AS process
considering the ASM3 model to simulate the kinetic relations
of relevant biochemical processes. The developed model was
extended to examine the influence of various parameters and
inputs upon the system performance and relevant results.
SRT increase was found to produce a slight drop in effluent
biodegradable substrate (SS3) and ammonium/ammonia
nitrogen (SNH3) while a minimum COD is achieved at 8 days
after which COD increases. Temperature was found to have
no effect on the optimal size of primary or secondary clarifiers
but it does significantly affect the aeration tank performance.
The system minimum cost was obtained at 20oC associated
with minimum aeration volume, HRT, and SRT. The study
portrayed the importance of considering kinetic parameters
precisely in the design of AS process due to their major effect
on the optimal system size.
Increased flow rates result in increased cost because of
increased sizes but the biological performance stays
unchanged. Various influent conditions result in different
responses of the optimized system depending on the influent
characteristics. Soluble pollutants exert different influence
than particulate ones reflecting the important need of careful
characterization of the influent wastewater. Uncertainties and
shock changes in such characteristics should be taken into
consideration when a reliable and robust design is sought.
Increase in the soluble components (SS and SNH4) of the
influent results in increased volume of the aeration tank, air
flow rate, and the total cost with more pronounced effect
found from the increased SNH4.

International Journal of Civil & Environmental Engineering IJCEE-IJENS Vol: 11 No: 01 26
111401-3636 IJCEE-IJENS © February 2011 IJENS I J E N S
Increase in the inert particulate organic matter concentration
(XI) in the influent results in slight increase in the total cost as
well as slight increase in the soluble organics and nitrogenous
content in the effluent.
The system is most sensitive to variability of influent
characteristics and maximum growth rate of autotrophic
biomass (A). Variability of these parameters should be
considered in the design of AS plants. Ignoring their
variability would involve major risks and possibility of failure.
XI. REFERENCES [1] A. Rivas, E. Ayesa, A. Galarza, and A. Salterain, “Application of
Mathematical Tools to Improve the Design and Operation of Activated Sludge Plants. Case Study: The New WWTP of Galindo-Bilbao Part I: Optimum Design”, Water Sci. Technol., 43, 7, pp. 157-165, 2001.
[2] E. Ayesa, B. Goya, A. Larrea, L. Larrea, and A. Rivas, “Selection of
Operational Strategies in Activated Sludge Processes Based on Optimization Algorithms”, Water Sci. Technol., 37, 12, pp.327-334, 1998.
[3] B. Chachuat, N. Roche, and M.A. Latifi, “Dynamic Optimization of Small Size Wastewater Treatment Plants Including Nitrification and Denitrification Processes” Computers and Chemical Engineering , 25, pp. 585-593, 1991.
[4] S.E Scuras, A. Jobbagy, and C.P. Leslie Grady, “Optimization of Activated Sludge Reactor Configuration: Kinetic Considerations” Water Res., 35, 18, pp. 4277-4284, 2001.
[5] T.A. Doby, D.H. Loughlin, J.J. Ducoste, and F.L. de Los Reyes III,
“Optimization of Activated Sludge Designs Using Genetic Algorithms”, Water Sci. Technol, 45, 6, pp. 187–198, 2002.
[6] Walid El Shorbagy, Nawras Nabil, and Ronald L. Droste.
(2011). “Optimization of A2O BNR Processes Using ASM and EAWAG
Models: Model Formulation”. Water Quality Research Journal of Canada, in press.
[7] Walid El Shorbagy, Nawras Nabil, and Ronald L. Droste.
(2010). “Optimization of A2O BNR Processes Using ASM and EAWAG
Models: Model Performance”. Elsevier Journal of Water Research, in Review.
[8] C.P. L Grady, G. Daigger, and H. Lim, “ Biological Wastewater
Treatment, 2nd ed.” Marcel Dekker Inc., New York, 1999.
[9] D. G. Christoulas, P.H. Yannakopoulos, and A.D. Andreadakis, “An Empirical Model for Primary Sedimentation of Sewage”, Environment International, 24, 8, pp. 925-934, 1998.
[10] C. Tang, E. D. Brill Jr., and J. Pfeffer, “Mathematical Models and Optimization Techniques for Use in Analysis and Design of Wastewater Treatment Systems”, Research Report No. 194, Water Resources Center, University of Illinois, 1984.
[11] S. Cho, H. Chang, and C. Prost, “Steady State Analysis of the Coupling Aerator and Secondary Settling Tank in Activated Sludge Process”, Water Res., 30, 11, pp. 2601-2608, 1996.
[12] H. Shahriar, C. Eskicioglu and R.L. Droste, “Simulating Activated
Sludge System by Simple-to-Advanced Models,” Journal of Environmental Engineering, ASCE, 132, 1, pp. 42-50, 2006.
[13] W. Gujer, M. Henze, T . Mino, and M. van Loosdrecht (1999),
“Activated Sludge Model No. 3”, Water Sci. Technol, 39, 1, pp. 183-193.
[14] T.T Lee, F.Y. Wang, and R.B. Newell, “Robust Model-Order Reduction of Complex Biological Processes”, Journal of Process Control, 12, 7,
pp. 807-821, 2002. [15] G. Koch, M. Kühni, and H. Siegrist, “Calibration and Validation of an
ASM3-Based Steady-State Model for Activated Sludge Systems-Part I: Prediction of Nitrogen Removal and Sludge Production” Water Res., 35,
9, pp. 2235-2245, 2001. [16] M.A. Steffens, P. A. Lant, and R. B. Newell, “A systematic approach for
reducing complex biological wastewater treatment models” Water Res., 31, 3, pp. 590-606, 1977.
[17] U. Jeppsson, “Modeling Aspects of Wastewater Treatment Processes”, PhD Thesis, Lund Institute of Technology, Lund, Sweden, 1996.
[18] M. Henze, C. P. Leslie Grady Jr., W. Gujer, G. Marais, and T . Matsuo,
“A General Model for Single-Sludge Wastewater Treatment Systems”, Water Res., 21, 5, pp. 505-515, 1987.
[19] M. Henze, W. Gujer, T . Mino, and M. van Loosdrecht, “ Activated Sludge Models ASM1, ASM2, ASM2d, and ASM3”. (IWA Scientific and
Technical Report No. 3.) London: IWA, 2000. [20] N. Voutchkov, “Relationship for Clarification Efficiency of Circular
Secondary Clarifiers”, Wat. Sci. Tech., 26, 9, pp. 2539-2542, 1992. [21] Metcalf and Eddy, “Wastewater Engineering: Treatment, Disposal, and
Reuse, 3rd
ed.,” G. Tchobanoglous and F. L. Burton, eds., Tata McGraw-Hill, New Delhi, India, 1991.
[22] D. Tyteca, D., Mathematical Models for Cost-Effective Biological Wastewater Treatment, in Mathematical Models in Biological
Wastewater Treatment, S.E. Jorgensen and M.J. Gromiec, eds., Elsevier Science Publishers, Amsterdam, 1985.
[23] C. Tang, E. D. Brill Jr., and J. Pfeffer, Mathematical Models and
Optimization Techniques for Use in Analysis and Design of Wastewater Treatment Systems, Research Report No. 194, Water Resources Center, University of Illinois, 1984.

International Journal of Civil & Environmental Engineering IJCEE-IJENS Vol: 11 No: 01 27
111401-3636 IJCEE-IJENS © February 2011 IJENS I J E N S
T ABLE I STOICHIOMETRIC MATRIX OF THE REDUCED ASM3 BASED MODEL
Component I 1 2 3 4 5 6 7 8 9 10
j Process SI SS SNH4 SNOX XI XS XH XSTO XA XSS
Expressed as COD COD N N COD COD COD COD COD SS Process rate equation j,
all j 0.
1 Hydrolysis 0 1 0.01 -1 -0.75 HHSX
HSH X
XXK
XXk ..
2 Aerobic storage of
SS -1 0.03 0.85 0.51 H
SS
SSTO X
SK
Sk ..
3 Aerobic growth of
XH -0.07 1 -1.60 -0.06
HHSTOSTO
HSTO
NHNH
NHH
XXXK
XX
SK
S
..
.
44
4
4 Aerobic endog.
Respiration of XH 0.066 0.2 -1 -0.75 HOH Xb .
2,
5 Aerobic respiration
of XSTO -1 -0.60 STOOSTO Xb .
2,
6 Aerobic growth of
XA, nitrific. -4.24 4.17 1 0.90 A
NHNHA
NH
A XSK
S..
44
4
,
7 Aerobic endog.
Respiration of XA 0.066 0.2 -1 -0.75 AOA Xb .
2,
SI : soluble inert organics, SS: readily biodegradable substrates, SNH4: ammonium, SNOX: nitrite plus nitrate, XI: inert particulate
organics, XS: slowly biodegradable substrates, XH: heterotrophic biomass, XA: autotrophic (nitrifying) biomass, XSTO: organics
stored by heterotrophs, XSS: total suspended solids, kH: hydrolysis rate constant, KX: hydrolysis saturation constant, kSTO:
storage rate constant, KS: saturation constant for substrate SS, H: heterotrophic max. growth rate of XH, KNH4: saturation
constant for ammonium, KSTO: saturation constant for XSTO, bH,O2: aerobic endogenous respiration rate of XH, bSTO,O2: aerobic
respiration rate for XSTO, A: autotrophic max. growth rate of XA, KA,NH4: ammonium substrate saturation for XA, bA,O2: aerobic
endogenous respiration rate of XA. T ABLE II
SUMMARY OF COST FUNCTIONS UTILIZED IN THE STUDY
Process Unit Capital
(1971$)
Operation
(personhours/yr)
Maintenance
(personours/yr)
Material and Supply
(1971$/yr)
Power
(k Wh/yr)
Primary
Clarifier [22]
77.824A 6.01.17 A 6.023.9 A 76.62.8 A
Primary Sludge
Pumping [22] 53.9870Q
41.257Q 43.112Q
64.214Q pQH /85.23
Aeration Tank
[23] 71.461V
Diffused
Aeration [23]
66.8533 aQ 48.187 aQ 55.4.74 aQ
Secondary
Clarifier [22]
77.824A 6.01.17 A 6.023.9 A 76.62.8 A
Return &
Waste Sludge
Pumping
[22]
53.9870Q 41.257Q
43.112Q 64.214Q pQH /85.23
A is the surface area in m2, Q is the flow in m
3/hr, V is the volume in m
3, Qa is the air flow rate in m
3/min, H is the pumping
head in meters, and p is the pumping efficiency.
International Journal of Civil & Environmental Engineering IJCEE-IJENS Vol: 11 No: 01 28
111401-3636 IJCEE-IJENS © February 2011 IJENS I J E N S
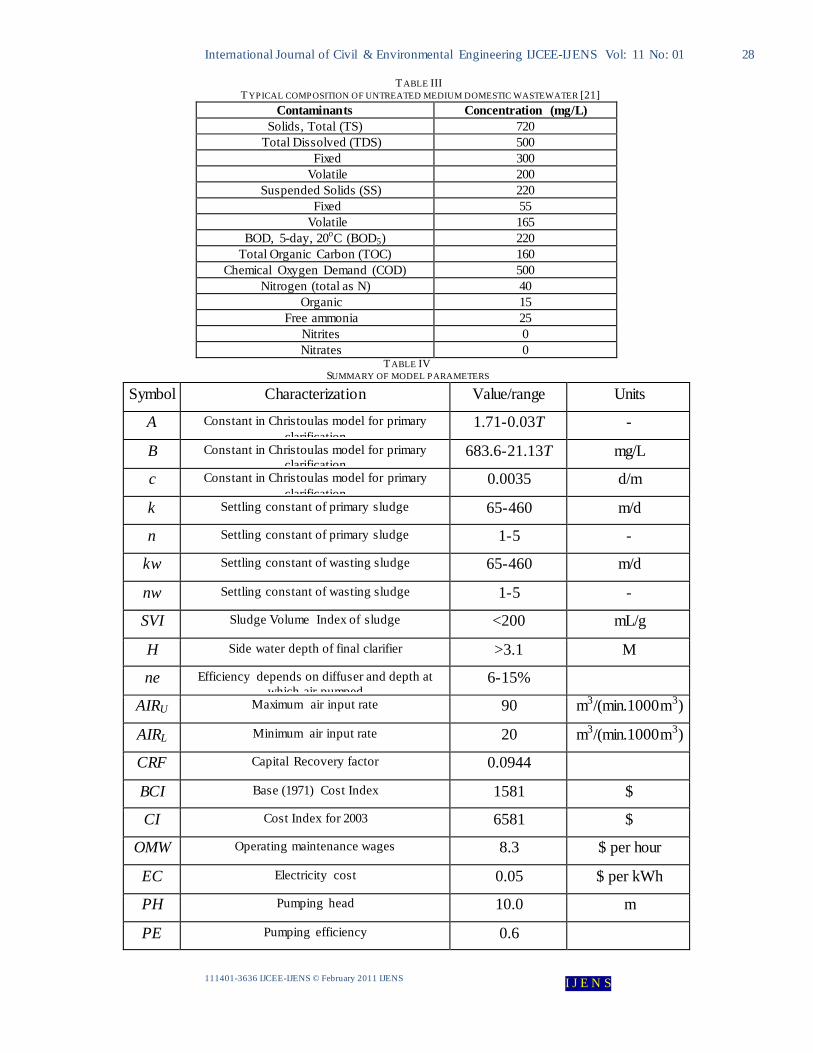
T ABLE III T YPICAL COMPOSITION OF UNTREATED MEDIUM DOMESTIC WASTEWATER [21]
Contaminants Concentration (mg/L)
Solids, Total (TS) 720
Total Dissolved (TDS) 500
Fixed 300
Volatile 200
Suspended Solids (SS) 220
Fixed 55
Volatile 165
BOD, 5-day, 20oC (BOD5) 220
Total Organic Carbon (TOC) 160
Chemical Oxygen Demand (COD) 500
Nitrogen (total as N) 40
Organic 15
Free ammonia 25
Nitrites 0
Nitrates 0 T ABLE IV
SUMMARY OF MODEL PARAMETERS
Symbol Characterization Value/range Units
A Constant in Christoulas model for primary
clarification 1.71-0.03T -
B Constant in Christoulas model for primary
clarification 683.6-21.13T mg/L
c Constant in Christoulas model for primary
clarification 0.0035 d/m
k Settling constant of primary sludge 65-460 m/d
n Settling constant of primary sludge 1-5 -
kw Settling constant of wasting sludge 65-460 m/d
nw Settling constant of wasting sludge 1-5 -
SVI Sludge Volume Index of sludge <200 mL/g
H Side water depth of final clarifier >3.1 M
ne Efficiency depends on diffuser and depth at
which air pumped 6-15%
AIRU Maximum air input rate 90 m3/(min.1000m3)
AIRL Minimum air input rate 20 m3/(min.1000m3)
CRF Capital Recovery factor 0.0944
BCI Base (1971) Cost Index 1581 $
CI Cost Index for 2003 6581 $
OMW Operating maintenance wages 8.3 $ per hour
EC Electricity cost 0.05 $ per kWh
PH Pumping head 10.0 m
PE Pumping efficiency 0.6

International Journal of Civil & Environmental Engineering IJCEE-IJENS Vol: 11 No: 01 29
111401-3636 IJCEE-IJENS © February 2011 IJENS I J E N S
TABLE V
KINETIC PARAMETERS AT DIFFERENT TEMPERATURES*
Symbol Characterization Temperature Units
10oC 20
oC 30
oC 40
oC
kH Hydrolysis rate constant
2 3 4.5 6.75 g CODXS (g CODXH)
-1d
-1
k STO Storage rate constant
2.5 5.0 10.0 20.0 g CODSS (g CODXH)
-1d
-1
H Heterotrophic max. growth rate
of XH
1 2 4 8 d1
bH,O2 Aerobic endogenous
respiration rate of XH
0.1 0.2 0.4 0.8 d1
bSTO,O2 Aerobic respiration rate
for XSTO
0.1 0.2 0.4 0.8 d1
A Autotrophic max. growth rate of XA
0.35 1 2.86 8.16 d1
bA,O2 Aerobic endogenous
respiration rate of XA
0.05 0.15 0.45 1.35 d1
*Values at 10oC and
oC as given by Henze et al. (2000) and estimated at other temperatures from Arrhenius Equation
T ABLE VI T YPICAL VALUES OF KINETIC PARAMETERS NOT AFFECTED BY TEMPERATURE [17]
Symbol Characterization Value Units
KX Hydrolysis saturation constant 1 g CODXS (g CODXH)1
KS Saturation constant for substrate SS 2 g CODXS m3
KSTO Saturation constant for XSTO 1 g CODXSTO (g CODXH)1
KNH4 Saturation constant for ammonium, SNH4 0.01 g N m3
KA, NH4 Ammonium substrate saturation for XA 1 g N m3

International Journal of Civil & Environmental Engineering IJCEE-IJENS Vol: 11 No: 01 30
111401-3636 IJCEE-IJENS © February 2011 IJENS I J E N S
T ABLE VII SYSTEM DESIGN AT VARIOUS TEMPERATURES
Symbol Units Temperature, oC
10 20 30 40
q m/d 120 120 120 120
Ap m2 299.8 299.8 299.8 299.8
SRT d 8.00 3.48 5.19 7.08
HRT d 0.276 0.125 0.142 0.155
V m3 9926 4497 5119 5570
AFR m3/min 268.4 264.5 307.2 334.2
XSS3 g/m3 as SS 4626 4628 4617 4610
R - 0.25 0.25 0.25 0.25
W - 0.665 0.696 0.516 0.401
SR m/d 18.9 18.9 18.9 18.9
Af M2 1890 1890 1893 1894
SS3 g/m3 as COD 0.502 0.568 0.284 0.213
SNH3 g/m3 as N 1.0 0.778 0.290 0.224
XSS4 g/m3 as SS 10 10 10 10
Cost $/yr 653,223 598,138 621,080 635,637
T ABLE VIII
SYSTEM DESIGN AT DIFFERENT INFLUENT FLOW RATES
Symbol Units Influent flow rate, m3/h
1000 1500 2000
O m/d 120 120 120
Ap m2 199.9 299.8 399.7
SRT d 3.479 3.479 3.479
HRT d 0.125 0.125 0.125
V m3 2998 4497 5996
AFR m3/min 176.3 264.5 352.7
XSS3 g/m3 as SS 4628.0 4628.0 4628.0
R - 0.25 0.25 0.25
W - 0.696 0.696 0.696
SR m/d 18.90 18.90 18.90
Af m2 1260 1889.9 2519.9
SS3 g/m3 as COD 0.568 0.568 0.568
SNH3 g/m3 as N 0.778 0.778 0.778
XSS4 g/m3 as SS 10 10 10
Cost $/yr 460567 59818 720932
International Journal of Civil & Environmental Engineering IJCEE-IJENS Vol: 11 No: 01 31
111401-3636 IJCEE-IJENS © February 2011 IJENS I J E N S
T ABLE IX SYSTEM DESIGN OPTIMIZATION FOR DIFFERENT INFLUENT CONDITIONS
Case
Symbol Units Base 1 2 3 4 5 6 7 8
Influent Conditions
Q m3/h 1500 1500 1500 1500 1500 1500 1500 1500 1500
SI mg/L as COD
32 32 32 32 32 32 32 64 32
SS mg/L as COD
162 324 162 324 162 162 162 324 162
SNH4 mg/L as N 25 25 50 50 25 25 25 50 25
SNOX mg/L as N 0 0 0 0 0 0 0 0 0
XI mg/L as COD
92 92 92 92 184 92 184 184 92
XS mg/L as COD
214 214 214 214 214 428 428 428 214
XH mg/L as COD
0 0 0 0 0 0 0 0 10
XSTO mg/L as COD
0 0 0 0 0 0 0 0 0
XA mg/L as COD
0 0 0 0 0 0 0 0 0
XSS mg/L as SS 230 230 230 230 299 390 460 460 239
Final Solutions
O m/d 120 120 120 120 120 120 113.2 120 120
Ap m2 299.8 299.8 299.8 299.8 299.5 298.8 315.9 298.1 299.8
SRT d 3.479 3.444 5.328 5.048 2.857 3.534 2.857 4 3.361
HRT d 0.125 0.161 0.176 0.218 0.13 0.148 0.144 0.233 0.125
V m3 4497 5799.2 6348.6 7825.2 4672.5 5306.4 5135.5 8322.9 4497
AFR m3/min 264.5 348.0 380.92 469.51 248.76 318.38 296.07 499.38 263.1
XSS3 g/m3 as SS 4628.0 4641.8 4624.4 4637.0 4640.1 4635.5 4646.1 4656.2 4629.6
R - 0.25 0.25 0.25 0.25 0.25 0.25 0.25 0.25 0.25
W - 0.696 0.928 0.636 0.848 0.9 0.822 1.003 1.176 0.722
SR m/d 18.90 18.89 18.91 18.90 18.90 18.90 18.89 18.88 18.90
Af m2 1889.9 1886.4 1890.8 1887.6 1884.9 1881.8 1874.6 1872.0 1889.5
SS3 g/m3 as COD 0.568 0.573 0.405 0.42 0.691 0.56 0.691 0.502 0.544
SNH3 g/m3 as N 0.778 0.787 0.51 0.534 1 0.764 1 0.667 0.81
XSS4 g/m3 as SS 10 10 10 10 10 10 10 10 10
Cost 1000$/yr 598.1 644.6 661.2 706.2 598.8 638.9 635.4 737.0 597.7

International Journal of Civil & Environmental Engineering IJCEE-IJENS Vol: 11 No: 01 32
111401-3636 IJCEE-IJENS © February 2011 IJENS I J E N S
Aeration Tank
V=4497 m3 SRT=3.479 d
HRT=3 h
1 2 3 4
5
7 6 8
1500 32
162 25 0
92 214
0 0 0
230
0 70.43 163.8
0 0 0
176.1
25 162 32
1499
28.78
2283 474.7 2230
126.2 731.0 4628
0.778 0.568
32 1874
28.78 4.934 1.026
4.819 0.273
1.580 10
0.778 0.568
32 1489
10.43 32
0.568 0.778 28.78 11089
2305
22475 3550 612.8 10830
1.014 32
162 25 0
31980 74387
79949 0 0 0
374.7 32
0.568 0.778 28.78 11089 2305
22475 3550 612.8 10830
Q: m3/hr
SI: g/m3
SS: g/m3
SNH4: g/m3
SNOX: g/m3
XI: g/m3
XS: g/m3
XH: g/m3
XA: g/m3
XSTO: g/m3
XSS: g/m3
LEGEND:
Primary
qp=120 m/d
Ap=299.8 m2
Secondary
qS=18.9 m/d
Af=1890 m2
r = 0.25
T ABLE X PERCENTAGE CHANGE IN OPTIMAL TOTAL COST DUE TO VARIATIONS IN KINETIC PARAMETERS
Kinetic Parameters
Units At 20oC At 40
oC
-50% +50% -50% +50%
kH mg/L as COD -0.1511 0.0469 -0.0615 0.0164
KX g CODXS (g CODXH)
1
0.0630 -0.0561 0.0222 -0.0222
kSTO mg/L as COD 0.0296 -0.0065 -0.0168 0.0048
KS g CODXS m3
0.0083 -0.0083 0.0068 -0.0068
KSTO g CODXSTO (g
CODXH)1
-0.0006 -0.0002 -0.0139 0.0128
H d1
-0.0047 -0.0004 0.0318 -0.0099
KNH4 g N m3
0.0000 0.0000 -0.0006 0.0007
bH,O2 d1
-1.5146 1.8623 -2.0542 0.6479
bSTO,O2 d1
-0.0601 0.0571 -0.0285 0.0263
A d1
11.338 0.0959 -0.1320 0.0323
KA,NH4 g N m3
0.1019 1.2096 0.0428 -0.0420
bA,O2 d1
0.0042 0.3355 0.0030 -0.0368
Fig. 1. System Layout
Fig. 2. Application problem final solution
Primary Settling
Final Settling
Aeration 1 2 3 2 4
5
7 6 8
International Journal of Civil & Environmental Engineering IJCEE-IJENS Vol: 11 No: 01 33
111401-3636 IJCEE-IJENS © February 2011 IJENS I J E N S
Fig. 3. Effect of SRT on biodegradable substrate, ammonium/ammonia nitrogen, and total COD