optimal joint select
TRANSCRIPT
Optimal Joint Selection for Skeletal Datafrom RGB-D Devices using a Genetic Algorithm
Pau Climent-Perez1, Alexandros Andre Chaaraoui1,Jose Ramon Padilla-Lopez1, and Francisco Florez-Revuelta2
1 Department of Computer Technology,University of Alicante, Alicante, Spain
{pcliment,alexandros,jpadilla}@dtic.ua.es
http://web.ua.es/dai2 Faculty of Science, Engineering and Computing, Kingston University,
Kingston upon Thames, United [email protected]
Abstract. The growth in interest in RGB-D devices (e.g. MicrosoftKinect or ASUS Xtion Pro) is based on their low price, as well as thewide range of possible applications. These devices can provide skeletaldata consisting of 3D position, as well as orientation data, which can befurther used for pose or action recognition. Data for 15 or 20 joints canbe retrieved, depending on the libraries used. Recently, many datasetshave been made available which allow the comparison of different actionrecognition approaches for diverse applications (e.g. gaming, Ambient-Assisted Living, etc.). In this work, a genetic algorithm is used to de-termine the contribution of each of the skeleton’s joints to the accuracyof an action recognition algorithm, thus using or ignoring the data fromeach joint depending on its relevance. The proposed method has beenvalidated using a k-means-based action recognition approach and usingthe MSR-Action3D dataset for test. Results show the presented algo-rithm is able to improve the recognition rates while reducing the featuresize.
Keywords: feature selection, genetic algorithm, RGB-D devices, humanaction recognition
1 Introduction
In recent times, a great interest has been put on affordable devices that cancapture depth quite reliably. These provide a depth image (D), along with anRGB image (thus RGB-D). The depth image can be further processed to obtainmarker-less body pose estimation by means of a skeleton model consisting of aseries of joint data, which in turn can be fed to a machine learning algorithm inorder to learn and recognise poses, actions, or complex activities.
It is in this field, where it might be interesting to determine which jointshave a greater contribution to the success of the learning/recognition methodused. Furthermore, it might be also interesting to analyse if these “key joints”

2 Pau Climent-Perez et al.
are different depending on the dataset or application (e.g. a subset of joints isimportant for gaming applications, but not for the recognition of Activities ofDaily Living –ADLs–).
In this paper, the use of a genetic algorithm for the intelligent selection ofjoints is presented, which, by using a machine learning algorithm with a cross-validation performed over a well-known dataset, is able to select the most valu-able subset of joints to use in order to increase the accuracy of the recognitionmethod.
The remainder of this paper is organised as follows: different methods arepresented, this includes the genetic algorithm (Sec. 2), as well as, the actionrecognition technique (Sec. 3) used; after that, in Sections 4 and 5, experimen-tation and results are presented; finally, some discussion and conclusions aredrawn.
1.1 Body joint data acquisition from RGB-D devices
The Moving Light Display (MLD) experiments [1] demonstrated the humanability to distinguish different activities from lights attached to the joints ofan actor (as stated in [2]). It does not seem risky to hypothesise that joint datacontains very valuable information for the recognition of activities by computers;and in addition, that methods that rely solely on the spatial distribution of jointscan obtain good performance.
Recently, a number of different applications for human action recognitionbased on RGB-D devices have been developed. In parallel several datasets havebeen recorded and publicly offered to be used by researchers. While some arebased on gesture/action recognition for Natural User Interfaces (the so-calledNUI’s) or gaming [3], others try to recognise more complex activities for differentapplications even using data from the subject–object interaction [4–7].
Two skeleton models are widely available to work with RGB-D devices. Oneis the skeleton model used by Microsoft Kinect SDK, that has 20 joints available(see Fig. 1). The other is the OpenNI/NITE skeleton, which tracks 15 joints.
1.2 Genetic algorithms for optimal feature selection
The feature subset problem arises when using feature vectors, since these mightcontain irrelevant or redundant information that could negatively affect the ac-curacy of a classifier [8]. In fact, irrelevant and redundant features interfere withuseful ones, and most classifiers are unable to discriminate them [9, 10].
Otherwise defined, not all the features from the input space are really useful.Feature selection consists in finding a subset of variables that optimises theclassification, leading to a higher performance. Also, identifying relevant featuresis of great importance for classification tasks, as it improves accuracy and reducescomputational costs involved [11, 12].
In the particular case of skeletal data from RGB-D devices, some pointsare more characteristic to represent the pose or movement than others [13]. In

Optimal Joint Selection for Skeletal Data from RGB-D Devices 3
16
18 19
17
15 14
5 6
7
4
1
8
10
12 11
13
9
2
3
20
Fig. 1. The 20 joints from a skeleton in the MSR-Action3D dataset, numbered usingthe same order employed in the dataset’s X-Y-Z coordinate files.
fact, the joints in the torso (shoulders, spine, torso, waist, hips, etc.) rarely ex-hibit strong independent motion; thus, dimensionality reduction, which improvesclassification performance, can be applied taking these constraints into account,while retaining the character of the motion [13].
Two main models are presented to do this [8, 11]: the wrapper model [14], andthe filter model. The latter selects the features based on a priori decisions onfeature relevance according to some measures (information, distance, dependenceor consistency) [15], but it ignores the induction algorithm underneath (that is,the actual algorithm that induces a model that classifies the objects into a setof labels or classes). In the former and on the contrary, the feature selectionalgorithm exists as a wrapper around the induction algorithm; in the search of afeature subset, the inductor itself is used as part of the evaluation function [14].
The main disadvantage of the wrapper approach is the time needed for theevaluation of each feature subset [9]. On the other hand, filter-based approaches,although faster, find worse subsets [8].
Genetic algorithms can be applied as wrapper methods, and they are in factcommonly used for the feature selection problem as they have proved appropri-ate; even so, other methods such as Tabu Search, GRASP, and other methodsperform better [11].
2 A genetic algorithm for skeletal feature selection
The main contribution of this paper is the use of a genetic algorithm for theselection of joint features. An individual is coded as a boolean array u whoseelements uj are a value that represent the inclusion or exclusion of the jth jointfrom the data which is passed in to the recognition system.
4 Pau Climent-Perez et al.
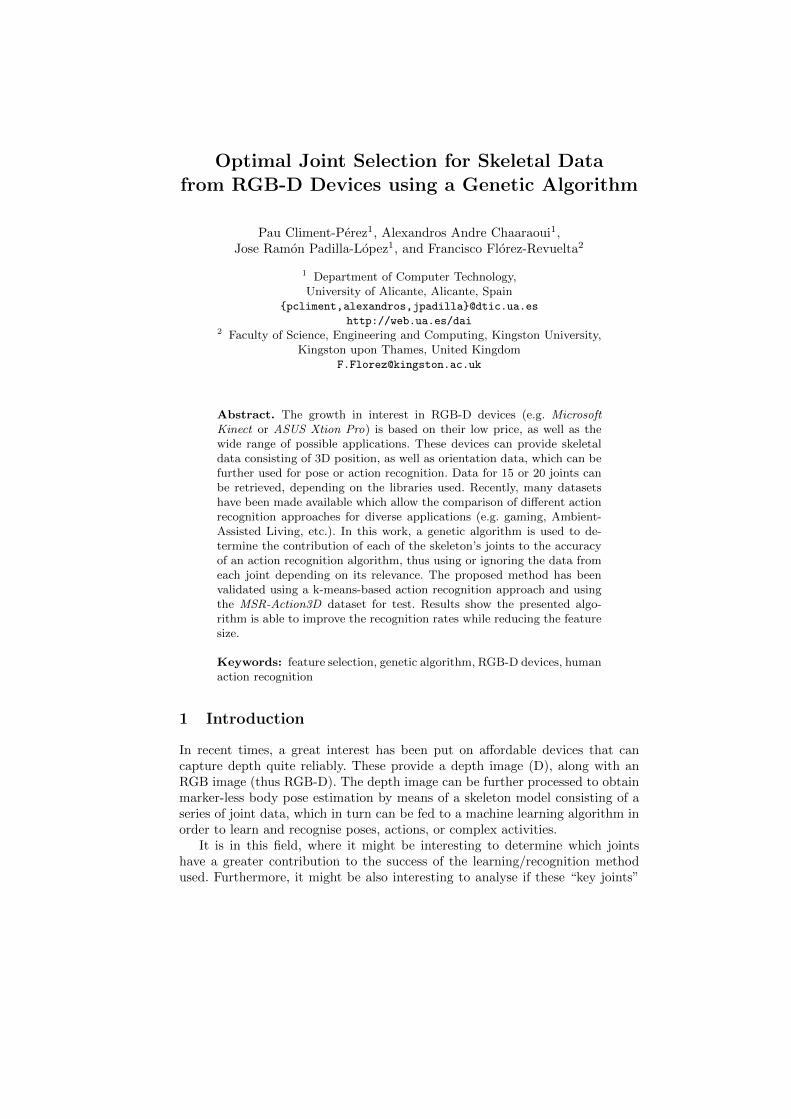
It is worth noting that, the order of elements in u has been chosen so that thedifferent skeleton models could be employed. Since one presents only 15 joints, asstated in Sec. 1.1, making u model-independent, allows the use of both models(see Fig. 2).
0 1 2 ... ... 14 15 ... ... 19
1 1 1 0 0 1 0 0 1 1 1 1 1 0 0 1 1 0 1 1
Head
Neck
Left S
ho
uld
er
Rig
ht S
ho
uld
er
Left E
lbo
w
Rig
ht E
lbo
w
Left H
an
d
Rig
ht H
an
d
To
rso
Left H
ip
Rig
ht H
ip
Left K
nee
Rig
ht K
nee
Left F
oo
t
Rig
ht F
oo
t
Wais
t
Left W
rist
Rig
ht W
rist
Left A
nkle
Rig
ht A
nkle
15 basic joints 5 extended joints
Fig. 2. An array u, as the ones used in the genetic algorithm for joint selection. It canbe seen that joints 0 to 14 are called basic joints, as they are common to both skeletonmodels presented in Sec. 1.1. On the other hand, joints 15 to 19 are called extended forthey are only present in the 20-joint model from Microsoft.
The employed algorithm is a genetic algorithm, with the addition of a taboolist, where unsuccessful individuals are stored to avoid repeating the evaluation,as it is a very time-consuming task.
Concretely, the algorithm performs the following steps:
1. Create a random population. The first individual is always that whose uj =1, ∀j ∈ 0..J (being J the total number of joints in the selected skeletonmodel). The rest are randomly created, favouring the inclusion of joints inthe feature, by using a probability (P1 = 0.75;P0 = 0.25, these values havebeen chosen empirically).
2. Evaluate the fitness for the initial population. To this end, a k-means (seeSec. 3) cross-subject cross-validation is employed (see Sec. 4). Other recog-nition methods and training sets can be used.
3. Order the population in descending fitness value.4. Create a new individual by recombination, using a one-point crossover se-
lecting the two parents by ranking and the crossover point at random.5. Mutate the new individual’s elements, using a mutation probability Pm =
0.1.6. Assure that:
– First, the new individual does not exist in the population.– Second, the new individual is not included in the taboo list.If any of these conditions is not fulfilled, then go back to step 4.
7. Add the worse-performing individual to the taboo list, and remove it fromthe population.
8. Return to step 3; repeat until no changes in the best-performing individualare observed during a number of generations maxgen.

Optimal Joint Selection for Skeletal Data from RGB-D Devices 5
3 The action recognition method
The objective of this paper is not the development of an action recognitionmethod to be used as a fitness function. Therefore, a state-of-the-art algorithmis used [16, 17], which is based on k-means for the creation of a series of keyposes which are then used during the recognition phase in which a weightingscheme is used to determine the final labelling for the input. The authors in [16]use this scheme for contour-based action recognition, with silhouettes extractedfrom conventional RGB cameras. The method has been modified to deal withjoint data, instead of contour points as used in the original method.
In [16] the feature consisted of a series of contour point coordinates (x, y) thatwere retrieved from silhouettes obtained from background subtraction techniquesapplied to RGB video streams. These coordinates were extracted in a clockwisefashion: first, the centroid was estimated; then, starting from the leftmost point(relative to the centroid) a determined number of points L were extracted fromthe silhouette; finally, the coordinates are translated and normalised, to the so-called normalised distance signal DS.
Following a similar approach and since data from RGB-D devices is usedinstead, the body pose feature is calculated as follows: first, the 3D real-world3
coordinates for 15 to 20 joints are retrieved from a marker-less body pose estima-tor based on the depth images obtained; after that, coordinates are translated sothat the Torso (marked as ‘4’ in Fig. 1) point is considered the origin (0, 0, 0);then, the distance from each joint to the Torso can be normalised according tothe Torso–Neck distance (see Section 4).
This feature is calculated for every skeleton present in the training data.That is, when the training process starts, the skeleton data for each actionclass are retrieved from the available training data (depicted as T0..TN in Fig.3,which summarises the process), the feature is extracted for every frame as justexplained. Then, each set of skeleton data from the different action sets areclustered using k-means. At this step, different values for K can be provided;this determines the number of class representatives per action (key poses) to beretrieved.
After this initial process, the training data is fed back, and the skeleton ineach frame of each of the training sequences is evaluated against the key poses.If the nearest key pose kp returned is of the same action class as the skeletonretrieved from the sequence, the value hitskp is increased; otherwise, missedkp is.This way, after the process has finished, each key pose kp is given a weight wkp,such that:
wkp =hitskp
hitskp + missedkp. (1)
What this means is, that a key pose kp that received a high number of hits(↑ wkp), is more representative than a key pose with a lower weight.
3 When real-world coordinates are retrieved; these are obtained in millimetres fromthe sensor.

6 Pau Climent-Perez et al.
Training data Input patterns
T0 .. TN
K-means
(1 per action)
Weighted Key poses (kp)
sk[0,0] sk[N,t] sk0 skt
wkp
Find_Nearest(kp)
Rc += wkp
cf = Max(R)
Fig. 3. The work-flow of the proposed action recognition scheme.
During recognition, the skeletons from the input patterns are extracted, be-ing skt each of the skeletons to test (where t represents the time, as a framenumber).
Furthermore, an array of results R is created. To proceed to recognition,for each of the extracted skeletons skt, the nearest available key pose kp isretrieved; then, wkp is added to Rc being c the action class of kp. The finallabel cf = max (R) is calculated and the corresponding action class cf (label) isreturned.
4 Experimentation
Choosing a dataset. In this work, the MSR-Action3D dataset is used [3].This dataset contains 20 different actions (see Table 1), performed by 10 differ-ent subjects and with up to 3 different repetitions. This makes a total of 567sequences. Since a dataset is used in the current work, the election of a skeletonmodel is constrained to the one used in that specific dataset. In this case, it isthe 20-joint model described in Sec. 1.1.
Validating the action recognition method. The method presented in Sec. 3has been validated; to do so, a cross-subject validation is used, in which half thesubjects are used for training and the remainder are used for test (and vice-versa4) as performed by various other works [3, 4, 18].
Two things are worth mention at this point: one is, that even if the proposedmethod does not outstrip state-of-the-art methods using the same dataset [3, 4,
4 In MSR-Action3D this means subjects s01 to s05; and subjects s06 to s10. Notethis is different from a Leave-one-actor-out cross-validation.

Optimal Joint Selection for Skeletal Data from RGB-D Devices 7
Table 1. Actions in the MSR-Action3D dataset.
Label Action name Label Action name Label Action name
a01 High arm wave a08 Draw tick a15 Side-kicka02 Horizontal arm wave a09 Draw circle a16 Jogginga03 Hammer a10 Hand clap a17 Tennis swinga04 Hand catch a11 Two-hand wave a18 Tennis servea05 Forward punch a12 Side-boxing a19 Golf swinga06 High throw a13 Bend a20 Pick-up and throwa07 Draw cross a14 Forward kick
18], it is not the current aim, since this work intends to show how intelligentjoint selection might affect accuracy; and the second is, the presented methodachieved a recognition rate of 65.7 % (with K = 8) on the cross-subject test(using all the joints, that is uj = 1, ∀j ∈ 0..J, J = 20), which is used as a basevalue to test other u ’s.
Defining a fitness function. A cross-subject validation with the whole datasetusing the presented recognition method (Sec. 3) is used as the fitness functionfor the genetic algorithm. To this end, the training and recognition phases werechanged so that an individual (that is, an array of joint weights uj , j ∈ 0..J)is used for the distance functions. This way, recognition rates can be calculatedwhen different u ’s are passed in. A low value for K is used, K = 8, so, after theclustering, eight different key poses (class representatives) are obtained for eachof the action classes.
Choosing the best-performing population size. Different population sizesare tested to compare their performance. The proposed algorithm is launchedusing populations of 2, 5, 10, and 25 individuals plus 1 offspring individual bothwith and without the Torso-Neck distance normalisation.
Optimal feature selection. By means of the proposed genetic algorithm, anindividual u is selected, which optimises the accuracy value of the recognitionmethod in use (i.e. the best individual in the population after the evolution).Results and discussions follow.
5 Results and Discussion
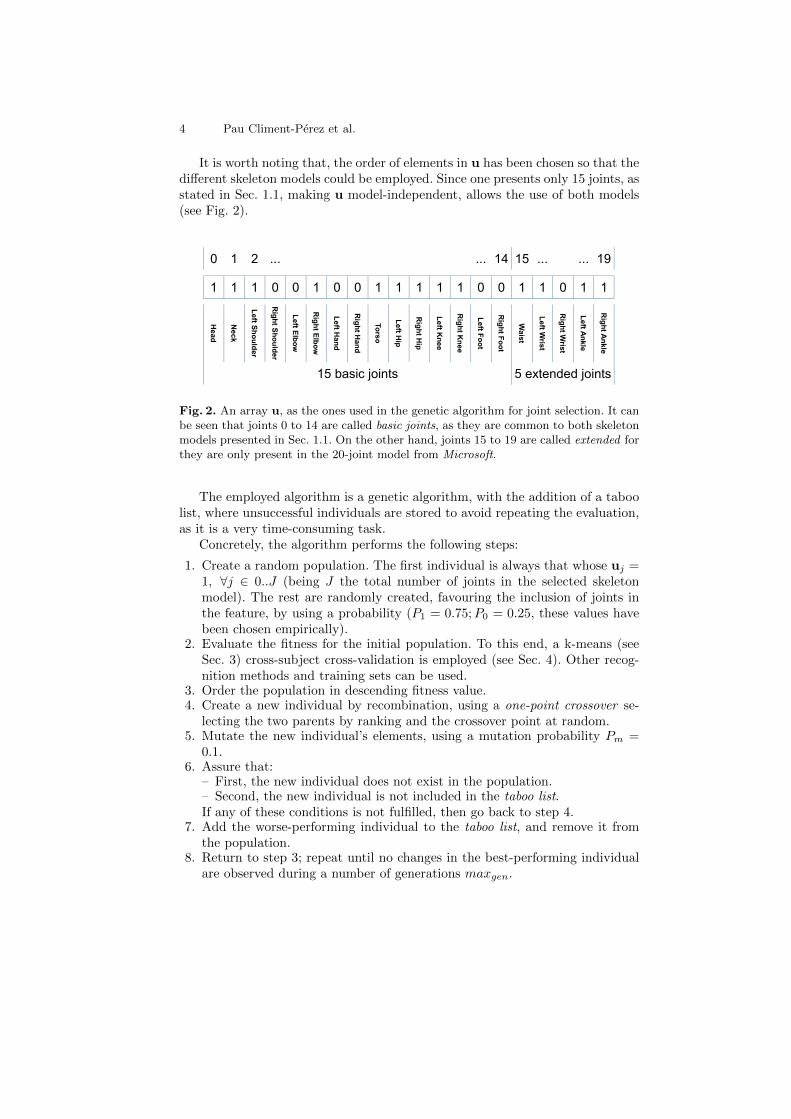
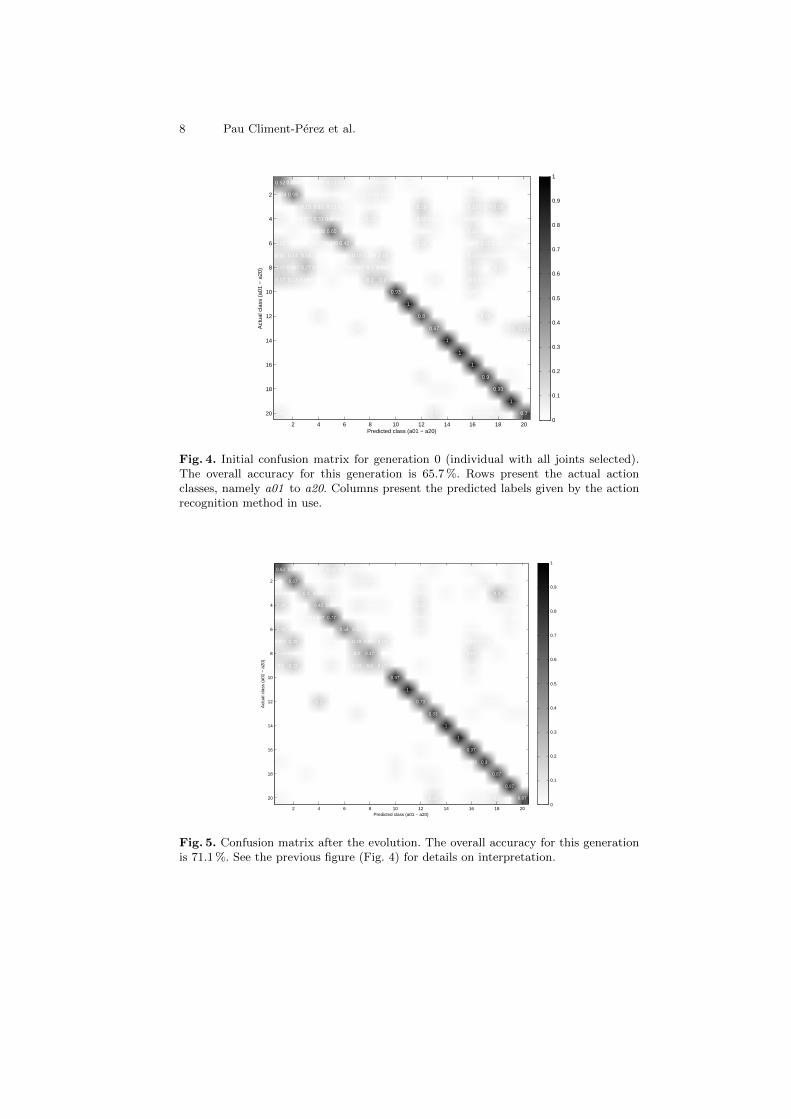
Setting the size of the population to 5 individuals and letting it evolve, valuableresults have been retrieved. The best results were retrieved when not using theTorso-Neck normalisation. As figures 4 and 5 show, there is an improvementof 5.4 % after maxgen = 500 generations without change. Furthermore, differ-ences in the confusion matrices obtained before and after the evolution can beobserved.
8 Pau Climent-Perez et al.
Predicted class (a01 − a20)
Act
ual c
lass
(a0
1 −
a20
)
0.52 0.074 0 0.037 0.11 0.074 0 0.0370.074 0 0.037 0 0 0 0 0 0 0 0 0.037
0.074 0.59 0 0 0.037 0 0.0370.0740.074 0 0 0.037 0 0 0 0.074 0 0 0 0
0 0 0.15 0.11 0.11 0.037 0 0.037 0 0 0 0.19 0 0 0 0.11 0.074 0.19 0 0
0.077 0 0.077 0.31 0.0770.038 0 0.12 0 0 0 0.12 0.038 0 0.0380.077 0 0.038 0 0
0 0.038 0 0.038 0.65 0 0 0 0 0 0 0.0380.038 0 0 0.12 0 0 0.0380.038
0.12 0 0 0.0770.038 0.42 0 0 0 0 0 0.12 0 0 0 0.038 0.12 0.0380.038 0
0.11 0.14 0.14 0 0 0 0.18 0.036 0.14 0 0 0 0 0 0 0.11 0.0710.036 0 0.036
0.17 0.067 0.27 0.033 0 0.0330.067 0.1 0.067 0 0 0 0 0 0 0.1 0 0.1 0 0
0.17 0.13 0.067 0 0.033 0 0 0.2 0.2 0 0 0 0.067 0 0 0.1 0.033 0 0 0
0 0 0 0 0 0 0 0 0 0.93 0 0 0 0 0 0.067 0 0 0 0
0 0 0 0 0 0 0 0 0 0 1 0 0 0 0 0 0 0 0 0
0 0 0 0.067 0 0 0 0 0 0 0 0.8 0 0 0 0 0.13 0 0 0
0 0 0 0 0 0 0.067 0 0 0 0 0 0.67 0 0 0 0 0 0.1 0.17
0 0 0 0 0 0 0 0 0 0 0 0 0 1 0 0 0 0 0 0
0 0 0 0 0 0 0 0 0 0 0 0 0 0 1 0 0 0 0 0
0 0 0 0 0 0 0 0 0 0 0 0 0 0 0 1 0 0 0 0
0 0 0 0 0 0 0 0 0 0 0 0.067 0 0 0 0 0.9 0 0.033 0
0 0 0 0 0 0 0 0 0 0 0 0 0.0330.033 0 0 0 0.93 0 0
0 0 0 0 0 0 0 0 0 0 0 0 0 0 0 0 0 0 1 0
0.067 0 0 0 0 0 0 0 0 0 0 0 0.1 0 0 0.0330.0330.067 0 0.7
2 4 6 8 10 12 14 16 18 20
2
4
6
8
10
12
14
16
18
200
0.1
0.2
0.3
0.4
0.5
0.6
0.7
0.8
0.9
1
Fig. 4. Initial confusion matrix for generation 0 (individual with all joints selected).The overall accuracy for this generation is 65.7 %. Rows present the actual actionclasses, namely a01 to a20. Columns present the predicted labels given by the actionrecognition method in use.
Predicted class (a01 − a20)
Act
ual c
lass
(a0
1 −
a20
)
0.63 0.037 0 0.037 0.11 0.037 0.037 0 0 0 0 0 0.037 0 0 0.037 0 0 0.037 0
0 0.67 0 0 0.037 0 0.074 0.074 0 0 0 0.037 0 0 0 0 0.074 0 0.037 0
0.074 0 0.3 0.037 0.074 0 0 0 0 0 0 0.074 0 0.037 0 0.037 0 0.3 0.074 0
0.19 0 0 0.42 0.038 0 0.077 0.038 0.038 0 0 0.12 0 0 0 0 0 0.038 0.038 0
0 0 0.038 0.077 0.77 0 0 0 0 0 0 0.077 0 0 0 0 0 0 0.038 0
0.19 0 0 0 0 0.54 0.12 0 0 0 0 0.077 0 0 0 0.038 0 0 0.038 0
0.071 0.25 0 0 0.036 0 0.29 0.071 0.14 0 0 0 0 0 0 0.071 0.071 0 0 0
0.13 0.033 0 0 0 0 0.2 0.47 0 0 0 0 0 0 0 0.13 0 0.033 0 0
0.1 0.23 0 0 0.067 0 0.13 0.2 0.17 0 0 0.033 0 0 0 0.067 0 0 0 0
0 0 0 0 0 0 0 0 0 0.97 0 0 0 0 0 0.033 0 0 0 0
0 0 0 0 0 0 0 0 0 0 1 0 0 0 0 0 0 0 0 0
0 0 0 0.2 0 0 0 0 0 0 0 0.73 0 0 0 0 0.033 0.033 0 0
0 0 0 0 0 0 0.067 0 0 0 0 0 0.83 0 0 0.033 0 0 0.033 0.033
0 0 0 0 0 0 0 0 0 0 0 0 0 1 0 0 0 0 0 0
0 0 0 0 0 0 0 0 0 0 0 0 0 0 1 0 0 0 0 0
0 0 0 0 0 0 0 0 0 0 0 0.033 0 0 0 0.97 0 0 0 0
0.033 0 0 0 0 0 0 0 0 0.033 0 0 0 0 0 0.033 0.9 0 0 0
0 0 0.033 0 0 0 0 0 0 0.033 0 0.033 0.033 0 0 0 0 0.87 0 0
0 0 0 0 0 0 0 0 0 0 0 0 0.033 0 0 0 0 0 0.97 0
0.033 0 0 0 0 0 0 0 0 0 0 0 0.13 0 0 0.033 0.033 0.1 0 0.67
2 4 6 8 10 12 14 16 18 20
2
4
6
8
10
12
14
16
18
20
0
0.1
0.2
0.3
0.4
0.5
0.6
0.7
0.8
0.9
1
Fig. 5. Confusion matrix after the evolution. The overall accuracy for this generationis 71.1 %. See the previous figure (Fig. 4) for details on interpretation.
Optimal Joint Selection for Skeletal Data from RGB-D Devices 9
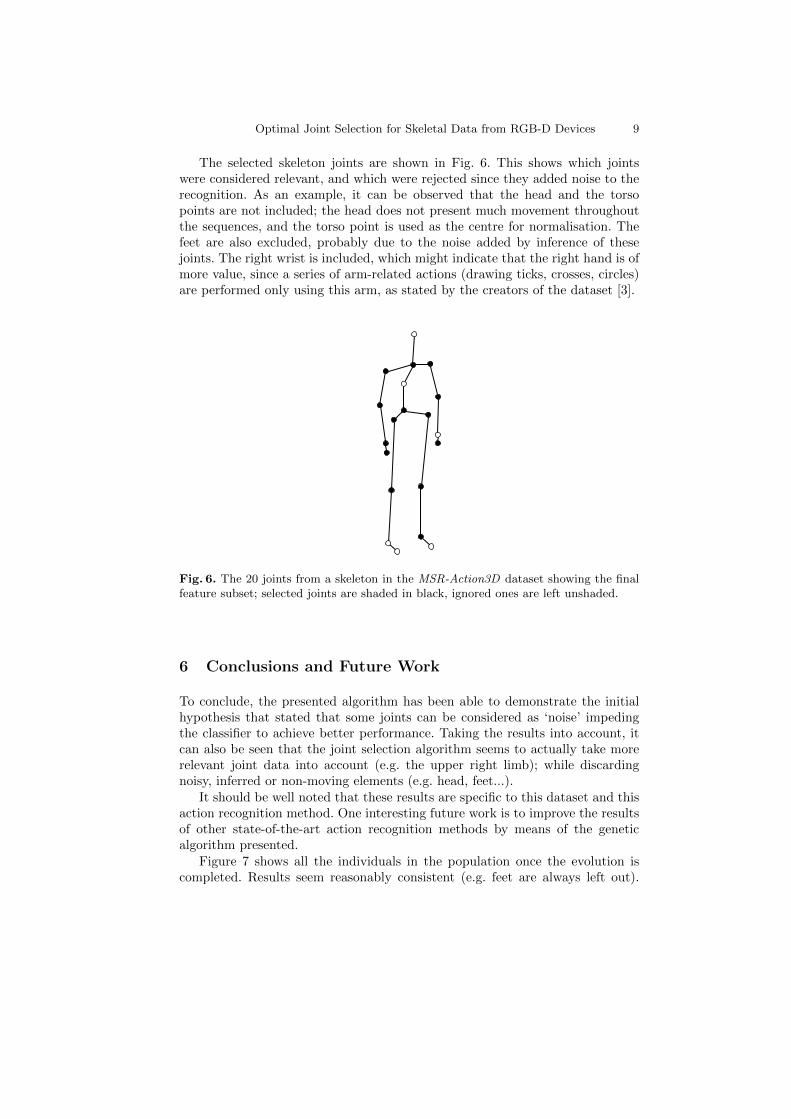
The selected skeleton joints are shown in Fig. 6. This shows which jointswere considered relevant, and which were rejected since they added noise to therecognition. As an example, it can be observed that the head and the torsopoints are not included; the head does not present much movement throughoutthe sequences, and the torso point is used as the centre for normalisation. Thefeet are also excluded, probably due to the noise added by inference of thesejoints. The right wrist is included, which might indicate that the right hand is ofmore value, since a series of arm-related actions (drawing ticks, crosses, circles)are performed only using this arm, as stated by the creators of the dataset [3].
Fig. 6. The 20 joints from a skeleton in the MSR-Action3D dataset showing the finalfeature subset; selected joints are shaded in black, ignored ones are left unshaded.
6 Conclusions and Future Work
To conclude, the presented algorithm has been able to demonstrate the initialhypothesis that stated that some joints can be considered as ‘noise’ impedingthe classifier to achieve better performance. Taking the results into account, itcan also be seen that the joint selection algorithm seems to actually take morerelevant joint data into account (e.g. the upper right limb); while discardingnoisy, inferred or non-moving elements (e.g. head, feet...).
It should be well noted that these results are specific to this dataset and thisaction recognition method. One interesting future work is to improve the resultsof other state-of-the-art action recognition methods by means of the geneticalgorithm presented.
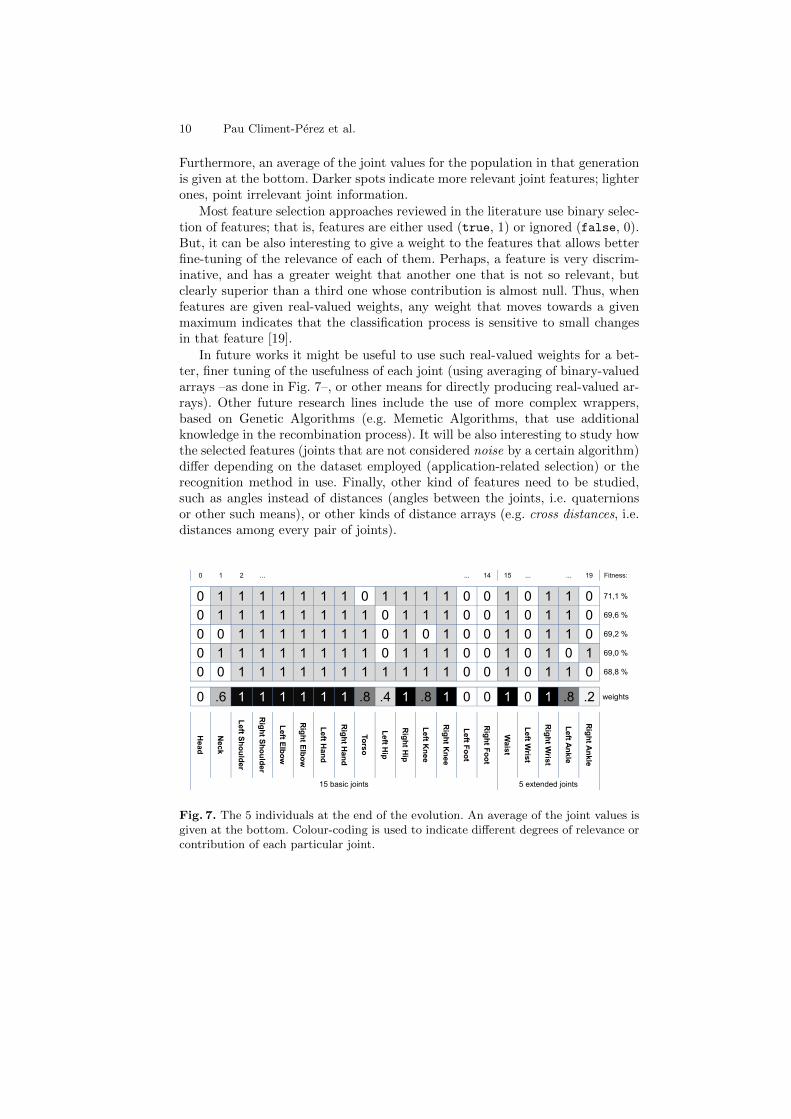
Figure 7 shows all the individuals in the population once the evolution iscompleted. Results seem reasonably consistent (e.g. feet are always left out).
10 Pau Climent-Perez et al.
Furthermore, an average of the joint values for the population in that generationis given at the bottom. Darker spots indicate more relevant joint features; lighterones, point irrelevant joint information.
Most feature selection approaches reviewed in the literature use binary selec-tion of features; that is, features are either used (true, 1) or ignored (false, 0).But, it can be also interesting to give a weight to the features that allows betterfine-tuning of the relevance of each of them. Perhaps, a feature is very discrim-inative, and has a greater weight that another one that is not so relevant, butclearly superior than a third one whose contribution is almost null. Thus, whenfeatures are given real-valued weights, any weight that moves towards a givenmaximum indicates that the classification process is sensitive to small changesin that feature [19].
In future works it might be useful to use such real-valued weights for a bet-ter, finer tuning of the usefulness of each joint (using averaging of binary-valuedarrays –as done in Fig. 7–, or other means for directly producing real-valued ar-rays). Other future research lines include the use of more complex wrappers,based on Genetic Algorithms (e.g. Memetic Algorithms, that use additionalknowledge in the recombination process). It will be also interesting to study howthe selected features (joints that are not considered noise by a certain algorithm)differ depending on the dataset employed (application-related selection) or therecognition method in use. Finally, other kind of features need to be studied,such as angles instead of distances (angles between the joints, i.e. quaternionsor other such means), or other kinds of distance arrays (e.g. cross distances, i.e.distances among every pair of joints).
0 1 2 ... ... 14 15 ... ... 19 Fitness:
0 1 1 1 1 1 1 1 0 1 1 1 1 0 0 1 0 1 1 0 71,1 %
0 1 1 1 1 1 1 1 1 0 1 1 1 0 0 1 0 1 1 0 69,6 %
0 0 1 1 1 1 1 1 1 0 1 0 1 0 0 1 0 1 1 0 69,2 %
0 1 1 1 1 1 1 1 1 0 1 1 1 0 0 1 0 1 0 1 69,0 %
0 0 1 1 1 1 1 1 1 1 1 1 1 0 0 1 0 1 1 0 68,8 %
0 .6 1 1 1 1 1 1 .8 .4 1 .8 1 0 0 1 0 1 .8 .2 weights
Head
Neck
Left S
ho
uld
er
Rig
ht S
ho
uld
er
Left E
lbo
w
Rig
ht E
lbo
w
Left H
an
d
Rig
ht H
an
d
To
rso
Left H
ip
Rig
ht H
ip
Left K
nee
Rig
ht K
nee
Left F
oo
t
Rig
ht F
oo
t
Wais
t
Left W
rist
Rig
ht W
rist
Left A
nkle
Rig
ht A
nkle
15 basic joints 5 extended joints
Fig. 7. The 5 individuals at the end of the evolution. An average of the joint values isgiven at the bottom. Colour-coding is used to indicate different degrees of relevance orcontribution of each particular joint.
Optimal Joint Selection for Skeletal Data from RGB-D Devices 11
Acknowledgements. This work has been partially supported by the SpanishMinistry of Science and Innovation under project “Sistema de vision para lamonitorizacion de la actividad de la vida diaria en el hogar” (TIN2010-20510-C04-02) and by the European Commission under project “caring4U - A studyon people activity in private spaces: towards a multisensor network that meetsprivacy requirements” (PIEF-GA-2010-274649). Alexandros Andre Chaaraouiand Jose Ramon Padilla-Lopez acknowledge financial support by the Conse-lleria d’Educacio, Formacio i Ocupacio of the Generalitat Valenciana (fellowshipsACIF/2011/160 and ACIF/2012/064 respectively). The funders had no role instudy design, data collection and analysis, decision to publish, or preparation ofthe manuscript.
The original publication is available at www.springerlink.com. This articlewas originally published in Climent-Perez, P., Chaaraoui, A., Padilla-Lopez,J., Florez-Revuelta, F.: Optimal joint selection for skeletal data from rgb-d de-vices using a genetic algorithm. In Batyrshin, I., Mendoza, M., eds.: Advances inComputational Intelligence. Volume 7630 of Lecture Notes in Computer Science.Springer Berlin Heidelberg (2013) 163-174. The published version of this articlecan be found at: http://link.springer.com/chapter/10.1007/978-3-642-37798-3_15
References
1. Johansson, G.: Visual perception of biological motion and a model for its analysis.Attention, Perception, & Psychophysics 14 (1973) 201–211 10.3758/BF03212378.
2. Polana, R., Nelson, A.: Detection and recognition of periodic, nonrigid motion.International Journal of Computer Vision 23 (1997) 261–282
3. Li, W., Zhang, Z., Liu, Z.: Action recognition based on a bag of 3D points. In: Com-puter Vision and Pattern Recognition Workshops (CVPRW), 2010 IEEE ComputerSociety Conference on. (June 2010) 9–14
4. Wang, J., Liu, Z., Wu, Y., Yuan, J.: Mining Actionlet Ensemble for Action Recog-nition with Depth Cameras. In: IEEE Conference on Computer Vision and PatternRecognition (CVPR 2012), Providence, Rhode Island (June 2012)
5. Sung, J., Ponce, C., Selman, B., Saxena, A.: Human activity detection from RGBDimages. In: AAAI workshop on Pattern, Activity and Intent Recognition (PAIR).(2011)
6. Ni, B., Wang, G., Moulin, P.: RGBD-HuDaAct: A color-depth video databasefor human daily activity recognition. In: Computer Vision Workshops (ICCVWorkshops), 2011 IEEE International Conference on. (nov. 2011) 1147–1153
7. Janoch, A., Karayev, S., Jia, Y., Barron, J.T., Fritz, M., Saenko, K., Darrell, T.:A category-level 3-d object dataset: Putting the kinect to work. In: ComputerVision Workshops (ICCV Workshops), 2011 IEEE International Conference on.(nov. 2011) 1168–1174
8. Cantu-Paz, E.: Feature subset selection, class separability, and genetic algorithms.In Deb, K., ed.: Genetic and Evolutionary Computation GECCO 2004. Volume3102 of Lecture Notes in Computer Science. Springer Berlin / Heidelberg (2004)959–970 10.1007/978-3-540-24854-5 96.

12 Pau Climent-Perez et al.
9. Lanzi, P.: Fast feature selection with genetic algorithms: a filter approach. In:Evolutionary Computation, 1997., IEEE International Conference on. (apr 1997)537–540
10. Kira, K., Rendell, L.A.: The feature selection problem: traditional methods anda new algorithm. In: Proceedings of the tenth national conference on Artificialintelligence. AAAI’92, AAAI Press (1992) 129–134
11. Casado Yusta, S.: Different metaheuristic strategies to solve the feature selectionproblem. Pattern Recognition Letters 30(5) (2009) 525–534
12. Yang, J., Honavar, V.: Feature subset selection using a genetic algorithm. Intelli-gent Systems and their Applications, IEEE 13(2) (mar/apr 1998) 44–49
13. Raptis, M., Kirovski, D., Hoppe, H.: Real-Time Classification of Dance Ges-tures from Skeleton Animation. In: Proceedings of the 10th Annual ACM SIG-GRAPH/Eurographics Symposium on Computer Animation, SCA 2011. (2011)147–156
14. John, G., Kohavi, R., Pfleger, K.: Irrelevant features and the subset selection prob-lem. In: Proceedings of the 11th International Conference on Machine Learning,San Francisco, CA, Morgan Kaufmann (1994) 121–129
15. Liu, H., Motoda, H.: Feature Selection for Knowledge Discovery and Data Mining.Kluwer Academic Publishers, Boston (1998)
16. Cheema, S., Eweiwi, A., Thurau, C., Bauckhage, C.: Action recognition by learningdiscriminative key poses. In: Computer Vision Workshops (ICCV Workshops), 2011IEEE International Conference on. (nov. 2011) 1302–1309
17. Chaaraoui, A.A., Climent-Perez, P., Florez-Revuelta, F.: An Efficient Approachfor Multi-view Human Action Recognition based on Bag-of-Key-Poses. In: HumanBehavior Understanding. (2012) unpublished.
18. Yang, X., Tian, Y.: EigenJoints-based Action Recognition Using Naıve-Bayes-Nearest-Neighbor. In: Second International Workshop on Human Activity Un-derstanding from 3D Data in conjunction with CVPR, 2012, Providence, RhodeIsland (2012)
19. Punch, W., Goodman, E., Pei, M., Chia-Shun, L., Hovland, P., Enbody, R.: Fur-ther research on feature selection and classification using genetic algorithms. In:Proceedings of the 5th International Conference on Genetic Algorithms. (1993)557–564