optically induced changes in the couplings between ... journal of neuroscience, august 1987, 7(8):...
TRANSCRIPT

The Journal of Neuroscience, August 1987, 7(8): 2578-2589
Optically Induced Changes in the Couplings Between Vergence and Accommodation
F. A. Miles,13 S. J. Judge,’ and L. M. Optican
‘The University Laboratory of Physiology, Oxford, England; “The Wilmer Institute, The Johns Hopkins University, Baltimore, Maryland; and 3The Laboratory of Sensorimotor Research, The National Eye Institute, Bethesda, Maryland
Vergence-induced accommodation (V-A) and accommoda- tion-induced vergence (A-V) were measured in human sub- jects before and after they had worn various optical devices for 30 min. Laterally displacing periscopic spectacles, which increase the required change in vergence per unit change in accommodation, caused decreases and increases in the gain of V-A and A-V responses, respectively. These obser- vations are consistent with the view that the gain of the neural cross-linkages between vergence and accommoda- tion are subject to adaptive regulation. However, there were strong asymmetries: Medially displacing periscopes (cyclo- pean spectacles), which reduce the required change in ver- gence per unit change in accommodation to zero, were al- most totally without effect. Base-out prisms, which increase the required convergence by an amount that is constant for all viewing distances, caused downward and upward shifts in the V-A and A-V response curves, respectively. Base-in prisms, which reduce the required convergence by a con- stant amount for all viewing distances, caused downward shifts of A-V curves but had no significant effect on V-A curves. These effects of prisms are in essential agreement with the work of others and confirm the existence of adaptive elements that regulate the bias in the vergence and/or ac- commodation control systems. Secondary effects of wearing periscopes and prisms indicated a certain lack of specificity in the sensing of gain and bias errors: vertical shifts of V-A and A-V curves (resembling those seen with base-out prisms) often occurred with the laterally displacing periscopes, and gain changes (generally resembling those seen with laterally displacing periscopes) often occurred with the base-out prisms.
The transfer of fixation from a distant object to a near one involves the adduction of one or both eyes to align them with the new object (convergence), and an increase in the dioptic power of the lenses to bring the retinal images of the new object into focus (accommodation). Ordinarily, the 2 responses pro- ceed roughly in concert and, when complete, the subject per- ceives a single sharp image of the new object. Accommodation and vergence are each controlled by negative feedback mech- anisms, one operating through the ciliary muscles and lens to reduce blur, and the other through the extraocular muscles and
Received Nov. 10, 1986; revised Jan. 20, 1987; accepted Jan. 30, 1987.
Correspondence should be addressed to F. A. Miles, Department of Biology, The City College of CUNY, Convent Avenue at 138th St., New York, NY 1003 1.
Copyright 0 1$87 Society for Neuroscience 0270-6474/87/082576-14.$02.00/O
globe to reduce retinal image disparity. Moreover, the 2 control systems are cross-coupled.
During monocular viewing, when there are no disparity inputs to the vergence system, blur-induced changes in accommoda- tion also result in parallel changes in vergence: the accommo- dative vergence (A-V) response (Mueller, 1826; Westheimer, 1955; Alpern and Ellen, 1956a, b; Flom, 1960a, c; Semmlow and Venkiteswaran, 1976; Kenyon et al., 1978). These changes in vergence are usually linearly related to the changes in accom- modation, and the slope of this relationship-often referred to as the AC/A ratio-is used as an index of the strength, or gain, of the cross-coupling (Alpem et al., 1959; Flom, 1960a). Two measures are distinguished, depending on whether the accom- modative state of the subject is assumed (the stimulus AC/A) or measured (the response AC/A).
The accommodation and vergence systems are also coupled through a second mechanism. During binocular pinhole view- ing, when blur inputs to the accommodation system are negli- gible, disparity-induced changes in vergence result in parallel changes in accommodation: the vergence accommodation (V- A) response (Morgan, 1954; Fincham, 1955; Fincham and Wal- ton, 1957; Kent, 1958; Balsam and Fry, 1959; Kersten and Legge, 1983). The changes in accommodation are usually lin- early related to the changes in vergence, and the slope of this relationship-often referred to as the CA/C ratio-is used as an index of the strength, or gain, of this cross-coupling (Fincham and Walton, 1957).
In recent years, it has become apparent that numerous control parameters in the oculomotor system are subject to adaptive regulation to ensure optimal performance [see Berthoz and Mel- vi11 Jones (1985) for recent reviews]. The object of the present experiments was to determine whether the cross-couplings be- tween vergence and accommodation-as represented by the V-A and A-V responses-were subject to adaptive regulation. The strategy employed to answer this question was to see if these responses were sensitive to optical devices that alter the gain of the required coupling between vergence and accom- modation.
A number of studies have reported changes in the AC/A ratio following orthoptic therapy (Manas, 1958; Flom, 1960~; Ogle et al., 1967), but these changes were invariably small and the optical geometry of the visual challenge unclear. It has recently been pointed out that the strength of the desired coupling be- tween vergence and accommodation under normal binocular viewing conditions is a function of the separation of the 2 lines of sight (Judge and Miles, 1985; Miles, 1985). For example, the greater the separation, the greater the required change in verg- ence per unit change in accommodation. Thus, devices that

The Journal of Neuroscience, August 1987, 7(8) 2577
increase the apparent separation call for an increase in the AC/A ratio and a decrease in the CA/C ratio. In fact, laterally dis- placing periscopic spectacles have been used to more than dou- ble the apparent interocular separation and, when worn for only 30 min, result in large increases in the stimulus AC/A ratio (Judge and Miles, 1985). Medially displacing periscopic spec- tacles that decreased the apparent separation had much more variable effects (Judge and Miles, 1985). Nonetheless, it seemed clear that the coupling between accommodation and vergence could be modified by experience, and the present study extends these observations to include the response AC/A ratio and the CA/C ratio.
While periscopic spectacles challenge the gain of the coupling between vergence and accommodation, wedge prisms introduce a fixed offset into the disparity input to the vergence control system which challenges the bias in the coupling. Thus, while the optical demand of periscopes is inversely related to viewing distance, that of prisms is largely independent of viewing dis- tance. Wedge prisms have been shown to alter the resting verg- ence during monocular viewing- known as the phoria-in many studies [see Alpem (1969) and Schor (1983) for reviews]. The present study also examined the effect of wearing wedge prisms on the response AC/A ratio and CA/C ratio. Preliminary ac- counts of some of these findings have appeared elsewhere (Miles and Judge, 1982; Miles, 1985).
Table 1. Required change in vergence (in meter-angles) per unit change in accommodation (in diopters) when viewing with laterally displacing periscopic spectacles: gAVa
Subject Age (years)
9 (mm) &v EL.4
SC 23 65 2.54 0.39 JG 20 61 2.64 0.38 KG 18 64 2.56 0.39 GH 25 63.5 2.51 0.39 JH 24 63.5 2.57 0.39 SJ 33 62 2.61 0.38 UK 22 64.5 2.55 0.39 ML 20 63.5 2.51 0.39 AP 26 62 2.61 0.38 JW 25 61 2.64 0.38
u The converse required change in accommodation (in diopters) per unit change in vergence (in meter-angles) is also indicated: g,,. h s, Interocular separation.
4. Base-in prisms, which deviate the light medially before it enters the eye. Those used in the present study each deviated the light -4” and were worn before both eyes, requiring the subject to decrease the amount of convergence by -8” to align both eyes on any given object, regardless of the viewing distance. Effects on the required accommo- dation were negligible.
Materials and Methods Vergence-induced accommodation (V-A) and accommodation-induced vergence (A-V) were measured in human subjects before and after 30 min of exposure to various optical devices that altered the required coupling between vergence and accommodation.
Adaptation procedure Subjects wore the spectacles for 30 min, during which time they were seated at a window and were instructed to transfer fixation every few seconds between objects at different distances, with the nearest generally at -30 cm and the most distant ranging from -50 to - 1000 m. After removing the spectacles, care was taken to avoid normal binocular
Optical devices experience, usually by patching one eye.
Four kinds of optical devices were used: 1. Laterally displacing periscopic spectacles, which increase the ap-
parent interocular separation. Those used in the present study displaced the line of sight of each eye laterally by 50 mm. Such spectacles have a negligible effect on distant viewing, but with near viewing increase the amount of convergence required to align both eyes on the object of regard -2.6 times, the exact amount depending on the subject’s inter- ocular separation. There is no effect on the amount of accommodation required to maintain a focused retinal image of distant objects and only a very minor effect (reduction) on that required to focus near ones. Ifs is the interocular separation and x is the lateral displacement of the line of sight of each eye, then the effective interocular separation becomes s + 2x and, when wearing these spectacles, the required change in vergence per unit change in accommodation is approximated by the expression (s + 2x)/s. This quantifies the optical challenge to any adap- tive mechanism regulating the AC/A, and the value of this entity for each subject is given in Table 1 (gAv). The challenge to any adaptive mechanism regulating the CA/C is simply the inverse function; these values are also listed in Table 1 (gVA). For further details, see Judge and Miles (1985) and Miles (1985).
2. Medially displacing periscopic spectacles, which decrease the ap- parent interocular separation. Those used in the present study displaced the lines of sight so that both were exactly superimposed on the midline (cyclopean configuration). Such spectacles require the wearer to main- tain zero convergence at all viewing distances in order to align both eyes on any given object. There is no effect on the amount of accom- modation required to maintain a focused retinal image ofdistant objects and only a very minor effect (reduction) on that required to focus near ones. For details, see Judge and Miles (1985) and Miles (1985).
3. Base-out prisms, which deviate the light laterally before it enters the eye. Those used in the present study each deviated the light -4” and were worn before both eyes, requiring the subject to increase the amount of convergence by -8” to align both eyes on any given object, regardless of the viewing distance. Effects on the required accommo- dation were negligible.
Measurement of V-A A haploscope was used to present identical fixation targets in Maxwell- ian view to the 2 eyes (Fig. 1). The left limb of the instrument could be rotated horizontally to induce convergence, and the right limb included a laser optometer to measure the accommodative state of the right eye.
The vergence stimulus. Black cross-hairs inscribed on clear acrylic (0,, 0, in Fig. 1) were transilluminated by light from a pinhole source (-0.5 mm) collimated by an achromatic planoconvex lens (B). The cross-hairs had a width of - 3 min of arc and the illuminated area was limited by the stop (S), whose image subtended 20” to the subject. Maxwellian viewing was used to minimize blurring of the retinal images due to the accommodative state of the eyes, the pinhole aperture being imaged in the pupillary plane [assumed to be 3.3 mm behind the pole of the cornea (Westheimer, 1972)] by a second identical lens (L). The left eye saw the image reflected by a front-silvered plane mirror (M), and this whole optical arrangement could be rotated horizontally about the center of rotation of the left eye (assumed to be - 15 mm behind the pole of the cornea) to induce disparity and thereby stimulate varying degrees of convergence. A protractor scale attached to this limb of the haploscope indicated the amount of rotation. The right eye saw the image through a beam-splitting cube, which allowed simultaneous view- ing of the speckle pattern in a laser optometer.
The cross-hairs were seen as a single fused image, and fixation dis- parity was assumed to be only a few minutes of arc at most (Carter, 1964) so that the vergence actually achieved (vergence response, Vd was assumed to approximate the vergence required (vergence stimulus, Vs).
Laser optometer. Accommodative responses (A,) ofthe right eye were assessed using a laser optometer with Badal lens viewing arranged as shown in Figure 1 (Hennessy and Leibowitz, 1972). The subject viewed an expanded laser beam reflected from the surface of a small rotating drum. The drum was painted matte white, had a diameter of 61 mm, and rotated about a vertical axis at a rate of -0.01 Hz. The subject saw a speckle pattern that appeared to move with or against the drum,

2578 Miles et al. - Vergence and Accommodation: Plasticity
-
Figure 1. Apparatus used to measure vergence accommodation. Pin- holes at A are imaged in the pupillary plane to minimize blur. Cross- hairs (O,, 0,) positioned in the collimated beam produced by lens B are seen through a Badal lens (L): Maxwellian view. The image seen by the left eye is reflected in a mirror (M), and the experimenter adjusts the vergence stimulus by rotating the whole assembly about C. The right eye sees the cross-hairs through a beam-splitting mixing cube (MC) superimposed on the speckle pattern in a laser optometer. The speckle pattern is imaged by a Badal lens (BL), with a stop (s) limiting its extent and an electromechanical shutter (S/z) limiting it in time. The subject adjusts the position of the drum with respect to the Badal lens to render the perceived speckle pattern stationary, allowing the subject’s accom- modative state to be estimated. HSM, Half-silvered mirror.
depending on the subject’s plane of focus, and he or she was required to adjust the position of the drum with respect to the Badal lens to render the pattern stationary. The plane of stationarity is known to be midway between the center of the drum and its surface (Charman, 1974). The Badal lens was positioned so that its second focal point coincided with the nodal point of the eye, which was assumed to be 7.3 mm behind the Dole of the cornea (Westheimer. 1972). After the subiect had positioned ihe drum so that the speckle was stationary, a virtual image of the speckle was seen at distance x’ from the subject’s nodal plane; this distance could be derived from Newton’s relation xx’ = f, where fis the focal length of the Badal lens and x is the distance between its first principal focus and the plane of the speckle. If we neglect the small (-6 mm) separation of nodal and principal planes, and express x, x’, and fin meters, then the accommodation of the eye, A, in diopters is l/x’ (= x/f). An advantage of the Badal lens arrangement is that A is a linear function of x.
The rotating drum was mounted on an optical bench with a millimeter scale to allow the investigator to record its position. The Badal lens had a power of 6.3 D, so that each millimeter on the scale represented -0.04 D of accommodation. The highest level of accommodation that could be determined reliably was -4.4 D. The speckle pattern was limited by the stop (S), and subtended -5” to the subject. An electromechanical shutter controlled by a waveform generator was used to restrict the subject’s viewing of the speckle to periods of % set, generally with intervening 1 set intervals; this reduced the likelihood that the speckle pattern itself would stimulate changes in accommodation.
Testingprocedure. The subject was carefully aligned with the optical paths in both limbs of the haploscope, and was held in position with the aid of a chin test and forehead supports. Testing began with the haploscope set for zero convergence and the drum at the far end of its scale (equivalent to -2 D accommodation). Using a bracketing pro- cedure involving successive positioning of the drum on either side of the null position by means of smaller and smaller displacements, the subject converged on that position at which the speckle pattern appeared to be stationary. After the subject indicated verbally that he or she achieved a best estimate of the null position, the experimenter recorded the position of the drum on the millimeter scale. The subject was then asked to make another determination, but only after first displacing the drum to the far end of the scale. After 4 such null determinations were carried out, the experimenter rotated the left arm of the haploscope to increase the desired convergence. Subjects were cautioned to maintain a single, fused image of the cross-hairs at all times. No determinations were made if the subject reported diplopia. Generally, a complete test involved 4 determinations at each of 10 desired vergence angles ranging from 0” to 18”. However, in some of the earlier experiments-especially
those with slower subjects-fewer desired vergence angles were used after adaptation. In addition, after spectacle adaptation, subjects were sometimes unable to fuse the 2 images at one or the other extreme of the range.
Subjects were given practice in order to develop their speed and reliability before proceeding with the experiment proper. Once confident of the task, they were urged to follow the same procedure every time, and most were able to complete a single test run, with 44 determinations, in 1 O-l 5 min.
Data analysis. To facilitate comparisons between subjects and to provide some estimate of the functional significance of V-A, the mea- sured accommodation, A,, was expressed in terms of the ideal accom- modation, A,, which is the accommodation needed to focus the eyes on that point in space where the 2 lines of sight intersect. The slope of the regression line relating A, to A, is a dimensionless parameter that was used as an index of the gain of V-A. Since the accommodative response was always measured in the right eye, which remained in the straight-ahead position, convergence resulted entirely from adduction ofthe left eye. Thus, A, (in diopters) was approximated by the expression (tan 0)/s, where 0 is the angle (in degrees) between the 2 lines of sight (assumed to approximate the protractor reading), and s is the interocular separation (in meters). [We ignore the small (- 13 mm) separation of principal plane and center of rotation of the eye.] Numerically, the V-A gain is approximately equivalent to the conventional CA/C ratio (mea- sured in diopters/meter-angle).
The basic method of analysis was a statistical comparison of slopes and intercepts from linear regression on data from subjects in the normal and adapted conditions. Linear regression can provide not only esti- mates of the slope and intercept of a line, but also the standard errors of those estimates (Brownlee, 1965). Using these values, 2 lines could be compared in several ways. First, the lines were tested for equality of slope with a t test (Brownlee, 1965). A separate test was performed to see if the intercepts were statistically different. In this test, the estimates of the intercepts and their standard errors were assumed to come from a population with a normal distribution. The number of degrees of freedom of that population was reduced by one, since both the slope and intercept were estimated from the data. A standard t test was used to test whether these estimates were significantly different (Freund, 1979).
Since adaptation can lead to changes in both gain and bias, it often can be difficult to interpret differences in the slopes and intercepts. A new variable, X,, the x-coordinate of the point of intersection of the 2 lines, was calculated to help assess the change in bias: X, = (b, - b,)l (a, - a,), where b,, b, are y-intercepts and a,, a, are slopes. If the 2 lines differ significantly in bias, then they will intersect at large values of X,. I f the 2 lines differ only in slope, they will intersect at small values of x,.
In all of these comparisons, it was assumed that the linear regression model provided a good fit to the data and that the slopes and intercepts provided a reasonable representation of the data. The validity of this assumption was assessed in 2 ways. First, the variation of “true group means about the line” was compared with the variation “within the groups,” where the groups were formed by the multiple A, values at each V, value. An F test was then used to assess linearity (Brownlee, 1965). The second method was to determine whether a higher-order polynomial model gave a significantly better fit to the data than the linear model. Since the information obtained from the data was limited, there had to be a tradeoff between reducing the residuals by increasing the order of the model and including parameters not observable from the data because of noise. The residuals test assessed whether including new parameters was justified when the amount of noise in the data was considered. Since higher-order terms in a polynomial expansion are orthogonal to lower-order terms, such a test of goodness of fit can be performed by looking at the correlation between the independent vari- able, V,, and the residuals from the linear regression (Candy, 1986). A statistic was formed by correlating the residuals with Vs2. (Note that linear regression removed all the correlations with V,.) I f this yields a correlation coefficient that is significantly different from 0 @ < 0.05; Bevington, 1969), a higher-order model would provide a better fit to the data; otherwise, the linear fit must be considered adequate. Thus, the first test (“the variance test”) asks whether a linear model accounts for all of the variations in the data, and the second (“test of residuals”) whether a nonlinear model would fit the data better. For the linear model to be rejected, both tests must fail, since if one test does not fail, the hypothesis of nonlinearity is rejected and the linear model may still be accepted.
The Journal of Neuroscience, August 1987, 7(8) 2579
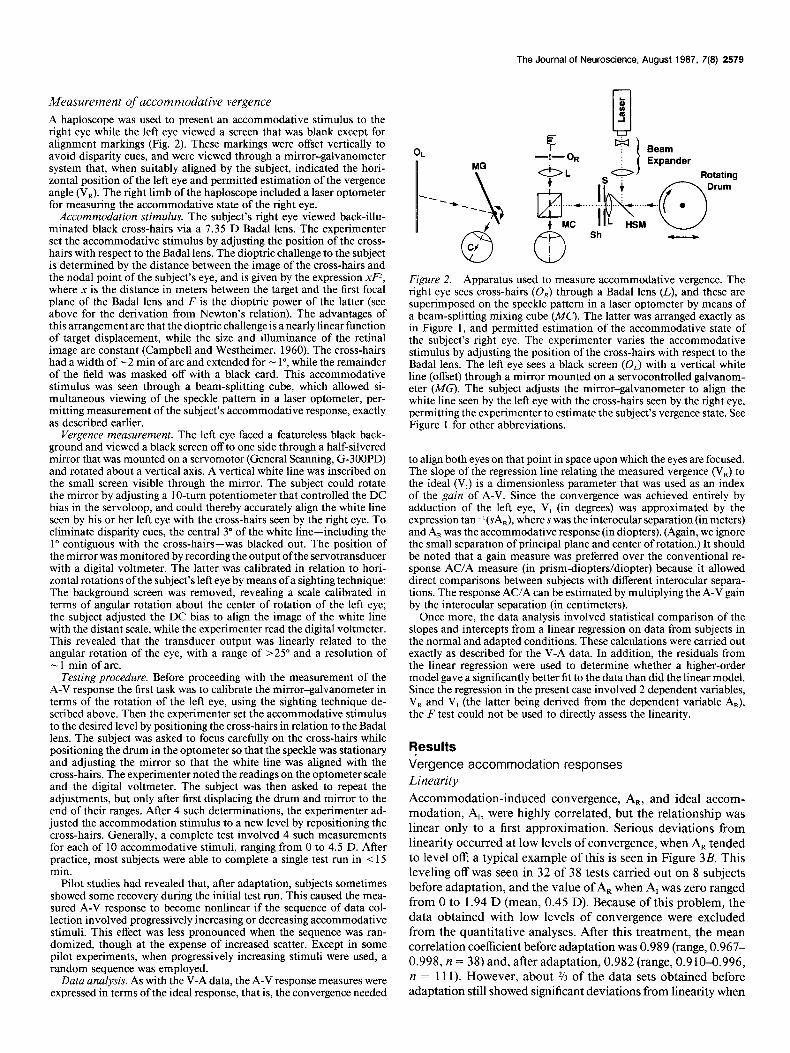
Measurement of accommodative vergence A haploscope was used to present an accommodative stimulus to the right eye while the left eye viewed a screen that was blank except for alignment markings (Fig. 2). These markings were offset vertically to avoid disparity cues, and were viewed through a mirror-galvanometer system that, when suitably aligned by the subject, indicated the hori- zontal position of the left eye and permitted estimation of the vergence angle (V,). The right limb of the haploscope included a laser optometer for measuring the accommodative state of the right eye.
Accommodation stimulus. The subject’s right eye viewed back-illu- minated black cross-hairs via a 7.35 D Badal lens. The experimenter set the accommodative stimulus by adjusting the position of the cross- hairs with respect to the Badal lens. The dioptric challenge to the subject is determined by the distance between the image of the cross-hairs and the nodal point of the subject’s eye, and is given by the expression xF”, where x is the distance in meters between the target and the first focal plane of the Badal lens and F is the dioptric power of the latter (see above for the derivation from Newton’s relation). The advantages of this arrangement are that the dioptric challenge is a nearly linear function of target displacement, while the size and illuminance of the retinal image are constant (Campbell and Westheimer, 1960). The cross-hairs had a width of - 2 min of arc and extended for - l”, while the remainder of the field was masked off with a black card. This accommodative stimulus was seen through a beam-splitting cube, which allowed si- multaneous viewing of the speckle pattern in a laser optometer, per- mitting measurement of the subject’s accommodative response, exactly as described earlier.
Vergence measurement. The left eye faced a featureless black back- ground and viewed a black screen off to one side through a half-silvered mirror that was mounted on a servomotor (General Scanning, G-300PD) and rotated about a vertical axis. A vertical white line was inscribed on the small screen visible through the mirror. The subject could rotate the mirror by adjusting a IO-turn potentiometer that controlled the DC bias in the servoloop, and could thereby accurately align the white line seen by his or her left eye with the cross-hairs seen by the right eye. To eliminate disparity cues, the central 3” of the white line-including the 1” contiguous with the cross-hairs-was blacked out. The position of the mirror was monitored by recording the output ofthe servotransducer with a digital voltmeter. The latter was calibrated in relation to hori- zontal rotations ofthe subject’s left eye by means ofa sighting technique: The background screen was removed, revealing a scale calibrated in terms of angular rotation about the center of rotation of the left eye; the subject adjusted the DC bias to align the image of the white line with the distant scale, while the experimenter read the digital voltmeter. This revealed that the transducer output was linearly related to the angular rotation of the eye, with a range of >25” and a resolution of - 1 min of arc.
Testing procedure. Before proceeding with the measurement of the A-V response the first task was to calibrate the mirror-galvanometer in terms of the rotation of the left eye, using the sighting technique de- scribed above. Then the experimenter set the accommodative stimulus to the desired level by positioning the cross-hairs in relation to the Badal lens. The subject was asked to focus carefully on the cross-hairs while positioning the drum in the optometer so that the speckle was stationary and adjusting the mirror so that the white line was aligned with the cross-hairs. The experimenter noted the readings on the optometer scale and the digital voltmeter. The subject was then asked to repeat the adjustments, but only after first displacing the drum and mirror to the end of their ranges. After 4 such determinations, the experimenter ad- justed the accommodation stimulus to a new level by repositioning the cross-hairs. Generally, a complete test involved 4 such measurements for each of 10 accommodative stimuli, ranging from 0 to 4.5 D. After practice, most subjects were able to complete a single test run in < 15 min.
Pilot studies had revealed that, after adaptation, subjects sometimes showed some recovery during the initial test run. This caused the mea- sured A-V response to become nonlinear if the sequence of data col- lection involved progressively increasing or decreasing accommodative stimuli. This effect was less pronounced when the sequence was ran- domized, though at the expense of increased scatter. Except in some pilot experiments, when progressively increasing stimuli were used, a random sequence was employed.
Data analysis. As with the V-A data, the A-V response measures were expressed in terms ofthe ideal response, that is, the convergence needed
01
La *.. i MC 6
Sh -
Figure 2. Apparatus used to measure accommodative vergence. The right eye sees cross-hairs (0,) through a Badal lens (L), and these are superimposed on the speckle pattern in a laser optometer by means of a beam-splitting mixing cube (MC). The latter was arranged exactly as in Figure 1, and permitted estimation of the accommodative state of the subject’s right eye. The experimenter varies the accommodative stimulus by adjusting the position of the cross-hairs with respect to the Badal lens. The left eye sees a black screen (0,) with a vertical white line (offset) through a mirror mounted on a servocontrolled galvanom- eter (MC). The subject adjusts the mirror-galvanometer to align the white line seen by the left eye with the cross-hairs seen by the right eye, permitting the experimenter to estimate the subject’s vergence state. See Figure 1 for other abbreviations.
to align both eyes on that point in space upon which the eyes are focused. The slope of the regression line relating the measured vergence (V,) to the ideal (V,) is a dimensionless parameter that was used as an index of the gain of A-V. Since the convergence was achieved entirely by adduction of the left eye, V, (in degrees) was approximated by the expression tan-l(sA,), where s was the interocular separation (in meters) and A, was the accommodative response (in diopters). (Again, we ignore the small separation of principal plane and center of rotation.) It should be noted that a gain measure was preferred over the conventional re- sponse AC/A measure (in prism-diopters/diopter) because it allowed direct comparisons between subjects with different interocular separa- tions. The response AC/A can be estimated by multiplying the A-V gain by the interocular separation (in centimeters).
Once more, the data analysis involved statistical comparison of the slopes and intercepts from a linear regression on data from subjects in the normal and adapted conditions. These calculations were carried out exactly as described for the V-A data. In addition, the residuals from the linear regression were used to determine whether a higher-order model gave a significantly better fit to the data than did the linear model. Since the regression in the present case involved 2 dependent variables, V, and V, (the latter being derived from the dependent variable A,), the F test could not be used to directly assess the linearity.
qesults
Vergence accommodation responses Linearity Accommodation-induced convergence, A,, and ideal accom- modation, A,, were highly correlated, but the relationship was linear only to a first approximation. Serious deviations from linearity occurred at low levels of convergence, when A, tended to level of, a typical example of this is seen in Figure 3B. This leveling off was seen in 32 of 38 tests carried out on 8 subjects before adaptation, and the value of A, when A, was zero ranged from 0 to 1.94 D (mean, 0.45 D). Because of this problem, the data obtained with low levels of convergence were excluded from the quantitative analyses. After this treatment, the mean correlation coefficient before adaptation was 0.989 (range, 0.967- 0.998, n = 38) and, after adaptation, 0.982 (range, 0.910X1.996, n = 111). However, about % of the data sets obtained before adaptation still showed significant deviations from linearity when

2580 Miles et al. l Vergence and Accommodation: Plasticity
Figure 3. Effect of wearing laterally displacing periscopic spectacles on the vergence accommodation responses of 2 subjects. Ordinates show accommo- dative response, as estimated with the laser optometer (A,). Abscissae show accommodative state that would be re- quired to focus the eyes on that point in space where the 2 lines of sight in- tersect (A,). The straight lines are least- square best fits; see Table 2 for the regression coefficients. In B, the regres- sion lines have been extrapolated be- yond the range used for the data fits (indicated by the dashed line). Error bars indicate HE when equal to or greater
JG 23 July
II I* laeal ,wcommodation (D) than 0.07 D.
assessed with the variance test: p > 0.05 in 26 of 38 tests (68%). The situation was very similar after subjects had adapted to the various optical devices: p > 0.05 in 17 of 24 tests (70%). None- theless, since the test of residuals indicated that, in all cases both before and after adaptation, a higher-order model did not pro- vide a better fit, the linear approximation was accepted as an adequate representation for our present purpose.
Preadaptation responses Prior to adaptation, the gain of the V-A response, as indicated by the slope of the linear regression for A, versus A,, ranged from 0.55 to 1.19 (mean, 0.89) with y-intercepts ranging from - 1.56 to 1.24 D (mean, -0.18 D). In the short term, V-A responses for a given subject showed very little variability. For example, for consecutive test runs separated by a few hours at most, the differences in the gains (expressed as a percentage of the first measure) ranged from -8.4 to 9. I%, and the changes in the y-intercepts ranged from -0.21 to 0.28 D (n = 13 pairs). The mean absolute differences in the gains and y-intercepts were only 4.3% f 3.4 (SD) and 0.13 D f 0.09 (SD), respectively. However, in the long term, subjects could show considerable variability. The 4 subjects from whom data were obtained on more than 1 d showed gains ranging from 0.62 to 1.14 (subject SC), 0.65 to 0.94 (JG), 0.64 to 1.07 (KG), and 0.55 to 0.85 (JH).
Efects of laterally displacing periscopes
At first, subjects reported diplopia and/or blurring when objects nearer than -2 m were viewed through the laterally displacing periscopic spectacles. However, by the end of the 30 min ad- aptation period, all reported that they were able to obtain single, sharp images over the full binocular range of the spectacles (viewing distances, -0.3 m and beyond). In 12 experiments on 8 subjects, linear regression revealed that the gain of the V-A response decreased significantly in all cases. Representative data obtained before and after adaptation from 2 subjects are shown in Figure 3. Note that in Figure 3B there is a significant down- ward shift in the whole curve, as well as a decrease in slope- a common finding. The data from the regression analyses for all 12 experiments are summarized in Table 2. The decreases in slope, i.e., gain, ranged from 17 to 55%, averaging 37%. Significant downward shifts, such as that seen in Figure 3B, were evident in 7 of 12 experiments, where the mean change in the y-intercepts was -0.7 1 D (range, -0.41 to - 1.29 D), and values for X, were invariably negative (range, - 1.3 to -6.7 D). In 2 of 12 experiments, there were significant increases in the y in-
tercepts (upward shifts of 1.13 and 0.35 D), but values for X, were within the normal operating range (2.4 and 0.9 D). Thus, in these 2 cases, adaptation resulted in a clockwise rotation of the response curves. In the remaining 3 experiments, there were no significant changes in the y-intercepts and values for X, were close to zero, indicating a pure downward tilting of the response curves. Figure 3A shows an example of this type of response, which approximates a pure gain change. None of the changes in gain were significantly correlated with either the gain prior to adaptation (r = -0.52) or the change in y-intercept (r = -0.30).
Following adaptation, each subject’s left eye was patched to prevent binocular experience, and their V-A responses were tested for up to 4 hr (Fig. 4). All 6 subjects who were monitored for 30 min or more showed some recovery in gain, which pro- ceeded roughly linearly over time in 4 of the 5 subjects for whom 3 or more measures were obtained. (The only clear exception to this was subject JW, whose recovery was quite irregular.) The average rate of recovery, based on the slope of the regression line fitted to the data in Figure 4A, was 5.4%/hr. Four of the subjects whose response curves had shown significant vertical shifts (bias) with adaptation were among those whose recovery was monitored. Recovery of the bias in these cases, as indicated by the y-intercept, was idiosyncratic, with one being linear (SC) and at least one other being roughly exponential (KG; see Fig. 4B).
Efects of cyclopean spectacles
As with the laterally displacing periscopic spectacles, subjects who wore the cyclopean spectacles initially reported diplopia and/or blurring with near viewing, with an effective near point of -2 m. By the end of the 30 min adaptation period, subjects had decreased their near point down to -0.5 m. However, the effects of cyclopean spectacles on the gain and bias of the V-A responses were relatively minor and inconsistent: In 4 experi- ments carried out on 3 subjects, statistically significant changes in gain were seen in all cases, but these changes were invariably small, ranging from 10 to -2 1% (mean, - 12%). Significant changes in bias, as indicated by the y-intercept, were also evident in 3 of the experiments, but only averaged 0.32 D (range, 1.14 to -0.32 D). Further details are given in Table 2.
Effects of base-out prisms
The effect of wearing base-out prisms was examined in 3 ex- periments on 2 subjects. Both subjects reported some initial

The Journal of Neuroscience, August 1987, 7(8) 2581
Table 2. Effect of various optical devices and “exercise” on V-A responses
Slope Intercept
% Change Intersect Subject Date Before (SE) After (SE) @) Before (SE) After (SE) Change (p) (4)
Laterally displacing periscopes KG 15 July
17 July 22 July 27 July
SC 16 July JG 23 July ML 24 July JH 15 Dec.
18 Dec. AP 15 Dec. GH 19 Dec. JW 24 Dec.
Means Cyclopean
KG 23 July 30 July
JG 3 Aug. SC 7 Aug.
Means Base-out prisms
KG 24 July 29 July
JG 4 Aug. Means
Base-in prisms KG 17 July
28 July JG 19 Aug.
Means Exercise
JG 28 July KG 31 July
Means
0.90 (0.024) 0.64 (0.012) 0.79 (0.013) 1.02 (0.013) 1.14 (0.041) 0.68 (0.013) 0.88 (0.035) 0.85 (0.027) 0.55 (0.019) 0.80 (0.030) 1.18 (0.044) 0.80 (0.035) 0.85 (0.026)
0.64 (0.021) 0.53 (0.025) 0.56 (0.016) 0.65 (0.016) 0.66 (0.038) 0.38 (0.011) 0.64 (0.043) 0.47 (0.031) 0.41 (0.024) 0.46 (0.024) 0.53 (0.035) 0.39 (0.025) 0.53 (0.026)
-29 (0.001) - 17 (0.001) -29 (0.001) -36 (0.001) -42 (0.001) -44 (0.00 1) -27 (0.001) -45 (0.001) -25 (0.001) -43 (0.001) -55 (0.001) -51 (0.001) -37
-0.20 (0.085) 0.07 (0.040) 0.21 (0.042)
-0.18 (0.039) -1.40 (0.145)
0.30 (0.042) -0.29 (0.134)
0.28 (0.073) 0.60 (0.054) 1.24 (0.052)
-0.32 (0.103) 0.43 (0.086) 0.06 (0.075)
-0.90 (0.075) -0.69 (0.084) -0.38 (0.051) -0.87 (0.053) -0.27 (0.126)
0.28 (0.034) -0.41 (0.165)
0.63 (0.083) 0.19 (0.073)
-0.05 (0.069) -0.39 (0.107) -0.09 (0.072) -0.25 (0.083)
-0.70 (0.0001) -0.76 (0.0001) -0.59 (0.0001) -0.69 (0.0001)
1.13 (0.0001) -0.02 (NS) -0.12 (NS)
0.35 (<O.Ol) -0.41 (<0.0001) -1.29 (<O.OOOl) -0.07 (NS) -0.52 (<O.OOOl) -0.31
-2.7 -6.7 -2.6 -1.9
2.4 c-o.1
-0.5 0.9
-2.8 -3.7 -0.1 -1.3
0.86 (0.015) 0.73 (0.016) -15 (0.001) 1.07 (0.025) 0.85 (0.013) -21 (0.001) 0.81 (0.015) 0.89 (0.024) 10 (0.001) 0.66 (0.028) 0.53 (0.05 1) -20 (0.001) 0.85 (0.021) 0.75 (0.026) -12
0.01 (0.053) 0.00 (0.053) -0.01 (NS) -0.72 (0.077) -0.26 (0.044) 0.46 (<O.OOOl) -0.34 (0.054) -0.66 (0.086) -0.32 (<O.OOl)
0.88 (0.099) 2.02 (0.162) 1.14 (<0.0001) -0.04 (0.07 1) 0.28 (0.086) 0.32
-0.1 2.1 4.0 8.4
1.06 (0.027) 0.64 (0.022) -40 (<O.OOl) 0.97 (0.018) 0.87 (0.035) - 10 (0.01) 0.80 (0.020) 0.50 (0.025) -38 (<O.OOl) 0.94 (0.022) 0.67 (0.027) -29
-0.60 (0.082) -1.12 (0.073) -0.52 (~0.01) -0.54 (0.060) -2.06 (0.142) - 1.52 (<O.OOOl) -0.69 (0.076) -0.77 (0.115) -0.08 (NS) -0.61 (0.073) -1.32 (0.110) -0.71
-1.2 -15.9
-0.3
0.79 (0.023) 0.83 (0.023) 5 (cO.05) 0.97 (0.017) 0.88 (0.023) -9 (0.001) 0.85 (0.030) 0.86 (0.029) 1 (NV 0.87 (0.023) 0.86 (0.025) -1
-0.57 (0.084) -0.20 (0.082) 0.37 (<0.0001) -0.29 (0.049) -0.07 (0.066) 0.22 (cO.01) -0.16 (0.098) 0.04 (0.094) 0.20 (NS) -0.34 (0.077) -0.08 (0.08 1) 0.26
-8.4 2.4
-34.3
0.94 (0.0 13) 0.71 (0.014) -24 (0.001) 1.05 (0.025) 0.82 (0.012) -22 (0.001) 1.00 (0.019) 0.77 (0.013) -23
-0.36 (0.043) -0.20 (0.046) 0.16 (~0.01) -0.42 (0.072) -0.35 (0.038) 0.07 (NS) -0.39 (0.058) -0.28 (0.042) 0.12
0.7 0.3
Regression coefficients for A, versus A,; slopes are dimensionless, while intercepts and intersects (X,) are in diopters.
difficulty in obtaining single, sharp images of objects with these spectacles, but this problem apparently cleared up within a few minutes. After 30 min of exposure to the prisms, V-A response curves showed a downward shift that was particularly evident with the higher-vergence stimuli; at the lower end of the verg- ence stimulus range, accommodation tended to level off at some minimum. These effects are evident in Figure 5, which shows response curves before and after adaptation for both subjects. Linear regression applied to the data in this upper stimulus range revealed a statistically significant decrease in the slope in all 3 experiments, accompanied by a negative shift in the y-intercept in 2 instances. In the latter 2 cases, X, had negative values. The data from these regression plots are summarized in Table 2. Clearly, the response to base-out prisms resembled that to lat- erally displacing periscopes, though, on average, the prisms had a greater effect on the bias while the periscopes had a greater influence on the gain.
Following adaptation, the subjects’ left eyes were patched to prevent binocular experience, and their V-A responses were tested at intervals for up to 4% hr (Fig. 6). The recovery in gain
in the 2 cases that showed appreciable adaptation was somewhat irregular. An estimate of the average rate of recovery was ob- tained from the slope of the regression line fitted to these data: 3.5%/hr. So far as the recovery of the intercept was concerned, the only case in which the downward shift in the curves resulted in an appreciable negative change in the intercept showed an initial phase of rapid recovery, followed by a more gradual one (triangles in Fig. 6).
Effects of base-in prisms
The effect of wearing base-in prisms was examined in 3 exper- iments on 2 subjects. Both subjects reported difficulty in ob- taining single, sharp images of distant objects with these spec- tacles. At first, the far point was only a meter or so away, and this moved out to a few meters during the 30 min adaptation period. The effects of base-in prisms on V-A responses were very minor, with negligible changes in the slope and small, upward shifts in the intercept in 1 of the 2 subjects. The data from the regression plots are summarized in Table 2.

2582 Miles et al. * Vergence and Accommodation: Plasticity
A. Change in Slope
. . . . . . . . . . . . . . . . . . . . . . . . . . . . . . . . . . . . . . . . . . . . . . . ...
-0
B. Change in Intercept
Time (minutes)
Figure 4. Recovery of vergence accommodation responses after ex- posure to laterally displacing periscopic spectacles (monocular viewing). A, Recovery of gain, as indicated by the slope of the regression line for A, versus A,, expressed as a percentage of the preadaptation gain. B, Recovery of bias, as indicated by the y-intercept of the linear regression for A, versus A,. Cross-hatching indicates the adaptation period.
Efects of exercise alone Since the subject was required to repeatedly transfer fixation between objects at various viewing distances throughout the adaptation period, it is possible that performing such exercises might have affected V-A responses even when the subject was not wearing any of the special spectacles. This control was only
carried out on 2 subjects-those for whom the most data were available-and both showed very similar effects. Linear regres- sion revealed a moderate decrease in gain (22 and 24%), with a negligible change in bias; for details see Figure 7 and Table 2. The recovery in gain during monocular viewing after the period of exercise was quite rapid, being complete within 30 min in both cases (Fig. 8).
Accommodative vergence responses Linearity Accommodative vergence, V,, and ideal vergence, V,, were highly correlated: the mean correlation coefficient before adaptation was 0.976 (range, 0.941-0.994, n = 31) and after was 0.980 (range, 0.943-0.996, n = 64). However, since V, and V, were both dependent variables, it was not possible to use the analysis of variance to test directly for nonlinearities in their interrela- tionship. Nonetheless, the test of residuals indicated that in all cases (before and after adaptation), a higher-order model did not provide a better fit; hence the linear approximation was accepted as an adequate representation for our present purpose.
Preadaptation responses
In 31 tests on 7 subjects, the gain of the A-V response, as indicated by the slope of the linear regression for V, versus V,, ranged from 0.48 to 1.35 (mean, 0.94), with intercepts ranging from - 1.19” to 2.47” (mean, 0.52”). It was not usual to run more than one preadaptation test. However, in the 8 experiments where 2 such tests were performed, the differences in the 2 measures of gain (expressed as percentages of the first measure) ranged only from -9.4% to 4.5%, while the differences in the y-intercepts ranged only from - 1.06” to 0.44”. The mean ab- solute differences in these gains and y-intercepts were 3.2% f 3.1 (SD) and 0.46” f 0.34” (SD), respectively. Thus, in the short term (a few hours at most), A-V responses for a given subject showed little variability. In the long term this was not so: The 5 subjects from whom data were obtained on more than 1 d showed gains ranging from 0.78 to 0.90 (subject JH), 0.79 to 1.35(JG),0.65to0.99(SJ),0.48to0.89(GH),and0.86to1.12 (JW.
Efects of laterally displacing periscopes
Linear regression revealed that 30 min of exposure to the lat- erally displacing periscopic spectacles was sufficient to increase the gain of the A-V response significantly in 7 of 8 experiments
Figure 5. Effect of wearing base-out prism spectacles on the vergence ac- commodation responses of 2 subjects. Ordinates, abscissae, error bars, and other details as for Figure 3. Note that after adaptation, neither subject was able to fuse the zero vergence targets in the test apparatus; subject JG also could not fuse the vergence targets calling for an ideal accommodation of 0.58 D. Ideal Act
1
/
.d __.._ & _,_. 2 f) :..:::: ___: ::..,::::::::::: . . . . . . . . . . . ..~ _.. ,_.. ,___.. /’ _. _/ .:::... JG 4 Aug
-12 0 1 2 3 4 5 6
ommodation (D)

The Journal of Neuroscience, August 1987, 7W 2583
A. Change in Slope
. .
0
B. Change in Intercept
Time (minutes)
Figure 6. Recovery of vergence accommodation responses after ex- posure to base-out prism spectacles (monocular viewing). Details as in Figure 4.
carried out on 7 subjects. Representative data from 2 subjects are shown in Figure 9, and the regression coefficients for all data are summarized in Table 3. The increases in gain ranged from 59 to 122% (average, 77%), and changes in the y-intercept were quite small in 5 of 7 cases. In the 2 remaining cases (and also in the experiment that showed no significant gain change), there were upward shifts of the curves, with significant changes in the y-intercepts and values for X, that were well outside the normal operating range (see the data for subjects SJ, GH, and JH in Table 3) (data for JH are also shown in Fig. 9A). The changes
Change in Slope
I.......*., 100 200
Time (minutes) Figure 8. Recovery of vergence accommodation gain after exercise (monocular viewing). Gain, as indicated by the slope of the regression line for A, versus A,, expressed as a percentage of the preexercise gain. Cross-hatching indicates the period of exercise.
in gain were not significantly correlated with either the gain prior to adaptation (r = -0.16) or the change in y-intercept (r = -0.43).
These effects of periscopic spectacles on A-V responses are similar to those previously reported for the stimulus AC/A (Judge and Miles, 1985). In fact, the increases in gain are somewhat higher in the present study. One possible reason for this differ- ence might have been that the spectacle adaptation caused a decrease in the slope of the stimulus-response relationship for accommodation. However, this seems unlikely: in the present study, the slope of the regression line for A, versus A, generally showed relatively minor changes with adaptation, actually in- creasing, on average, by 5.3% (range, -2.2-16.3%). Represen- tative data can be seen in Figure 10, which shows the stimulus- response relationship for accommodation for the experiments illustrated in Figure 9.
Three of the subjects who showed significant increases in A-V gain wore a patch over one eye after adaptation and the time course of their recovery was monitored. In all 3 cases, gain showed an initial phase of rapid recovery (average slope, about -8O%/hr), after which recovery was more gradual (Fig. 11). Two of the subjects were monitored until they were fully re- covered, which took less than 3Y2 hr for both gain and bias.
A 0
c 6
Figure 7. Effect of exercise (without any special spectacles) on the vergence accommodation responses of 2 sub- jects. Ordinates, abscissae, error bars, and other details as for Figure 3. Ideal Accommodation (D)

2584 Miles et al. * Vergence and Accommodation: Plasticity
Table 3. Effect of various optical devices and “exercise” on A-V responses
Subject Date
Slope
Before (SE) After (SE) % Change (p)
Intercept
Before (SE) After (SE) Change (p) Intersect
(X)
Periscopes
SJ 20 Nov.
GH 21 Nov.
AP 21 Nov.
JW 26 Nov.
JW 19 Jan.
JH 12 Jan.
UK 1 Dec.
JG 8 Jan.
Means Means
Cyclopean
JH 14 Jan.
*JH 15 Jan.
JG 15 Jan.
*JW 5 Feb.
Means
Base-out prisms
GH 5 Dec.
JH 7 Jan.
JW 21 Jan.
JG 9 Jan.
JG 12 Feb.
Means
Base-in prisms
JH 8 Jan.
JW 28 Jan.
JG 29 Jan.
Means
Exercise
SJ 5 Dec.
JH 8 Jan.
JG 19 Feb.
Means
0.99 (0.044) 0.97 (0.037) -2 (NS) -0.54 (0.363) 3.68 (0.306) 4.22 (<O.OOOl)
0.48 (0.021) 1.06 (0.030) 122 (0.001) 2.47 (0.148) 5.24 (0.211) 2.77 (<O.OOOl)
1.09 (0.070) 2.26 (0.136) 107 (0.001) 2.20 (0.266) 3.40 (0.535) 1.20 (NS)
1.07 (0.038) 2.36 (0.060) 121 (0.001) -0.10 (0.289) -2.07 (0.450) -1.97 (cO.05)
1.07 (0.058) 1.78 (0.074) 66 (0.001) -0.38 (0.434) - 1.58 (0.569) - 1.20 (NS)
0.90 (0.028) 1.43 (0.036) 59 (0.001) 1.32 (0.201) 4.97 (0.267) 3.65 (<O.OOOl)
0.64 (0.030) 1.02 (0.026) 59 (0.001) -1.18 (0.248) - 1.74 (0.239) -0.56 (NS)
0.91 (0.019) 1.64 (0.034) 80 (0.00 1) 0.45 (0.164) -0.78 (0.299) - 1.23 (<O.OOl)
0.89 (0.039) 1.57 (0.054) 77 0.53 (0.264) 1.39 (0.360) 0.86
308.7
-4.8
-1.0
1.5
1.7
-7.0
1.5
1.7
-21.0
-34.9
10.8
-22.4
30.2
-36.7
-14.3
-17.2
237.8
17.9
189.7
-355.8
13.4
6.4
-51.4
0.90 (0.031) 0.86 (0.030) -4 (NS) 1.88 (0.237) 1.04 (0.225) -0.84 (~0.05)
0.85 (0.030) 1 .OO (0.029) 18 (~0.01) 1.75 (0.219) 6.73 (0.225) 4.98 (<O.OOOl)
0.88 (0.029) 1.05 (0.024) 19 (0.001) 1.27 (0.242) -0.52 (0.204) -1.79 (10.0001)
1.12 (0.037) 1.24 (0.044) 11 (NS) -0.18 (0.285) 2.40 (0.355) 2.58 (<O.OOOl)
0.94 (0.032) 1.04 (0.032) 11 1.18 (0.246) 2.41 (0.252) 1.23
0.89 (0.022) 0.58 (0.026) -35 (0.001) 0.14 (0.174) 9.50 (0.199) 9.36 (<O.OOO 1)
0.80 (0.015) 1 .OO (0.028) 25 (0.00 1) 0.98 (0.109) 8.32 (0.203) 7.34 (10.0001)
0.87 (0.027) 1.25 (0.048) 44 (0.001) -0.31 (0.224) 5.08 (0.411) 5.39 (<0.0001)
1.13 (0.025) 1.38 (0.027) 22 (0.001) -0.62 (0.211) 3.72 (0.207) 4.34 (<0.0001)
1.16 (0.042) 1.13 (0.042) -3 (NS) -1.19 (0.361) 4.90 (0.367) 6.09 (<O.OOOl)
0.97 (0.026) 1.07 (0.034) 11 -0.20 (0.216) 6.30 (0.277) 6.50
0.86 (0.023) 1 .OO (0.024) 16 (0.001) 1.49 (0.171) -0.96 (0.183) -2.45 (<O.OOOl)
1.03 (0.054) 1.05 (0.043) 2 (NS) - 1.11 (0.446) -4.70 (0.348) -3.59 (<0.0001)
1.35 (0.058) 1.33 (0.066) - 1 (NS) 0.5 1 (0.309) -8.01 (0.390) -8.52 (<O.OOOl)
1.08 (0.045) 1.13 (0.044) 6 0.30 (0.309) -4.56 (0.307) -4.85
0.65 (0.049) 0.79 (0.054) 22 (NS) 1.67 (0.374) -0.21 (0.412) -1.88 (cO.01)
0.78 (0.018) 0.89 (0.021) 14 (0.001) 1.65 (0.141) 0.91 (0.158) -0.74 (10.01)
0.98 (0.041) 0.96 (0.039) -2 (NS) 0.08 (0.348) - 1.04 (0.336) -1.12 (cO.05)
0.80 (0.036) 0.88 (0.038) 11 1.13 (0.288) -0.11 (0.302) -1.25
Regression coefficients for V, versus V,; slopes are dimensionless, while intercepts and intersects (A’,) are in degrees. *Combined with base-out prism.
Figure 9. Effect of laterally displacing . periscopic spectacles on the accom- modative vergence responses of 2 sub- jects. Ordinates show vergence re- sponse, as estimated from the alignment of the mirror-galvanometer (V,). Ab- scissae show vergence state that would be required to align both eyes on that point in space where the right eye is focused (V,). The straight lines are least- squares best fits; see Table 3 for regres- sion coefficients. Error bars indicate &SE when equal to or greater than 0.25”. Ideal Vergence (degrees)

The Journal of Neuroscience, August 1987, 7(8) 2585
-; A , g 4-
,..’ . ..’ B /
; :
,/ 4-
,/'
5 :
:: 3:
I? : . ..' c ; ,/
Figure 10. Effect of laterally displac- ing periscopic spectacles on the accom- modation stimulus-response relation- ship of 2 subjects. The dotted line has a slone of unity. Error bars, tSE when
Accommodation Stimulus (D) equai to or greater than 0.06 D.
Efects of cyclopean spectacles
The 2 subjects who wore the cyclopean spectacles for 30 min showed little effect. Linear regression applied to V, versus V, revealed only minor changes in gain and bias: a small negative shift in y-intercept (-0.84” and - 1.79”), and a small increase in gain (19%) in one subject (JG) (see Table 3 for details).
As mentioned earlier, subjects had difficulty in obtaining sin- gle, sharp images when viewing nearby objects through the cy- clopean spectacles and were never able to overcome this prob- lem entirely. In 2 further adaptation experiments, base-out prisms were added to the cyclopean spectacles to improve the subject’s ability to fuse nearby objects. (Note that these data are tagged with an asterisk in Table 3.) The only really significant effect of adding the prisms was to cause an upward shift in the curves, which was clearly reflected in an increase in the y-intercept (4.98” and 2.58”). Gain was still little affected, however, showing only a small change (increase) in 1 of the 2 subjects (18%). Values for X, were substantial (and negative).
Effects of base-out prisms
In 5 experiments on 4 subjects, base-out prisms invariably caused appreciable upward shifts in the A-V response curves. Figure 12 shows representative data from 2 subjects. Linear regression applied to V, versus V, revealed increases in the y-intercept averaging 6.5” (range, 4.34”-9.36”), while the intersections, X,, were all well outside the normal operating range (see Table 3 for details). There were also effects on gain, but these were more variable, with increases ranging from 22 to 44% in 3 experi- ments, and a decrease of 35% in a fourth experiment. Note also that subject JG showed a 22% increase in gain and a 4.3” increase in y-intercept after wearing base-out prisms for the first time, but on a second occasion, no significant gain changes were seen and the y-intercept increased by 6.1”.
Recovery during monocular viewing was monitored in 4 ex- periments, the y-intercept decaying back towards its preadap- tation level with a roughly exponential time course (Fig. 13B). Recovery of gain was quite variable, with one subject (JG) ac- tually drifting away from his preadaptation level and a second (JH) showing little change in a period of 7 hr (see Fig. 13A).
Efects of base-in prisms
In 3 experiments on 3 subjects, the use of base-in prisms resulted in downward shifts in the A-V response curves, with only minor changes in slope. Linear regression applied to V, versus V, re-
vealed decreases in the y-intercept that averaged 4.85”, and intersects X, that were well outside the normal operating range. A change in gain was seen in only one experiment: a modest increase (16%) in subject JH. Further details can be seen in Table 3.
A. Change in Slope
“WA B. Change in Intercept
A cn -. : ‘rn &
‘-----
+ .
V
Time (minutes)
Figure Il. Recovery of accommodative vergence responses after ex- posure to laterally displacing periscopic spectacles (monocular viewing). A, Recovery of gain, as indicated by the slope of the regression line for V, versus V,, expressed as a percentage of the preadaptation gain. B, Recovery of bias, as indicated by the y-intercept of the linear regression for V, versus V,. Cross-hatching indicates the adaptation period.

2588 Miles et al. - Vergence and Accommodation: Plasticity
Figure 12. Effect of base-out prism spectacles on the accommodative ver- gence responses of 2 subjects. Ordi- nates, abscissae, and other details as in Figure 9.
Eflects of exercise alone
The effect of repeatedly transferring fixation between objects at various viewing distances when not wearing any special spec- tacles was examined in 3 subjects. Thirty minutes of such ex- ercise had only minor effects on A-V response curves. Linear regression revealed small negative changes in the y-intercepts (mean change, - 1.25”) but only 1 subject showed a significant change in gain and that was quite small (14% increase). These data are summarized in Table 3.
Discussion
The objective of the present study was to examine the hypothesis that the gain and bias of the neural cross-couplings between the accommodation and vergence control systems are subject to independent adaptive control. To this end, experiments ex- amined the effects of wearing medially and laterally displacing periscopes, which alter the slope (or gain) of the desired rela- tionship between accommodation and vergence, and of wearing base-in and base-out prisms, which alter the desired bias in this relationship. Laterally displacing periscopes led to decreases and increases in the gains of V-A and A-V responses, respectively, exactly in accordance with the hypothesis. On the other hand, medially displacing periscopes (cyclopean spectacles) were al- most totally ineffective. Base-out prisms generally led to appro- priate vertical shifts-that is, to changes in bias-of both V-A and A-V response curves, while base-in prisms were only ef- fective in shifting the A-V curves.
These findings imply that the neural cross-links between verg- ence and accommodation are subject to adaptive regulation, but that the underlying mechanisms have marked asymmetries. It is possible, of course, that the 30 min adaptation period used in the present study was not always adequate and that adaptation would have been more universal with longer exposure times. Another possible factor is rate of recovery: It is known that the recovery following adaptation to wedge prisms can be very rap- id, and in some cases is complete within a matter of seconds (Schor, 1979a), which would be much too soon for the tech- niques used in the present study to detect the original change.
Ideal Vergence (degrees)
Rapid recovery might explain why subjects reported marked improvements in their ability to see clearly with the cyclopean spectacles, while measurements of their V-A and A-V responses failed to show any evidence of significant adaptation. Clearly,
A. Change in Slope
vh B. Change in Intercept
Time (minutes)
Figure 13. Recovery of accommodative vergence responses after ex- posure to base-out prism spectacles (monocular viewing). Details as in Figure 11.

The Journal of Neuroscience, August 1987, 7(8) 2587
ST+ 1
Motor Ciliary m.
Controller A + t
lens Accommodation
Target Distance
Motor Controller
- Extraocular m. I _ * + eye Vergence
Figure 14. Block diagram of the vergence and accommodation control systems showing the neural cross-links that are assumed to underlie vergence accommodation (via gain element G,,) and accommodative vergence (via gain element G,,). Leaky integrators have been incorporated into the forward naths of both controllers. their transfer functions beine shown in Laplace notation, where s is the Laplace complex frequency (after Schor et al., 1986).
the present negative findings cannot be viewed as strong evi- dence against the existence of an adaptive mechanism. How- ever, another feature of the data was that gain changes were often accompanied by changes in bias, and vice versa: Laterally displacing periscopes often caused vertical shifts similar to those seen with base-out prisms (but see subject GH in Table 2 for an exception), while the latter could affect the slope, generally in a manner resembling the effect of laterally displacing peri- scopes. These secondary effects of periscopes and prisms were less pronounced than the primary effects, but nonetheless in- dicate a certain lack of specificity in the sensing of gain and bias errors.
Further discussion of such complexities necessitates more de- tailed consideration of the structural organization of the system. Figure 14 is a block diagram of the vergence and accommo- dation control systems, with cross-links mediating V-A and A-V responses. Our hypothesis is that the gains of these cross-links, G,, and G,,, are subject to adaptive regulation and mediate the gain changes associated with exposure to periscopic spectacles. Following the suggestion of Schor and his colleagues, we placed leaky integrators with long time constants in the forward paths of both the vergence and accommodation control systems to mediate the changes in bias associated with adaptation to prisms and lenses (Schor, 1979b, 1980; Schor and Kotulak, 1986a, b; Schor et al., 1986). To the extent that laterally displacing peri- scopic spectacles lead to an increase in the amount of conver- gence associated with a given level of accommodation when viewing all but the most distant targets, such spectacles might be expected to alter the charge on these integrators and hence change the bias in the measured A-V and V-A responses. It should also be realized that vertical shifts of the A-V and V-A response curves can reduce the optical challenge provided by laterally displacing periscopes, especially if the visual experience during the adaptation period is confined to a small range of viewing distances; when so restricted, it would be sufficient to
simply shift the response curves vertically instead of rotating them. In this event, the change in bias would obscure the need for a change in gain. Such factors might be responsible for the failure of others to get reliable changes in the AC/A ratio with the laterally displacing periscopic spectacles (Fisher and Ciuf- freda, 1985). This problem was recognized in an earlier study (Judge and Miles, 1985), and particular care was taken in the present one to exercise the system over the full range of viewing distances permitted by the spectacles. Nonetheless, changes in bias are known to occur so rapidly-appreciable changes require only a minute or two (Schor, 1979a)-that it would seem to be difficult to avoid them with periscopic spectacles.
A major deficiency in the model in Figure 14 is the lack of any mechanism for sensing gain errors. Without such a mech- anism, it is not possible to explain the gain changes resulting from exposure to wedge prisms. However, the system’s inability to distinguish completely between gain errors and bias errors does not in itself foreclose the possibility of separate adaptive mechanisms regulating gain and bias. In the above discussion, the changes in the gain of the V-A and A-V responses were assumed to result from alterations in the gain of some modifiable elements in the neural cross-links between the vergence and accommodation control systems. But any gain change down- stream of the cross-links would also affect the measured gain of the V-A and A-V responses; for example, any change in the sensitivity of the extrinsic or intrinsic ocular muscles to neural input. Thus, the decreases in V-A gain and increases in A-V gain associated with adaptation to laterally displacing periscopes (and sometimes to base-out prisms) might result simply from fatigue of the ciliary muscles due to the associated exercise. On the other hand, the failure to find such changes with base-in prisms and cyclopean spectacles suggests that this is an unlikely explanation. In addition, control exercises without spectacles generally resulted in only modest, transient changes in gain. However, it might still be argued that the exercise associated

2588 Miles et al. - Vergence and Accommodation: Plasticity
with laterally displacing periscopes and base-out prisms is in some (unknown) way more stressful to the ciliary muscles than that in any of the other situations. There is some suggestion that the recovery of V-A gain proceeded more slowly than the re- covery of A-V gain, especially during the first hour or so (com- pare Figs. 4A and 1 lA), which could not be accounted for by a single factor, such as fatigue of the accommodative motor ap- paratus. The differing rates of recovery here may result from the fact that in one case the recovery is from a low gain (V-A), while in the other it is from a high gain (A-V). Interestingly, recovery of the vestibulo-ocular reflex gain proceeds much more rapidly from a high value than from a low one (Miles and Eighmy, 1980).
A cause for concern in the present study is the considerable long-term variability in the gain of the V-A and A-V responses of any given subject. The consensus in the literature is that the response AC/A ratio is relatively stable over time (Flom, 1960b). There have been no systematic studies on the long-term stability of V-A responses, but the original observations of Fincham and Walton (1957) suggested that variations over time were very gradual, and were linked to the development of presbyopia. From the theoretical standpoint, a parameter that is subject to adaptive regulation would not be expected to show considerable variation, though some gradual deterioration with age might be anticipated. An exception to this might arise in situations such as the present one, where 2 parameters are regulated together: If the system regulates their combined effects, rather than their individual contributions, then changes in one might be offset by changes in the other. Unfortunately, we were not able to make simultaneous measures of V-A and A-V responses, our experiments being confined to one or the other parameter for a period of weeks at a time.
Another possible source ofthe long-term variability may have been errors in the measurement of the accommodative response (A,). These might have been due to fluctuations in the subjects’ criteria for stationarity when adjusting the optometer, for ex- ample. In this event, one would expect to find corresponding fluctuations in the stimulus-response relationship for accom- modation in the A-V studies, and the preadaptation gain of the A-V responses would be correlated with the slope of the A, versus A, relationship. In fact, 1 of the 3 subjects for whom multiple preadaptation measures of A-V responses are available did show such a correlation (r = 0.60), which was significant at the 0.02 level. However, in this case, the changes in the stim- ulus-response relation for accommodation were much smaller than the changes in A-V gain: A linear regression of A-V gain on the A, versus A, slope gave a slope of 2.26 @intercept, -0.99); hence the correlation can account for less than half of the change. In conclusion, errors in the measurement of A, appear to be responsible for very little of the variability in the A-V data.
The adjustments in the biases of the V-A and A-V linkages that can be revealed with wedge prisms are generally thought to reflect mechanisms that are important for maintaining the tonic alignment and focus of the 2 eyes with minimal fixation disparity and blur (Carter, 1965; Ogle et al., 1967; Crone and Hardjowijoto, 1979; Schor, 1979b; Schor et al., 1986). The func- tional significance of adaptive gain control in the oculomotor system has generally been discussed in terms of the need to establish and maintain appropriate values for important control parameters. The regulation of the gain of the V-A and A-V linkages evident with laterally displacing periscopes may relate
to the changing interpupillary distance during development. The steady increase in the interocular separation due to growth of the skull results in an increase in the magnitude of the vergence movements that must accompany given changes in accommo- dation in order to align and focus the 2 eyes. If there are preferred values for the gains of the cross-links between the accommo- dation and vergence control systems, then it would be desirable for the system to be able to increase the gain of the A-V linkage and decrease that of the V-A linkage during development. The apparent failure to adapt to cyclopean spectacles might then relate to the fact that these devices offer a challenge never en- countered in everyday life. However, while the adaptive mech- anisms studied in the present report may fulfill these long-term needs, the rapidity with which these mechanisms can be invoked in mature individuals would seem to suggest that they are also involved in meeting more short-term, transient demands that might recur throughout life. One such situation might be fatigue of the extraocular muscles: the increased vergence errors (retinal disparity) that would result from such fatigue would cause ex- cessive V-A drive to the accommodation controller, thereby tending to cause blur in addition to diplopia. This unfortunate side effect could be reduced by an appropriate reduction in G,,. Further, an increase in G,, would help to reduce the retinal disparity errors by increasing the A-V drive to the vergence controller. Thus, so far as the neural cross-linkages between accommodation and vergence are concerned, the challenge pro- duced by fatigue of the extraocular muscles resembles the chal- lenge of laterally displacing periscopes.
References Alpem, M. (1969) Movement of the eyes. In The Eye, Vol. 3, 2nd
ed., H. Davson, ed.. DD. l-2 14. Academic. New York. AlpeA, M., and 6. Elien (1956aj A quantitative analysis of the hor-
izontal movements of the eyes in the experiment of Johannes Mueller. I. Methods and results. Am. J. Ophthalmol. 42: 289-296.
Alpem, M., and P. Ellen (1956b) A quantitative analysis of the hor- izontal movements ofthe eyes in the experiment ofJohannes Mueller. II. Effect of variation in target separation. Am. J. Ophthalmol. 42: 296-303.
Alpem, M., W. M. Kincaid, and M. J. Lubeck (1959) Vergence and accommodation: III. Proposed definitions of the AC/A ratios. Am. J. Ophthalmol. 48: 141-148.
Balsam, M. H., and G. A. Fry (1959) Convergence accommodation. Am. J. Optom. Arch. Am. Acad. Obtom. 36’567-575.
Berthoz, A., and G. Melvill Jones (1985) Adaptive Mechanisms in Gaze Control. Facts and Theories, Elsevier, The Netherlands.
Bevington, P. R. (1969) Data Reduction and Error Analysis for the Physical Sciences, McGraw-Hill, New York.
Brownlee, K. A. (1965) Statistical Theory and Methodology in Science and Engineering, Wiley, New York.
Campbell, F. W., and G. Westheimer (1960) Dynamics of accom- modation responses of the human eye. J. Physiol. (Lond.) 151: 285- 295.
Candy, J. V. (1986) Signal Processing, The Model-Based Approach, McGraw-Hill, New York.
Carter, D. B. (1964) Fixation disparity with and without fovea1 con- tours. Am. J. Optom. Arch. Am. Acad. Optom. 41: 729-736.
Carter, D. B. (1965) Fixation disparity and heterophoria following prolonged wearing ofprisms. Am. J. Optom. Arch. Am. Acad. Optom. 42: 141-152.
Charman, W. N. (1974) On the position of the plane of stationarity in laser refraction. Am. J. Optom. Physiol. Opt. 51: 832-838.
Crone, R. A., and S. Hardjowijoto (1979) What is normal binocular vision? Dot. Ophthalmol. 47: 163-l 99.
Fincham, E. F. (1955) The proportion of ciliary muscular force re- quired for accommodation. J. Physiol. (Lond.) 128: 99-l 12.
Fincham, E. F., and J. Walton (1957) The reciprocal actions of ac- commodation and convergence. J. Physiol. (Lond.) 137: 488-508.
Fisher, K., and K. J. Ciuffreda (1985) Do optically induced changes

The Journal of Neuroscience, August 1987, 7(8) 2599
in AC/A ratio reflect oculomotor plasticity? Invest. Ophthalmol. Vis. Sci. (Suppl.) 26: 269.
Flom, M. C. (1960a) On the relationship between accommodation and accommodative convergence. I. Linearity. Am. J. Optom. Arch. Am. Acad. Optom. 37: 474-482.
Flom, M. C. (1960b) On the relationship between accommodation and accommodative convergence. II. Stability. Am. J. Optom. Arch. Am. Acad. Optom. 37: 5 17-523.
Flom, M. C. (1960~) On the relationship between accommodation and accommodative convergence. III. Effects of orthoptics. Am. J. Optom. Arch. Am. Acad. Optom. 37: 619-632.
Freund, J. E. (1979) Modern Elementary Statistics, Prentice-Hall, NJ. Hennessy, R. T., and H. W. Leibowitz (1972) Laser optometer in-
corporating the Badal principle. Behav. Res. Methods Instrum. 4: 237-239.
Judge, S. J., and F. A. Miles (1985) Changes in the coupling between accommodation and vergence eye movements induced in human sub- jects by altering the effective interocular separation. Perception 14: 6 17-629.
Kent, P. R. (1958) Convergence accommodation. Am. J. Optom. Arch. Am. Acad. Optom. 35: 393-406.
Kenyon, R. V., K. J. Ciuffreda, and L. Stark (1978) Binocular eye movements during accommodative vergence. Vision Res. 18: 545- 555.
Kersten, D., and G. E. Legge (1983) Convergence accommodation. J. Opt. Sot. Am. 73: 332-338.
Manas, L. (1958) The effect of visual training upon the ACA ratio. Am. J. Optom. Arch. Am. Acad. Optom. 35: 428-437.
Miles, F. A. (1985) Adaptive regulation in the vergence and accom- modation control systems. Rev. Oculomot. Res. 1: 81-94.
Miles, F. A., and B. B. Eighmy (1980) Long-term adaptive changes in primate vestibuloocular reflex. I. Behavioral observations. J. Neu- rophysiol. 43: 1406-1425.
Miles, F. A., and S. J. Judge (1982) Optically-induced changes in the neural coupling between vergence eye movements and accommo- dation in human subjects. In Functional Basis of Ocular Motility Disorders, G. Lennerstrand, D. S. Zee, and E. L. Keller, eds., pp. 93- 96, Pergamon, Oxford, UK.
Morgan, M. W. (1954) The ciliary body in accommodation and ac- commodation-convergence. Am. J. Optom. Arch. Am. Acad. Optom. 31: 219-229.
Mueller, J. (1826) In Elements of Physiology, Vol. 2 (translated from German by W. Baly, 1843) pp. 1147-l 148, Taylor and Walton, London.
Ogle, K. N., T. G. Martens, and J. A. Dyer (1967) Oculomotor Zm- balance in Binocular Vision and Fixation Disparity, Lea and Febiger, Philadelphia, PA.
Schor, C. M. (1979a) The influence of rapid prism adaptation upon fixation disparity. Vision Res. 19: 757-765.
Schor, C. M. (1979b) The relationship between fusional vergence eye movements and fixation disparity. Vision Res. 19: 1359-1367.
Schor, C. M. (1980) Fixation disparity: A steady state error of dis- parity-induced vergence. Am. J. Optom. Physiol. Opt. 57: 6 18-63 1.
Schor, C. M. (1983) Fixation disparity and vergence adaptation. In Vergence Eye Movements: Basic and Clinical Aspects, C. M. Schor and K. J. Ciuffreda, eds., pp. 465-5 16, Butterworth, Boston, MA.
Schor, C. M., and J. Kotulak (1986a) Mutual interactions between accommodation and convergence are reduced by tonic adaptation. In Adaptive Processes in the V&al and Oculomotor Systems, E. Keller and D. Zee. eds.. DD. 135-142. Peraamon. Oxford, UK.
Schor, C. M., and J: C:Kotulak (19861b) Dynamic interactions between accommodation and convergence are velocity sensitive. Vision Res. 26: 927-942.
Schor, C. M., J. C. Kotulak, and T. Tsuetaki (1986) Adaptation of tonic accommodation reduces accommodative lag and is masked in darkness. Invest. Ophthalmol. Vis. Sci. 27: 820-827.
Semmlow, J. L., and N. Venkiteswaran (1976) Dynamic accommo- dative vergence components in binocular vision. Vision Res. 16: 403- 410.
Westheimer, G. (1955) The relationship between accommodation and accommodative convergence. Am. J. Optom. Arch. Am. Acad. Op- tom. 32: 206-212.
Westheimer, G. (1972) Optical properties of vertebrate eyes. In Phys- iology of Photoreceptor Organs, M. G. F. Fuortes, ed., pp. 449-482, Springer-Verlag, Berlin.