chirality induction in metal-induced achiral polythiophene ... · chirality induction in...
TRANSCRIPT
S1
Supporting Information for
Chirality induction in metal-induced achiral polythiophene aggregates
assisted by optically active amines and polythiophene†
Hidetoshi Goto,§ Yuko Yokochi, and Eiji Yashima*
Department of Molecular Design and Engineering, Graduate School of Engineering, Nagoya
University, Chikusa-ku, Nagoya 464-8603, Japan.
§Present address: Department of Industrial Chemistry, Faculty of Engineering, Tokyo
University of Science, 12-1 Ichigaya-funagawara-machi, Shinjuku-ku, Tokyo 162-0826,
Japan
E-mail: [email protected]; Fax: +81-52-789-3185
Electronic Supplementary Material (ESI) for Chemical CommunicationsThis journal is © The Royal Society of Chemistry 2012

S2
1. Experimental Procedures
1-1. Instruments
The melting points were measured using a Yanaco MP-500D melting point apparatus
(Kyoto, Japan) and were uncorrected. The IR spectra were recorded using a JASCO Fourier
Transform IR-680 spectrophotometer (Hachioji, Japan). The NMR spectra were obtained
using a Varian UNITY INOVA 500AS spectrometer operating at 500 MHz for 1H and 125
MHz for 13C using tetramethylsilane (TMS) or the solvent residual peaks as the internal
standards. The DOSY experiments were carried out by using pulsed field gradient with the
BPPSTE pulse sequence.1 The hydrodynamic diameters (dh) were calculated from the
diffusion constants (D) obtained by DOSY measurements according to the Einstein-Stokes
equation, dh = kBT/3πη0D (kB: Boltzmann constant; T: absolute temperature; η0: solvent
viscosity; D: diffusion constant). The electron spray ionization mass spectra (ESI-MS) were
recorded on a JEOL JMS-T100CS spectrometer (Akishima, Japan). The absorption and CD
spectra were measured in a 2- or 5-mm quartz cell on a JASCO V-570 spectrophotometer and
a JASCO J-820 spectropolarimeter, respectively. The temperature was controlled by a JASCO
PTC-423L apparatus (–5 to 55 °C). The elemental analyses were performed by the Analytical
Laboratory in the Graduate School of Bioagricultural Sciences, Nagoya University. The size
exclusion chromatography (SEC) was performed with a JASCO PU-980 liquid
chromatograph equipped with a JASCO DG-980-50 degasser and a UV-visible detector (254
nm; JASCO UV-970) at 40 °C. An SEC column (Tosoh TSK-GEL Multipore HXL-M: 30 x
0.78 cm (i.d.): pore size, 0.01–0.6 μm; bead size, 5 μm) was connected, and CHCl3 was used
as eluent at a flow rate of 1.0 mL/min. The molecular weight calibration curve was obtained
with standard polystyrenes (Tosoh).
1-2. Materials
All starting materials and dehydrated solvents were purchased from Sigma-Aldrich (St.
Louis, Missouri, USA), Wako Pure Chemical Industries, Ltd. (Osaka, Japan), and Tokyo
Chemical Industry Co., Ltd. (Tokyo, Japan). Triethylamine was distilled over CaH2 under Ar
after being stirred with KOH pellets overnight. The deuterium solvents were purchased from
Merck (Darmstadt, Germany) or Cambridge Isotope Laboratories (Andover, Massachusetts,
USA) and degassed with Ar and used throughout all the experiments. Silica gel (SiO2) for the
flash chromatography was purchased from Merck. An optically active regioregular
polythiophene, poly[3-[4-((R)-4-ethyl-2-oxazolin-2-yl)phenyl]thiophene] (PEOPT) (Mn = 5.3
x 103, DPn = 21, Mw/Mn = 1.25),
2 and achiral regioregular poly(3-hexylthiophene) (PHT) (Mn
= 8.2 x 10³, DPn = 49, Mw/Mn = 1.80)
3 were synthesized according to the previously reported
methods.
1-3. Synthetic procedures
Electronic Supplementary Material (ESI) for Chemical CommunicationsThis journal is © The Royal Society of Chemistry 2012

S3
The polythiophene derivative bearing an achiral oxazoline group (P1) was synthesized
according to Scheme S1.2 The reaction progresses were monitored by TLC or ESI-MS.
Scheme S1. Synthesis of regioregular polythiophene (P1) bearing an achiral oxazoline groupa
S
ON
n
P1
S
ON
1
S
ON
1Br
Br
(e)
25%
(d)
91%
I
ON
I
OEtO
I
OHN
(b)
94%
(a)
85%
(c)
92%
OH
aReagents and conditions: (a) 2-amino-2-methyl-1-propanol, Me3Al, toluene, reflux, 2 days;
(b) 4-toluenesulfonyl chloride, Et3N, CH2Cl2, rt, 6 days; (c) 3-thiopheneboronic acid,
Pd(PPh3)4, K3PO4, toluene, reflux, 2 days; (d) NBS, DMF, rt, 3 days, (e) (i) LDA, THF,
-98 °C; (ii) MgBr2•Et2O, -98 °C, 10 min; (iii) Ni(dppp)Cl2, -98 °C (15 min), -60 °C (1 h), rt
(2.5 h), and then reflux (20 h).
2-[N-(4-Iodobenzoyl)amino]-2-methyl-1-propanol. To a toluene (100 mL) solution of
2-amino-2-methyl-1-propanol (11.0 mL, 115 mmol) was added dropwise trimethylaluminium
in n-hexane (1.56 M) (100 mL, 156 mmol) at 0 °C via a cannula within 40 min under nitrogen.
The reaction mixture was then allowed to warm to room temperature and further stirred for 1
h. A toluene (150 mL) solution of ethyl 4-iodobenzoate (25.0 g, 90.6 mmol) was added
dropwise to the mixture via a dropping funnel within 50 min at that temperature, and the
mixture was then refluxed for 2 days. After cooling to room temperature, 20% aqueous
solution of Rochelle salt (100 mL) was added. After filtration, the filtrate was dissolved in
ethanol and the solvent was removed by evaporation. The crude product was purified by
recrystallization with ethanol (10 mL) and n-hexane (20 mL) to give the desired product as a
slightly yellow needle crystal (24.6 g, 77.1 mmol, 85.1% yield). IR (KBr, cm-1): 3375, 3301,
3081, 2968, 2873, 1639, 1587, 1543, 1331, 1049, 877, 715. 1H NMR (CDCl3): δ 1.00 (s, CH3,
6H), 2.33 (s, OH, 1H), 3.70 (s, OCH2, 2H), 6.22 (s, NH, 1H), 7.48 (d, Ph-H2, J = 8.4 Hz, 2H),
7.77 (d, Ph-H3, J = 8.4 Hz, 2H).
Electronic Supplementary Material (ESI) for Chemical CommunicationsThis journal is © The Royal Society of Chemistry 2012
S4
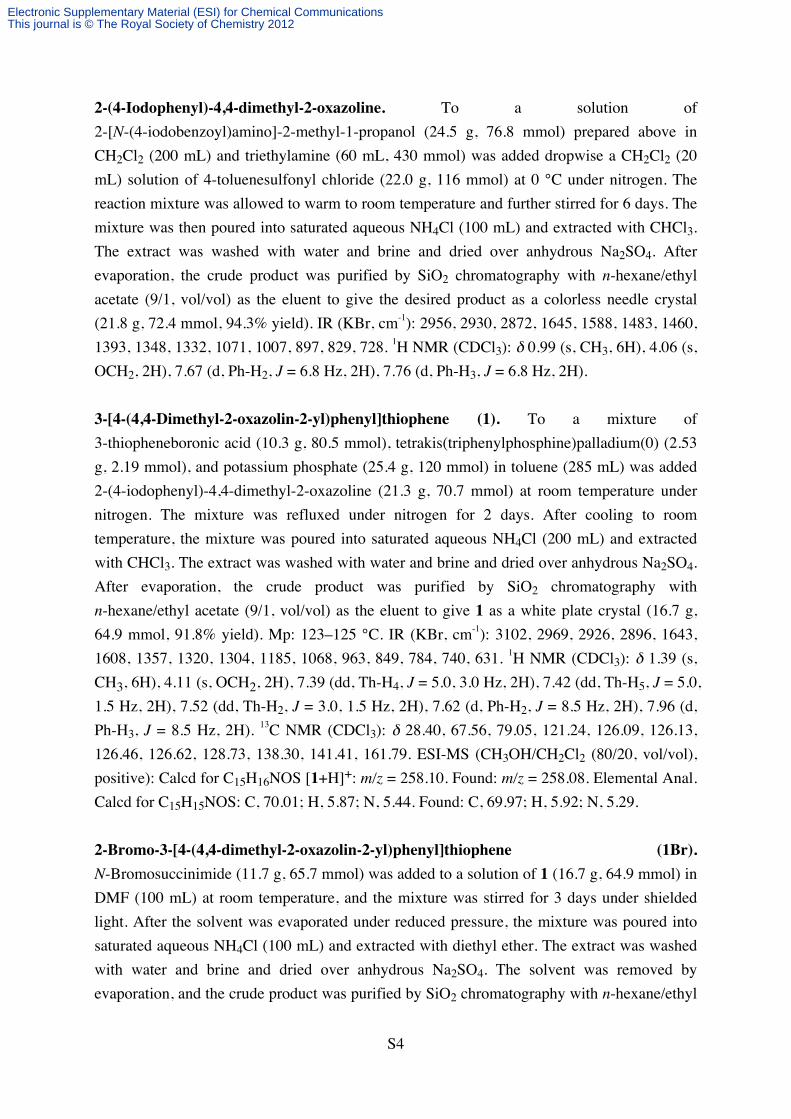
2-(4-Iodophenyl)-4,4-dimethyl-2-oxazoline. To a solution of
2-[N-(4-iodobenzoyl)amino]-2-methyl-1-propanol (24.5 g, 76.8 mmol) prepared above in
CH2Cl2 (200 mL) and triethylamine (60 mL, 430 mmol) was added dropwise a CH2Cl2 (20
mL) solution of 4-toluenesulfonyl chloride (22.0 g, 116 mmol) at 0 °C under nitrogen. The
reaction mixture was allowed to warm to room temperature and further stirred for 6 days. The
mixture was then poured into saturated aqueous NH4Cl (100 mL) and extracted with CHCl3.
The extract was washed with water and brine and dried over anhydrous Na2SO4. After
evaporation, the crude product was purified by SiO2 chromatography with n-hexane/ethyl
acetate (9/1, vol/vol) as the eluent to give the desired product as a colorless needle crystal
(21.8 g, 72.4 mmol, 94.3% yield). IR (KBr, cm-1): 2956, 2930, 2872, 1645, 1588, 1483, 1460,
1393, 1348, 1332, 1071, 1007, 897, 829, 728. 1H NMR (CDCl3): δ 0.99 (s, CH3, 6H), 4.06 (s,
OCH2, 2H), 7.67 (d, Ph-H2, J = 6.8 Hz, 2H), 7.76 (d, Ph-H3, J = 6.8 Hz, 2H).
3-[4-(4,4-Dimethyl-2-oxazolin-2-yl)phenyl]thiophene (1). To a mixture of
3-thiopheneboronic acid (10.3 g, 80.5 mmol), tetrakis(triphenylphosphine)palladium(0) (2.53
g, 2.19 mmol), and potassium phosphate (25.4 g, 120 mmol) in toluene (285 mL) was added
2-(4-iodophenyl)-4,4-dimethyl-2-oxazoline (21.3 g, 70.7 mmol) at room temperature under
nitrogen. The mixture was refluxed under nitrogen for 2 days. After cooling to room
temperature, the mixture was poured into saturated aqueous NH4Cl (200 mL) and extracted
with CHCl3. The extract was washed with water and brine and dried over anhydrous Na2SO4.
After evaporation, the crude product was purified by SiO2 chromatography with
n-hexane/ethyl acetate (9/1, vol/vol) as the eluent to give 1 as a white plate crystal (16.7 g,
64.9 mmol, 91.8% yield). Mp: 123–125 °C. IR (KBr, cm-1): 3102, 2969, 2926, 2896, 1643,
1608, 1357, 1320, 1304, 1185, 1068, 963, 849, 784, 740, 631. 1H NMR (CDCl3): δ 1.39 (s,
CH3, 6H), 4.11 (s, OCH2, 2H), 7.39 (dd, Th-H4, J = 5.0, 3.0 Hz, 2H), 7.42 (dd, Th-H5, J = 5.0,
1.5 Hz, 2H), 7.52 (dd, Th-H2, J = 3.0, 1.5 Hz, 2H), 7.62 (d, Ph-H2, J = 8.5 Hz, 2H), 7.96 (d,
Ph-H3, J = 8.5 Hz, 2H). 13C NMR (CDCl3): δ 28.40, 67.56, 79.05, 121.24, 126.09, 126.13,
126.46, 126.62, 128.73, 138.30, 141.41, 161.79. ESI-MS (CH3OH/CH2Cl2 (80/20, vol/vol),
positive): Calcd for C15H16NOS [1+H]+: m/z = 258.10. Found: m/z = 258.08. Elemental Anal.
Calcd for C15H15NOS: C, 70.01; H, 5.87; N, 5.44. Found: C, 69.97; H, 5.92; N, 5.29.
2-Bromo-3-[4-(4,4-dimethyl-2-oxazolin-2-yl)phenyl]thiophene (1Br).
N-Bromosuccinimide (11.7 g, 65.7 mmol) was added to a solution of 1 (16.7 g, 64.9 mmol) in
DMF (100 mL) at room temperature, and the mixture was stirred for 3 days under shielded
light. After the solvent was evaporated under reduced pressure, the mixture was poured into
saturated aqueous NH4Cl (100 mL) and extracted with diethyl ether. The extract was washed
with water and brine and dried over anhydrous Na2SO4. The solvent was removed by
evaporation, and the crude product was purified by SiO2 chromatography with n-hexane/ethyl
Electronic Supplementary Material (ESI) for Chemical CommunicationsThis journal is © The Royal Society of Chemistry 2012

S5
acetate (10/1, vol/vol) as the eluent to give 1Br as a slightly yellow solid (19.9 g, 59.2 mmol,
91.2% yield). Mp: 56–57 °C. IR (KBr, cm-1): 3106, 2966, 2926, 2891, 1648, 1612, 1352,
1315, 1301, 1184, 1061, 1018, 988, 967, 876, 849, 717, 688. 1H NMR (CDCl3): δ 1.40 (s,
CH3, 6H), 4.12 (s, OCH2, 2H), 7.04 (d, Th-H4, J = 5.5 Hz, 2H), 7.31 (d, Ph-H5, J = 5.5 Hz,
2H), 7.59 (d, Ph-H2, J = 8.5 Hz, 2H), 8.00 (d, Ph-H3, J = 8.5 Hz, 2H). 13C NMR (CDCl3): δ
28.38, 67.60, 79.14, 109.27, 126.13, 127.15, 128.25, 128.48, 128.88, 137.73, 140.36, 161.76.
ESI-MS (CH3OH/CH2Cl2 (80/20, vol/vol), positive): Calcd for C15H15BrNOS [1Br+H]+: m/z
= 338.00. Found: m/z = 337.99. Elemental Anal. Calcd for C15H14BrNOS: C, 53.58; H, 4.20;
N, 4.17. Found: C, 53.64; H, 4.29; N, 4.04.
Poly[3-[4-(4,4-dimethyl-2-oxazolin-2-yl)phenyl]thiophene] (P1). Polymerization of 1Br
was carried out according to the reported method.2,3
1Br (2.00 g, 5.95 mmol) and
MgBr2•Et2O (1.84 g, 7.14 mmol) weighed under nitrogen were placed in a two-necked flask
equipped with a magnetic stirrer bar and a three-way stopcock under dry nitrogen, and THF
(38 mL) was then added by a syringe. The mixture was cooled to -98 °C, and to this
suspension solution was added lithium diisopropylamide solution (6.8 mmol based on
n-BuLi) in THF (12 mL) via a cannula under dry nitrogen -98 °C. After stirring for 10 min at
that temperature, [1,3-bis(diphenylphosphino)propane]nickel(II) chloride (Ni(dppp)Cl2) (32
mg, 68 μmol) was added, and the mixture was allowed to warm to -60 °C over 15 min. After
the further addition of Ni(dppp)Cl2 (32 mg, 68 μmol), the mixture was gradually allowed to
warm to room temperature, whereupon the solution became clear within 1 h. Ni(dppp)Cl2 (32
mg, 68 μmol) was added to the mixture at room temperature. After stirring for 2.5 h, the
solution was refluxed under stirring for 20 h, giving the purple suspension. After cooling to
room temperature, the solvent was removed by evaporation and the dark purple suspension
was poured into a large amount of CH3OH. The purple precipitate was collected by
centrifugation, washed with CH3OH and THF, and dried in vacuo at room temperature
overnight. The polymer was then dissolved in CHCl3 and the solution was washed with
saturated aqueous EDTA and dried over anhydrous Na2SO4. After the solvent was evaporated,
the polymer was again dissolved in CHCl3 and the solution was poured in a large amount of
n-hexane. The precipitate was collected by centrifugation and dried in vacuo at room
temperature overnight to afford P1 as a dark purple powder (0.37 g, 1.46 mmol, 24.5% yield).
Mn = 5.8 x 10³, DPn = 23, Mw/Mn = 1.27. IR (KBr, cm-1): 3063, 2964, 2927, 2893, 1650, 1609,
1352, 1314, 1300, 1189, 1063, 1018, 967, 830, 689. 1H NMR (CDCl3): δ 1.32–1.44 (br, CH3,
6H), 4.04–4.18 (br, OCH2, 2H), 6.85–6.93 (br, Th-H4, 1H), 7.31–7.57 (d, Ph-H2, 2H),
7.86–8.01 (d, Ph-H3, 2H). 13C NMR (CDCl3): δ 28.39, 67.59, 79.10, 127.37, 128.42, 129.15,
129.89, 131.55, 134.08, 138.21, 138.60, 161.77. Elemental Anal. Calcd for
(C15H13NOS•0.3H2O)n: C, 69.10; H, 5.26; N, 5.37. Found: C, 69.00; H, 5.23; N, 5.12.
Electronic Supplementary Material (ESI) for Chemical CommunicationsThis journal is © The Royal Society of Chemistry 2012

S6
1-4. Measurements
Absorption and CD measurements of P1 in the presence of various chiral amines and
metal salts. A typical experimental procedure is described below. Stock solutions of P1 (2.6
mg/5 mL, 2 mM) and (1R,2S)-1-amino-2-indanol [(1R,2S)-2] (3.0 mg/5 mL, 4 mM) in CHCl3
and silver trifluoromethanesulfonate (AgOTf) (10.3 mg/1 mL, 40 mM) in CH3CN were
prepared in a dry box (NX1-M00320, Vacuum Atmosphere Company, Hawthorne, USA)
under an argon atmosphere. The stock solutions of P1 (400 μL) and (1R,2S)-2 (200 μL) were
transferred to a 0.2-cm quartz cell with a stopcock using Hamilton microsyringes. To this was
added CHCl3 (180 μL) and the stock solution of AgOTf (20 μL) subsequently. After the
mixture was allowed to stand for 30 min, the absorption and CD spectra were recorded. In a
similar manner, the absorption and CD spectra of P1 in the presence of other chiral amines
and metal salts were performed.
1H NMR and DOSY measurements of P1 in the presence of (1R,2S)-2 and AgOTf. Stock
solutions of P1 (3.4 mg/3 mL, 4.4 mM) and (1R,2S)-2 (2.0 mg/3 mL, 4.4 mM) in CDCl3, and
AgOTf (10.3 mg/1 mL, 40 mM) in CD3CN were prepared in a dry box under an argon
atmosphere. The stock solutions of P1 (270 μL), (1R,2S)-2 (270 μL), and AgOTf (30 μL)
were transferred to a 5-mm NMR tube using microsyringes. After the mixture was allowed to
stand for 30 min, the 1H NMR and DOSY measurements were performed.
Absorption and CD titrations of P1 with AgOTf–(1R,2S)-2 mixture. Stock solutions
solution of P1 (2.7 mg/10 mL, 1.05 mM) and (1R,2S)-2 (11.9 mg/1 mL, 80 mM) in CHCl3
and AgOTf (20.6 mg/1 mL, 80 mM) in CH3CN were prepared in a dry box under an argon
atmosphere. The stock solutions of (1R,2S)-2 (500 μL) and AgOTf (500 μL) were mixed in a
vessel equipped with a stopcock using microsyringes to prepare a 1:1 mixture solution of
AgOTf and (1R,2S)-2. The stock solution of P1 (760 μL) was transferred to a 0.2-mm quartz
cell, and its initial absorption spectrum was recorded. To this was added increasing volumes
of the AgOTf–(1R,2S)-2 solution (0–40 μL, 0–2 equiv.), and their absorption and CD spectra
were recorded for each addition after the mixtures had been allowed to stand for 30 min.
Absorption and CD measurements of P1–PEOPT mixtures in the presence of metal salts.
A typical experimental procedure is described below. Stock solutions of P1 (2.6 mg/50 mL,
0.20 mM) and PEOPT (2.6 mg/50 mL, 0.20 mM) in CHCl3 and copper(II)
trifluoromethanesulfonate (Cu(OTf)2) (14.5 mg/2 mL, 20 mM) in CH3CN were prepared in a
dry box under an argon atmosphere. The stock solutions of P1 (0–2 mL) and PEOPT (0–2
mL) were transferred to a 0.5-cm quartz cell with a stopcock using Hamilton microsyringes,
keeping the total volume to be 2 mL. To this was added the stock solution of Cu(OTf)2 (20
μL). After the mixtures were allowed to stand for 3 h, the absorption and CD spectra were
Electronic Supplementary Material (ESI) for Chemical CommunicationsThis journal is © The Royal Society of Chemistry 2012
S7
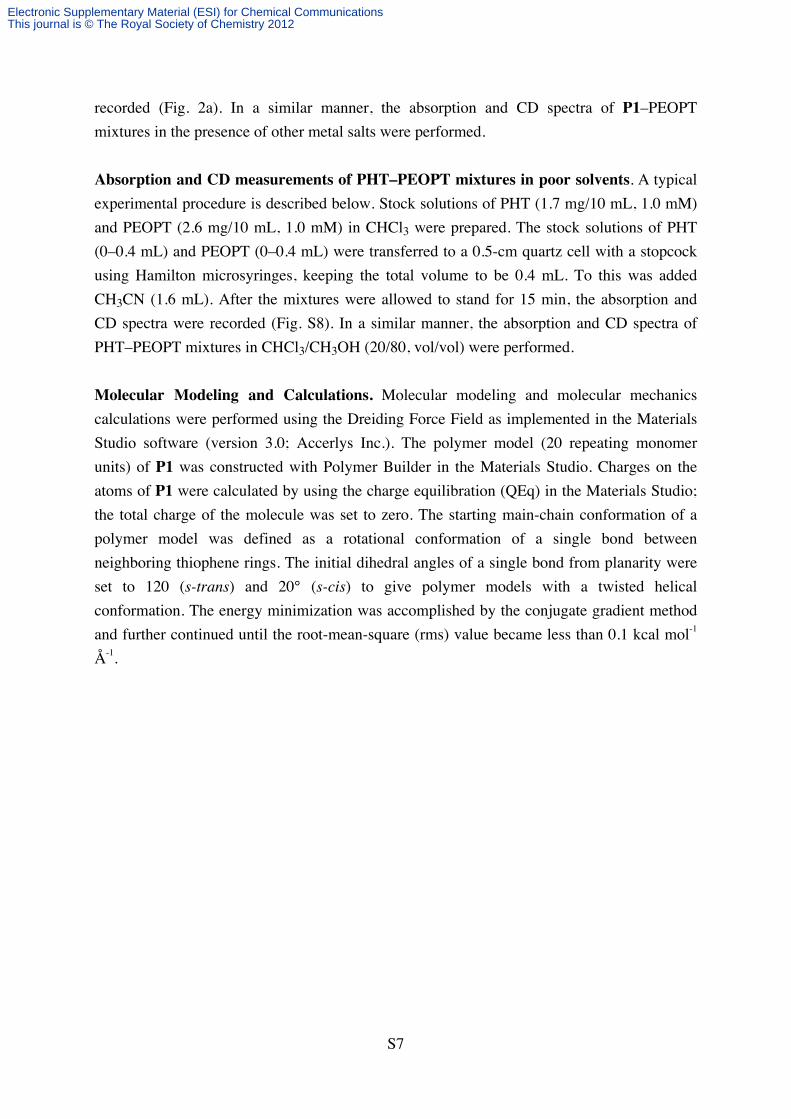
recorded (Fig. 2a). In a similar manner, the absorption and CD spectra of P1–PEOPT
mixtures in the presence of other metal salts were performed.
Absorption and CD measurements of PHT–PEOPT mixtures in poor solvents. A typical
experimental procedure is described below. Stock solutions of PHT (1.7 mg/10 mL, 1.0 mM)
and PEOPT (2.6 mg/10 mL, 1.0 mM) in CHCl3 were prepared. The stock solutions of PHT
(0–0.4 mL) and PEOPT (0–0.4 mL) were transferred to a 0.5-cm quartz cell with a stopcock
using Hamilton microsyringes, keeping the total volume to be 0.4 mL. To this was added
CH3CN (1.6 mL). After the mixtures were allowed to stand for 15 min, the absorption and
CD spectra were recorded (Fig. S8). In a similar manner, the absorption and CD spectra of
PHT–PEOPT mixtures in CHCl3/CH3OH (20/80, vol/vol) were performed.
Molecular Modeling and Calculations. Molecular modeling and molecular mechanics
calculations were performed using the Dreiding Force Field as implemented in the Materials
Studio software (version 3.0; Accerlys Inc.). The polymer model (20 repeating monomer
units) of P1 was constructed with Polymer Builder in the Materials Studio. Charges on the
atoms of P1 were calculated by using the charge equilibration (QEq) in the Materials Studio;
the total charge of the molecule was set to zero. The starting main-chain conformation of a
polymer model was defined as a rotational conformation of a single bond between
neighboring thiophene rings. The initial dihedral angles of a single bond from planarity were
set to 120 (s-trans) and 20° (s-cis) to give polymer models with a twisted helical
conformation. The energy minimization was accomplished by the conjugate gradient method
and further continued until the root-mean-square (rms) value became less than 0.1 kcal mol-1
Å-1.
Electronic Supplementary Material (ESI) for Chemical CommunicationsThis journal is © The Royal Society of Chemistry 2012

S8
2. Chiral aggregate formation of P1 with chiral metal complexes
2-1. Absorption titration of P1 with Ag(I)
Fig. S1. Absorption spectral changes of P1 in CHCl3 upon the addition of AgOTf in CH3CN
(CHCl3/CH3CN = 100/0 to 97.5/2.5, vol/vol) at 25 °C; [P1] = 1 mM unit-1, [AgOTf]/[P1] =
0–1. The spectra were measured after the mixtures had been allowed to stand for 30 min at rt.
2-2. Time dependent CD intensity changes of P1 with chiral Ag(I) complex
Fig. S2. Time dependent changes of the molar circular dichroism (Δε435) and molar
absorptivity (ε435) at 435 nm of P1 upon the addition of AgOTf–(1R,2S)-2 complex in
CHCl3/CH3CN (97.5/2.5, vol/vol) at 25 °C; [P1] = 1 mM unit-1, [P1]:[AgOTf]:[(1R,2S)-2] =
1:1:1.
Electronic Supplementary Material (ESI) for Chemical CommunicationsThis journal is © The Royal Society of Chemistry 2012

S9
2-3. CD and absorption titrations of P1 with chiral Ag(I) complex
Fig. S3. CD and absorption spectra of P1 in the presence of AgOTf–(1R,2S)-2 complex in
CHCl3/CH3CN (97.5/2.5, vol/vol) at 25 °C; [P1] = 1 mM unit-1, [AgOTf–(1R,2S)-2]/[P1] =
0–0.5 (a), 0.5–1 (b), and 1–2 (c). These spectra were measured after the mixtures had been
allowed to stand for 30 min at rt. (d) Plots of the molar circular dichroism at 435 nm (Δε435)
and the molar absorptivities at 320 nm (ε320) of P1 upon the addition of AgOTf–(1R,2S)-2
complex.
Electronic Supplementary Material (ESI) for Chemical CommunicationsThis journal is © The Royal Society of Chemistry 2012

S10
2-4. 1H NMR spectra of P1 with chiral Ag(I) complexes
Fig. S4. 1H NMR spectra of P1, (1R,2S)-2, and their complexes in CDCl3/CD3CN (10/1,
vol/vol) at 25 °C; [P1] = 2 mM unit-1.
Electronic Supplementary Material (ESI) for Chemical CommunicationsThis journal is © The Royal Society of Chemistry 2012

S11
2-5. DOSY measurements
Table S1. Diffusion coefficients (D) of P1, (1R,2S)-2, and their AgOTf complexesa
D / 10-10
m2 s
-1
sample conc. / mM P1 (1R,2S)-2 TMSb
P1 2 5.25 21.5
(1R,2S)-2 2 13.8 20.2
P1/Agc 2/1 2.09 19.3
Ag/(1R,2S)-2 1/2 9.09 21.0
P1/Ag/(1R,2S)-2 2/2/2 2.50 7.43 19.4 aMeasured in CDCl3/CD3CN (10/1, vol/vol) at 25 °C. bTMS was used as the internal standard. cAfter the measurement (ca. 4 h), a small amount of an orange-red precipitate derived from
the P1–AgOTf complex was observed in the NMR tube.
2-6. Temperature effect
Fig. S5. (a) Temperature dependent absorption and CD spectral changes of
P1–AgOTf–(1R,2S)-2 complex. (b) Plots of the molar circular dichroism at 430 nm (Δε430)
and molar absorptivity at 400 nm (ε400) of P1–AgOTf–(1R,2S)-2 complex in CHCl3/CH3CN
(97.5/2.5, vol/vol); [P1] = 1 mM unit-1, [P1]:[AgOTf]:[(1R,2S)-2] = 1:1:1. These spectra were
measured after the mixtures had been allowed to stand for 30 min at rt.
Electronic Supplementary Material (ESI) for Chemical CommunicationsThis journal is © The Royal Society of Chemistry 2012

S12
2-7. Effect of chiral amines
Table S2. Molar circular dichroisms (Δεmax) and molar absorptivities (εmax) of P1 in the
presence of AgOTf–chiral amine complexesa
CD spectra (2nd Cotton) absorption spectra
Δε λ ε x 10-3 λ
amine configurationb sign / cm-1 M-1 unit-1 / nm / cm-1 M-1 unit-1 / nm
none 6.98 449
(1S,2R)-2 S + 2.66 438 6.98 432
(1R,2S)-2 R – 2.71 434 6.83 430
(1R,2S)-3 S + 2.28 441 7.09 441
(1R,2S)-4 S + 1.94 444 6.90 443
(S)-5 S + 0.72 453 7.19 436
(S)-6 S – 0.91 438 7.07 441
(1R,2S)-7 S + 0.62 435 6.92 448
aSolvent: CHCl3:CH3CN = 97.5:2.5; temp: 25 °C; cell length: 2 mm; [P1] = 1 mM unit-1
[P1]:[AgOTf]:[chiral amine] = 1:1:1. The spectra were measured after the mixtures had been
allowed to stand for 30 min at rt. bAbsolute configuration of the amino group-bound
asymmetric carbon atom.
2-8. Effect of metal salts
Fig. S6. CD and absorption spectra of P1 in the presence of metal salt–(1R,2S)-2 (a) and
–(1R,2S)-3 (b) complexes in CHCl3/CH3CN (97.5/2.5, vol/vol) at 25 °C; [P1] = 1 mM unit-1,
[P1]:[metal salt]:[(1R,2S)-2 or (1R,2S)-3] = 1:1:1. These spectra were measured after the
mixtures had been allowed to stand for 30 min at rt.
Electronic Supplementary Material (ESI) for Chemical CommunicationsThis journal is © The Royal Society of Chemistry 2012
S13
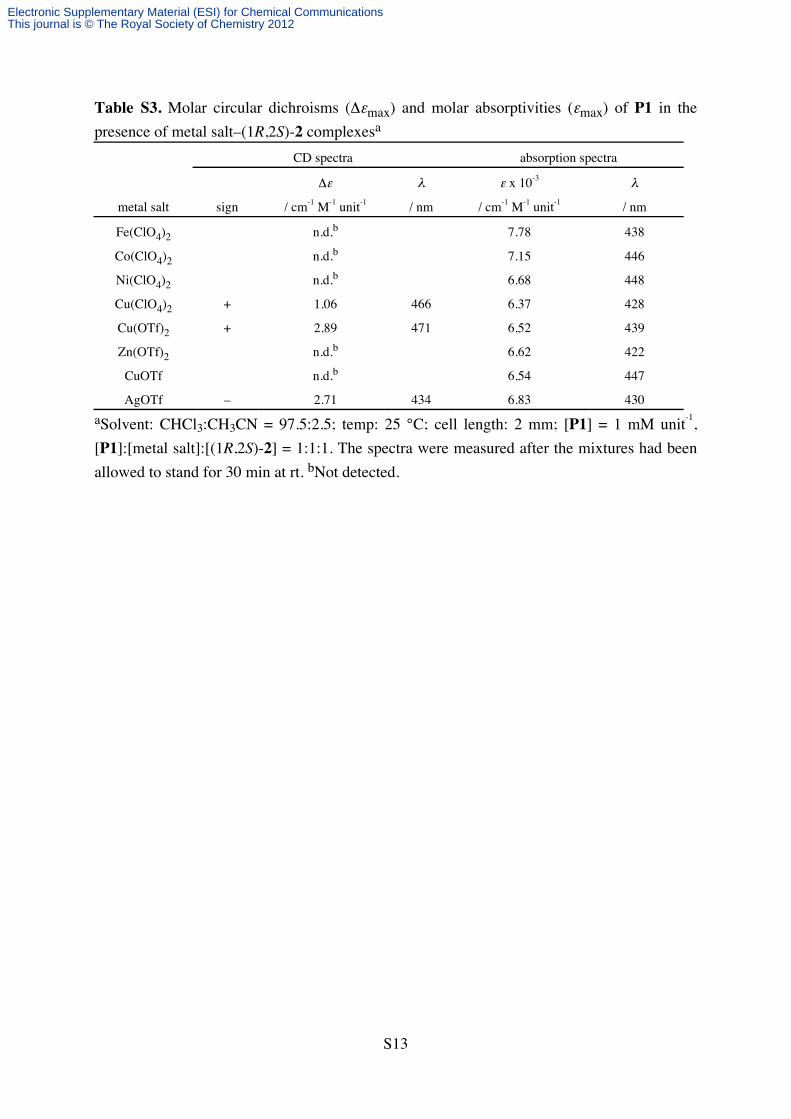
Table S3. Molar circular dichroisms (Δεmax) and molar absorptivities (εmax) of P1 in the
presence of metal salt–(1R,2S)-2 complexesa
CD spectra absorption spectra
Δε λ ε x 10-3 λ
metal salt sign / cm-1 M-1 unit-1 / nm / cm-1 M-1 unit-1 / nm
Fe(ClO4)2 n.d.b 7.78 438
Co(ClO4)2 n.d.b 7.15 446
Ni(ClO4)2 n.d.b 6.68 448
Cu(ClO4)2 + 1.06 466 6.37 428
Cu(OTf)2 + 2.89 471 6.52 439
Zn(OTf)2 n.d.b 6.62 422
CuOTf n.d.b 6.54 447
AgOTf – 2.71 434 6.83 430
aSolvent: CHCl3:CH3CN = 97.5:2.5; temp: 25 °C; cell length: 2 mm; [P1] = 1 mM unit-1,
[P1]:[metal salt]:[(1R,2S)-2] = 1:1:1. The spectra were measured after the mixtures had been
allowed to stand for 30 min at rt. bNot detected.
Electronic Supplementary Material (ESI) for Chemical CommunicationsThis journal is © The Royal Society of Chemistry 2012

S14
2-9. Chiral Co-aggregate Formation of P1–PEOPT Mixture with Cu(II) and Ag(I)
Fig. S7. (a, d) CD and absorption spectra of P1–PEOPT mixtures with Cu(OTf)2 (a) and
AgOTf (d) in CHCl3/CH3CN (99/1, vol/vol) at 25 °C; [P1]+[PEOPT] = 0.2 mM unit-1,
([P1]+[PEOPT]):[Cu(OTf)2 or AgOTf] = 1:1. These spectra were measured after the mixtures
had been allowed to stand for 3 h at rt. (b, c, e) Time-dependent CD intensity changes (Δε2nd)
of P1–PEOPT mixtures with Cu(OTf)2 (b, c) and AgOTf (e) in CHCl3/CH3CN (99/1,
vol/vol); [PEOPT]/([P1]+[PEOPT]) = 0–0.55 (b), 0.55–1 (c), and 0–1 (e).
Electronic Supplementary Material (ESI) for Chemical CommunicationsThis journal is © The Royal Society of Chemistry 2012

S15
2-10. Chiral Co-aggregate Formation of PHT–PEOPT Mixture in Poor Solvent
Fig. S8. (a, b) CD and absorption spectra of PHT–PEOPT mixtures in CHCl3/CH3OH (20/80,
vol/vol) (a) and CHCl3/CH3CN (20/80, vol/vol) (b) at 25 °C; [PHT]+[PEOPT] = 0.2 mM
unit-1. These spectra were measured after the mixtures had been allowed to stand for 15 min at
rt. (c) Plots of the molar circular dichroism (1st Cotton effect) (Δε1st) of PHT–PEOPT
mixtures in CHCl3/CH3OH (20/80, vol/vol) (blue) and CHCl3/CH3CN (20/80, vol/vol) (red)
versus PEOPT content; [P1]+[PEOPT] = 0.2 mM unit-1. These spectra were measured after
the mixtures had been allowed to stand for 15 min at rt.
Electronic Supplementary Material (ESI) for Chemical CommunicationsThis journal is © The Royal Society of Chemistry 2012

S16
3. Supporting references
1. (a) Y. Cohen, L. Avram, L. Frish, Angew. Chem., Int. Ed., 2005, 44, 520–554.
(b) P. S. Pregosin, P. G. A. Kumar, I. Fernandez, Chem. Rev., 2005, 105, 2977–2998.
2. (a) E. Yashima, H. Goto, Y. Okamoto, Macromolecules, 1999, 32, 7942–7945.
(b) H. Goto, Y. Okamoto, E. Yashima, Macromolecules, 2002, 35, 4590–4601.
3. (a) R. D. McCullough, R. D. Lowe, J. Chem. Soc., Chem. Commun., 1992, 70–72.
(b) R. D. McCullough, R. D. Lowe, M. Jayaraman, D. L. Anderson, J. Org. Chem., 1993,
58, 904–912.
(c) I. Osaka, R. D. McCullough, Acc. Chem. Res., 2008, 41, 1202–1214.
Electronic Supplementary Material (ESI) for Chemical CommunicationsThis journal is © The Royal Society of Chemistry 2012