optical properties of semiconductors under hydrostatic pressure-ii
TRANSCRIPT
PAUL-W 58-0214
J. Phys. Chem. Solids Pergamon Press 1958. Vol. 5. pp. 102-106.
OPTICAL PROPERTIES OF SEMICONDUCTORS UNDER HYDROSTATIC PRESSURE-II. SILICON*
WILLIAM PAUL and D. M. WARSCHAUER
Division of Engineering and Applied Physics, Harvard University, Cambridge, Mass. Lincoln Laboratory, Massachusetts Institut~ of Technology, Lexington, Mass.
(Received 2 August 1957)
Abstract-The pressure coefficient of the optical ab~orption edge due to indirect transitions has been measured in silicon over a pressure range of 1-8000 kg/cm2• A value of (dE/dP)T = -1 ·3 X 10- 12
eV/dyne cm- 2 was obtained, in agreement with other optical and resistivity measurements. The lack of an observable change of shape of the edge with pressure implies that a simple displacement of the (100) conduction-band minima relative to the, (000) valence-band maximum takes place with change
r
(
,
PROPERTIES «
assumption of no in agreement witt ported briefly, (4)
optically by N E UJ
range. NATHAN a - 2x 10- 12 eV/dy rnents on a gold et aZ.(7) observed; in the optical ene!
The discussior techniques, and 1
the previous pap s3mple was an I
slab of 25-35 ( thick. Carbon disl
of pressure.
INTRODUCTION
THE variation of the optical energy gap in germanium with hydrostatic pressure has been discussed by us in a preceding paper.(l) In this paper we shall present similar results for silicon, but since much of the technique of measurement and interpretation is common to both experiments, we refer the reader to the germanium discussion for many of the details.
aruo1y,i,. Wo "on only try to fit ou, ,,,uI,, on t~ I measurement of resistivity and other parameters into a "".,istent" pattom. SovOta! "tima", (" I
Tfi
H
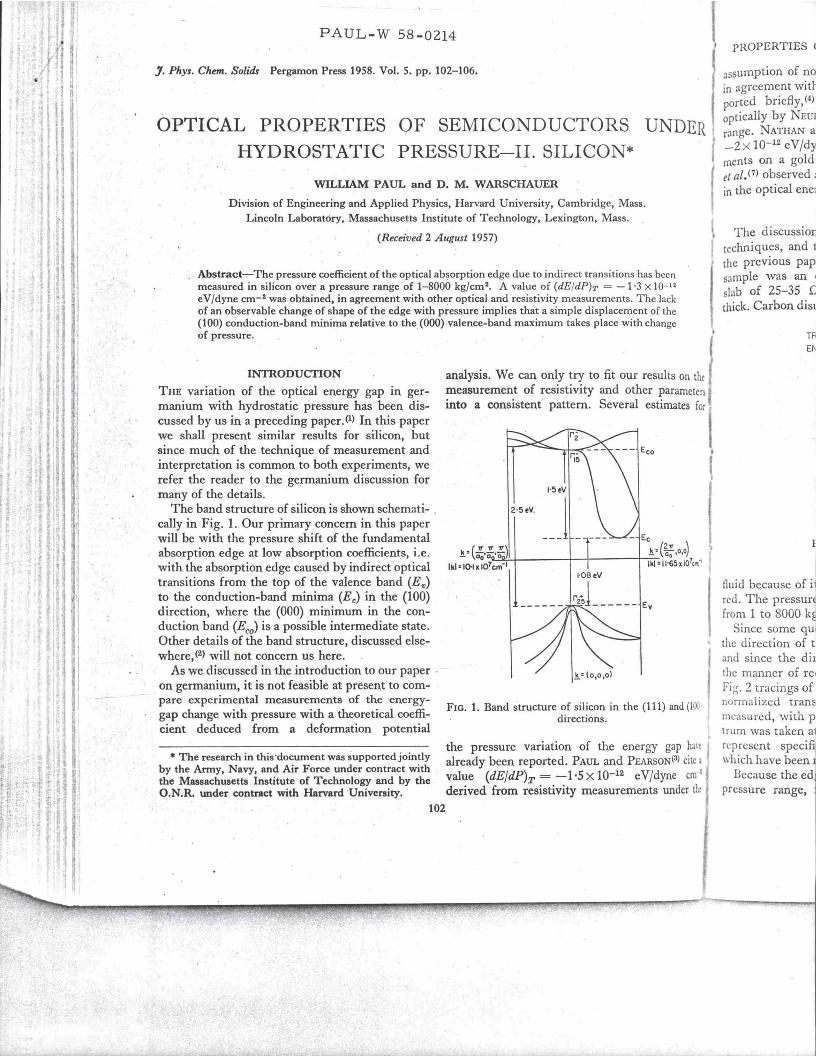
The band structure of silicon is shown schemati- , cally in Fig. 1. Our primary concern in this paper will be with the pressure shift of the fundamental absorption edge at low absorption coefficients, i.e. with the absorption edge caused by indirect optical transitions from the top of the valence band (E,,) to the conduction-band minima (Ec) in the (100) direction, where the (000) minimum in the conduction band (Eco) is a possible intermediate state. Other details of the band structure, discussed elsewhere, (2) will not concern us here.
As we discussed in the introduction to our paper ' on germanium, it is not feasible at present to compare experimental measurements of the energygap change with pressure with a theoretical coefficient deduced from a deformation potential
• The research in this ·document was 8upportedjointly by the Army, Navy, and Air Force under contract with the Massachusetts Institute of Technology and by the O.N.R. under contract with Harvard 'University.
102
1·5eV
2'5eV,
FIG. 1. Band structure of silicon in the (111) and (100 directions.
the pressure variation of the energy gap halt already been reported. PAUL and PEARSON(3) cite I value (dEJdP)T = -1'5xlO-12 eVJdyne em-I
derived from resistivity measurements under t~
(
I
flu id because of i1 red . The pressun from 1 to 8000 k~
Since some qUI
• the direction of t I and since the diI
'
the manner of rei Fig. 2 tracings of normalized trans measured, with p trum was taken a1 represent speci~ which have been]
Because the ed pressure range,
1 I~ Jt
I(OI'ERTIES OF SEMICONDUCTORS UNDER HYDROSTATIC PRESSURE-II. SILICON 103
ption of no mobility changes. This value is (tfmcnt with our optical value, previously re
briefly, (4) and with the value obtained .aU)" by NEURINGER(5) over a smaller pressure
~ATHAN and PAUL(6) arrived at a value of ',.10-11 eV/dyne cm-2 from pressure measure~ on a gold level in silicon. However, FAN . LIn observed an increase rather than a decrease lt optical energy gap with pressure.
METHOD
l'.t discussion of the apparatus, experimental JlliqucS, and treatment of sources of errors in ?lfvious paper(l) is also pertinent here. The , was an optically polished plane-parallel o! 25-35 n cm p-type silicon, 0·0109 in. Carbon disulfide was again used as hydraulic
TRANSMITTED ENERGY
"'"5000 ---¥."" \J "'"6000 ----'''''"' "'7000 ----'<'\ "'0Cl00 ----i"
using the second and third order of a 300 lines/mm blazed grating mounted in a Perkin-Elmer spectrometer in order to obtain sufficient resolution and angular dispersion. Suitable filters were used to eliminate overlapping orders.
The smallness of the shifts dictates that we examine carefully the following possible sources of error in the measurement.
(1) Source-intensity change with time. (2) Source-spectral-dependence change with time. (3) Detector-gain change with time. (4) Detector-spectral-sensitivity change with time. (5) Refractive-index changes with pressure:
(a) Sample-reflection correction. (b) Effect of sample-index change on beam
geometry. (c) Change of index of refraction of fluid.
WAVELENGTH
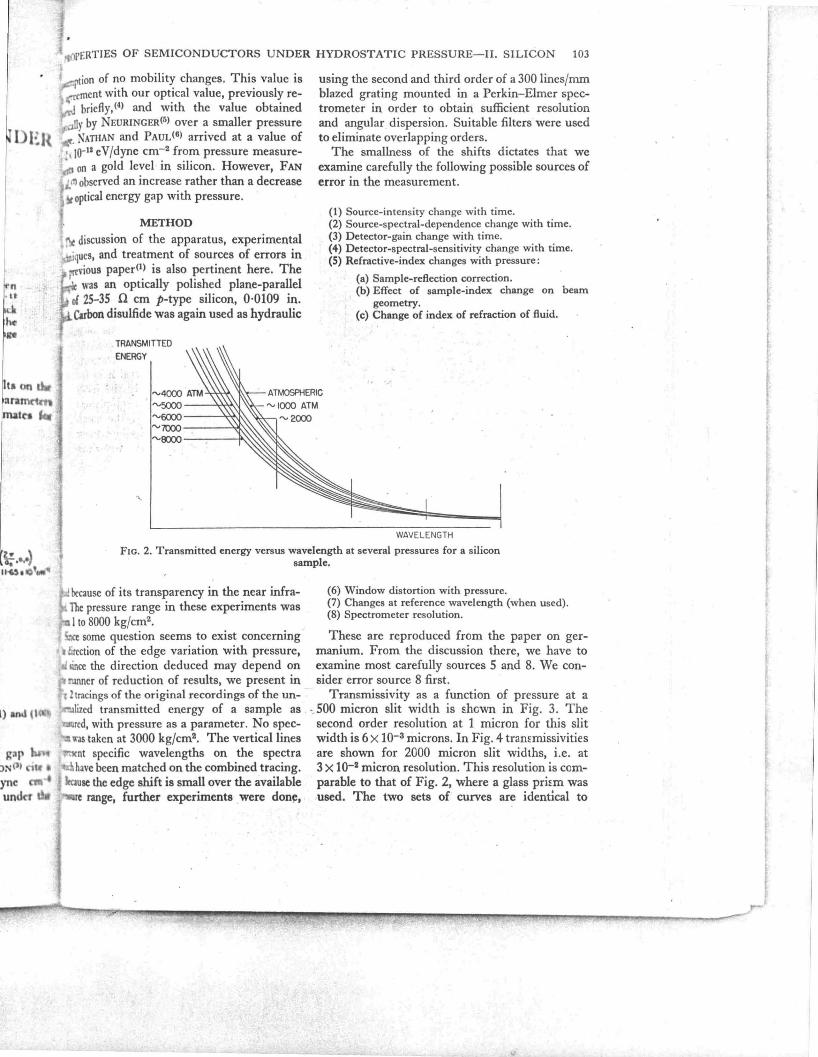
FIG. 2. Transmitted energy versus wavelength at several pressures for a silicon sample.
I because of its transparency in the near infraThe pressure range in these experiments was I to 8000 kg/cm2•
(6) Window distortion with pressure. (7) Changes at reference wavelength (when used). (8) Spectrometer resolution.
b:t some question seems to exist concerning These are reproduced from the paper on ger~ction of the edge variation with pressure, manium. From the discussion there, we have to since the direction deduced may depend on examine most carefully sources 5 and 8. We conNIIJ1cr of reduction of results, we present in sider error source 8 first.
,2 tracings of the original recordings of the un- Transmissivity as a function of pressure at a II'I:.Ilizcd transmitted energy of a sample as . .. 500 micron slit width is shown in Fig. 3. The
rcd, with pressure as a parameter. No spec- second order resolution at 1 micron for this slit was ·taken at 3000 kg/cm2• The vertical lines width is 6 X 10⁻³ microns. In Fig. 4 trammissivities ~nt specific wavelengths on the spectra are shown for 2000 micron slit widths, i.e. at
hhave been matched on the combined tracing. 3 X 10⁻² micron resolution. This resolution is comm use the edge shift is small over the available parable to that of Fig. 2, where a glass pri~m was
re range, further experiments .were don~, used. The two sets of curves are identical to
104
'70
WILLIAM PAUL and D . M. WARSCHAUER )'HOPERTIES
f .he paper on ge : i~nts were simil r.-fractive index ieorn several so spheric data co
~!MICRONSI
h' (eVI
within other experimental errors, such as lilt detector sensitivity variation. Thus, for resOllltir~ of 3 X 10⁻² microns or better, the same, presumabl; correct, shape and movement of the absorpti(~
• .1 edge IS observed.
We consider error source 5 next. Errors 5(b) anJ 5(c) remain uncorrected only ~f there is a stroni spectral-dependence of the flUid or samplc-indCl , variation. The change of the refractive index of silicon with pressure, calculated from a translatilJll of the index-versus-frequency curve along the frequency axis by the amount of the energy-gl'
10
; B ~
: 7
; . J
" ; 1 4
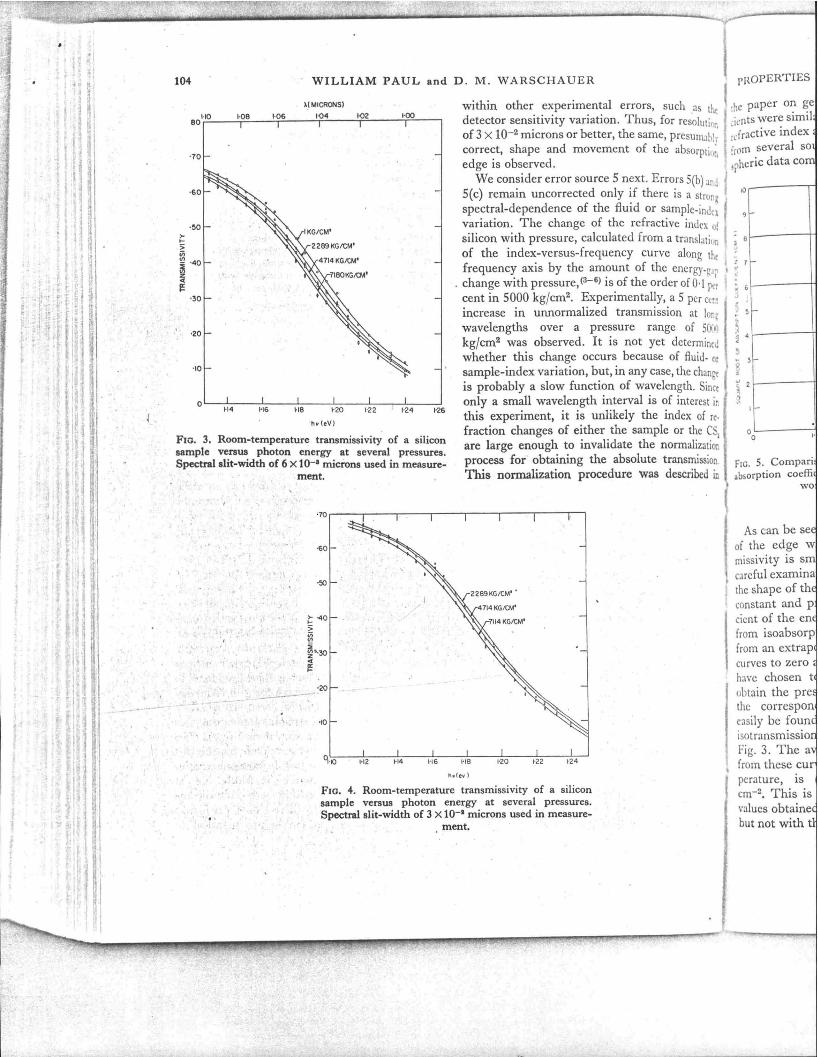
FIG. 3, Room-temperature transmissivitY of a silicon sample veraus photon energy at several pressures. Spectral slit-width of 6 X 10-' microns used in measure-
. change wi th pressure, (3-6) is of the order of 0· \ ~r cent in 5000 kg/cm2• Experimentally, a 5 per (cr.: increase in unnormalized transmission at 1001
wavelengths over a pressure range of S(}(t'j kg/cm2 was observed. It is not yet determincd whether this change occurs because of fluid- 0:
sample-index variation, but, in any case, the change is probably a slow function of wavelength. Sinct only a small wavelength interval is of interest ir. this experiment, it is unlikely the index of rc· fraction changes of either the sample or the C' are large enough to invalidate the normalizatiOt process for obtaining the absolute transmission This normalization procedure was described in
FIG. 5. Com pari 1bsorption coeffi
wo
-I :. "
" '.
. . -'
' ..
ment.
"
.---
·ror---~----'-----r----.----.-----r----'--
'20
'10
CI·IQ 1'12
FIG. 4. Room-temperature transmissivity of a silicon sample versus photon energy at several pressures. Spectral slit-width of 3 X 10⁻¹ microns used in measure-
ment,
missivity is s careful examina the shape of th constant and p cicnt of the en from isoabsorp from an extrap curves to zero have chosen t obtain the pre the correspon easily be foun isotransmissio Fig. 3. The a
• from these cu
I perature, IS
cm- 2, This is values obtaine but not with

Hansactlon h . . -
,,,, If'ERTIES OF SEMICONDUCTORS UNDER HYDROSTATIC PRESSURE-II. SILICON 105
!IIpcr on germanium. The absorption coeffiI litre similarly determined using values of the ",uI"C index and extinction coefficient averaged
J(\"cral sources. (8) Fig. 5 shows our atmo, . data compared to that of other workers. (?,9)
.. "0 1'3
h .. (evl
5, Comparison of silicon room-temperature low~n coefficients versus photon energy with the
work of other investigators.
RESULTS
, lJ em be seen from either Fig. 3 or 4, the shift . ~ edge wavelength at any value of trans
'IY is small as a function of pressure, and ";'.dexamination reveals no detectable change in
k'upc of the edge over this range of absorption ~I and pressure. Thus, the pressure coeffi-• of the energy gap can equally well be found isoabsorption or isotransmission curVes, or Ul extrapolation of the absorption coefficient
,I'IU 10 zero absorption coefficient. Although we '" chosen to use curves of transmissivity to ~ the pressure coefficient of the energy gap,
corresponding absorption coefficients can . be found by using Fig. 5. Fig. 6 shows an
-I:Insmission plot derived from the curves of "{ l. The average pressure coefficient obtained
these curves, which were taken at room tem-'"KUre, is (dEjdP)T= -1'3xlO-12 eVjdyne
I. This is seen to be .in agreement with the ob~ined by other workers Cited earlier,(3-8)
IIOt Wlth that of FAN et aI.(?) The fact that the
isotransrnission lines are approximately parallel to within the experimental accuracy verifies the lack of observable shape change in the absorption edge.
From the comparison of our absorptioncoefficient range with that obtained by other
"22 ·r-===::!:;:::::!==:C:=:2:=:;~==~ ',2,
·24
1'20 '29
1'19 '34
' 39
1' 18
_ 1' 17
~ :>
J< 1-16
1,1.5
1-14
I-IJ
PRESSURE KG leM'
FIG. 6. Isotransmission curves for silicon at room temperature.
workers, as shown in Fig. 5, we interpret our measurements as pertaining to indirect optical transitions between E" and Eo of Fig. 1. Eco may play a role as a virtual state in this process, but since its height above Eo and E" is large, any movement of this minimum should have only a very small .effect"" on the value of [d(Eo-E,,)/dP]T as determined from the experiment. The good agreement between · the above optical coefficient and the resistivity-derived values(3,6) indicates the extent of validity of this view. The more elaborate examination of the effects of pressure carried out on the germanium data has not been attempted here because of the lack of indication of any change in the shape of the absorption edge with pressure.
. • See the discussion of the effect of energy den ommator on absorption coefficient gi.ven in reference (1).
-'
106 WILLIAM PAUL and D . M . WARSCHAUER
CONCLUSIONS
Our earlier measurements of the pressure coefficient of the optical energy gap (dE/dP)T = -1· 3 X 10- 12 e V/dyne cm-2 have been confirmed, in agreement with resistivity measurcments(3.6) and with the value of NEURINGER. (5) The lack of change of shape of the absorption edge with pressure and the agreement of the coefficient with that derived from resistivity measurements indicate that the shift in the range of absorption measured can be attributed primarily to a simple displac{ment of the (100) conduction-band minima relative to the (000) maximum in the valence band.
Acknowledgements-We wish to thank several people for help in this work. Professor HARVEY BROOKS gave in
~valuable aid and guidance. Professor P. W. BRIDGMAN provided much pressure equipment and the penefit of his long experience. BeIl Telephone Laboratories and Mr. G. L. PEARSON generously supplied the samples. ARTHuR C. SMITH, MARSHALL I. NA11JAN and MBLVIN G. HOLLANt)''Yere available for advice, discussion, and encoW'1l8ement whenever needed.
." r
"
'( '" ','
'..-
, -LL-- -.,......-
.... ---- '.
"{ .'.
...
. ':
• ':11 T
.. - " . . '
: . '" :
' .
. , ./'
• ,I,
, .' . . , ..
"
' .
.J
REFERENCES
1. PAUL W. and WARSCHAUER D. M. J. Phys. eh", Solids 5, 99 (1958).
2. BROOKS H. AdvG1lces in Electrollics and nm,.
J. l'hys. Chem. So/
Physics Vol. 7. Academic Press, New York (19;' 3. PAUL W. and PEARSON G. L. Phys. Rev. 98 I:"
(1955). ' '. I 4. 'WARSCHAUER D. M., PAUL W. and BROOKS II. p~ .
SaM PR(
Rev. 98, 1193 (1955). " 5. NEURINGER L. J. Bull. Amer. Phy •. Soc. 2,134 (1 9;'
. 6. NATHAN M. and PAUL W: Bull. Amer. Ph}, •. SO( ' , 134 (1957). . ..
. 7. FAN H. Y., SHEPHERD M. L. and SPITZER II Photoconductivity Conference (Edited by It G BRECKENRIDGE, B. R RUSSELL, and E. E. HAII\
Wiley, New York (1956). Note COmments It
garding silicon at end of paper. 8. PFESTORF G. Ann. Phys, Lpz. 81, 906 (1926).
...
BRATTAIN W. H. and BRIGGS H. B. Phys. RtV. it 1705 (1949). "\
BRIGGS H. B. Phys. Rev. 77, 727 (1950). Moss T. S. Photoco11ductivity i11 the Eltm(?;.~
Academic Press, New York (1952). 9. DASH W. C. and NEWMAN R Phys. Rev. 99, 11!'
(1955). MACFARLANE G. G. and ROBERTS V. Phys. Rro. 91.
1865 (1955).
Staff M!
Abstractentire ran magnetic I
the lattice cm3/g beir served for of lithium the mome upon the J
pared to tJ tetragonal
1.
TilE electrical,
i properties of the the formula 1 subject of severa co-workers (I) ob~
heated together reaction takes pI:
rERWEY prepar, x < 0·3 and stL and lattice pararr lion of composit with the cubic length of the unit increasing conce~ and MITCIIELL(2)
tion of the lattice
• The research if Army, Navy, and ~!assachusetts Inst
t Now with RC