opportunities to practically scale-up perennial feedstocks
TRANSCRIPT

Opportunities to practically scale-up perennial feedstocks
Vance N. Owens (and many others)North Central Sun Grant CenterSouth Dakota State University
University of Minnesota, 8 Dec. 2014

Issues
• Species (multiple and multiple use)• Time• Establishment• Cost• Insects• Weeds• Land/soil (marginal??)• Productivity• Market

The Prairie Farm Story
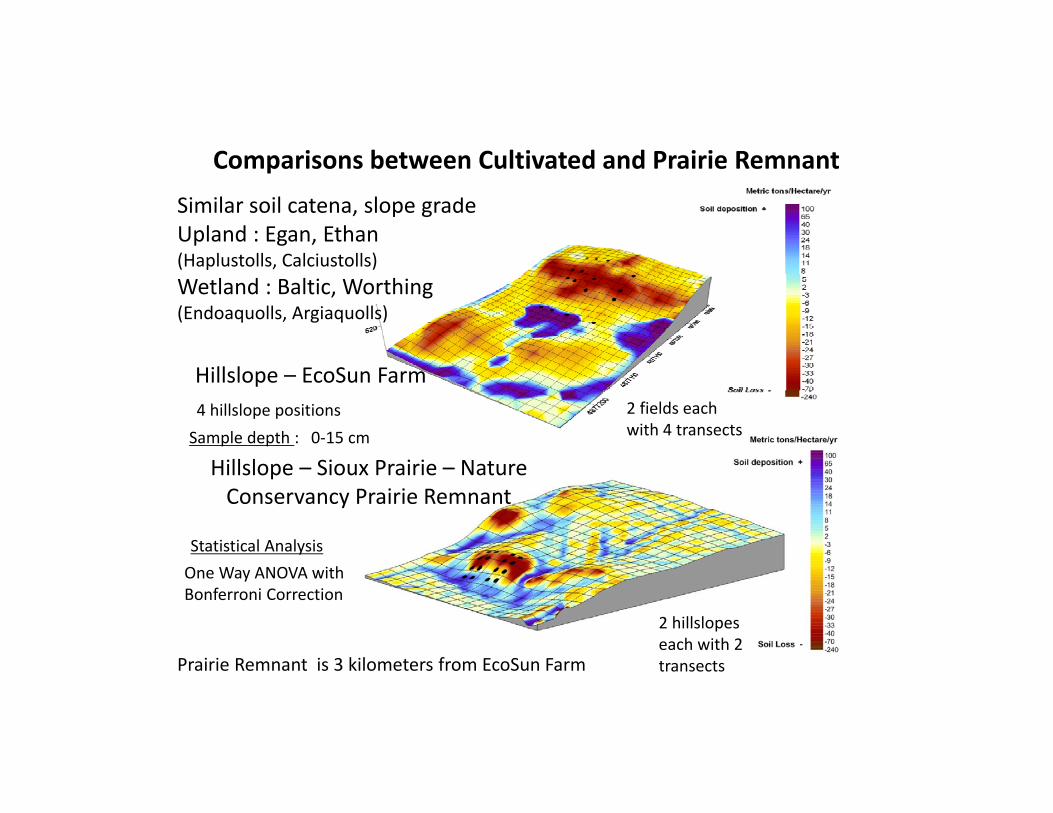
Hillslope – EcoSun Farm
Hillslope – Sioux Prairie – Nature Conservancy Prairie Remnant
Comparisons between Cultivated and Prairie Remnant
Prairie Remnant is 3 kilometers from EcoSun Farm
Similar soil catena, slope grade Upland : Egan, Ethan (Haplustolls, Calciustolls)Wetland : Baltic, Worthing(Endoaquolls, Argiaquolls)
2 fields each with 4 transects
2 hillslopeseach with 2 transects
Sample depth : 0‐15 cm4 hillslope positions
One Way ANOVA withBonferroni Correction
Statistical Analysis
0 50 100 150 200
Footslope
Midslope
UpperShoulder
Summit
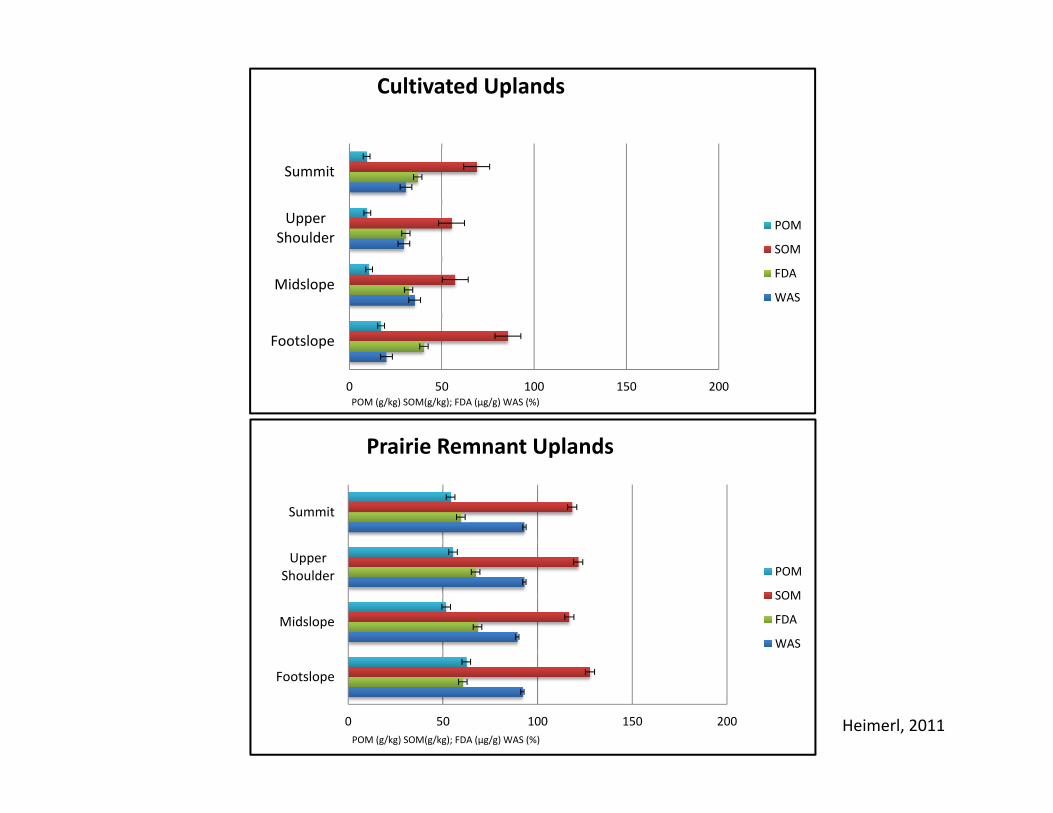
Cultivated Uplands
POM
SOM
FDA
WAS
POM (g/kg) SOM(g/kg); FDA (µg/g) WAS (%)
0 50 100 150 200
Footslope
Midslope
UpperShoulder
Summit
Prairie Remnant Uplands
POM
SOM
FDA
WAS
POM (g/kg) SOM(g/kg); FDA (µg/g) WAS (%)Heimerl, 2011

0 50 100 150 200
Low Point
Mid Point
High Point
Cultivated Wetlands
POM
SOM
FDA
WAS
POM (g/kg) SOM(g/kg); FDA (µg/g) WAS (%)
0 50 100 150 200
Low Point
Mid Point
High Point
Prairie Remnant Wetlands
POM
SOM
FDA
WAS
POM (g/kg) SOM(g/kg); FDA (µg/g) WAS (%)
Heimerl, 2011

Summary
• 40% reduction in SOM in the past 100 years• Distribution of SOM across hill slopes under cultivation
suggests significant erosion in the past 100 years• Decreased carbon recycling and structural stability
(reduced FDA, lower POM, lower WAS) at the cultivated site
• 60% reduction in SOM observed in cultivated vs. prairie remnant wetlands
• Bottom Line: The cultivated landscape has significant potential for rehabilitation/restoration

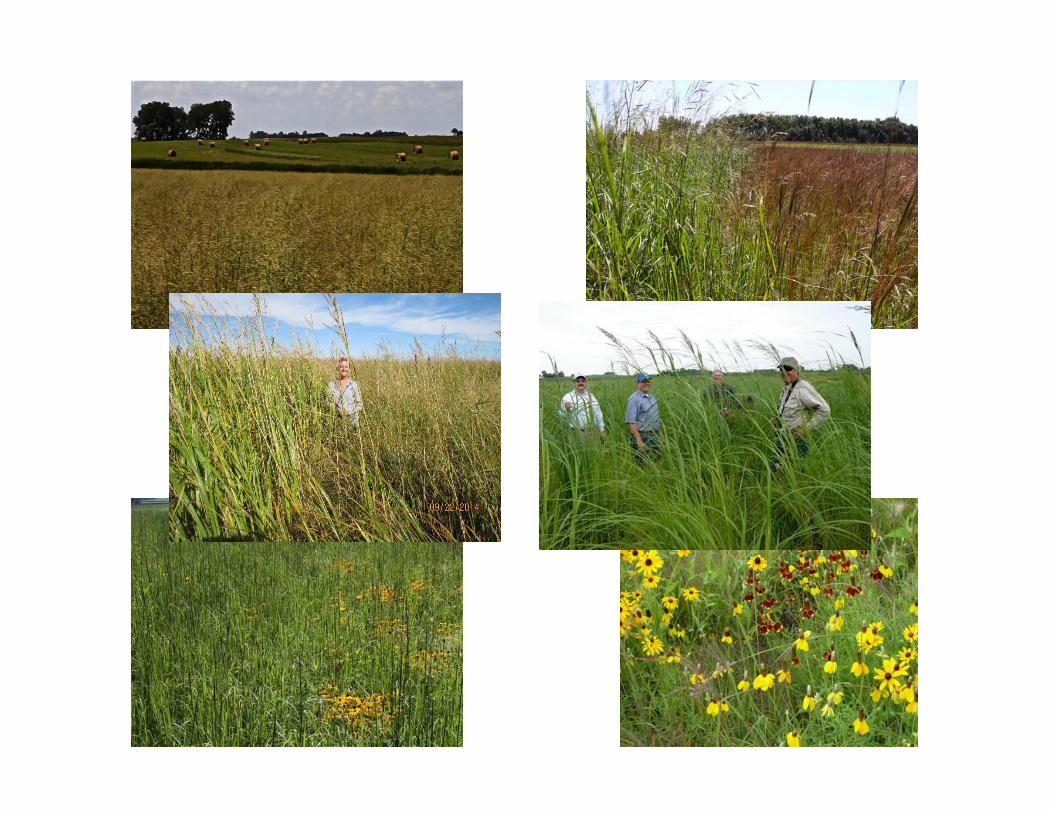
EcoSun Prairie Farms, Inc.

Prairie Farm Experiment
• 650 acre row crop farm near Brookings converted to native grassland and restored wetlands
• Started in 2008• Goal to determine the environmental
improvements and economic viability of “commercial” grassland grown on cropland soils

In the beginning…
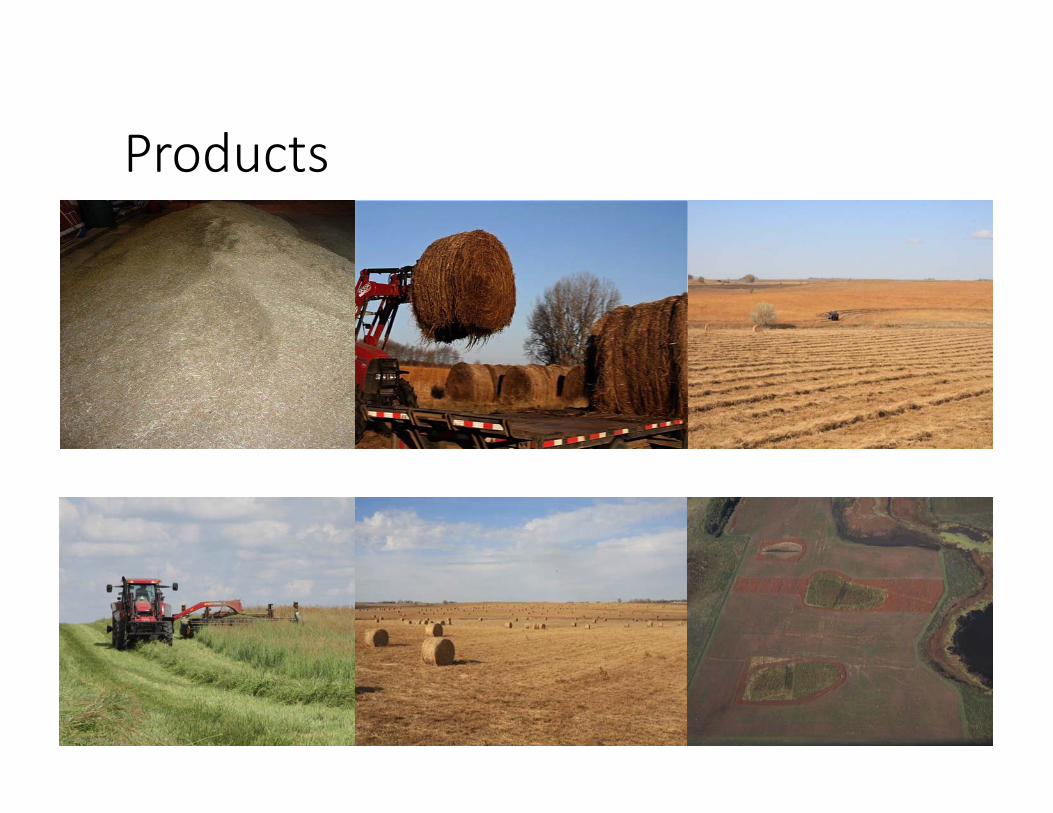
Products

Products


Farm‐scale (left) and small plot (right) yields a the Prairie Farm
Field‐scale harvest of native grasses
Year Species SeasonYield
(Mg/ha)Area (ha)
2010 BB mix Summer 4.9 23
2011 BB mix Summer 4.5 8
2011 BB/SW Autumn 6.2 43
2012 BB mix Summer 3.8 13
2012 BB mix Autumn 4.2 36
2012 SW Autumn 5.8 23
2012 PCG Autumn 8.3 0.4

15 different species of pollinators (bees, flies, and beetles) recently recorded at Brookings.
Some other benefits…
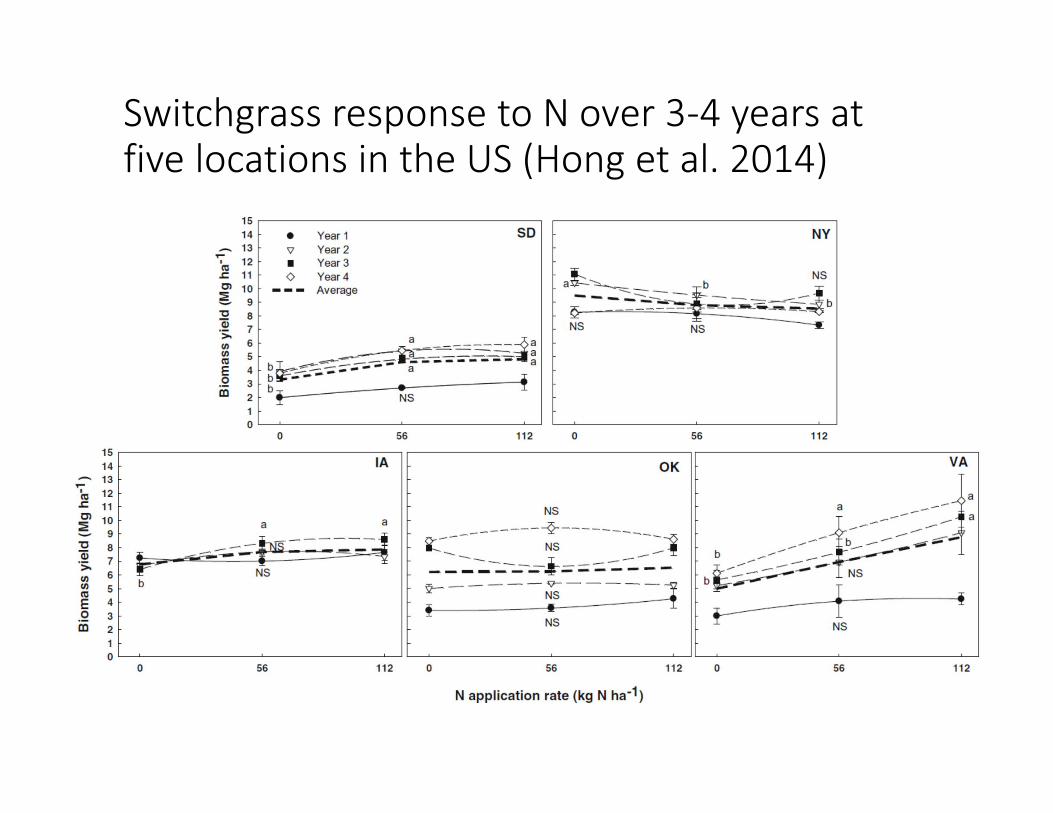
Switchgrass response to N over 3‐4 years at five locations in the US (Hong et al. 2014)
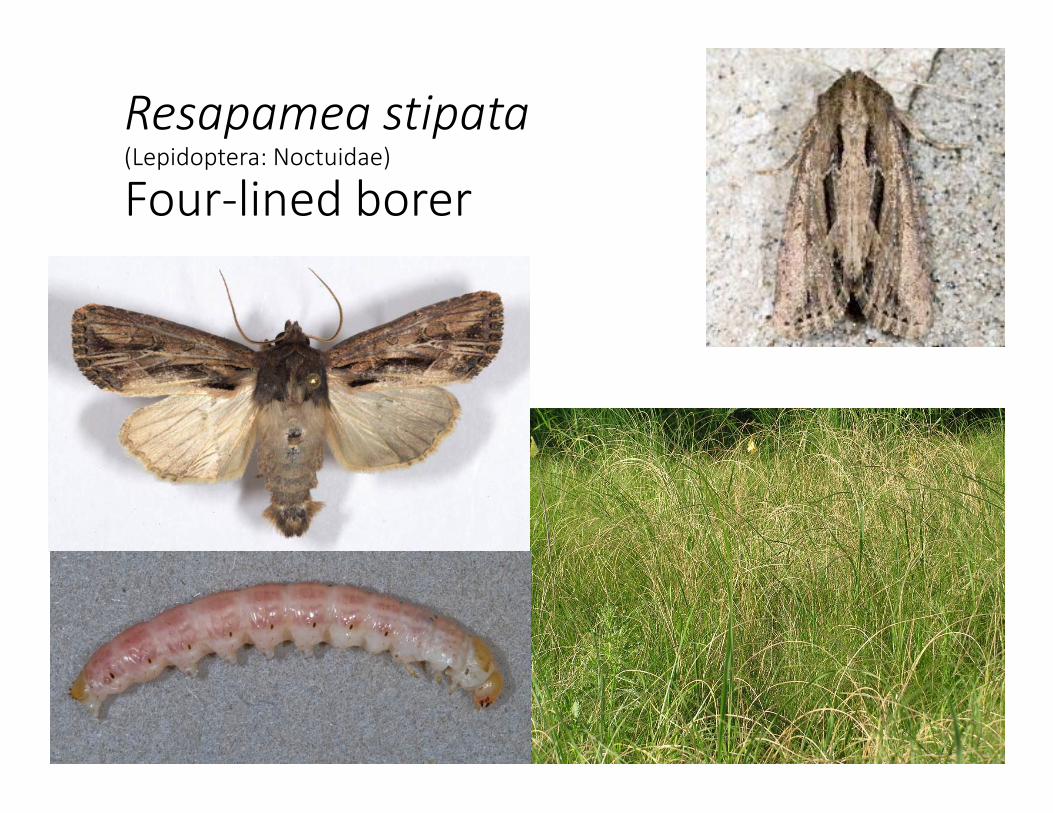
Resapamea stipata(Lepidoptera: Noctuidae)
Four‐lined borer

Healthy tillers (lt.) and tillers killed by R. stipata (rt.); Brookings, Sept. 2011
~40% infestation rate
Infested tiller mass ~ 40% of normal tiller mass
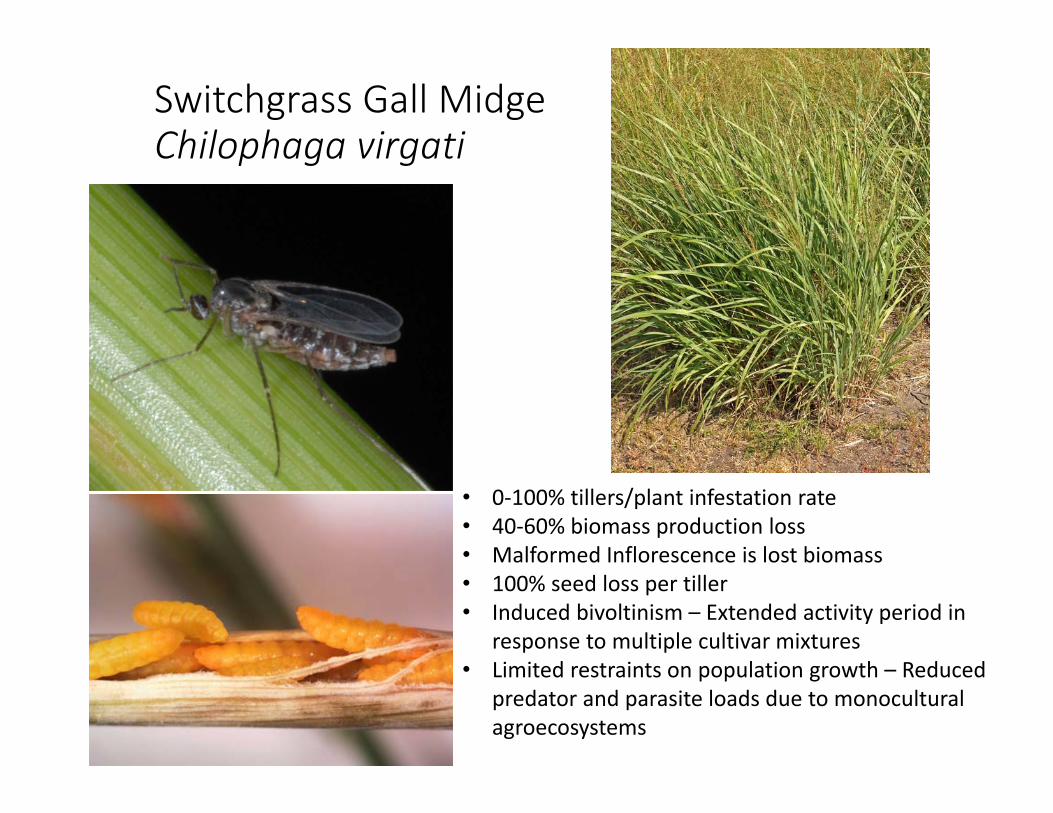
• 0‐100% tillers/plant infestation rate• 40‐60% biomass production loss• Malformed Inflorescence is lost biomass• 100% seed loss per tiller• Induced bivoltinism – Extended activity period in
response to multiple cultivar mixtures• Limited restraints on population growth – Reduced
predator and parasite loads due to monoculturalagroecosystems
Switchgrass Gall MidgeChilophaga virgati

`Cave‐in‐Rock’ Impact4 yr old exemplar from Aurora, SD, September 2012
Tillers: N = 38Normal = 21 55%Midge infested = 17 45%
35% biomass reduction12.7‐14.3% infestation rate among 10 genotypes
Boe & Gagné (2011)

Soil and Water Quality

Manure utilization on switchgrass (Lee et al., 2007)
2001-2002 2003-2004N source & rate Total SW Total SW
---------------- Mg ha-1 ----------------0N 5.6 5.0 6.3 5.1 112N 8.5 6.5 10.1 5.9 112M 9.7 8.9 9.7 7.6 224N 8.8 6.1 10.1 5.3 224M 7.8 6.4 10.5 7.5 LSD (0.05) 2.3 2.1 2.6 NS

Nitrate-N loss over four years in MN(data from Randall and Mulla, 2001)
0
50
100
150
200
250
Continuous corn Corn‐soybean Alfalfa CRP
Nitrate‐N loss (kg ha
‐1)
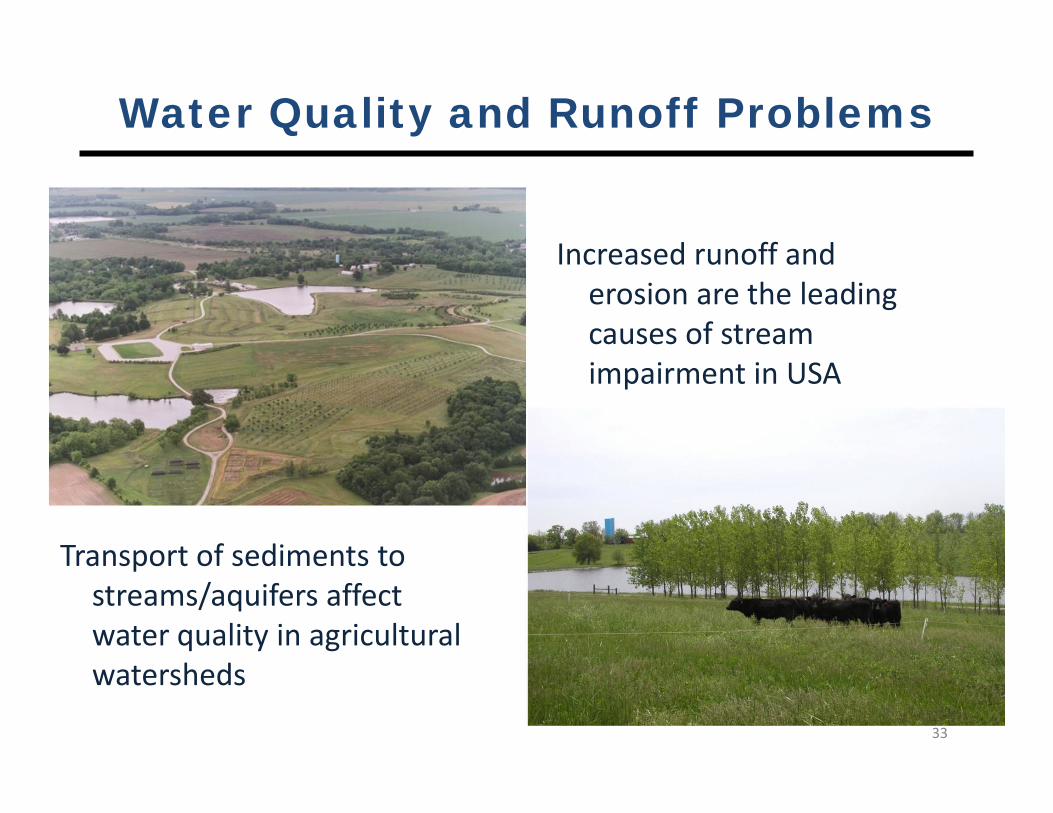
Increased runoff and erosion are the leading causes of stream impairment in USA
Transport of sediments to streams/aquifers affect water quality in agricultural watersheds
33
Water Quality and Runoff Problems

Switchgrass root biomass at various depths one and three years after establishment (Bristol, SD)
2011
0.0 0.5 1.0 1.5 2.0 2.5 3.0
Soil
dept
h (c
m)
0
15
30
45
60
100
NS
NS
NS
2009
Root biomass (Mg ha-1)0.0 0.5 1.0 1.5 2.0 2.5 3.0
Soil
dept
h (c
m)
0
15
30
45
60
100
N rate 0 kg N ha-1
N rate 112 kg N ha-1
NS
NS
NS
NS
NS
NS
NS

Monthly NO3 concentration in leachate collected from lysimeters placed 1 m deep in a switchgrass stand in northeastern SD (2009-2012)
2010
Month
Jun. Jul. Sep. Oct. Nov.
NO
3 co
ncen
trat
ion
(mg
L-1 )
0.00.51.01.52.02.53.03.54.04.55.0
N 0 kg N ha-1N 56 kg N ha-1N 112 kg N ha-1
NSLSD=0.47
LSD=0.58
LSD=1.02
LSD=1.11
2009
MonthAug. Sep. Oct.
NO
3 co
ncen
trat
ion
(mg
L-1 )
0
1
2
3
4
5
6
7
8
N 0 kg N ha-1
N 112 kg N ha-1
NS
NS
NS
2011
Month
May Jun. Jul. Aug. Sep. Oct.NO
3 co
ncen
trat
ion
in le
acha
te (m
g N
L-1
)
0.0
0.4
0.8
1.2
1.6
2.0
0 kg N ha-1
56 kg N ha-1
112 kg N ha-1
NSLSD0.05=0.14
NS
NS
LSD0.05=0.08
LSD0.05=0.08
2012
Month
May Jun. Jul. Aug.NO
3 co
ncen
trat
ion
in le
acha
te (m
g N
L-1
)
0.0
0.5
1.0
1.5
2.0
2.5
3.0
3.5
4.0
0 kg N ha-1
56 kg N ha-1
112 kg N ha-1
NS LSD0.05=0.16NS
NS