opportunities beyond the piloting phase - pilot auction … · · 2016-11-04opportunities for...
TRANSCRIPT

1
Pilot Auction Facility: Opportunities Beyond the Piloting Phase

2
Authors:
Climate Focus
Szymon Mikolajczyk
Sandra Greiner
Thiago Chagas
Tobias Hunzai
Hilda Galt
Jelmer Hoogzaad
Theo Varns
Leo Mongendre
Ecofys
Catherine Sachweh
Maarten Neelis
Ian Trim
Noémie Klein
Tarik El-laboudy
Jialiang Zhang
Power Auctions
Lawrence Ausubel
Christina Aperjis
Carbon Rooster
Albert de Haan
Carnegie Consult
Toon Luttikhuis
Rien Strootman
The authors would like to take the opportunity to gratefully acknowledge the World Bank team comprising Caroline Ott,
Scott Cantor, Felicity Creighton Spors, Eduardo Dopazo, Klaus Oppermann, and Claudia Barrera for their ongoing
guidance, insights, and expertise throughout the course of developing this report.
Climate Focus, B.V.
Sarphatikade 13,
1017 WV Amsterdam,
The Netherlands
Ecofys Netherlands, B.V.
Kanaalweg 15G
3526 KL Utrecht
The Netherlands
Power Auctions LLC
3333 K St NW #425
Washington, DC 20007
United States
Carnegie Consult, B.V.
Corner Plaza B, 12th floor
3606 AK Maarssen
The Netherlands
This report has been prepared by:
With contributions from:

3
Contents
1. Contextual Setting………………………………………………………………………………...6
The first auction …………………………………………………………………………………………….8
The second auction………………………………………………………………………………………...9
2. Design Considerations …………………………………………………………………………12
3. Opportunities for Replication and Scale-Up ……………………………………………….26
Waste Water Treatment from Palm Oil…………………………………………………………………28
Rice Cultivation……………………………………………………………………………………………29
Enteric Fermentation ……………………………………………………………………………………..31
Coal Mine Methane ………………………………………………………………………………………33
Energy Sector……………………………………………………………………………………………..36
Industrial Sector …………………………………………………………………………………………..38
Transport Sector …………………………………………………………………………………………39
Energy Efficiency in Buildings…………………………………………………………………………...41
Non-CO2 Industrial Gas Emissions……………………………………………………………………..42
Forestry and Land Use…………………………………………………………………………………...43

4
List of Figures
Figure 1: Results of the first pilot auction held in July 2015 ............................................................................... 8
Figure 2: Results of the second pilot auction held in May 2016 ........................................................................ 9
Figure 3: Assessing suitability for replication and scale-up of the PAF model ................................................ 11
Figure 4: Opportunities for replication and scale-up of the PAF ...................................................................... 13
Figure 5: Price guarantee options in different markets .................................................................................... 21
Figure 6: Rationale for linking auctioning to complementary financial products .............................................. 24
Figure 7: Overview of global methane emission sources ................................................................................ 27
Figure 8: Overview of global (direct) GHG emissions sources by sector ........................................................ 35
List of Tables
Table 1: Overview of common types of risks, its impacts and available risk reduction
instruments ....................................................................................................................................................... 25
Table 2: Suitability for replication and scale-up across methane abatement opportunities ............................. 27
Table 3: Suitability for replication and scale-up of the PAF model across non-methane
GHG reducing sectors ...................................................................................................................................... 36
Table 4: Abatement cost estimates for the power sector, per technology ....................................................... 36

5
Abbreviations
AWD Alternate Wetting and Drying
BMUB German Federal Ministry for the Environment, Nature Conservation, Building and Nuclear Safety
BNDES Brazilian Development Bank
CAPEX Capital Expenditures
CCAC
CCS
Climate and Clean Air Coalition
Carbon Capture and Storage
CDM Clean Development Mechanism
CER Certified Emission Reduction
CSR Corporate Social Responsibility
EPA Environmental Protection Agency
EPC Energy Performance Contract
ERPA Emission Reduction Purchase Agreement
ESCOs Energy Service Companies
FAO Food and Agricultural Organization
GCF Green Climate Fund
GHG Greenhouse Gas
GS Gold Standard
HFCs Hydrofluorocarbons
IEA International Energy Agency
INDCs Intended Nationally Determined Contributions
IPCC Intergovernmental Panel on Climate Change
JI Joint Implementation
LEED Leadership in Energy and Environmental Design
MRV Monitoring, Reporting and Verification
NAMA Nationally Appropriate Mitigation Action
NDC Nationally Determined Contributions
NGOs Non-Governmental Organizations
ODS Ozone Depleting Substances
OECD Organization for Economic Co-operation and Development
OPEX Operational Expenditures
PAF Pilot Auction Facility for Methane and Climate Change Mitigation
PAFERNs Pilot Auction Facility Emission Reduction Notes
PAT Perform, Achieve and Trade
PFCs Perfluorocarbons
PoAs Programme of Activities
POME Palm Oil Mill Effluent
PPA Power Purchase Agreement
PV Photovoltaic
REDD Reducing Emissions from Deforestation and forest Degradation
RSPO Roundtable for Sustainable Palm Oil
SDG Sustainable Development Goal
SEA Southeast Asia
UNEP United Nations Environmental Program
UNFCCC United Nation Framework Convention on Climate Change
VAM Ventilation Air Methane
VCS Verified Carbon Standard
VCUs VCS Carbon Units
VER Verified Emission Reduction

Contextual Setting
6
Objective of this report The objective of this report is to identify opportunities for achieving greenhouse gas (GHG) mitigation through the climate finance model developed by the Pilot Auction Facility for Methane and Climate Change Mitigation (PAF). The PAF’s first two pilot auctions have demonstrated strong interest and a clear demand from the private sector for climate finance delivered through price guarantees. Furthermore, auctioning has proven an efficient method for allocating price guarantees to projects with the lowest abatement costs. Recognizing both the need for innovative mechanisms that support countries in achieving their Nationally Determined Contributions (NDCs), as well as the widespread availability of low-cost abatement opportunities, this report looks at the replication and scale-up potential of the PAF model. This report also considers the contexts in which the PAF model could effectively incentivize emission reductions and broader sustainable development objectives. Specifically, this report assesses mitigation sectors most suitable for the PAF model, potential adjustments to the model in order to maximize results, and the type of actors that could participate in similar auctions, whether as bidders or as potential funders.
The Pilot Auction Facility In 2012, at the request of the G8, the World Bank convened an international group of experts – the Methane Finance Study Group – to identify innovative results-based finance mechanisms that would incentivize investment in methane abatement activities. A year later, the Study Group issued a report1 recommending the creation of a methane abatement facility that would auction put options to guarantee a price floor on independently verified emission reductions.2 To maximize impact and cost-effectiveness, the facility would focus on a subset of the 1,200 existing methane projects identified in the report. Following this recommendation, the World Bank operationalized the PAF in 2014, supported by contributions from four donors, also referred to as the PAF Participants: the German Federal Ministry for the Environment, Nature Conservation, Building and Nuclear Safety (BMUB); the Swedish Energy Agency; the Climate Cent Foundation (Switzerland); the Swiss State Secretariat for Economic Affairs (SECO); and the United States Department of State.
1 Methane Finance Study Group Report. Using Pay-for-Performance Mechanisms to Finance Methane Abatement. 2013.
2 The use of competitive auctions was also informed by previous studies on financial options: Willian Pizer. Seeding the Market – Auctioned Put Options for Certified Emissions Reductions. 2011; Michael Grubb and David Newbery. Pricing Carbon for Electricity Generation: National and International Dimensions. 2008; and Roland Ismer and Neuhoff Karsten. Commitments through Financial Options: A Way to Facilitate Compliance with Climate Change Obligations. 2006.
1 . Contextual Setting

Contextual Setting
7
The Climate and Clean Air Coalition (CCAC) and the United States Environmental Protection Agency also provided early encouragement and technical guidance on establishing the PAF. As a pilot facility, the PAF’s mandate is to test the concept and effectiveness of auctioning price guarantees, thereby promoting new financing tools that can potentially be replicated and scaled-up in a range of sectors. The PAF aims to deliver climate finance to stimulate private investment in projects that reduce GHG emissions while maximizing the impact of public funds. With a capitalization of USD 53 million, the PAF has hosted two auctions, targeting methane abatement activities. At the time of writing, no formal decision has been made regarding the timing, sectoral scope, and auction format of the third auction. The key objective of the pilot auctions is to demonstrate that the auctioning of price guarantees linked to future verified GHG mitigation results represents a cost-effective climate finance mechanism. As such, the PAF aims to incentivize private sector investment in climate change in developing countries by providing a guaranteed floor price on carbon credits, while also using auctions to allocate scarce public resources for climate change mitigation in the most efficient manner. The lessons learned through the series of pilot auctions are intended to deliver valuable insight to other entities – both public and private – seeking to adopt a similar results-based payment mechanism to drive GHG mitigation action.3
There are two central components to the PAF model. The first consists of price guarantees, which deliver a minimum price (or price floor) linked to a GHG mitigation result. In the pilot auctions, this price guarantee is structured in the form of a zero-coupon puttable bond (also known as a PAFERN4), building on bond infrastructure already in place within the World Bank Group. As a zero-coupon bond, price guarantees auctioned under the PAF do not pay owners any interest. Rather, upon bond maturity, owners can choose to receive a pre-defined payment per unit of verified GHG emission reductions. The bonds function as put options, meaning that holders have the right but not the obligation to sell future emission reductions to the facility at a pre-determined price (called the ‘strike price’). They can also trade these price guarantees with other interested parties, increasing the likelihood that the auction achieves the maximum volume of emissions reductions. The second component is an auction platform that serves as a competitive and transparent means of allocating and determining the value of price guarantees, whereby auction bidders communicate the quantities of GHG emission reductions that they are willing to sell at various prices. Bidders may include project developers that directly oversee mitigation projects as well as intermediaries that aggregate smaller project owners. As opposed to traditional Emission Reduction Purchase Agreements (ERPAs), the GHG mitigation projects are not known at the time of bidding. Potential bidders, however, must comply with certain integrity-related requirements in order to participate in the auction.
3 A comprehensive summary of the first auction including lessons learned is available at http://www.pilotauctionfacility.org/Lessons-Learned. 4 Pilot Auction Facility Emission Reduction Notes.
The central components of the PAF model are price guarantees and an auction platform.

Contextual Setting
8
The first auction The PAF successfully concluded its first auction in July 2015. The auction drew twenty-eight participants from seventeen countries and awarded price guarantees to twelve bidders. In order for an auction winner to redeem the price guarantees, the projects underlying emission reductions must meet a set of requirements relating to the type and location of the abatement activity, as well as the time period over which the emission reductions are generated. The first auction targeted methane abatement activities registered under the Clean Development Mechanism (CDM) that applied one of thirty-five eligible methodologies, provided the offered volumes were not already subject to a purchase agreement contract with another party. Figure 1: Results of the first pilot auction held in July 2015
For this first pilot auction, the PAF auctioned put options using a reverse auction format in which the option premium was announced ahead of the auction and the bidders bid down the strike price.5 Option premium refers to the price paid by the auction winners to purchase the put option. The strike price is the price the PAF pays when the put option matures, or in other words, the price floor for the awarded volume of eligible emission reductions. The effective payment received by a winner is the strike price minus the premium. As a result of the first auction, all winning bidders secured a price guarantee of USD 2.40 per ton of carbon dioxide equivalent (tCO2e). Winning bidders received a series of guarantees with five consecutive maturity dates, starting with November 30, 2016 and ending in November 30, 2020. The price for the option premium – fixed at the onset of the auction – was USD 0.30 per tCO2e, meaning that winning bidders received a net price guarantee of USD 2.10 per tCO2e. This represented a fourfold increase over the market price for a Certified Emission Reduction (CER) issued under the CDM, which traded at EUR 0.45 on the auction date.6
5 ‘Bidding down the strike price’ refers to the process whereby auction participants reduce the price they are willing to accept as the auction progresses. The first auction was concluded after 11 rounds. 6 Global Environmental Exchange data.

Contextual Setting
9
Overall, the first auction allocated USD 20.9 million in climate finance for 8.7 million tons of emission reductions.7 The first auction also raised USD 2.6 million in option premiums, which was added to the PAF budget.
The second auction The second auction was held on May 12, 2016 and targeted the same types of methane abatement activities as the first auction but expanded eligibility beyond the CDM to include activities registered under the Verified Carbon Standard (VCS) and the Gold Standard (GS). The second pilot auction also tested an alternative auction format to deliver price guarantees: a forward auction. In this format, the strike price was fixed at a price of USD 3.50 per tCO2e and bidders bid up the option premium they were willing to pay to claim the PAFERNs. Twenty-one bidders from twelve countries participated in the auction, nine of which won price guarantees. The final clearing price for the premiums was USD 1.41 per tCO2e, resulting in a net price guarantee that is almost identical to the result of the first auction – USD 2.09 per tCO2e. This was considerably higher than the CER price of EUR 0.42 on the auction date.8 Winning bidders received a series of guarantees with four consecutive maturity dates, starting with November 29, 2017 and ending with November 30, 2020. Again, auction winners are free to sell carbon credits on the market if they are able to find buyers willing to pay a higher price, or they can trade the options on the secondary market. Overall, the second auction allocated USD 19.98 million in climate finance for a total 5.7 million tons of emission reductions. It also raised USD 8.0 million in option premiums, which has been added to the PAF budget. Figure 2: Results of the second pilot auction held in May 2016
7 For a more comprehensive overview of the results of the first auction, refer to: http://www.pilotauctionfacility.org/first-auction.
8 Global Environmental Exchange data.

Contextual Setting
10
With a capitalization of USD 53 million, the World Bank Group foresees one additional auction within the mandate of the current facility. At the time of writing, no formal decision has been made regarding the timing, sectoral scope, and auction format of the third pilot auction.
Replicating and scaling up the PAF model As outlined above, the first two pilot auctions targeted a limited number of mitigation activities, namely methane emissions from landfill, wastewater and animal waste sites. To assess the potential for replication and scale-up, this report reviews global GHG emissions sources with the aim of identifying mitigation opportunities that can effectively be unlocked through auctions for price guarantees. To determine suitability for the PAF model, this report conducts a systematic analysis of major GHG emission sources. In order to match the categorization of three key data sources – the IPCC,9 the IEA,10 and the UNDP DTU11 – this report considers emissions from the following sectors:
Methane abatement opportunities not covered in the three pilot auctions, including wastewater treatment of palm oil mill effluent, rice cultivation, enteric fermentation, and coalmine methane;
Energy;
Energy use in the industrial sector;
Transport;
Buildings;
Non-combustion industrial gases: N2O, HFCs, PFCs, SF6; and
Forestry and land use. This report outlines the considerations associated with replicating and scaling-up the PAF model, and offers preliminary ideas on the design features that can maximize the effectiveness of climate finance across these sectors. Discussion elements relevant to the PAF model include the type of price guarantee used (put option versus other instruments), the auctioning format (reverse versus forward auctions, uniform versus pay-as-bid auctions, etc.), the design (scale of capitalization, eligibility criteria of the auction, and auction parameters), and the auctioned metric (the result based metric that will be used and become the basis for the price guarantee). Furthermore, besides targeting existing projects, the PAF model could also cater to new mitigation activities. Finally, the PAF model could also be tailored to various potential climate financiers (called ‘funders’ throughout this report), including governments using an auction approach to disburse climate finance in support of NDC implementation, or certain private sector actors interested in supporting sustainable development. The assessment framework applied to determine the suitability of the PAF model for each of these emissions sources is based on seven assessment criteria:(i) the price responsiveness of the targeted sector to a price guarantee; (ii) the availability of monitoring, reporting and verification (MRV) standards; (iii) the abatement potential; (iv) abatement costs; (v) the availability of an existing pipeline of projects; (vi) the sustainable development impacts; and (vii) the regulatory context.
9 2006 IPCC Guidelines for National GHG Inventories.
10 IEA. Energy Technology Perspectives 2015 - Mobilising Innovation to Accelerate Climate Action. 2015.
11 UNEP DTU. CDM/JI Pipeline Analysis and Database. 2016.

Contextual Setting
11
Figure 3: Assessing suitability for replication and scale-up of the PAF model
The contents of this report are as follows: Chapter 2 elaborates on considerations for extending the PAF model to new areas of GHG mitigation, including applying alternative performance metrics, tailoring auction formats, or adapting the PAF model to different types of funders. Chapter 3 features a concise, high-level summary of the sectoral assessment performed across the seven aforementioned GHG emission sources, highlighting barriers and opportunities for scaled-up mitigation action and the role the PAF model can have in reviving stalled or unlocking new abatement potential in these sectors.
Design Considerations
12
While the PAF model has demonstrated its suitability to assist and revive stranded methane abatement projects, its novel pay-for-performance approach may also yield similar positive results in other sectors. This chapter discusses the possible new frontiers for extending the PAF model, including opportunities for tailoring the model to incentivize mitigation action in areas that have been largely untapped.
Existing vs. new projects The first two pilot auctions targeted existing projects, or those that were dormant or incomplete due to low prices for carbon credits. These auctions relied on extensively tested and readily available MRV frameworks, and a payment metric of tons of carbon dioxide equivalent. In moving beyond the pilot phase and evaluating possibilities for a wider application of the PAF model, this report considers three categories of project activities:
(i) Existing projects under carbon crediting schemes These projects require financial support to cover operational expenditures (OPEX) associated with the abatement activity. With currently low carbon prices, carbon markets offer a large pipeline of mitigation projects across various sectors that are at risk of discontinuing operations or that have already stalled. Given the strong MRV framework in place and ability to link performance-based payments to third-party verified emission reductions, existing projects provide opportunities for replication and scale-up, and for bridging the pre-2020 emissions gap.12
(ii) New projects under carbon crediting schemes Building on the credible MRV framework delivered under existing carbon crediting schemes, the PAF model could also be used to channel funding to new projects developed under the CDM or other carbon standards. Key considerations in exploring the PAF’s suitability for these activities is whether the model can help to overcome barriers in the investment decision and thereby contribute to raising finance for capital expenditures (CAPEX). Up-front payments (e.g. in the form of grants or concessional loans) derived from climate finance could be made available in conjunction with price guarantees to reduce funding gaps for project implementation and to assist with financial closure. Linking auctioned price guarantees to credit guarantees or insurance products could be another form of support.
(iii) New projects outside of carbon crediting schemes Venturing beyond established carbon crediting schemes and tons of carbon dioxide equivalent as the results-based metric creates both new challenges and opportunities. On
12 The UNEP Emissions Gap Report informed that efforts under the Paris Agreement, including full implementation of the INDCs, could cut up to 11 GtCO2e from projected emissions in 2030, which corresponds to only half of the total emission reductions needed to limit global temperature rise to 2°C by 2100. See UNEP. UNEP Emissions Gap Report. 2015.
2 . Design Considerations

Design Considerations
13
the one hand, this category could incentivize abatement in new sectors; however, it also introduces uncertainty as to price responsiveness. Projects outside of existing crediting schemes include technologies or mitigation opportunities never included under the CDM or other carbon standards, or alternatively, technologies that have not succeeded under carbon market schemes. For projects outside the existing crediting schemes, MRV frameworks based on tons of carbon dioxide equivalent are typically not available. While this may create a challenge for measuring performance, it also presents the opportunity to develop practical approaches for measuring, reporting, and verifying emission reductions. There are a number of challenges associated with incentivizing new abatement opportunities. These relate, for instance, to identifying metrics that are simple enough to be used in an auction and that can also function as proxies for estimating the overall mitigation impact. Due to the investment needs of new projects, the PAF model must also send a strong enough price signal not only to maintain existing activities, but also to help trigger new ones. This requires a good understanding of actual abatement costs of the mitigation activities and fine tuning of the level of incentives, potentially combining price guarantees, up-front finance, and suitable risk mitigation instruments. Figure 4 below illustrates the three broad types of project activities that a scaled-up PAF model can target. Figure 4: Opportunities for replication and scale-up of the PAF
MRV framework and payment metric The initial auctions under the PAF build on the established and internationally recognized MRV framework defined under the carbon markets, which use tons of carbon dioxide equivalent as the metric to which payment is linked. This framework includes a carbon methodology for measuring and calculating generated GHG emission reductions, monitoring and reporting protocols, and a system of third party verification to ensure claimed emission reductions are real and accurate. This framework also includes an established governance structure for approving carbon methodologies, accrediting third party entities, and issuing

Design Considerations
14
units of emission reductions. Within carbon crediting schemes, stringent MRV frameworks are required to assure investors that the asset they have purchased in the form of credits can be used, if required, to meet quantified emissions targets, for example in the European Union’s Emissions Trading Scheme. While the PAF initially opted for the MRV framework of the CDM and other carbon standards in order to leverage existing pipelines of methane abatement projects, future applications of the PAF model are not tied to any particular standard or payment metric. As long as emission reductions triggered by the auction are not utilized for offsetting purposes, they do not need to meet the MRV requirements of carbon markets. Under the pilot auctions, CERs delivered to the PAF in exchange for the price guarantee are voluntarily canceled and hence not utilized for offsetting.
In principle, future applications of the PAF model can be based on any existing or newly created MRV framework that is suitable for results-based climate finance. One would have to ensure that central functions currently performed by the CDM or MRV frameworks of other carbon standards would be fulfilled, namely:
- Providing assurance to the funders of the auction (e.g. climate finance donors) that the metric against which the price guarantee is disbursed represents a real, measured and verified saving in emission reductions; and
- Issuing a certificate or transferrable commodity against which results-based payments can be made.
Moving beyond current carbon market MRV frameworks introduces the possibility for developing more practical MRV approaches that are built on parameters inherent to measuring a project’s performance, and are perhaps even routinely collected by project developers or other institutions. Examples include MWh of renewable power produced or number of improved cooking devices sold or kept in use. Another option is to align with standards that certify low carbon practices without directly reporting tons of carbon dioxide equivalent emission reductions, such as those developed for the building sector. Substantial abatement potential remains in sectors where existing carbon market methodologies and MRV procedures have proven too complex or burdensome to be applied. This is particularly true for sectors and subsectors with many small, single point emissions sources such as transport, energy efficient buildings or agriculture where project developers find it difficult to deliver the activity specific data required under carbon standards. Relaxing the accuracy requirements in many existing CDM methodologies in favor of allowing the use of aggregate and sectoral data, including from national or regional samples, model simulations or remote sensing could help to unlock mitigation opportunities in these areas. Furthermore, introducing alternative metrics can enable a scaled-up PAF model to include a wider array of potential auction bidders and projects. In addition to simplifying MRV, using alternative metrics can enable a PAF-like facility to focus on particular outcomes or impacts. Considering a wider array of metrics can broaden the interest from potential funders, including national agencies and government ministries that could apply the PAF model to support the realization of objectives in the field of energy access or improved energy efficiency.
Future auctions can opt for any MRV framework that assures funders of the validity of the payment metric.

Design Considerations
15
While implementing alternative MRV approaches has benefits, one key benefit to carbon market MRV approaches is the link to an underlying market for carbon credits. Without an underlying market, the optionality of an auctioned price guarantee becomes irrelevant as there will be no alternative source of demand for the asset. A central element of the PAF is the optionality of the price guarantee, which allows put option owners to benefit if carbon prices in international markets rise above the strike price. In this case, put option owners do not have to redeem the option and the PAF will have achieved its objective (to stimulate private sector investment in mitigation) at no cost. This mechanism only works if a future auction uses a metric that has a value in an underlying market the way a ton of CO2 reduced serves as a commodity in international carbon markets. As such, for project categories that are well represented under the carbon markets, it would appear beneficial to retain the use of existing MRV frameworks to maintain the link to an underlying market.
Potential funders
While the PAF has been funded by a number of donors, the ambition is to broaden the funding base to other potential public and private sources of climate finance. An auction-based finance disbursement model could also be of interest to national governments (both developed and developing) as well as private sector actors in the context of voluntary or compliance mitigation action. Funders motivated by achieving mitigation results at the lowest possible cost are likely to continue to support the types of sectors that have been traditionally successful under the CDM. Entities with dual objectives – achieving GHG reductions while stimulating private investments in a particular sector, such as national development banks or the Green Climate Fund (GCF) – will consider the range of co-benefits in addition to GHG mitigation, the transformative capacity of the initiative, and its alignment with existing domestic climate policies and goals. The same goes for private sector funders using Corporate and Social Responsibility (CSR) budgets aimed at generating impacts beyond reductions in tons of CO2. Hence, the interests and motivations of each type of funder will differ, and appetite for engagement will depend on the selected sector, geographic location, and type of funding support that is required to make a difference.
National governments: National governments could use a PAF model to fulfill national GHG emission reduction targets. Under such a scenario, public funds could be used by governments to purchase CERs, VERs, or other products acting as a proxy for GHG mitigation results. In the current context of the Kyoto Protocol, this could apply to Annex-1 Parties interested in closing their existing compliance gap (therefore still using purchased carbon credits to offset domestic emissions). Looking ahead – to comply with ambitions under the Paris Agreement – this could extend further to include both developed and developing country governments intending to use a PAF model as a tool to achieve targets and goals set forth in their NDCs. Given the country-specific scope of NDCs, the sectoral scope, eligibility criteria, and auction format would require careful tailoring to ensure alignment with intended policy objectives. The PAF model must be flexible enough to remain compliant with the still evolving GHG accounting requirements.
Introducing alternative metrics can enable a scaled-up PAF model to include a wider array of bidders and projects.
Future auctions could be funded by a variety of public and private sources of climate finance.

Design Considerations
16
Private sector: Actions to limit global warming to less than 2 or 1.5 degrees Celsius as agreed at COP21 in Paris will require substantive and meaningful participation from the private sector. The role of the private sector is becoming increasingly more prominent in supporting the transition to low carbon development, yet regulatory, technology-related and country-specific risks still withhold green investments from becoming mainstream. Incentivizing private sector investment in climate change in developing countries through the provision of price guarantees is therefore a key objective of the PAF. There may also be opportunities for certain private sector actors to fulfill the role of funders. Firstly, an increasing number of corporations are making voluntary commitments to reduce their impacts on climate change, as well as allocating finance towards reaching these goals. For example, over 150 companies – including the likes of Coca Cola, Kellogg Company, Bank Australia, Diageo, Credit Agricole, GlaxoSmithKline, Ikea, and Unilever – have signed up to Science Based Targets, a voluntary initiative driving corporate climate action.13 Dedicated Corporate Social Responsibility budgets may be one way to achieve corporate GHG mitigation actions, and a future funding source for a PAF-like facility. Secondly, as increasingly more corporations worldwide voice their support for carbon pricing initiatives and implement internal ‘shadow pricing’ on carbon, auctions could assist specific industries in reducing GHG emissions upstream in their supply chain. Donors: Over the short-term (pre-2020) it is expected that donor funding will continue to be the main driving force behind results-based payments for GHG mitigation action. As such, donor interests need to be further explored when assessing the viability of sectors for a scaled-up PAF. Combinations of donor funds with developing country budgets or private sector co-funding can also deliver blended finance in support of mitigation action on the ground. Synergies between the PAF model and the Green Climate Fund (GCF) could also be explored. The GCF’s mandate to mainstream climate finance and attract private sector capital by de-risking investments (for instance, through the Private Sector Facility) is fully aligned with the PAF’s core objective to revive existing and/or trigger new private sector initiatives in a cost-effective manner. The drive towards results-based finance is another common feature. The GCF has indicated the use of results-based finance for REDD+,14 but it is possible to conceive that in future – if the results-based approach is extended to other areas – the PAF model could be accepted as another finance delivery mechanism by the Fund.15 Additionally, the GCF makes use of a growing list of domestic accredited entities to channel resources locally, which could potentially align with PAF-like auctions at the national level.
Auction format A central component of the PAF model is the underlying auctioning mechanism, which introduces a competitive aspect that results in effective price discovery. The format of the auction as well as other design features can be adapted to address specific objectives, such as attracting a certain type of bidder or opening the auction to project developers interested in investing in new assets.
13 The SBTI is a joint partnership between CDP, UN Global Compact, WRI and WWF to assist participating companies in understanding the technical information around science-based targets and in determining their emission cuts to avoid the worst effects of climate change. Participating companies agree to publicly adopt emission reductions targets in accordance with climate science. For additional information refer to: http://sciencebasedtargets.org/.
14 At its 8th Board Meeting the GCF adopted its initial logic model for REDD+ results-based payments and the performance measurement framework, noting that the model “shows the way in which results-based payments for REDD+ contribute to the achievement of the Fund’s overall mitigation objectives at the levels of the paradigm shift and impacts”. See GCF. Board Decisions on Results-Based Management; GCF. Initial Logic Model and Performance Measurement Framework for REDD+ Results-based Payments. B.08/08. 2014; and GCF. Further development of some indicators in the performance measurement frameworks. GCF/B.13/26. 2016.
15 Differ. How Results Based Financing Can Help the Green Climate Fund Achieve its Objectives. 2016. This study discusses the potential for results-based financing under the GCF.

Design Considerations
17
The success of any type of auction can be judged by its ability to incentivize participants to bid according to their true valuations (truthful bidding) and to induce a sufficient participation level that encourages price discovery. The pilot auctions held to date have tested both the ascending and a descending clock auction format. With the descending format (also known as a ‘reverse auction’ – as applied in the first PAF auction), the auctioneer sets the premium and bidders bid down the strike price. With the ascending format (also known as a ‘forward auction’ – as applied in the second PAF auction), the auctioneer sets the strike price and bidders bid up the premium. Both approaches represent a multiple‐round auction process. In general, the attractiveness of clock auction formats is the promotion of price discovery, as bidders can incorporate information from others’ bids into their own bidding strategy and the final price reflects this information. Clock auctions are simple and transparent as bidders are only asked to indicate their demand at the price announced by the auctioneer during each bidding round. A clock auction format also encourages truthful bidding, as bidders do not have strong incentives to strategically manipulate their bids. This makes it more likely that the bids and the final price reflect true market conditions. Another important benefit of clock auctions is the fact that the auction is paced by the auctioneer, rather than the bidders. Prices increase or decrease at a rate that is determined to be desirable for the efficient aggregation of information. An alternative to a multiple-round clock auction is a single-round sealed-bid auction format. For auctions of multiple units of a homogeneous good, two sealed-bid formats are most commonly considered: (1) the uniform-price sealed-bid auction; and (2) the pay-as-bid sealed-bid auction. In either format, bidders simultaneously and independently submit their demand curves. That is, each bidder may submit one or more price-quantity pairs. The
auctioneer then forms an aggregate demand curve and determines the market‐clearing price. Each bidder wins the quantity that it demanded at the clearing price. In the pay-as-bid
auction, winners pay the amounts of their bids. In the uniform‐price auction, all winners pay the clearing price rather than the amounts of their bids.
The clock auction format is generally recommended for PAF-like auctions because of the advantages described above. One consideration that could alter the standard recommendation is if collusion is a serious concern for a targeted mitigation opportunity. This is a risk if the number of bidders is expected to be small, if collusion among businesses is the norm, or if anti-collusion rules are typically not enforced. If collusion is a serious concern, it may be desirable to use a pay-as-bid sealed-bid auction instead. Generally speaking, collusion is a greater concern in a multi-round auction (such as a clock auction) than in a sealed-bid auction, because bidders could try to use their bids to signal other bidders what to do in future rounds. However, a clock auction where only aggregate demand is disclosed to bidders after each round – which is the recommended approach – is less susceptible to such collusion than other multi-round auction formats where more detailed information is disclosed to bidders. The reason is that any attempt by one bidder to signal in the clock auction is likely to be lost among other bidders’ actions. In a sealed-bid auction, bidders do not learn anything about others’ bids until the results are announced, so signaling is not possible at all. In choosing between the reverse and the forward auction in the context of price guarantees, the auctioneer should consider the following pros and cons. The core advantage of using a
Unless collusion is a serious concern, the clock auction format is generally recommended for PAF-like auctions.

Design Considerations
18
reverse auction is that it may be more inclusive than the forward auction. In the reverse auction, the premium or payment that a bidder has to make per price guarantee is fixed, and by setting a relatively low premium, the auctioneer can create a greater opportunity for smaller players with limited financial resources to participate in the auction. Conversely, a drawback of the reverse auction is the risk that the strike price could end up being so low that no credible bidders are willing to purchase price guarantees. In particular, if the premium is set too low, speculators and bidders who are not familiar with mitigation costs and/or underlying market prices may submit bids at very low strike prices. In this case, there is a risk that abatement will not occur due to the low value of price guarantees. Thus, if the auctioneer can set a fixed premium that is low enough to encourage the participation of small bidders but high enough to discourage a very low strike price, then the reverse auction would be preferable. On the other hand, if the auctioneer is not confident about setting an appropriate fixed premium, the forward auction would be preferable. One key advantage of the forward auction is that, because the strike price is fixed by the auctioneer, it is possible for the auctioneer to offer exactly the same option contract in successive auctions. This should make the secondary market for these option contracts more liquid, facilitating tradability. Another possible advantage of the forward auction is that, with the fixed strike, bidders know the exact characteristics of the price guarantee that is available for sale in the auction. The fixed strike price may offer greater certainty to bidders and facilitate bidding in the auction. If it is desirable to encourage competition in a given market, the auctioneer can implement a cap that would prohibit a single bidder from winning more than some percentage of the total initial supply of price guarantees. With a bidding cap, all bidders are limited in the quantities for which they can bid. It is nonetheless important to make sure that the cap is not too low, as it may discourage some projects or bidders from participating in the auction. In order to ensure that bidders are credible, a bid deposit should be required by each bidder before the auction. A bidder’s bid deposit will determine the maximum quantity for which he will be allowed to bid during the auction. The deposit should be large enough that the bidder is unlikely to default on his obligation of paying the premium should he win in the auction, but small enough that it does not create unnecessary barriers to entry. The payment that a winning bidder needs to make at the conclusion of the auction is equal to the premium multiplied by the quantity of price guarantees that the bidder won. The deposit is credited toward the payment of a winning bidder at the end of the auction, provided that he pays the balance. The deposit is refunded promptly to a losing bidder after the auction. The first two pilot auctions allocated a single product: price guarantees linked to GHG mitigation results represented by issued CERs or VERs from eligible project types. Looking beyond the piloting phase, this scope could be expanded to allocate multiple types of price guarantees within a single auction. Selling multiple types of products in the same auction and allowing bidders to switch from one product to another during the auction is generally beneficial if there is substitution among the products. For example, there could be different types of price guarantees offered for projects in different sectors or regions. Consider a project developer who has a choice of possible products in these different sectors or regions and a limit on how many projects he can manage. If different types of put options are auctioned in the same auction, the project developer can express his demand for put options of each type and possibly switch from one to another as relative prices evolve. In some cases, different price guarantees may be used as a vehicle not only to trigger activities, but also to promote their continuation and use. For instance, for stimulating the use of more efficient charcoal stoves, different price guarantees could be paid out in a staggered manner, to incentivize first the acquisition of new equipment (e.g. amount of
Funders could provide preferential treatment to projects in low-income countries or to promising technologies.

Design Considerations
19
cookstoves sold to end-users) and second to promote their continued use (e.g., number of stoves in use by end-users).The benefits associated with multiple types of price guarantees and products need always to be weighed against the added complexities of managing as well as participating in such auctions. Funders may also wish to provide preferential treatment to some projects (e.g. projects in certain low-income countries or projects that implement promising experimental technologies). To achieve this objective, the auctioneer could set aside or ‘carve out’ a portion of the supply and offer it as a separate product in the same auction. In this case, there would be two products (i.e. types of price guarantees) in the auction: the ‘carve out’ product that only applies to certain projects (e.g. those in low-income countries) in the sense that such a put option can only be used for emission reductions that came from those projects, and the ‘general’ product that applies to all approved projects. Because the ‘carve out’ product comes with more restrictions, the strike price of the ‘carve out’ in a descending auction is never lower than the price of the general product. Similarly, the premium price of the ‘carve out’ in an ascending auction is never higher than the price of the general product. The auction format can also accommodate funders seeking to differentiate between existing and new projects. The auctioneer can design the eligibility criteria accordingly and potentially run two separate auctions (either simultaneously or consecutively) where one auction is for existing projects and the other for new projects. If there is substitution between new and existing projects, then the auctioneer could include two types of put options (or products) in the same auction. For example, this may be desirable if a number of bidders have existing projects and are also considering new projects but face overall budget constraints on how much they can invest across the projects. Differentiation can also occur on the level of bidders, where the auctioneer provides preferential treatment to some classes of bidders (e.g. small businesses, non-profits, or businesses located in certain countries). This can be achieved with bidding credit discounts. In this case there is a single price announced for each product in every round of the auction, but bidders that qualify for preferential treatment receive a discount (e.g. 20%) off the announced price.
Price guarantee design
The Methane Finance Study Group Report contains a detailed discussion on structuring result-based finance and recommends the use of “quantity performing instruments”. These are instruments that incentivize outputs which can be readily measured, reported and verified such as tons of CO2 equivalent or other metrics. It also recommends the design of the price guarantee to effectively limit the amount of public finance that needs to be disbursed. This can be achieved by tying the price guarantee paid by the PAF to an underlying market, specifically the carbon market, to ensure that public spending takes advantage of and does not crowd out private sector spending. The report details three potential design options for the price guarantee: Direct purchase: Under a direct purchase agreement, the funder contracts verified emissions reductions at a fixed price directly from the project implementer. This is commensurate to Emission Reduction Purchase Agreements common under the CDM and other carbon crediting schemes. The price determination of the underlying purchase can be accomplished in a number of ways, with auctioning or tendering representing two approaches. Under the direct purchase approach, the funder takes on the obligation to pay the full price for the reported result. This is necessary in a scenario where no alternative marketplace exists for the purchased ‘output’ (i.e. emission reduction), or where the effective market price is close to zero. Top-up instruments: The application of a top-up instrument can be a cost-effective method of allocating finance. Under such an arrangement, the funder commits to paying the

Design Considerations
20
difference between a fixed price agreed with the project implementer and the market price as typically ascertained by a publicly listed index at the time that the emission reduction (or another chosen asset) is sold to the market. In a scenario where the market price exceeds the contracted price, the project implementer will sell the asset to the market and receive no additional payment from the funder. When the price is below the guaranteed price, the project implementer still sells to the market, but the funder ‘tops-up’ the missing revenue. Unlike with direct purchases, funders applying top-ups cannot claim the underlying asset, as their role is solely to close the gap between the market price and the price required to support a certain GHG mitigation activity.
Put options: As standardized contracts that give the project implementer the right (but not the obligation) to sell a specified quantity of an asset at a pre-determined price (the strike price) to the funder on or before a certain date, put options introduce the element of optionality. If the market price of the underlying asset is below the agreed price guarantee, the project implementer exercises the put option. In a scenario that the market price of the underlying asset is above the agreed price guarantee, the project implementer sells to the market and the option expires unused. In the PAF context, in the event that the project implementer fails to realize any GHG mitigation results, he or she can also sell the put option to another project developer, thus increasing the chance of realizing emission reductions similar to the direct purchase approach. In addition, in contrast to direct purchases (where the asset is transferred to the funder) and top-ups (where the asset is sold in the market), put-options give the holder the right to sell the asset to the funder or to the market. For each of these three types of pricing instruments, the funder and the project implementer need to establish (i) the premium that the project implementer pays initially to obtain the price guarantee, and (ii) the contract price the funder agrees to pay to the project implementer for verified results. Under the direct purchase approach, the contract price is the price that the funder will pay for the agreed result. Under the top-up instrument, the contract price is the price against which the funder will ‘top-up’ the missing revenue. Under the put option approach, the contract price is the strike price of the option. An auction mechanism can be used in each of these cases to determine either the premium or the contract price. The put option and top-up instrument have two distinct advantages over direct purchases. First, the same amount of emission reduction or alternative agreed results can potentially be supported with fewer resources than through direct purchases, since there is no need to pay out when the market price exceeds the contract price. Second, the put option and top-up instrument circumvent the risk that market prices will exceed the contract price, potentially leading counterparties to default on their commitments. The direct purchase on the other hand is the instrument of choice when there is no underlying market for the commodity for the foreseeable future (Figure 5).
Put options give the holder the right to sell the mitigation outcome either to the funder or to the market.

Design Considerations
21
Figure 5: Price guarantee options in different markets16
Tradability Tradability adds the component of transferability of the allocated price guarantees to entities that recognize most value in the options. By enabling the transfer of ownership from one entity to another, the auctioneer maximizes the possibility that future emission reductions will be realized. In the context of the PAF model, tradability enables project developers that fail to generate emission reductions to sell the price guarantees to other market participants, thus increasing the likelihood of achieving GHG emission reductions. This tradability component distinguishes the PAF’s put options from Emission Reduction Purchase Agreements (ERPAs), which lack a replacement clause and where underperformance of the contracted project results in an under-delivery of emission reductions.
When looking at the broader applicability of the PAF model, the decision on whether or not to include the element of tradability should be based on whether there is clear value added through the transferability of the price guarantee, and if so, the costs associated with adopting or developing a trading platform. Generally speaking, the added value of transferability is evident – increased certainty of achieving GHG mitigation results is attractive in light of the objective of incentivizing climate change mitigation. Furthermore, common economic wisdom generally favors tradability, as trading tends to bring resources to their highest-valued use. Tradability, however, may require additional infrastructure. During the conceptualization of the pilot auctions, the World Bank faced the challenge of defining the infrastructure through which the auctioned price guarantees would be issued, traded, and redeemed. To avoid high transaction costs associated with designing a new trading platform and to facilitate the issuance and redemption of PAFERNs, the Bank selected its
16 ‘Mitigation outcome’ in the context of the PAF model refers to the unit for which the funder or the market disburses payments (e.g. tCO2e, kWh of renewable energy, area of green building)
Tradability maximizes the possibility that the mitigation outcome is achieved.
Design Considerations
22
existing bond infrastructure to issue the auctioned price guarantees. Other potential funders, such as developing country governments or private sector entities, may lack such infrastructure and may need to opt for more simplified issuance and transferability protocols to manage costs.
Aggregators and intermediaries can step in to facilitate tradability. Intermediaries often lack a pre-existing link to an underlying project and bid for price guarantees with the intention of sourcing eligible emission reductions at a later stage, or alternatively selling the price guarantees to project implementers. The pilot auctions under the PAF allowed for intermediaries such as carbon brokerage firms to participate in the bidding. As long as intermediaries do not monopolize the market or retain a disproportionate share of the payout value, their role is beneficial as they can provide liquidity needed to facilitate transactions. Smaller project developers may be unable to pay premiums upfront to secure access to price guarantees, or may not have the possibility to participate on the day of the auction. Project developers may also be more risk-averse as they base their bids only on the conservative delivery estimates of their own project while intermediaries are likely to have a more realistic view of the performance of the market as a whole. By stepping in, intermediaries can create a source of demand for eligible emission reductions generated by such smaller project developers at a later point in time. In certain cases, it may be desirable to allow for trading of price guarantees only under strict conditions. For instance, bidders participating in an auction with ‘carved-out’ products that offer price guarantees at a discount for certain participants (e.g. small business owners located in a certain region) should only be allowed to sell allocated price guarantees to other project developers that would have qualified for the same discount. In other cases, where price guarantees are auctioned to bidders internationally, limitations on fungibility may be required to avoid arbitrage situations. This may be the case for regional auctions delivering a top-up on existing renewable energy feed-in tariffs, which are likely to differ significantly depending on the jurisdiction.
Complementary financial products Complementary financial products can play a role in reducing or mitigating real or perceived risks inherent to particular mitigation opportunities. Linking the PAF model with such instruments may be effective as it could a) address access to finance barriers observed in a targeted sector, and b) reduce the auctioned price level of the guarantee targeting both new and existing projects in cases where another entity takes over part of the underlying risk exposure. Due to payments occurring only upon delivery of results, carbon markets have not always been effective at tackling one key barrier to implementing low carbon activities: access to finance. With the exception of buyers agreeing to deliver a proportion of payments up-front in the earlier days of the CDM17, carbon markets have mainly resulted in topping up operating cash flows rather than supporting capital expenditures. At the same time, given the relative complexity of the CDM and the high delivery risks (i.e. uncertainty concerning future issuance success of projects) many financial institutions have been reluctant to recognize the value delivered through an emission reduction purchase agreement (ERPA) as
17 Up-front payments provided by financial institutions were observed in the CDM market up until 2011 / 2012. Such advance payments were typically offered to project developers who already were existing clients of the banks.
Aggregators and intermediaries can step in to facilitate tradability.

Design Considerations
23
collateral. This means that in practice, the expectation of future carbon revenues has not always been sufficient to trigger investments. The current design of the PAF mitigates the risk of poor carbon asset prices during the operational phase of the project, but may not provide a strong enough incentive for project developers to develop new assets. To stimulate new project development, the main risks associated with the early project life cycle stage need to be addressed. Risk perception of certain promising areas for a PAF-like facility may be high due to the relative novelty of the targeted abatement intervention, long investment horizons, possible decrease in productivity, or limited financing experience of financiers in that particular sector. High risk perception leads to lower willingness of debt financiers to leverage the project, resulting in a larger equity requirement for projects (which as a rule of thumb is more difficult to attract). Simultaneously, higher perceived risk results in increased return expectations by financers, thereby decreasing the financial viability of new investments. Higher costs of capital are further compounded by a lower degree of sophistication and experience of developing markets overall. The combination of these factors results in diminished attractiveness to initiate new project activities, despite clear climate-related benefits that these investments can deliver.
Over the years, governmental agencies and development initiatives alongside the private sector have developed a wide range of risk mitigation instruments to alleviate specific risk exposures and spur new project development in renewable energy and other GHG mitigation activities. The availability of appropriate risk mitigation instruments allows financiers to accept risks that they originally were unwilling to accept because they are perceived as excessive or beyond their control. If effectively used, risk mitigation instruments can enable the undertaking of commercially viable projects which would not get financing otherwise. Within the PAF model framework, the impact of such complementary instruments targeting both existing and new projects could lower the level of the minimum price guarantee required by project developers active in target sectors or industries. This increase in overall cost-effectiveness is indicated by the yellow arrow in Figure 6 below. The blue area conveys that any complementary products will come at a cost that has to be accounted for by either the auction funders or taken on by the project developers.
Complementary financial instruments could lower the price guarantee required by project developers.

Design Considerations
24
Figure 6: Rationale for linking auctioning to complementary financial products
When considering linking the financial support extended through a price guarantee to complementary financial products, the PAF model would need to make a distinction between an auction design that targets OPEX support versus solutions that are tailored to enable CAPEX investments and new asset development. As such, for the design and construction phase, financing and interest rates are major risk categories that could benefit from support. In the operating phase, risks associated with currencies, market prices and counterparties are typically prevalent. Upon sale or transfer of ownership, liquidity or exit risks may need to be tackled. One instrument that is particularly useful in the context of the PAF model is that of a credit guarantee – and more specifically – a portable guarantee. A portable guarantee is provided to a specific borrower, whereas regular guarantee schemes are more commonly linked to specific lenders. Through a portable guarantee, the borrower can request loan terms and offers from various lenders and choose the package that best meets the underlying financing requirements. If backed by reputable sponsors, such guarantees covering a portion of the credit risk could be recognized by private sector financiers. While such guarantees can be offered as a stand-alone financial product, they could also be integrated within an auction. Under this alternative approach, borrowers could bid for the level of guarantee percentage required, with the most competitive bidders (i.e. those requiring the lowest amount of coverage) receiving the backing. Table 1 outlines common types of risks associated with investments in developing countries along different project development stages.

Design Considerations
25
Table 1: Overview of common types of risks, its impacts and available risk reduction instruments
Risk description Impact Typical risk reduction
instruments
Desig
n a
nd
co
nstru
ctio
n p
hase
Financing Insufficient debt
financing available at
sufficiently attractive
rates
Additional risk-bearing
capital required (equity
or semi-equity) and/or
Higher required return
demand
Guarantee instruments
(partial or full)
Portable guarantees
Concessional loans
Equity funds
Interest rate Funding often only
available based on
floating-interest rates,
which exposes the
viability of the project to
rate increases
Possible excessive debt
service
Interest rate swaps
Interest rate subsidies
Standard-
related
Meeting requirements
of carbon and/or
sustainability standards
requires additional
financial and technical
resources
Additional costs and
uncertainty as to
whether the standard
requirements can
actually be met
Use of existing and well
tested methodologies
and protocols, where
applicable
Provision of technical
assistance
Op
era
ting
ph
as
e
Currency Revenues generated in
local revenues
deteriorate (creeping or
shock) in value against
“hard” currencies
provided by financiers
Overall return on project
uncertain or unviable
Limitation on ability to
service debt to
financiers
Automatic annual
contract adjustments or
derivative financial
instruments (foreign
exchange swaps)
Insurance products for
exchange rate shocks
Market price Uncertainty on the
price for which the
product can be sold
Business case
unattractive and
financing options limited
Price guarantees; in this
specific case targeted
by the PAF model
Counterparty Contractual
counterparty does not
satisfy its contractual
obligations
Diminished returns Letters of credit
Export credit insurance
Standard-
related
Maintaining project
compliance with carbon
and/or sustainability
standards requires
additional financial and
technical resources
Additional costs and
uncertainty as to
whether the project can
remain compliant with
the applicable
requirements
Maintaining adequate
technical capacity
through monitoring and
verification cycles
Exit p
ha
se
Liquidity /
Exit Investors cannot
capitalize on their
investment
Decreased
attractiveness for
financiers, leading to
lack of financing and /
or excessive return
demands
Develop knowledge of
sector potential with
broader investment
base
Investment funds in
which similar products
can be pooled

Opportunities for Replication and Scale-Up
26
This chapter presents a high-level summary of the sectoral assessment used to identify opportunities for replication and scale-up of the PAF model. Sector suitability for the PAF model is assessed through seven assessment criteria: (i) price responsiveness of the targeted sector to a price guarantee; (ii) the availability of monitoring, reporting and verification (MRV) standards; (iii) sectoral abatement potential; (iv) abatement costs; (v) availability of existing projects; (vi) regulatory considerations; and (vii) sustainable development impacts.
The first part of this chapter introduces opportunities identified in methane abatement that were not covered under the piloting phase of the PAF. The second part of this chapter presents an analysis of opportunities in all other sectors, including the power, transport, industrial gases, energy efficiency, and forestry and land use sectors.
Opportunities in methane abatement Anthropogenic methane emission sources can be grouped into several main categories, as illustrated in Figure 7. Enteric fermentation from ruminant animals is the primary source of global methane emissions, and is triggered by intensive animal farming and industrial livestock production. Emissions from the oil and gas sector follows, with methane gas being released at all stages of the natural gas supply chain (i.e., production, processing, transport) and as a byproduct of crude drilling. Together, these two sectors account for 60% of all anthropogenic methane emissions. The remaining 40% largely stems from the landfill, coal mine, rice cultivation, and wastewater sectors. The limited number of emission sources in combination with a high global warming potential makes methane abatement an important GHG mitigation opportunity. Mitigation action targeted at methane sources can be cost-effective, as abatement opportunities can be realized at a relatively low or even negative abatement cost with existing technologies, and are replicable and scalable on a global scale.18 In addition to the climate impact, methane abatement is also associated with broad sustainable development benefits, including clean energy, improved health and safety, and environmental protection. Building on this rationale, the first two auctions under the PAF targeted methane emissions at landfill, animal waste, and wastewater sites. These projects cover approximately 22% of the total methane emission sources available. The figure below provides a summary of global methane emission sources, highlighting in green the sources covered in the initial PAF auction and in blue the additional sources assessed in this study.19
18 Methane Finance Study Group Report. Using Pay-for-Performance Mechanisms to Finance Methane Abatement. 2013. 19 Abatement opportunities in the oil and gas sector – representing the second largest methane emission source – have already been analyzed in a previous study commissioned by the World Bank: Carbon Limits. Briefing Note: Pilot Auction Facility for emission reductions in the oil and gas sector. 2014.
3 . Opportunities for Replication and Scale-Up

Opportunities for Replication and Scale-Up
27
Figure 7: Overview of global methane emission sources20
* the Oil and Gas sector is not covered in this report – see footnote 21
The sections that follow feature a source-specific assessment of suitability for replication and scale-up of the PAF model. Specifically, abatement opportunities within four distinct methane emission sources are studied: (i) palm oil wastewater; (ii) rice cultivation; (iii) enteric fermentation; and (iv) coalmine methane. Note that palm oil wastewater projects were not eligible for the initial auctions under the PAF. Table 2 summarizes the main outcomes of this assessment. The table summarizes all seven assessment criteria with the exception of the regulatory considerations, which are explored in the assessments below. Table 2: Suitability for replication and scale-up across methane abatement opportunities
Palm oil waste water
Rice cultivation
Enteric fermentation
Coalmine methane
Price responsiveness
High Moderate Moderate High
Degree of suitability for MRV
High Low Low High
Abatement potential
High High High High
Abatement cost Moderate Diverse Diverse Moderate
Sustainable development impacts
Moderate High High Moderate
Presence of existing projects
High Low Low High
20 US EPA. Summary Report: Global Anthropogenic Non-CO2 Greenhouse Gas Emissions: 1990–2030. 2012.

Opportunities for Replication and Scale-Up
28
Waste Water Treatment from Palm Oil Palm oil production requires the extraction of oil from palm oil seeds. This process produces waste water with a high organic content known as palm oil mill effluent (POME), which is typically treated in a series of open lagoons. Anaerobic digestion produces methane, which in the case of open lagoons is vented into the atmosphere. Reductions in methane emissions in the palm oil waste water sector can be achieved in two ways: by introducing an anaerobic tank digester or by covering the anaerobic lagoons. With both technologies, the methane can be captured in high enough concentrations to allow it to be flared or used for the production of power or heat. Tapping and combusting methane can therefore generate renewable energy while significantly reducing the climate change impacts of palm oil production. Palm oil is a leading agricultural commodity in several Southeast Asian countries, including Malaysia, Indonesia and Thailand. The market is consolidated around a few large palm oil producers, and methane abatement activities implemented in the sector are well represented under existing carbon markets. Projects that reduce methane emissions from POME activities in the palm oil sector could be incentivized through a price signal delivered through a PAF-like facility. Literature suggests that the capture of methane from POME is rarely viable without additional financial incentives, explaining the presence of this project category in international carbon markets.21 The decline of the carbon price has, however, made it difficult for many project developers to sustain methane destruction operations, reflecting the additional operating expenses associated with either flaring the gas (accounting for 30% of the CDM project pipeline) or using it to generate power (accounting for 60% of the CDM project pipeline). This has been especially evident for flaring projects, where results-based finance delivered through monetization of carbon credits represents the only revenue source of the abatement activity. The stalling of activities observed in projects reliant on carbon revenues reflects the sector’s responsiveness to revenue support. Importantly, in the context of the PAF model, the extent of both OPEX and CAPEX associated with POME methane capture projects is well-known. Also, abatement costs are fairly homogenous across regions, making it a good candidate for a PAF-like facility without the need for specific ‘carved-out’ products. Given the prevalence of an existing pipeline of projects where upfront investments have been made, there is a timely opportunity for a PAF model to revive stalled or struggling activities at a larger scale. With over 100 projects registered under the CDM alone, and still some ongoing carbon credit issuances, POME abatement activities are clearly compatible with existing MRV schemes. The methodologies applied in carbon markets rely mostly on data that palm oil producers already monitor, and stalled carbon projects could form the basis of an existing pipeline of projects that can be readily mobilized through a PAF-like facility. Given that palm oil production is concentrated in only a handful of countries (namely Indonesia, Malaysia and Thailand), a regional or national auction targeting one or several Southeast Asian countries could be envisaged. Targeting a few or even a single jurisdiction allows the PAF model to be tailored to national circumstances, including any regulations governing deforestation, peatland management, wastewater discharge limits, and methane emissions from waste water treatment. For existing project activities, linking auctioned price guarantees to verified and issued carbon credits is possible. For new projects with power generation capacities, auctioning the price per kWh generated underlying a power purchase agreement (PPA) could be one way of incentivizing the development of new assets. The methane abatement potential from POME is considerable, while associated abatement costs are moderate. According to data listed in registered POME Programmes of Activities
21 Ecofys. Insights into the status and prospects for CDM Programmes of Activities. 2016.
Opportunities for Replication and Scale-Up
29
(PoA) under the CDM, the average abatement cost is around USD 15 per tCO2e. Studies indicate that only around 5% of palm oil mills currently capture methane from their waste water ponds, potentially leaving 140 MtCO2e unabated every year.22 This translates into around 24 million MWh of foregone power generation potential, equivalent to one quarter of the annual energy consumption of Malaysia.23 Without adequate social and environmental safeguards, using climate finance to support activities in the palm oil industry remains contentious. On the one hand, capturing and using methane gas for power generation allows businesses to be less dependent on (often subsidized) fossil fuels, contributing to Sustainable Development Goal 7 (SDG 7). In addition, POME management can positively impact water quality (SDG 6) and associated health-impacts from water-borne diseases (SDG 3). At the same time, the sector has been a driver of deforestation in certain Southeast Asian countries. Any PAF-like facility aiming to support this project category could couple eligibility to a strict moratorium on forest clearing; for example, an auction could include in its eligibility criteria the requirement of a certification standard such as that provided through the Roundtable for Sustainable Palm Oil (RSPO). Funding for a PAF-like auction in POME could come from national governments, the donor community, or private sector actors such as the food and beverage industry. Waste management, energy security, and renewable power generation are listed in the INDCs of the main palm oil producing countries, and incentivizing POME methane abatement projects represents one way of reaching these targets. Developing country-led climate finance contributions could be one way of funding an auction in this sector. Additionally, palm oil is a bulk resource for the food and beverage industry, which serves consumer markets. Private sector entities could channel funds through a PAF-like facility to strengthen the sustainability of their supply chains, thereby achieving a dual goal of reducing exposure to reputational risk while ensuring stable, secure supply. Donors that would like to support the introduction and enforcement of regulations guiding the methane capture could also contribute towards a similar auction. Corporates could also provide additional leverage: the RSPO – which currently certifies 18% of market volume24 – has pioneered a comprehensive strategy to make sustainable palm oil the norm. Member producers are encouraged to calculate methane emissions associated with production, but more work needs to be done on this front to incentivize GHG mitigation action.
Rice Cultivation Rice is a staple for over half of the world’s population. The crop is prevalent in many regions of the world, yet over 90% is grown across the Asia-Pacific Region.25 Rapid population growth in big demand markets like China and India is likely to contribute to a further global rise in methane emissions from this sector. Methane gas release from rice fields is estimated to contribute to approximately 7% of total anthropogenic methane emissions.26 To grow rice, paddy fields need to be irrigated for at least four months per year. When covered with water, high temperatures and water clogged soils create ideal conditions for methane generation as organic material decomposes. Many practices can reduce these methane emissions. One common strategy is to improve water management and reduce the time that fields are flooded. This can be achieved through intermittently draining wetlands during growing seasons, avoiding water logging in off-seasons, applying shallow flooding, or mid-season drainage. When sufficiently dried, paddy soils can even act as temporary GHG sinks.
22 Taylor P. G., et al. Palm oil wastewater methane emissions and bioenergy potential. Nature Climate Change, 4(3). 2014. 23 Ibid. 24 RSPO. How RSPO certification works. Accessed August 2016. 25 FAO. Rice production in the Asia-Pacific Region: Issues and Perspectives. 26 US EPA. Summary Report: Global Anthropogenic Non-CO2 Greenhouse Gas Emissions: 1990–2030. 2012.

Opportunities for Replication and Scale-Up
30
While correct implementation of improved water management regimes can successfully reduce methane emissions with no negative effects on yields (it can even lead to yield increases), the barriers to mitigation action are both financial and technical. As such, introduction of a price guarantee linked to ex-post emission reductions alone is unlikely to trigger methane abatement at scale. For example, precise flood management requires paddies to be levelled, which requires both knowledge and upfront investment associated with ground levelling. Another barrier is the lack of control farmers may have over their field’s flooding infrastructure - farmers cannot risk reducing their flood levels if they are not in control of flood gates and cannot guarantee the supply of water when needed. Such factors could potentially limit the number of participants in a PAF-like auction. In addition, the fact that farmers fully depend on income generated from crop sales may create hesitation around implementing farming practices that deviate from the norm. To mitigate such risk perception, a PAF-like auction could for instance be complemented by index-based crop insurance that compensates farmers in the event of crop losses.
Methane abatement activities in the sector have not benefitted from carbon revenues due to, inter alia, complexities associated with MRV. To date, only two activities (one PoA and one regular CDM project) attempted registration under the CDM, but both were terminated at validation. Given the lack of mitigation activities registered under the carbon markets, implementation of a PAF model in the rice sector would focus on catalyzing new project development. A price guarantee may help to overcome the upfront financing barriers associated with improved water management techniques. One intervention could include ensuring that flood levels are controlled according to a recognized methodology for alternate wetting and drying (AWD). CAPEX investments may be needed to support the leveling of paddies where uneven fields are a major barrier to improving and controlling flooding regimes. One way of structuring such price guarantee is linking payments to the number of hectares of land where AWD is applied and maintained over time. Standardized baselines and methodologies covering rice cultivation activities approved under the CDM or the VCS could be used to estimate the achieved GHG mitigation potential per hectare to determine an applicable level of price guarantees. The payments could flow directly to individual farmers participating in the auction or to an aggregator or intermediary (such as a cooperative) which would use future guarantee payouts to recover the upfront investment associated with assisting farmers with field leveling. The benefit of rice production is that it tends to be regionally clustered, where cultivation practices and producer conditions are similar (e.g. neighboring farmers often share water sources, control infrastructure, and flooding regimes). If a PAF model were implemented in this sector, investments could focus on a small number of target countries in Asia responsible for the majority of associated sector emissions. China, India, Indonesia and Vietnam are some of the world’s largest producers of rice, and represent regions that offer significant GHG mitigation potential. A recent report estimates that 120 MtCO2e per year can be mitigated in wet rice cultivation by 2030 through improved water and rice straw management.27 The US Environmental Protection Agency (EPA) – which measures global baseline emissions in the sector at 756 MtCO2e – estimates that 8% (or 60 MtCO2e) can be mitigated at no cost.28 Increasing this to 12% of global rice methane emissions could be achieved at a price of USD 20 per tCO2e.29 McKinsey estimates mitigation costs from flooding regime management as being relatively low, ranging from EUR -5 to EUR 8 per
27 Streck, C. et al. Strategies for Mitigating Climate Change in Agriculture: Abridged Report. Climate Focus and California Environmental Associates. 2014. 28 US EPA. Executive Summary: Global Mitigation of Non-CO2 Greenhouse Gases, 2010-2030. Rice Cultivation. 2014. 29 US EPA. Global Mitigation of Non-CO2 Greenhouse Gases: 2010-2030. Washington, DC. 2013.

Opportunities for Replication and Scale-Up
31
hectare per year.30 A Nationally Appropriate Mitigation Action (NAMA) proposal developed in the Philippines provides another reference point, estimating abatement cost at USD 0.87 per tCO2e.31 An auction in an area where these ‘low-hanging fruit’ opportunities can be tapped could provide a good starting point, as the upfront costs needed to be shouldered by cooperatives or producers could be manageable. Supporting mitigation activities in rice cultivation can deliver benefits beyond methane abatement. In relation to the SDGs, intervention in the rice sector can result in the uptake of sustainable agricultural practices (SDG 2). One goal under this SDG is to increase productivity of agricultural systems and increase the agricultural area under productive and sustainable management. Reduced need for paddy field flooding can also contribute to improved water use efficiency and reduced pressure on local water resources (SDG 6). In terms of MRV, quantifying precise GHG mitigation results from project activities in rice cultivation remains challenging. Pilot digital technologies for remote sensing and technical services such as mobile phone application could assist in monitoring the application of AWD, but are still in early stages of development. The currently available technology can produce imagery that can evidence when irrigation has taken place, as well as serve as an indicator for the amount of moisture contained within the monitored soil. Linking performance-based payouts to the amount of hectares managed through AWD could be possible once this technology is further tested and proves credible on a larger scale.
A PAF-like facility may represent an effective approach to incentivize methane abatement activities in the rice sector. However, the aforementioned mitigation activities face barriers to implementation and there is limited empirical data on how well the availability of a price guarantee linked to GHG mitigation results could trigger the adoption of improved practices. The informal and dispersed character of the sector, limited capitalization of targeted participants (i.e. rice farmers), and complexities around GHG accounting reflect some of the key barriers preventing eligible projects from benefitting from the carbon markets.
Enteric Fermentation Ruminant animals have a unique digestive system that enables them to eat plant materials. The anaerobic microbes supporting the digestion process facilitate fermentation, one by-product of which is methane gas. Enteric fermentation is estimated to contribute to nearly 30% of total anthropogenic methane emissions, and emissions are expected to grow as demand for beef and dairy products continues to rise.32 Over two-thirds of total livestock emissions come from cattle (both dairy and non-dairy), who produce over twice the emissions of any other type of livestock animal.33 The amount of methane produced from cattle production depends on animal management techniques and feeding regimes. Key activities that can contribute to lower methane emissions from the sector include dietary interventions, vaccines to reduce methanogenic bacterial activity (in development), and changes in herd management and breeding. While intensification measures to improve pasture and growth productivity are shown to significantly reduce emissions per unit of meat produced, such measures require upfront
30 McKinsey & Company. Pathways to a Low-Carbon Economy. Version 2 of the Global Greenhouse Gas Abatement Cost Curve. 2009. 31 UNDP. Adaptation and Mitigation Initiatives in Philippine Rice Cultivation. 2015. 32 US EPA. Summary Report: Global Anthropogenic Non-CO2 Greenhouse Gas Emissions: 1990–2030. 2012. 33 Dickie, A. et al. Strategies for Mitigating Climate Change in Agriculture: Abridged Report. Climate Focus and California Environmental Associates. 2014.

Opportunities for Replication and Scale-Up
32
investments for inputs and training.34,35 Limited capitalization of individual cattle farmers is a barrier to participation, as the cattle themselves often constitute a main revenue source for farmers. Another barrier is the current limited experience with MRV for baseline and credit project types targeting methane emissions from enteric fermentation. Six methodologies for the calculation of enteric emissions have been approved under existing carbon standards: one under the CDM, two under the VCS, and three under other standards. Some of these methodologies allow for the use of default factors for key parameters, including the number of animals, production characteristics, and emissions factors. While regional and ecological variations may be lost, the availability of proxies should in principle facilitate the MRV efforts to reduce monitoring costs. Despite this, there are no registered carbon projects targeting enteric fermentation. This indicates that the complexity and expenses associated with MRV still exceed income from potential carbon revenues. The application of alternative metrics – such as linking methane abatement results to the volume of beef or milk produced – could offer more practical approaches to MRV. It is estimated that a quarter of livestock methane emissions could be eliminated if the available mitigation options were implemented at a global level.36 The Food and Agricultural Organization (FAO), in the context of increasing the efficiency of production, also estimates a similar emission reduction potential.37 The EPA foresees a lower potential, estimating that only one-tenth of non-CO2 livestock emissions could be abated worldwide.38 Almost half of the mitigation potential arises from a small selection of countries, including Brazil, India, China, the United States and the European Union.39 Abatement costs for enteric fermentation are estimated to fall within the range of EUR 14 – 79 per tCO2e.40 New approaches, such as the use of enteric fermentation vaccines to reduce the formation of methane by microbes (i.e., methanogenesis) in the rumen, are priced higher and could reach EUR 128 per tCO2e.41 Estimates by the EPA indicate a wide variation in cost estimates for reducing enteric fermentation, ranging from USD 4 to USD 300 per tCO2e.42 Given such variable abatement cost and limited experience with GHG mitigation activities in enteric fermentation, a PAF-like facility is likely to focus on supporting the ‘low-hanging fruit’ opportunities such as intensive grazing and improved feed conversion. Methane abatement activities in enteric fermentation can have a positive impact on the promotion of sustainable agricultural practices (SDG 2). Improved digestibility of animal feeds is often associated with an improvement in productivity (be this meat or dairy products), reflecting one of the targets related to increased productivity of agricultural systems under the SDGs.
34 Cardoso, A. S et al. Impact of the intensification of beef production in Brazil on greenhouse gas emissions and land use. Agricultural Systems, 143, 86–96. 2016. 35 Gerber, P.J. et al. Tackling climate change through livestock – A global assessment of emissions and mitigation opportunities. FAO. 2013. 36 ICF International. Greenhouse Gas Mitigation Options and Costs for Agricultural Land and Animal Production within the United States. 2013. 37 FAO. Global Livestock Environmental Assessment Model (GLEAM): Results. Accessed on 21 April 2016 at http://www.fao.org/gleam/results/en/. 38 US EPA. Global Mitigation of Non-CO2 Greenhouse Gases: 2010-2030. 2013. 39 Streck, C. et al. Strategies for Mitigating Climate Change in Agriculture: Abridged Report. Climate Focus and California Environmental Associates. 2014. 40 McKinsey & Company. Pathways to a Low-Carbon Economy. Version 2 of the Global Greenhouse Gas Abatement Cost Curve. 2009. 41 Ibid. 42 US EPA. Global Mitigation of Non-CO2 Greenhouse Gases: 2010-2030. 2013.

Opportunities for Replication and Scale-Up
33
A lack of enteric fermentation projects in the carbon markets makes estimating the price responsiveness of cattle farmers to performance-based payments difficult. Price responsiveness is, however, likely to differ regionally. Given the sector represents the largest source of global methane emissions, abatement opportunities in enteric fermentation could be piloted to yield data that can help define future sectoral mitigation action plans in major cattle-producing countries. Box 1 below illustrates one potential approach in Brazil.
Coal Mine Methane The process of coal formation results in the production of methane gas, which can remain embedded between coal layers or the surrounding rock strata. During excavation and coal seam fracturing, trapped methane gas is released either into the mine works or directly into the atmosphere. This results in both safety hazards as well as GHG emissions. The availability and release of methane gas depends on the method of mining, the grade of coal, and geological factors. Underground mining releases higher concentrations of methane gas than open-pit or surface operations. Coalmine methane is estimated to contribute to approximately 8% of total anthropogenic methane emissions.43 The most common ways to use or oxidize coal mine methane include capture and injection into natural gas pipelines; capture for power generation; process heating; flaring; and catalytic or thermal oxidation of ventilation air methane (VAM).44 Mitigation of methane emissions from coal mining can be achieved through either capturing the methane for usage or flaring. Such mitigation activities are suitable for the PAF model. There is high technical potential, significant experience with existing mitigation projects through the CDM, and relatively high price responsiveness. In addition, a number of consolidated methodologies are available for the ex-ante estimation of avoided methane emissions from coal mining. Because the mitigation of coal mine methane requires the gas’ direct capture and utilization or destruction (oxidation), a price guarantee auctioned through a PAF-like facility could link directly to the amount of methane (in tons of carbon dioxide equivalent) that is destroyed.
The abatement potential of coal mine methane is significant. The EPA estimates the maximum technically feasible abatement potential of coal mine methane to be 60% of baseline emissions (400 out of 671 MtCO2e) by 2020.45,46 The study predicts that around 15% of the reduction can be realized by implementing measures that are cost-effective at currently projected energy prices. Abatement costs for the sector, based on CAPEX alone, average USD 14 per tCO2e according to available CDM data.47 Mitigation costs drop steeply when methane concentrations are high (i.e. for use in pipe injection or power generation), while the single activity with the highest mitigation potential – VAM oxidation – has relatively high costs due to the low concentrations of methane involved. The abatement costs greatly decrease once mining operations have ceased, during which time lower concentrations of methane continue to be released over an extended period of time.
One consideration for a PAF-like facility is whether climate finance should be applied toward coal mining operations in the first place, or whether coal companies should be required to implement methane abatement through regulations. Use of climate finance for abandoned mines may be less controversial, particularly in situations where they are currently
43 US EPA. Summary Report: Global Anthropogenic Non-CO2 Greenhouse Gas Emissions: 1990–2030. 2012. 44 US EPA. Executive Summary: Global Mitigation of Non-CO2 Greenhouse Gases, 2010-2030. 2013. 45 US EPA. Global Mitigation of Non-CO2 Greenhouse Gases: 2010-2030. Washington, DC. 2013. 46 This figure does not include methane emissions from abandoned coal mines, which are reported under a separate category to the UNFCCC.
47 Assuming all expected emission reductions over the applied ten or 21-years’ crediting period are realized.

Opportunities for Replication and Scale-Up
34
unregulated. These projects are hardly developed under CDM and other carbon standards. Still, on the back of attempts to reduce the use of coal, the potential for methane abatement in abandoned mines can only increase.

Opportunities for Replication and Scale-Up
35
Opportunities in other sectors There is scope to extend the use of the PAF model beyond methane emission sources. This part of the report summarizes the assessment conducted in six broad sectors of the economy, defined in accordance with the sector categorization applied in the national inventory guidelines of the IPCC. The studied sectors are:
CO2 emissions from fuel combustion processes in the (i) energy, (ii) industrial, (iii) buildings and (iv) transport sectors;
Non-combustion related CO2 emissions from forestry and land-use;
Non-CO2 industrial gas (HFCs, PFCs, N2O, SF6) emissions from industrial processes. Figure 8 features a summary of global GHG emission sources based on the IPCC’s most recent data. Figure 8: Overview of global (direct) GHG emissions sources by sector48
The sections that follow provide a sector-specific assessment of the suitability for replication and scale-up of mitigation activities in these sectors under the PAF model. The evaluation presents a high-level summary of the sectoral assessment performed across selected non-methane emission sources, highlighting barriers and opportunities for scaled-up mitigation action and the role a PAF-like facility can have in reviving stalled or unlocking new abatement potential in these sectors. The table below summarizes the degree to which the studied opportunities match the key conditions that need to be in place for an auctioning approach to be feasible and effective.
48 Based on data from IPCC’s Fifth Assessment Report (2014). Other energy sources refer to GHG emission sources in the energy sector such as electrical equipment use and fossil fuel fires. See also IPCC AR5 A.II.9.1.1. It should be noted that this sectoral overview also includes methane emissions (covered before) and other non-industrial non-CO2 emissions (as part of the forestry and land use sector) that are not further covered in this study.

Opportunities for Replication and Scale-Up
36
Table 3: Suitability for replication and scale-up of the PAF model across non-methane GHG reducing sectors
Energy Industry Transport Buildings Industrial gases
Forestry and Land Use
Price responsiveness
High High Low Low High
High for
forestry
Low for
agriculture
Degree of suitability for MRV
High High Low Moderate High High
Abatement potential
High High High High High High
Abatement cost Diverse Moderate Diverse Diverse Low Diverse
Sustainable development impacts
High Moderate High Moderate Low High
Presence of existing projects
High High Low Low High Low
Energy Sector Activities capable of reducing CO2 emissions from fuel combustion in the energy sector fulfil many of the criteria that are fundamental to the suitability for the PAF model. The energy sector, which includes emissions from electricity generation and covers abatement technologies such as renewables and carbon capture and storage (CCS), accounts for about half of all energy related GHG emissions and about 35% of anthropogenic GHG emissions (including both emissions from the electricity and heat sector). This makes the energy sector the largest contributor to global GHG emissions and offers the largest potential source of abatement, which is estimated to be between 12.4 Gt CO2e and 14.4 Gt CO2e per year in 2030 from power production alone.49 This abatement potential can be achieved through four key interventions, including the implementation of renewable energy generation, CCS, nuclear power, and energy efficiency measures.50 Given the broad and diverse nature of the energy sector, abatement costs vary widely across various technologies and regions. Table 4 below provides an overview of the abatement costs of various technologies, as estimated by McKinsey & Company. Table 4: Abatement cost estimates for the power sector, per technology51
Technology Abatement cost (USD per tCO2e)
Small Hydro - $5.00
Increased gas utilization ~$1.10
Geothermal < $5.60
49 IPCC, 5th Assessment report - Climate Change 2014 Mitigation of Climate Change , 2014. 50 McKinsey & Company, Pathways to a low-carbon economy -Version 2 of the Global Greenhouse Gas Abatement Cost Curve, 2009.
51 McKinsey & Company, Pathways to a low-carbon economy -Version 2 of the Global Greenhouse Gas Abatement Cost Curve, 2009.
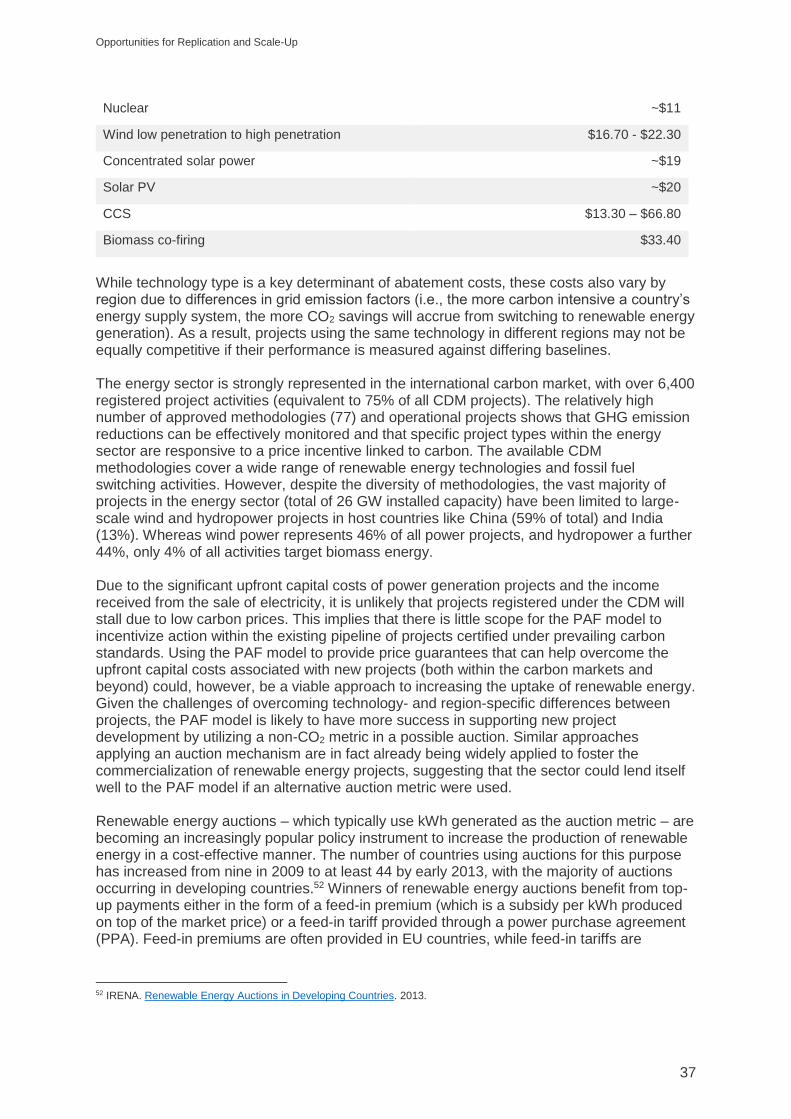
Opportunities for Replication and Scale-Up
37
Nuclear ~$11
Wind low penetration to high penetration $16.70 - $22.30
Concentrated solar power ~$19
Solar PV ~$20
CCS $13.30 – $66.80
Biomass co-firing $33.40
While technology type is a key determinant of abatement costs, these costs also vary by region due to differences in grid emission factors (i.e., the more carbon intensive a country’s energy supply system, the more CO2 savings will accrue from switching to renewable energy generation). As a result, projects using the same technology in different regions may not be equally competitive if their performance is measured against differing baselines. The energy sector is strongly represented in the international carbon market, with over 6,400 registered project activities (equivalent to 75% of all CDM projects). The relatively high number of approved methodologies (77) and operational projects shows that GHG emission reductions can be effectively monitored and that specific project types within the energy sector are responsive to a price incentive linked to carbon. The available CDM methodologies cover a wide range of renewable energy technologies and fossil fuel switching activities. However, despite the diversity of methodologies, the vast majority of projects in the energy sector (total of 26 GW installed capacity) have been limited to large-scale wind and hydropower projects in host countries like China (59% of total) and India (13%). Whereas wind power represents 46% of all power projects, and hydropower a further 44%, only 4% of all activities target biomass energy. Due to the significant upfront capital costs of power generation projects and the income received from the sale of electricity, it is unlikely that projects registered under the CDM will stall due to low carbon prices. This implies that there is little scope for the PAF model to incentivize action within the existing pipeline of projects certified under prevailing carbon standards. Using the PAF model to provide price guarantees that can help overcome the upfront capital costs associated with new projects (both within the carbon markets and beyond) could, however, be a viable approach to increasing the uptake of renewable energy. Given the challenges of overcoming technology- and region-specific differences between projects, the PAF model is likely to have more success in supporting new project development by utilizing a non-CO2 metric in a possible auction. Similar approaches applying an auction mechanism are in fact already being widely applied to foster the commercialization of renewable energy projects, suggesting that the sector could lend itself well to the PAF model if an alternative auction metric were used. Renewable energy auctions – which typically use kWh generated as the auction metric – are becoming an increasingly popular policy instrument to increase the production of renewable energy in a cost-effective manner. The number of countries using auctions for this purpose has increased from nine in 2009 to at least 44 by early 2013, with the majority of auctions occurring in developing countries.52 Winners of renewable energy auctions benefit from top-up payments either in the form of a feed-in premium (which is a subsidy per kWh produced on top of the market price) or a feed-in tariff provided through a power purchase agreement (PPA). Feed-in premiums are often provided in EU countries, while feed-in tariffs are
52 IRENA. Renewable Energy Auctions in Developing Countries. 2013.

Opportunities for Replication and Scale-Up
38
becoming popular in developing countries where the wholesale power market is not yet mature.53 As such, the PAF model linked to an alternative metric (such as MWh of electricity capacity installed, or MWh of renewable electricity delivered) is likely to be successful at supporting the development of new renewable energy projects. To complement the existing and rapidly growing area of renewable energy auctions, the PAF model could specifically target resources for project types that have to date – due to their small size or decentralized, off-grid nature – not been able to obtain standardized PPAs. Limiting an initial auction to a specific technology type could be beneficial in order to create a level playing field amongst bidders. One potential target area could be small scale decentralized mini-grids in rural communities. Box 2 below features a short case study illustrating how such an auction could be organized for solar PV mini-grids in developing countries that lack access to grid-supplied electricity. Another potential area in the energy sector where the PAF model could make a difference is high cost abatement technologies that are not revenue-generating, such as CCS. These project types do not have any income streams other than carbon revenues, and hence are not able to cover their operating costs or recoup the CAPEX in absence of alternative price incentives. Due to their high upfront costs, project types like CCS have not been successfully triggered by existing carbon market crediting schemes. The PAF model could be applied by funders capable of shouldering higher abatement costs to support the implementation of new technologies that are currently not commercially viable.
Industrial Sector The PAF model could provide an additional stimulus to reduce CO2 emissions from fuel combustion and industrial processes from certain projects within the industrial sector, either within the context of existing carbon markets or from new project activities. The industrial sector is the third largest producer of GHG emissions after energy and forestry and land-use, representing just over 20% of global GHG emissions.54 It is estimated that annual emission reductions of 650 to 1,100 MtCO2e could be achieved by 2030 through energy efficiency improvements in countries with high industrial energy consumption.55 The sector captures a range of measures that can be realized at negative abatement costs. For example, abatement costs associated with implementing cogeneration in the iron and steel sector are estimated to be as low as -USD 70 per tCO2e. For clinker replacement, which represents the largest abatement potential for the cement sector, abatement costs are estimated at USD -37 per tCO2e.56 At the high end of the abatement cost curve are certain energy efficiency measures (estimated at USD 40 per tCO2e) or Carbon Capture and Storage (USD 67 per tCO2e).57 As with the energy sector, abatement costs vary by region or country due to differences in grid emission factors, implying that abatement activities using the same technology in different regions may not be equally competitive if their performance is measured against tons of carbon dioxide equivalent avoided.
53 Ecofys. Auctions for Renewable Energy Support: Effective use and efficient implementation options (AURES). 2016.
54 IPCC. 5th Assessment report - Climate Change 2014 Mitigation of Climate Change. 2014. 55 Sitra. Green to Scale. 2015. 56 To reduce energy and process emissions in cement production it is possible to blend cements with increased proportions of alternative (non-clinker) feedstocks, such as volcanic ash, granulated blast furnace slag from iron production, or fly ash from coal-fired power generation. ClimateTechWiki. Energy Efficiency and Saving in the Cement Industry. 2016. 57 IPCC. 5th Assessment report - Climate Change 2014 Mitigation of Climate Change. 2014.

Opportunities for Replication and Scale-Up
39
Industrial activities have benefitted from international carbon crediting schemes, with around 450 projects58 registered under the CDM.59 The strong representation of industrial sector projects in the CDM pipeline suggests a clear responsiveness to a price incentive linked to GHG mitigation results, as well as the availability of effective MRV methodologies. At the same time, the enormous diversity of abatement opportunities within the sector means that there is a wide range of both abatement costs and approaches to MRV (there are a total of 71 different methodologies applied to the industrial sector). This limits the number of projects that have similar technology characteristics and abatement costs and that use a specific MRV methodology meaning that, within carbon market crediting schemes, there is an insufficient volume of similar projects to hold a viable PAF-like auction. The recovery of heat in cement and iron and steel production is a potential exception for which the PAF model could provide the right incentives. There are currently over 200 registered CDM projects in this category, reflecting relatively comparable abatement costs and providing a sufficiently large pool of bidders for a potential auction. However, as with renewable energy projects described in the previous section, given the high upfront capital costs required to initiate these projects, it is unlikely that these projects have stalled. The PAF model could achieve a larger impact by targeting new project activities that are still looking for investment to close an outstanding financing gap. Moving beyond tons of carbon dioxide equivalent to alternative performance metrics could unlock significant potential opportunities to drive abatement – most notably – from energy efficiency measures. A move away from tons of carbon dioxide equivalent as the performance metric would enable projects to overcome both the challenges derived from regional differences in the carbon intensity of their electricity, as well as challenges or complexities surrounding approaches to MRV. An additional benefit of using a non-CO2 metric such as ‘energy savings’ is that it is much more closely linked to a project’s underlying operational effectiveness and cash flow projections, thereby creating a more apparent signal for new projects to become engaged. This is particularly true in countries with unstable energy markets and highly variable electricity prices, where using alternative performance metrics like energy savings could significantly support the uptake of energy services. The Indian Perform, Achieve and Trade (PAT) scheme is one example of how energy efficiency in the industrial sector can be incentivized through a non-CO2 performance metric. The PAT targets energy consumption reductions by setting plant-specific goals instead of sectoral targets. It covers almost 500 facilities and aims to achieve GHG emission reductions of 6.6 million tons of oil equivalent in the first cycle (covering 2012-2015). The participants receive tradable, certified energy savings credits if they achieve efficiency gains beyond their allocated targets.60 The scheme provides an illustration of how baselines can be defined at plant level, how MRV activities of energy savings can be implemented, and how buy-in from industry players can be achieved.
Transport Sector Emissions from the transport sector were estimated at approximately 7 GtCO2e in 2010, equal to 14% of total global GHG emissions.61 In the absence of sustained mitigation policies, transport emissions could grow at a faster rate than emissions of any other sector, making this sector increasingly more important in the context of fighting climate change.
58 Counting all registered projects from EE industry, EE own generation and from the cement sector. 59 UNEP Ozone Secretariat, The Montreal Protocol on substances that deplete the ozone layer, retrieved in May 2016. 60 CDKN. Inside Story: Creating market support for energy efficiency: India’s Perform, Achieve and Trade scheme. 2013. 61 IPCC. 5th Assessment report - Climate Change 2014 Mitigation of Climate Change. 2014.

Opportunities for Replication and Scale-Up
40
Transport offers various mitigation opportunities, some of which come at zero or negative cost while others are more expensive to realize:
- Emissions from road transport could be lowered by 30% of total transport emissions in 2030 (equivalent to 2.76 GtCO2e) compared to a business as usual scenario through a combination of measures, such as enhancing efficiencies of internal combustion engines, increasing fuel-efficiency or switching to biofuels or (renewable) electricity. Abatement costs for road transport range from negative costs of USD -45 USD per tCO2e to over USD 100 per tCO2e. In the long run, abatement costs are expected to fall as efficiency measures are improved and if petroleum prices rise.62
- The abatement potential for air transport is estimated to be equivalent to 24% of total transport emissions in 2030 (equivalent to 0.36 GtCO2e) when compared to a business as usual scenario. This projection includes interventions such as fuel switching, operations-efficiency improvements, and measures related to airport infrastructure and air-traffic control. The aviation sector faces a broad range of abatement costs due to expensive technical measures (such as replacing operating fleets or engines), representing an average abatement cost of around USD 15 in 2030.63
- The abatement potential for sea transport is estimated to represent 24% of total transport emissions in 2030 (equivalent to 0.43 GtCO2e) under a business as usual scenario, largely driven by technological and operational measures. Due to the comparatively low efficiencies of ships, the cost of abating emissions from sea transport is relatively low and can be negative when incorporating rising fuel prices. Abatement costs are estimated to be as low as USD -7.5 in 2030.64
Despite significant abatement potential, the transport sector has not benefitted materially from existing carbon crediting schemes due to complexities surrounding MRV. These challenges are especially salient in the case of passenger and freight transport. Given the experience from the CDM pipeline, it is unlikely that a PAF-like facility using tCO2e as the performance metric would be able to overcome the challenges related to incentivizing GHG mitigation activities in the transport sector, or to overcome the high upfront capital requirements of new projects in this sector. Alternative performance metrics could however be deployed in the context of the PAF model. For example, the provision of shore side electricity to ships at berth in ports could be monitored with a relatively simple approach, as performance could be measured by the MWh produced onshore as compared to the same amount of electricity produced through diesel engines onboard the ships. Yet, a price guarantee to incentivize such an activity would need to overcome the barrier of high capital expenditures and comparatively high operational costs. The generation of shore-side electricity would need to compete with generation of power through tax-free bunker fuels. The absence of regulations with regards to emissions at ports, such as emissions of GHGs, black carbon or noise, also presents barriers to investment. While road, air, and sea transport share several challenges surrounding MRV, the three sub-sectors also face very specific barriers that need to be tackled independently. In the case of road transport, abatement activities would need to target a large number of very small emission sources and to induce behavioural changes in car owners. The PAF model may be inappropriate to target such large numbers of small and dispersed emissions sources through an auction. In civil aviation, the majority of operators and investors are large
62 McKinsey & Company. Pathways to a low-carbon economy -Version 2 of the Global Greenhouse Gas Abatement Cost Curve. 2009. 63 Ibid. 64 Ibid.

Opportunities for Replication and Scale-Up
41
multinational corporations, many of which are also located in industrialised countries. Targeting these as recipients of climate finance provided through a PAF-like auction may not be attractive to international climate finance funders. In the maritime sector, one foreseen difficulty in managing a PAF-like facility is the fact that ship owners may not be the same as operators. Also, different chartering models exist that imply different cost-sharing arrangements and responsibilities for the charterer. These complex arrangements make it challenging to provide the incentives at the right level. While the ship owner is the entity investing in efficiency measures, e.g. a more efficient hull shape of a ship, the cost savings are typically accrued by the operator due to the resulting lower fuel costs. Cost savings induced by operational changes implemented by the operator, such as slow steaming, bring direct benefits to the operator yet these will also have direct implications on the operational processes, e.g. leading to more time needed for a certain distance, which may negatively impact their logistical planning. Even when bound to a different performance metric, a price guarantee disbursed through a PAF-like facility may not be sufficient to overcome these barriers. Another complication is the international nature of the air and maritime sectors, implying that the largest share of generated GHG emissions are not accounted for in national inventories and such emissions are not tackled under existing carbon markets, including the CDM. As such, there is no scope to use the PAF model to revive existing projects that have stopped due to low carbon prices. High upfront costs associated with the described sub-sectors also make it difficult to envisage how a results-based financing scheme designed under the PAF model could effectively stimulate new developments in the sectors. The prospects of a PAF-like facility making a difference in driving low carbon transport activities therefore appear limited.
Energy Efficiency in Buildings The building sector offers opportunities for emission reductions that are potentially suitable for the PAF model. Investing in advanced, clean and energy efficient technologies and buildings in rapidly developing countries is essential, especially as their building stock is rapidly growing. Market failures, however, are currently limiting the uptake of highly energy efficient buildings (especially zero energy buildings). Notably, many cost effective abatement opportunities remain untapped due to the split incentives between a building’s owner and occupants (i.e., the owner invests but the occupant benefits). Other factors include the lack of knowledge about the opportunities available, the reluctance of potential tenants or buyers to pay a premium for an energy efficient building and/or the lengthy payback periods. By offering financial incentives for the development of high energy efficiency technologies in buildings, their uptake and deployment could be widely increased. Substantial abatement could be achieved from the building sector by improving the energy efficiency of new buildings and retrofitting existing buildings. For example, an estimated 2.5 GtCO2e could be reduced by 2030 compared to Business-as-Usual (BAU) by improving the efficiency of existing buildings and their lighting and appliance fixtures. In addition, an estimated 1 GtCO2e could be reduced by 2030 compared to BAU through energy efficiency measures implemented in new residential, commercial and public buildings.65 Abatement costs in the building sector vary greatly depending on the mitigation activity implemented. However, a large number of measures targeted at reducing the energy intensity of the building sector have negative abatement costs. For example, new commercial buildings have negative abatement costs exceeding -11 USD per tCO2e. Retrofitting existing residential buildings have substantially higher marginal costs of around USD 40 per tCO2e.
65 McKinsey & Company. Pathways to a low-carbon economy -Version 2 of the Global Greenhouse Gas Abatement Cost Curve. 2009.

Opportunities for Replication and Scale-Up
42
Despite the significant mitigation potential in the sector, success in attracting participation of the sector in carbon crediting schemes has been minimal. There are only 132 registered CDM projects.66, 67, 68 One reason for this could be the high MRV costs associated with mitigation actions in the building sector due to the dispersed nature of emissions sources and the stringent requirements of carbon crediting schemes. Two issues have been identified as core reasons why the sector has not benefited greatly from carbon and climate finance so far:
- Firstly, the benefits from energy efficiency measures in buildings are typically redeemed by the building’s residents, while the costs for implementing these measures lie with the building’s owner. The market rental price in developing countries may not reflect the difference in energy demand of conventional buildings and energy efficient buildings as residents do not recognize the potential savings that would accrue from more efficient buildings and prioritize other factors (e.g. location, appearance) above energy efficiency. Hence, owners and investors are not able to cover higher capital expenditures for new residential buildings through market prices and will find it difficult to get funding from banks to finance these energy efficiency measures.
- Secondly, a building’s actual energy consumption is driven by a combination of both technological and behavioral factors: the efficiency of a building’s infrastructure, the equipment used therein, user behavior, annually changing climatic conditions and economic development. Consequently, the introduction of energy efficiency measures in buildings does not necessary lead to a real measureable reduction in the actual energy consumed (e.g., the installation of efficient heating systems could lead to the building’s residents heating the building to a higher temperature than before, leading to an increase in actual energy consumed). This difference in actual energy demand and energy consumption typically makes MRV systems based on the metric of tons of carbon dioxide equivalent very complex.
While the CDM has looked to overcome some of these barriers through implementing PoAs rather than individual activities, the sector’s structural issues suggest that within carbon markets, it is unlikely that a PAF-like approach would be able to stimulate significant additional abatement from either existing or new projects. In order to overcome the investment hurdles and increase the incentive for energy efficiency measures, a future PAF-like facility could, however, look to incentivize new projects that use alternative performance metrics, such as area of certified green building, or number of appliances installed, which are significantly easier to assess and monitor. Box 3 presents an example of how this could work for energy efficiency measures implemented in residential buildings.
Non-CO2 Industrial Gas Emissions Industrial gases cover hydrofluorocarbons (HFCs), perfluorocarbons (PFCs), nitrous oxide (N2O) and sulphur hexafluoride (SF6), all of which have very high global warming potentials (GWP). Of the four types of industrial gases, SF6 has by far the highest GWP of 23,500. HFC-23 has a GWP of 12,400, whereas PFCs have a GWP range from 6,500 to 9,200, and N2O has a GWP of 265.69 Due to their high GWP, these gases offer significant abatement potential. Over the period from 2013 to 2030, for example, 7.5 GtCO2e of existing HFC-23
66 IEA. Two Billion Tonne Climate Bomb: How to Defuse the HFC-23 Problem. 2013. 67 UNEP. Common Carbon Metric – Protocol for Measuring Energy Use and Reporting Greenhouse Gas Emissions from Building Operations. 2010. 68 UNEP DTU. CDM Pipeline. 2016. 69 IPCC. 5th Assessment report - Climate Change 2014 Mitigation of Climate Change. 2014.

Opportunities for Replication and Scale-Up
43
and N2O emissions could be abated. Further abatement potential is related to the substantial growth of the sector and from the other gases, such as PFCs and SF6.
Forestry and Land Use According to the IPCC Fifth Assessment Report, annual CO2 emissions from forestry and land-use are about 4 GtCO2e. Significant potential exists for emission reductions from this sector.70 Forestry and land use projects from both the CDM and other carbon standards are, however, expected to reduce less than 0.7 GtCO2e by 2030. Currently 99% of the abatement verified in the forestry and land use sector is from forestry projects and mostly from Reducing Emissions from Deforestation and Forest Degradation (REDD) projects certified under the Verified Carbon Standard (VCS). Based on the assessment of the current portfolio of VCS REDD projects, it can reasonably be expected that significant GHG mitigation could be achieved with an abatement cost of around USD 5 per tCO2e in the forestry sector. Several MRV approaches have been developed for the forestry sector. MRV of forestry projects involves the sampling and measurement of individual trees as well as the entire forest coverage and composition. Due to variability in soil conditions and MRV challenges, agriculture projects may be less suitable for the PAF model than forestry projects. In addition, given the historic lack of activity from Land Use, Land Use Change and Forestry (LULUCF) within the CDM, the current pipeline of projects in this sector is very small. This suggests that existing LULUCF projects developed under the CDM are not suitable for scale-up and replication of the PAF model. A PAF-like facility could, however, be considered for new abatement from existing and new forestry projects using the methodologies from other carbon standards such as the VCS or the Gold Standard. Such an approach could focus on the low cost options in the forestry sector using suitable eligibility criteria. Both the VCS and Gold Standard apply a buffer pool approach to account for non-permanence risks, with well-developed MRV approaches. Only projects that do not involve harvesting would be included to reduce the due diligence burden and focus attention on projects most responsive to pricing. Of these, REDD projects make up the majority of the current abatement potential71 and the VCS is the only major certification standard applicable for REDD. Subsequently a PAF-like facility could narrow the scope further to include just VCS REDD projects. An alternative option to drive additional abatement and new projects from the sector could be to move away from the tons of carbon dioxide equivalent metric to an area-based metric. Such a metric would allow a focus on a highly visible and easily understandable result of deforestation prevention. This approach, coupled with a standardized area-to-carbon-abatement conversion rate, would also reduce the resources needed for MRV and GHG quantification, a significant barrier to carbon markets for forestry and land use projects. However, considering that there is currently no readily available MRV methodology for this approach and the time required to develop such MRV approaches is expected to be lengthy, this option would be mostly relevant for consideration in the long-term. To conclude, of all LULUCF project types, VCS REDD projects utilizing a tons of carbon dioxide equivalent metric seem the most appropriate and practical sector for inclusion in a future PAF-like facility. An option could also be to focus on Africa which has over 30% of the abatement potential and could attract interest from funders. While certain donor preferences to purchase forestry credits from jurisdictions as opposed to private entities may limit the
70 IPCC. 5th Assessment report - Climate Change 2014 Mitigation of Climate Change. 2014. 71 Over 87% of the annual abatement potential from VCS forestry projects are from the REDD sector. There are currently only two forestry projects registered with the Gold Standard both ARR.

Opportunities for Replication and Scale-Up
44
choice of potential funders, large opportunities remain for potential funders from the private sector, including aviation.