oppgow7&timizing for power7 & aix what’s...
TRANSCRIPT
Optimizing for POWER7 &p g o W 7 &AIX What’s New
Q4 2012
Steve Nasypany – [email protected] Advanced Technical Skills
© 2012 IBM Corporation
Agenda
Performance Advisors Update
POWER7 Optimization & Tuning Guide
Active Memory Expansion POWER7+Active Memory Expansion POWER7+
SMT, Dispatch, Consumption Review
Scaled Throughput
Dynamic System Optimizer Overview
Miscellaneous New Features
Backup: APARs to Know, “Entitlement, Memory & Partition Placement,” Best
Practices/SPPL
© 2012 IBM Corporation2
Performance AdvisorsUpdate
© 2012 IBM Corporation3
Performance Advisors
IBM Systems development has created a set of applications that run on customer systems, perform measurements, and collect key performance metricsy , p , y p
– The goal of these advisors is to provide an expert system or “health check” view of customer Java, VIOS and Virtualization environments
– Each tool performs an assessment and provides recommendations based on real world experienceEasy to install and configure and can be used for varying profile periods from– Easy to install and configure and can be used for varying profile periods from minutes to 1 day
■ Java Advisor– Validation of AIX, WAS and Java levels for best performance
f f f– Monitoring of JVM configuration and Java processes for tuning recommendationshttps://www.ibm.com/developerworks/wikis/display/WikiPtype/Java+Performance+Advisor
■ VIOS Advisor– On The Web
• Monitoring of primary VIOS performance metrics for memory and cpu settings• Is my I/O Adapter capable of sustaining more partitions?• Detailed SEA analysis added in May 2012
http://www ibm com/developerworks/wikis/display/WikiPtype/VIOS+Advisorhttp://www.ibm.com/developerworks/wikis/display/WikiPtype/VIOS+Advisor
– SHIPPING WITH Virtual I/O Server Version 2.2.2.0• Web version function + can post-process nmon recordings• Missing SEA function available in Web version (coming in 2013)
© 2012 IBM Corporation4
http://pic.dhe.ibm.com/infocenter/powersys/v3r1m5/index.jsp?topic=/p7hb1/iphb1_vios_perf_adv.htm
PowerVM Virtualization Performance Advisor
LPAR Mode: runs within an AIX partition (dedicated or shared), analyzes CPU memory IO characteristics and provides a health check reportCPU, memory, IO characteristics and provides a health check report.
BETA SYSTEM M d ll f i d idBETA SYSTEM Mode: collects performance metrics and provides reports from all the LPARs in the Power system
■ Available this week. This is a surprise for 2012! We were not expecting this until much later next year!until much later next year!
■ We will have education on this in Q1 https://www.ibm.com/developerworks/mydeveloperworks/wikis/home/wiki/Power%20Systems/page/PowerVM%20Virtualization%20Performance%20Advisor?lang=en
© 2012 IBM Corporation5
POWER7 Optimization pand Tuning Guide
© 2012 IBM Corporation6
POWER7 Optimization & Tuning Guide
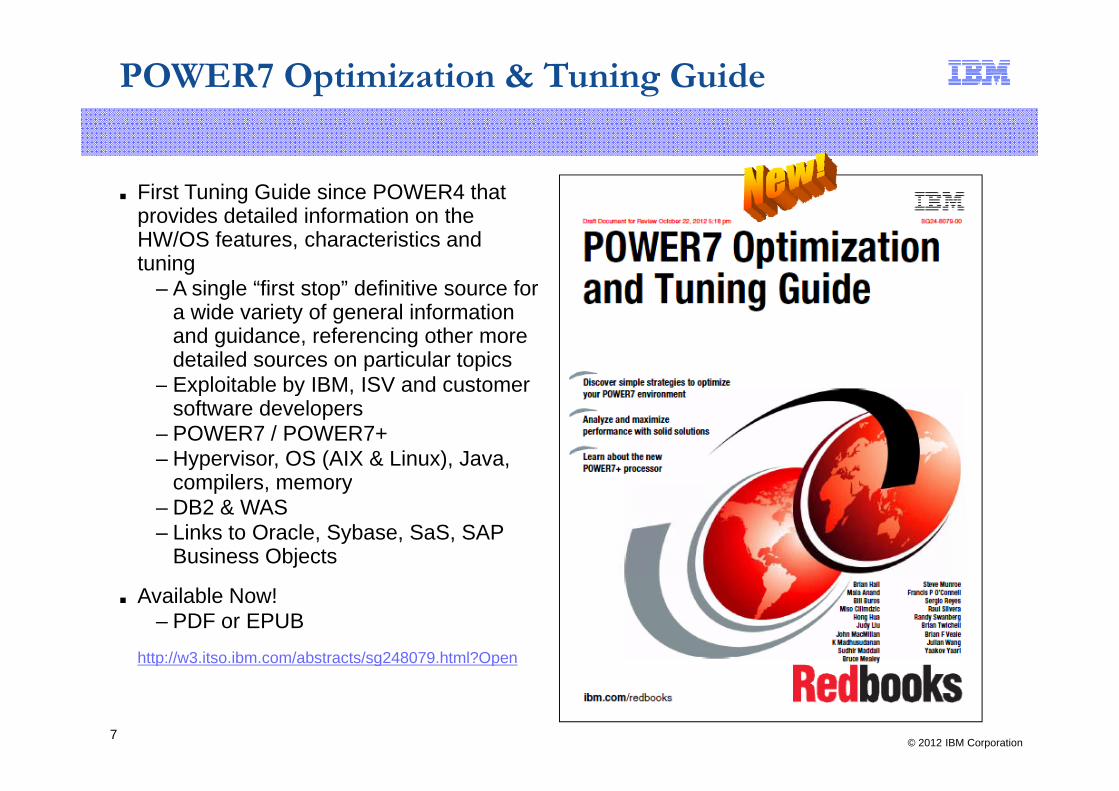
■ First Tuning Guide since POWER4 that provides detailed information on theprovides detailed information on the HW/OS features, characteristics and tuning
– A single “first stop” definitive source for id i t f l i f tia wide variety of general information
and guidance, referencing other more detailed sources on particular topics
– Exploitable by IBM, ISV and customer p ysoftware developers
– POWER7 / POWER7+– Hypervisor, OS (AIX & Linux), Java,
compilers memorycompilers, memory– DB2 & WAS– Links to Oracle, Sybase, SaS, SAP
Business Objects
■ Available Now!– PDF or EPUB
http://w3.itso.ibm.com/abstracts/sg248079.html?Open
© 2012 IBM Corporation7
p g p
POWER7 Optimization & Tuning Guide
© 2012 IBM Corporation8

POWER7 Virtualization BP & Tricks
■ POWER7 Virtualization Best Practices– This whitepaper covers Virtual Processor sizing in detailp p g– Memory Affinity on workloads and how to tune
http://www.ibm.com/developerworks/wikis/display/WikiPtype/Performance+Monitoring+Documentation
■ Optimizing IBM DB2 pureScale transaction throughput in virtualized IBM Power (a good f f t f kl d t j t DB2)reference for any type of workload, not just DB2)
http://www.ibm.com/developerworks/aix/library/au-aix-optimize-ibm-db2/index.html
■ Learn about AIX Enhanced AffinityCovered in Backup material– Covered in Backup material
– Learn tool function like topas –M to view affinity metrics and lssrad –va to check for logical placement. Fewer books (avoiding far dispatches) is usually better, but modern DB products are designed to scale and perform well without issues for larger allocations.
If partition placement causes performance issues these papers discuss other options■ If partition placement causes performance issues these papers discuss other options. Summarizing:– Small changes to a partitions memory profile while powered off may “bump” placement – The HMC chhwres command can be used to clear allocations (this can be done partially for
less important partitions to make more room for critical partitions, or can be done for all)R li th ti f ill l i t– Recycling the entire frame will clear resource assignments
– Activate most important partitions first. The hypervisor will align partitions more favorably based on larger resources being available in cpu pool and memory.
– The hypervisor will remember these allocations, even if some partitions are later rebooted– Power up VIOS instances last. Dependent partitions will receive allocations and spin until
© 2012 IBM Corporation9
p p p pVIOS is running.
Active Memory Expansion Accelerated
© 2012 IBM Corporation10
POWER7+ AME Accelerator
Client Benefits
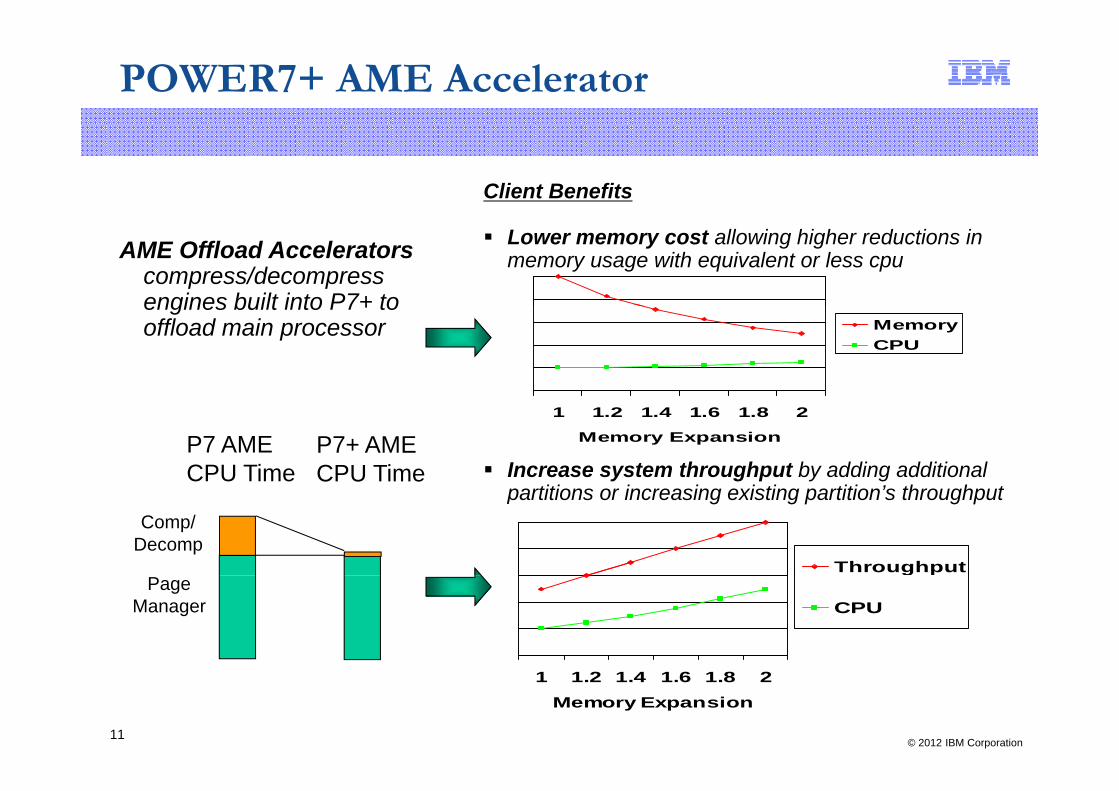
Lower memory cost allowing higher reductions in memory usage with equivalent or less cpuAME Offload Accelerators
compress/decompress engines built into P7+ toengines built into P7+ to offload main processor Memory
CPU
Increase system throughput by adding additional titi i i i ti titi ’ th h t
1 1.2 1.4 1.6 1.8 2
Memory ExpansionP7 AMECPU Time
P7+ AMECPU Time
partitions or increasing existing partition’s throughput
Throughput
Comp/Decomp
g p
CPUPage
Manager
© 2012 IBM Corporation11
1 1.2 1.4 1.6 1.8 2Memory Expansion
AME Workloads
■ amepat tool easily profiles existing workloads– Reports expansion factors available and corresponding CPU requirements– Can be run on POWER5, POWER6 or POWER7 systems with AIX 6.1– Has been updated to provide choice between POWER7 or POWER7+
■ Workloads ideal for Active Memory Expansion are the same as before– Multi-threaded, light-weight applications that are not highly memory transaction
intensive (ERP, OLTP, etc)– POWER7+ must still break down larger memory pages into 4K (small) pages soPOWER7+ must still break down larger memory pages into 4K (small) pages, so
workloads that benefit from using 64K (medium) or 16MB (large) page sizes will be impacted (think Oracle SGA or multi-GB, very intensive JVM heaps)
– 64K page benefit can be over 10% for some workloadsRefer to AME Wiki for usage and performance whitepaper for examples/tradeoffs– Refer to AME Wiki for usage and performance whitepaper for examples/tradeoffs
https://www.ibm.com/developerworks/wikis/display/WikiPtype/IBM+Active+Memory+Expansion
■ Use of 64K pages by applications can be viewed using the svmon –P command to p g y pp gidentifying if small (s) or medium (m) pages are prevalent
© 2012 IBM Corporation12
AME amepat Comparison
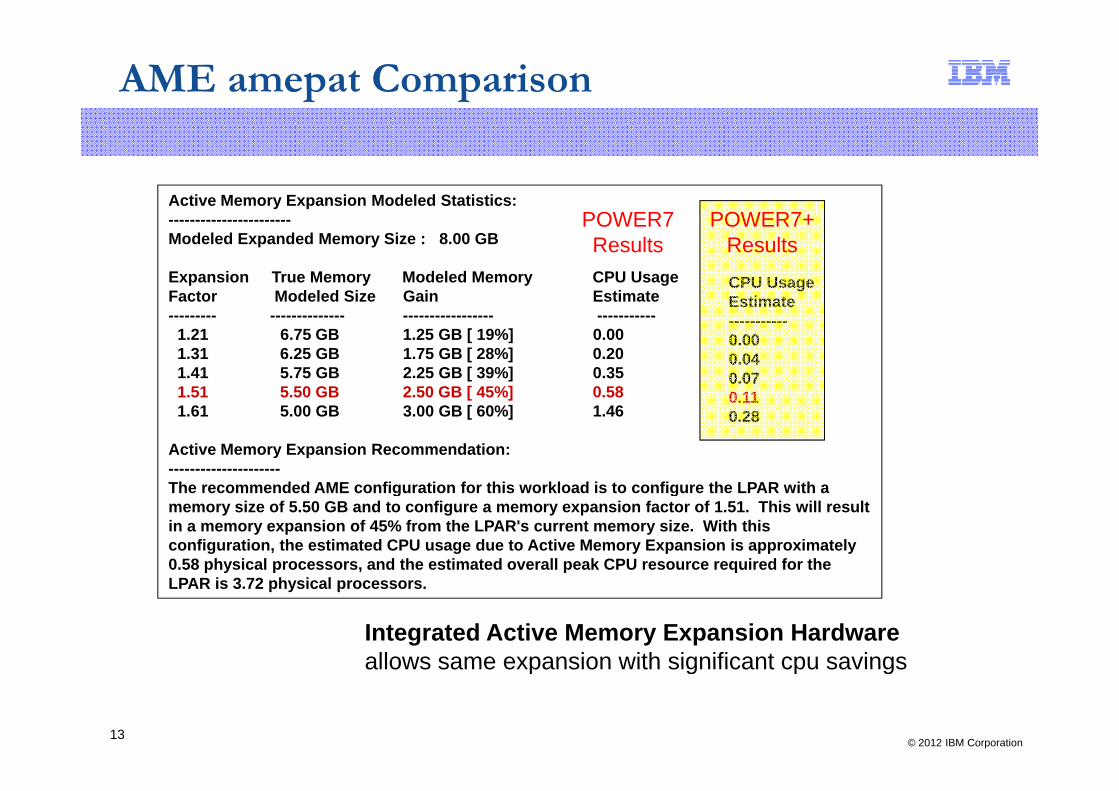
Active Memory Expansion Modeled Statistics:POWER7 POWER7+-----------------------
Modeled Expanded Memory Size : 8.00 GB
Expansion True Memory Modeled Memory CPU UsageFactor Modeled Size Gain Estimate
POWER7Results
CPU UsageEstimate
POWER7+Results
--------- -------------- ----------------- -----------1.21 6.75 GB 1.25 GB [ 19%] 0.00 1.31 6.25 GB 1.75 GB [ 28%] 0.20 1.41 5.75 GB 2.25 GB [ 39%] 0.351.51 5.50 GB 2.50 GB [ 45%] 0.58
Estimate-----------0.00 0.04 0.070 111.51 5.50 GB 2.50 GB [ 45%] 0.58
1.61 5.00 GB 3.00 GB [ 60%] 1.46
Active Memory Expansion Recommendation:---------------------The recommended AME configuration for this workload is to configure the LPAR with a
0.110.28
The recommended AME configuration for this workload is to configure the LPAR with a memory size of 5.50 GB and to configure a memory expansion factor of 1.51. This will result in a memory expansion of 45% from the LPAR's current memory size. With this configuration, the estimated CPU usage due to Active Memory Expansion is approximately 0.58 physical processors, and the estimated overall peak CPU resource required for the LPAR is 3.72 physical processors.
Integrated Active Memory Expansion Hardwareallows same expansion with significant cpu savings
© 2012 IBM Corporation13
allows same expansion with significant cpu savings
SMT, Dispatch Behavior, and Physical Consumption
ReviewReview
© 2012 IBM Corporation14
POWER6 vs POWER7 SMT Utilization
busy
POWER6 SMT2
Htc0 100% busy
POWER7 SMT4
65%busy
POWER7 SMT2
70%Htc0 Htc0busy
idle
Htc0
Htc1
100% busy
busy
idle
~65% busy
idle
idle
busy
idle
~70% busy
Htc0
Htc1
Htc0
Htc1
Htc2
Htc3
busy
busy100% busy
busy
busy100% busy
Htc0
Htc1
Htc0
Htc1 “busy” = user% + system%
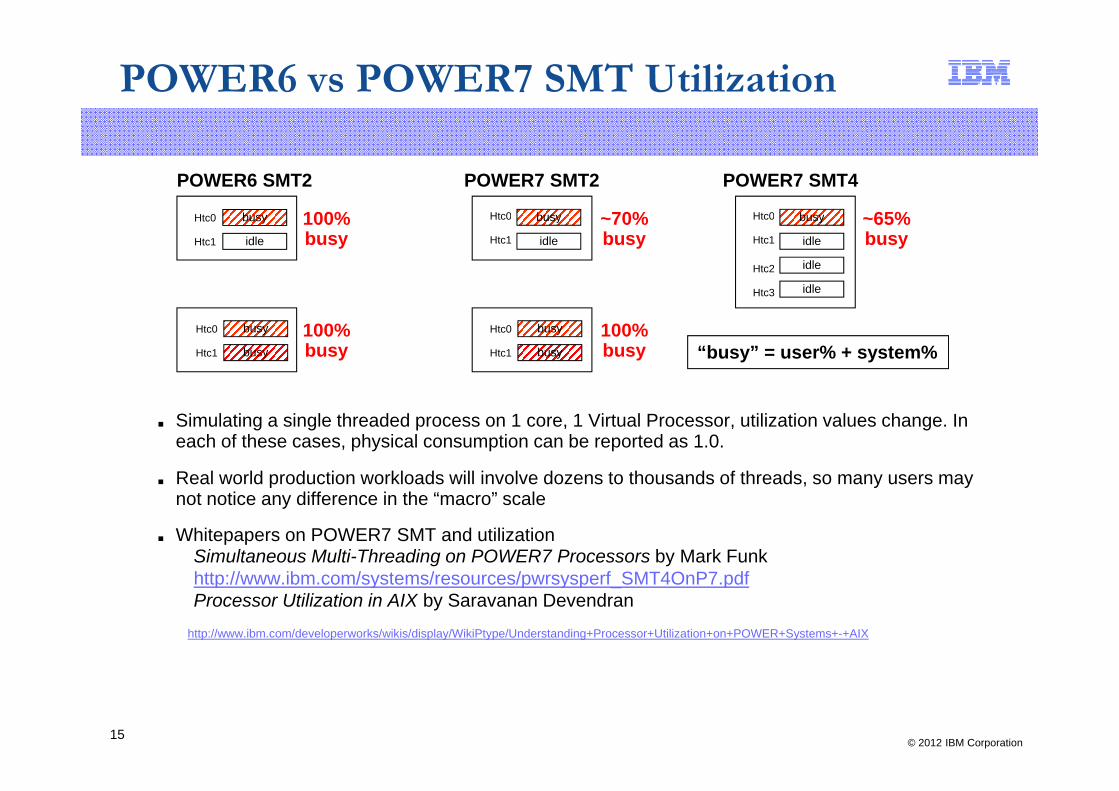
■ Simulating a single threaded process on 1 core, 1 Virtual Processor, utilization values change. In each of these cases, physical consumption can be reported as 1.0.
■ Real world production workloads will involve dozens to thousands of threads, so many users may p , y ynot notice any difference in the “macro” scale
■ Whitepapers on POWER7 SMT and utilizationSimultaneous Multi-Threading on POWER7 Processors by Mark Funkhttp://www ibm com/systems/resources/pwrsysperf SMT4OnP7 pdfhttp://www.ibm.com/systems/resources/pwrsysperf_SMT4OnP7.pdfProcessor Utilization in AIX by Saravanan Devendran
http://www.ibm.com/developerworks/wikis/display/WikiPtype/Understanding+Processor+Utilization+on+POWER+Systems+-+AIX
© 2012 IBM Corporation15
SMT, Dispatch Behavior & Consumption
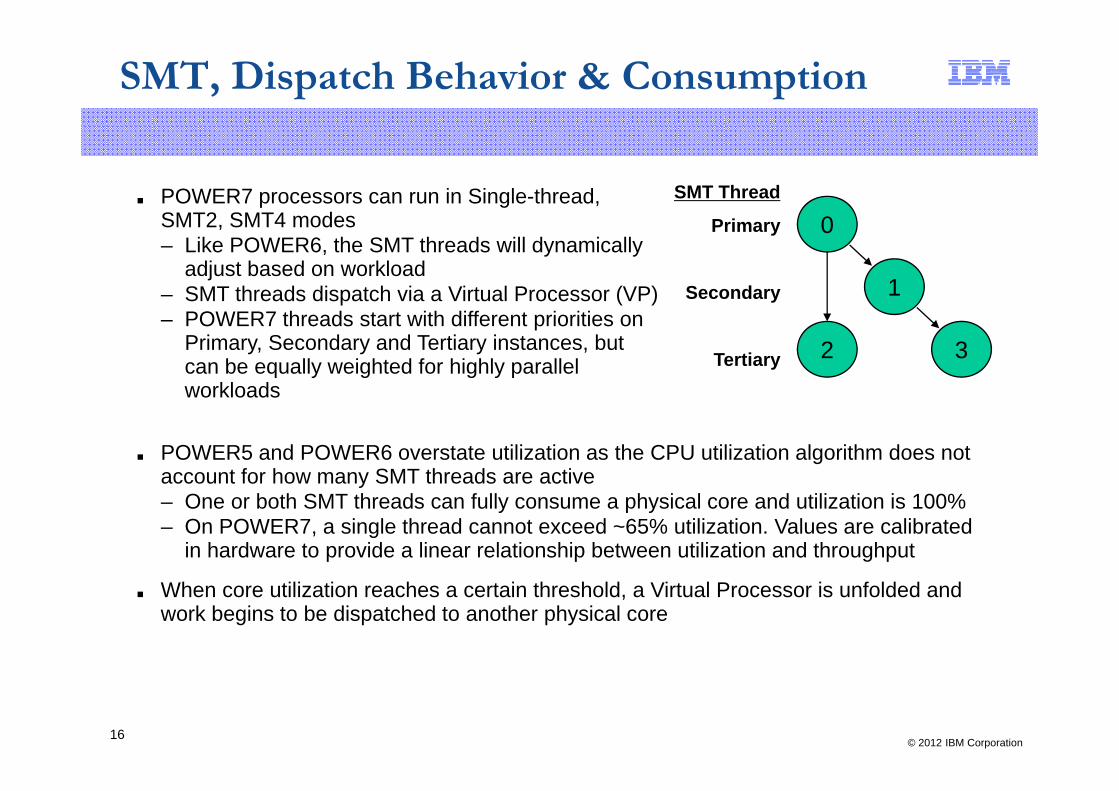
0SMT Thread■ POWER7 processors can run in Single-thread,
SMT2 SMT4 modes 0
1
Primary
Secondary
SMT2, SMT4 modes– Like POWER6, the SMT threads will dynamically
adjust based on workload– SMT threads dispatch via a Virtual Processor (VP)
2 3Tertiary
– POWER7 threads start with different priorities on Primary, Secondary and Tertiary instances, but can be equally weighted for highly parallel workloadsworkloads
■ POWER5 and POWER6 overstate utilization as the CPU utilization algorithm does not account for how many SMT threads are activey– One or both SMT threads can fully consume a physical core and utilization is 100%– On POWER7, a single thread cannot exceed ~65% utilization. Values are calibrated
in hardware to provide a linear relationship between utilization and throughput
■ When core utilization reaches a certain threshold, a Virtual Processor is unfolded and work begins to be dispatched to another physical core
© 2012 IBM Corporation16
POWER6 vs POWER7 Dispatch
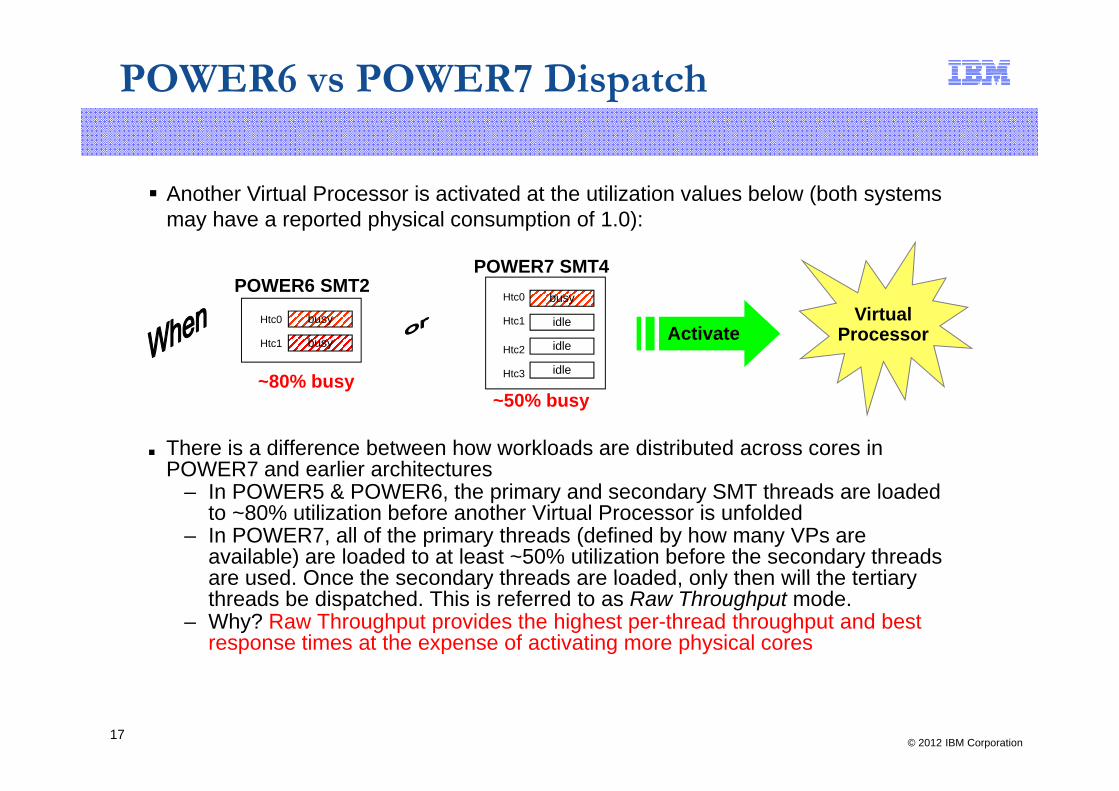
Another Virtual Processor is activated at the utilization values below (both systems may have a reported physical consumption of 1 0):
POWER6 SMT2busy
POWER7 SMT4Htc0
may have a reported physical consumption of 1.0):
idle
50% b
idle
idle
busy
busy
~80% busy
Htc0
Htc1
Htc1
Htc2
Htc3
VirtualProcessorActivate
■ There is a difference between how workloads are distributed across cores in POWER7 and earlier architectures
I POWER5 & POWER6 th i d d SMT th d l d d
~50% busy
– In POWER5 & POWER6, the primary and secondary SMT threads are loaded to ~80% utilization before another Virtual Processor is unfolded
– In POWER7, all of the primary threads (defined by how many VPs are available) are loaded to at least ~50% utilization before the secondary threads are used Once the secondary threads are loaded only then will the tertiaryare used. Once the secondary threads are loaded, only then will the tertiary threads be dispatched. This is referred to as Raw Throughput mode.
– Why? Raw Throughput provides the highest per-thread throughput and best response times at the expense of activating more physical cores
© 2012 IBM Corporation17
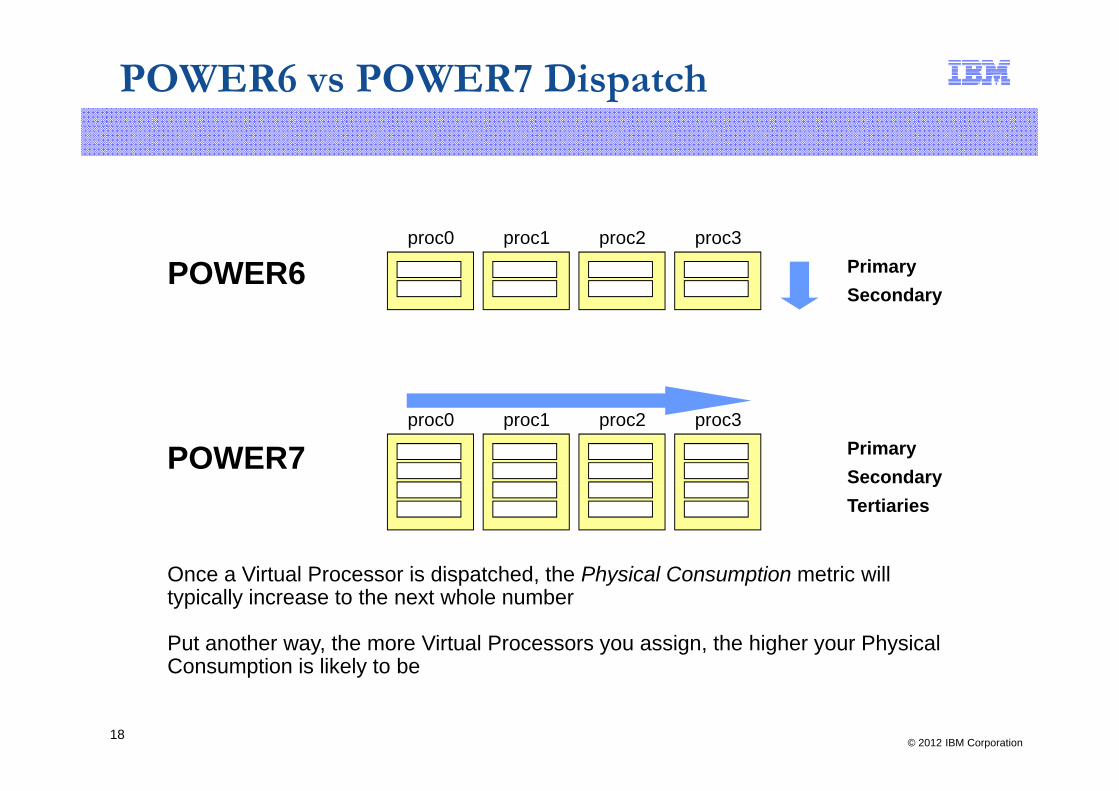
POWER6 vs POWER7 Dispatch
proc0 proc1 proc2 proc3
POWER6 PrimarySecondary
proc0 proc1 proc2 proc3PrimarySecondary
POWER7
Once a Virtual Processor is dispatched the Physical Consumption metric will
yTertiaries
Once a Virtual Processor is dispatched, the Physical Consumption metric will typically increase to the next whole number
Put another way, the more Virtual Processors you assign, the higher your Physical Consumption is likely to be
© 2012 IBM Corporation18
Consumption is likely to be
POWER7 Consumption: A Problem?
■ POWER7 may activate more cores at lower utilization levels than earlier■ POWER7 may activate more cores at lower utilization levels than earlier architectures when excess VP’s are present
■ Customers may complain that the physical consumption (physc or pc) metric is equal to or possibly even higher after migrations to POWER7 from earlieris equal to or possibly even higher after migrations to POWER7 from earlier architectures. They may also note that CPU capacity planning is more difficult in POWER7 (discussion to follow)
Expect every POWER7 customer with this complaint to also have significantly■ Expect every POWER7 customer with this complaint to also have significantly higher idle% percentages over earlier architectures
■ Expect that they are consolidating workloads and may also have many more VP’s assigned to the POWER7 partitionVP s assigned to the POWER7 partition.
© 2012 IBM Corporation19
POWER7 Consumption: Solutions
■ Apply APARs in backup section, these can be causal for many of the high consumption complaintsp p
■ Beware of customers allocating many more Virtual Processors than sized – educate or ask for help. Once they are over-allocated, they are resistant to change because they have an absolute view of the physical consumption metric.
■ Reduce Virtual Processor counts to activate secondary and tertiary SMT threads– Utilization percentages will go up, physical consumption will remain equal or drop– Use nmon, topas, sar or mpstat to look at logical CPUs. If only primary SMT
threads are in use with a multi-threaded workload, then excess VP’s are present.
■ Use realistic entitlement settings for critical, larger workloads– Start with a Capacity Entitlement/Virtual Processor ratio of 0.6– See Rosa Davidson’s Return to Basics: POWER7 Capacity Entitlement and
Virtual Processors– There is no rule-of-thumb for all workloads
• We usually don’t care about the ratio on small partitions with a few VP’s weWe usually don t care about the ratio on small partitions with a few VP s, we care about larger partitions that are often found to be running consistently over entitlement
• We do care about VIOS, particularly those hosting production networks/SEA. These should never consistently run > 100% entitlement
© 2012 IBM Corporation20
These should never consistently run > 100% entitlement
■ A new alternative is available and will be covered in the next section
POWER7 Consumption: Capacity Planning
■ Because POWER5 and POWER6 SMT utilization will always be at or above 80% before another VP is activated utilization ratios (80% or 0 8 of a core) and physc ofbefore another VP is activated, utilization ratios (80% or 0.8 of a core) and physc of 1.0 core may be closer to each other than POWER7 environments
– Physical Consumption alone was close enough for capacity planning in POWER5/POWER6 and many customers use thisThi t b t i POWER7 i t h VP t– This may not be true in POWER7 environments when excess VPs are present
■ Under the default “Raw” throughput mode, customers that do not want to reduce VPs may want to deduct higher idle buckets (idle + wait) from capacity planning metric(s)
Physical Busy = (User + System)% X Reported Physical Consumption
■ This is reasonable presuming the workload benefits from SMT. This will not work with single threaded “hog” processes that want to consume a full corewith single-threaded hog processes that want to consume a full core.
■ AIX 6.1 TL8 & AIX 7.1 TL2 offer an alternative VP activation mechanism known as “Scaled Throughput”. This can provide the option to make POWER7 behavior more “POWER6 Like” but this is a generalized statement and not a technical onePOWER6 Like – but this is a generalized statement and not a technical one.
© 2012 IBM Corporation21
Scaled ThroughputScaled Throughput
© 2012 IBM Corporation22
What is Scaled Throughput?
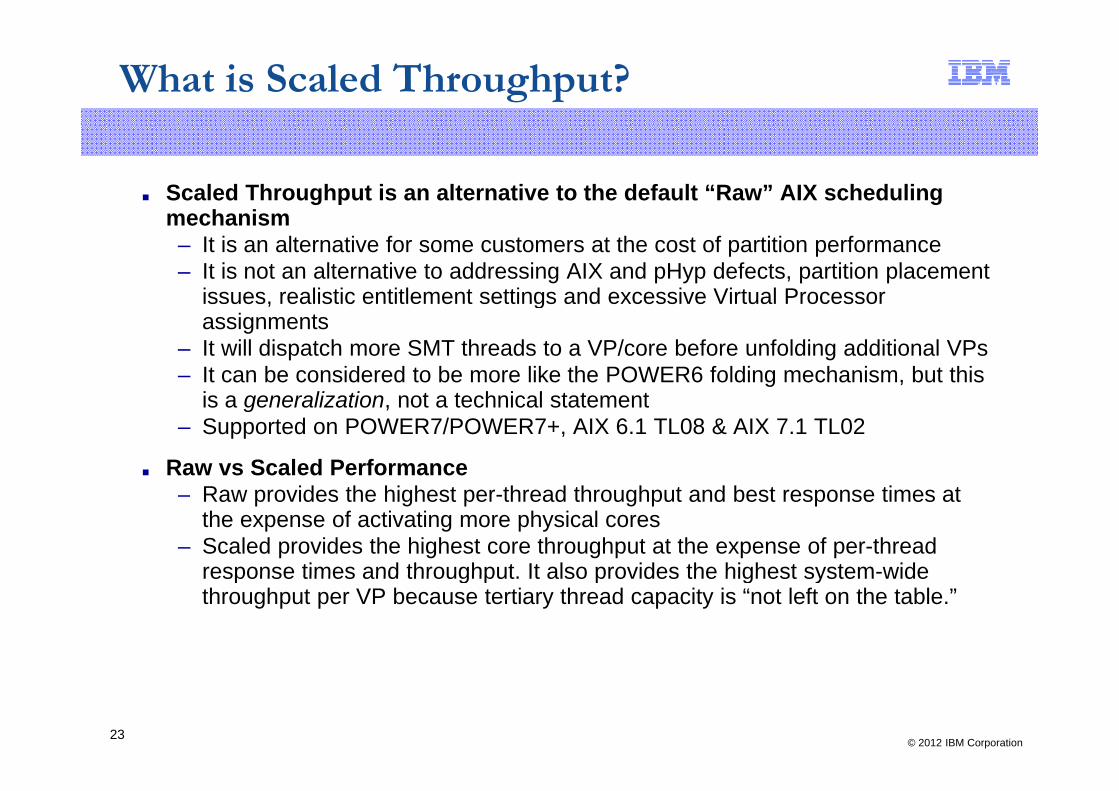
■ Scaled Throughput is an alternative to the default “Raw” AIX scheduling mechanismmechanism– It is an alternative for some customers at the cost of partition performance– It is not an alternative to addressing AIX and pHyp defects, partition placement
issues, realistic entitlement settings and excessive Virtual Processor , gassignments
– It will dispatch more SMT threads to a VP/core before unfolding additional VPs– It can be considered to be more like the POWER6 folding mechanism, but this
is a generali ation not a technical statementis a generalization, not a technical statement– Supported on POWER7/POWER7+, AIX 6.1 TL08 & AIX 7.1 TL02
■ Raw vs Scaled Performance– Raw provides the highest per-thread throughput and best response times at
the expense of activating more physical cores– Scaled provides the highest core throughput at the expense of per-thread
response times and throughput It also provides the highest system-wideresponse times and throughput. It also provides the highest system wide throughput per VP because tertiary thread capacity is “not left on the table.”
© 2012 IBM Corporation23
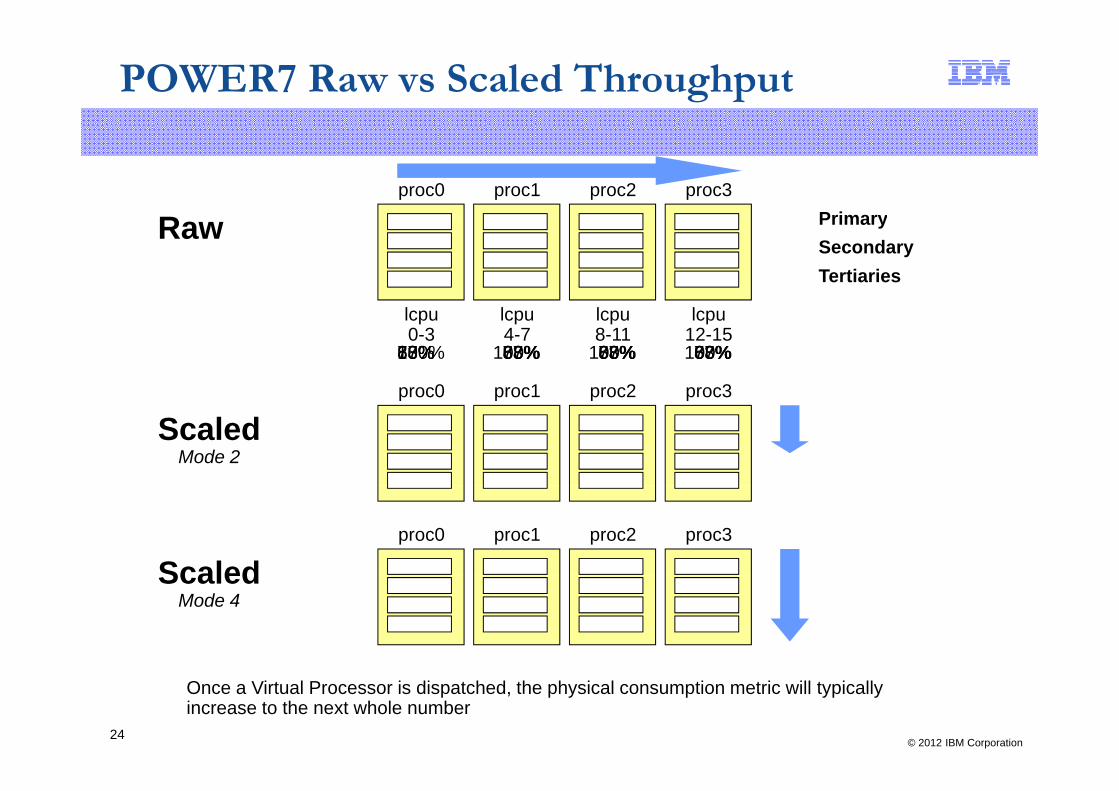
POWER7 Raw vs Scaled Throughput
proc0 proc1 proc2 proc3PrimaryR PrimarySecondaryTertiaries
Raw
lcpu0-3
lcpu4-7
lcpu8-11
lcpu12-15
63% 63% 63% 63%77% 77% 77% 77%88% 88%88% 88%100%100% 100% 100%
proc0 proc1 proc2 proc3proc0 proc1 proc2 proc3
ScaledMode 2
proc0 proc1 proc2 proc3
ScaledScaledMode 4
© 2012 IBM Corporation24
Once a Virtual Processor is dispatched, the physical consumption metric will typically increase to the next whole number
Scaled Throughput: Tuning
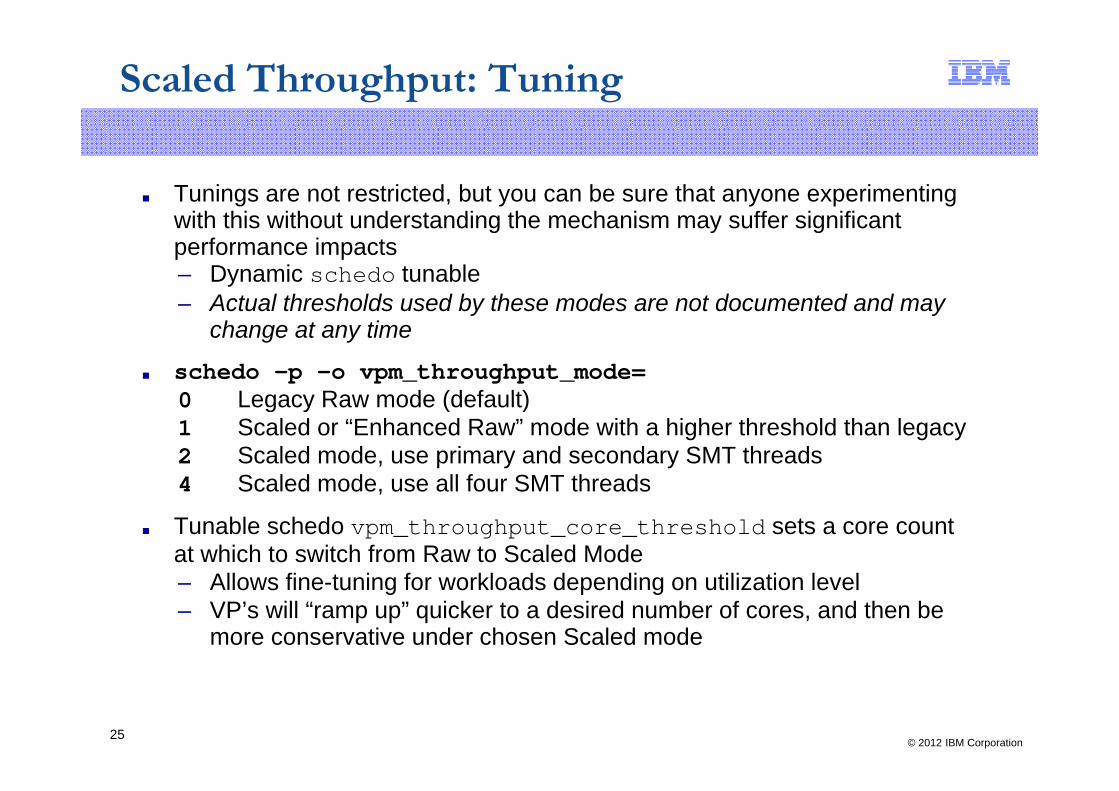
■ Tunings are not restricted, but you can be sure that anyone experimenting with this without understanding the mechanism may suffer significantwith this without understanding the mechanism may suffer significant performance impacts– Dynamic schedo tunable– Actual thresholds used by these modes are not documented and mayActual thresholds used by these modes are not documented and may
change at any time
■ schedo –p –o vpm_throughput_mode=0 Legacy Raw mode (default)0 Legacy Raw mode (default)1 Scaled or “Enhanced Raw” mode with a higher threshold than legacy2 Scaled mode, use primary and secondary SMT threads4 Scaled mode use all four SMT threads4 Scaled mode, use all four SMT threads
■ Tunable schedo vpm_throughput_core_threshold sets a core count at which to switch from Raw to Scaled Mode
All fi t i f kl d d di tili ti l l– Allows fine-tuning for workloads depending on utilization level– VP’s will “ramp up” quicker to a desired number of cores, and then be
more conservative under chosen Scaled mode
© 2012 IBM Corporation25
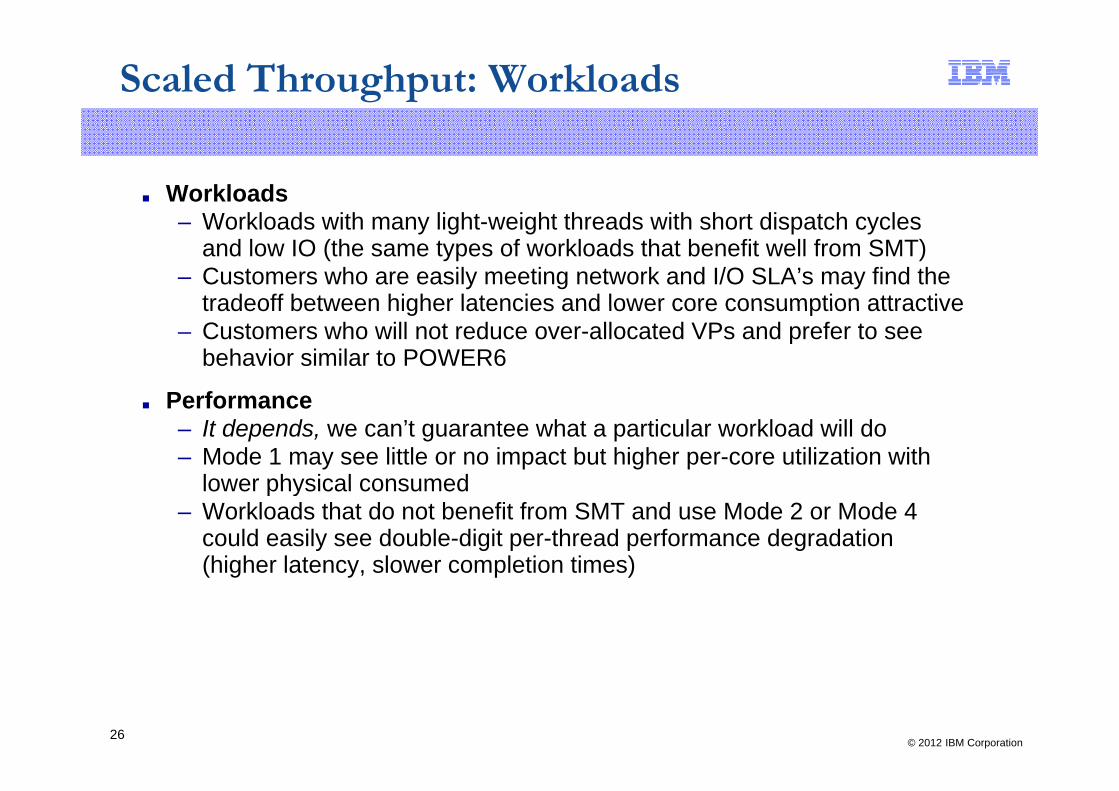
Scaled Throughput: Workloads
■ WorkloadsW kl d ith li ht i ht th d ith h t di t h l– Workloads with many light-weight threads with short dispatch cycles and low IO (the same types of workloads that benefit well from SMT)
– Customers who are easily meeting network and I/O SLA’s may find the tradeoff between higher latencies and lower core consumption attractivetradeoff between higher latencies and lower core consumption attractive
– Customers who will not reduce over-allocated VPs and prefer to see behavior similar to POWER6
P f■ Performance– It depends, we can’t guarantee what a particular workload will do – Mode 1 may see little or no impact but higher per-core utilization with
lower physical consumedlower physical consumed– Workloads that do not benefit from SMT and use Mode 2 or Mode 4
could easily see double-digit per-thread performance degradation (higher latency, slower completion times)( g y, p )
© 2012 IBM Corporation26
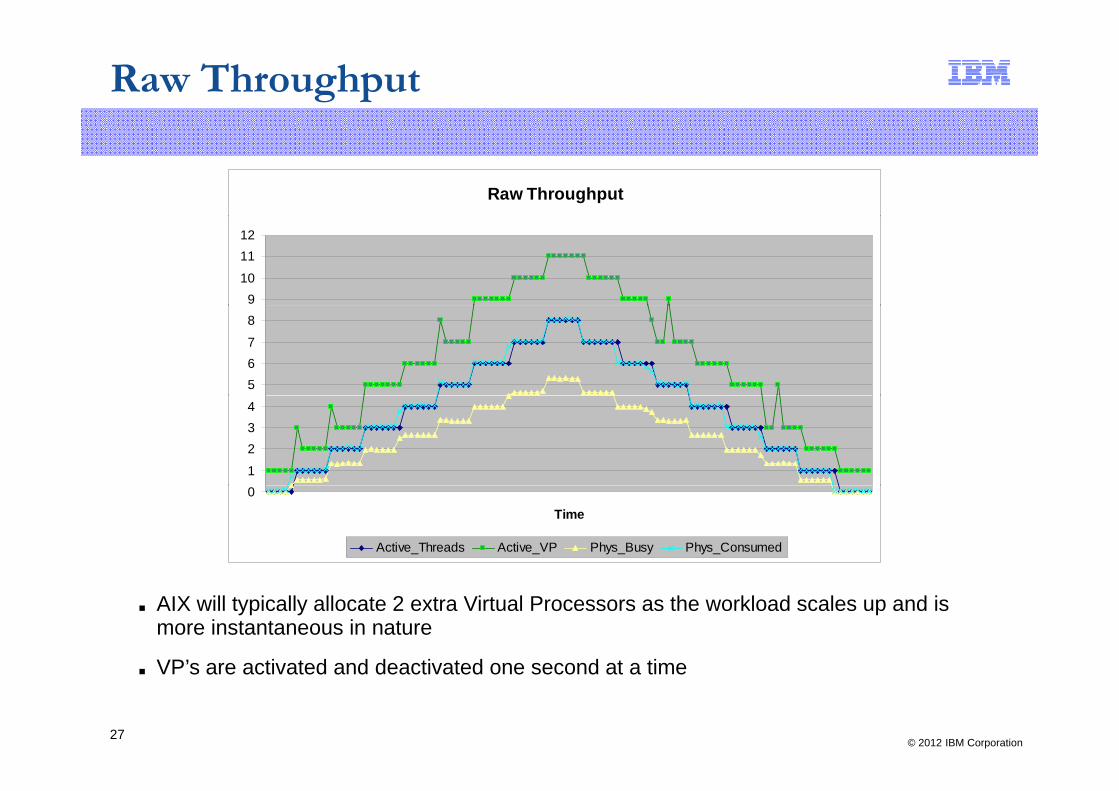
Raw Throughput
Raw Throughput
910
1112
567
8
1
234
0
Time
Active_Threads Active_VP Phys_Busy Phys_Consumed
■ AIX will typically allocate 2 extra Virtual Processors as the workload scales up and is more instantaneous in nature
VP’s are activated and deactivated one second at a time
© 2012 IBM Corporation27
■ VP s are activated and deactivated one second at a time
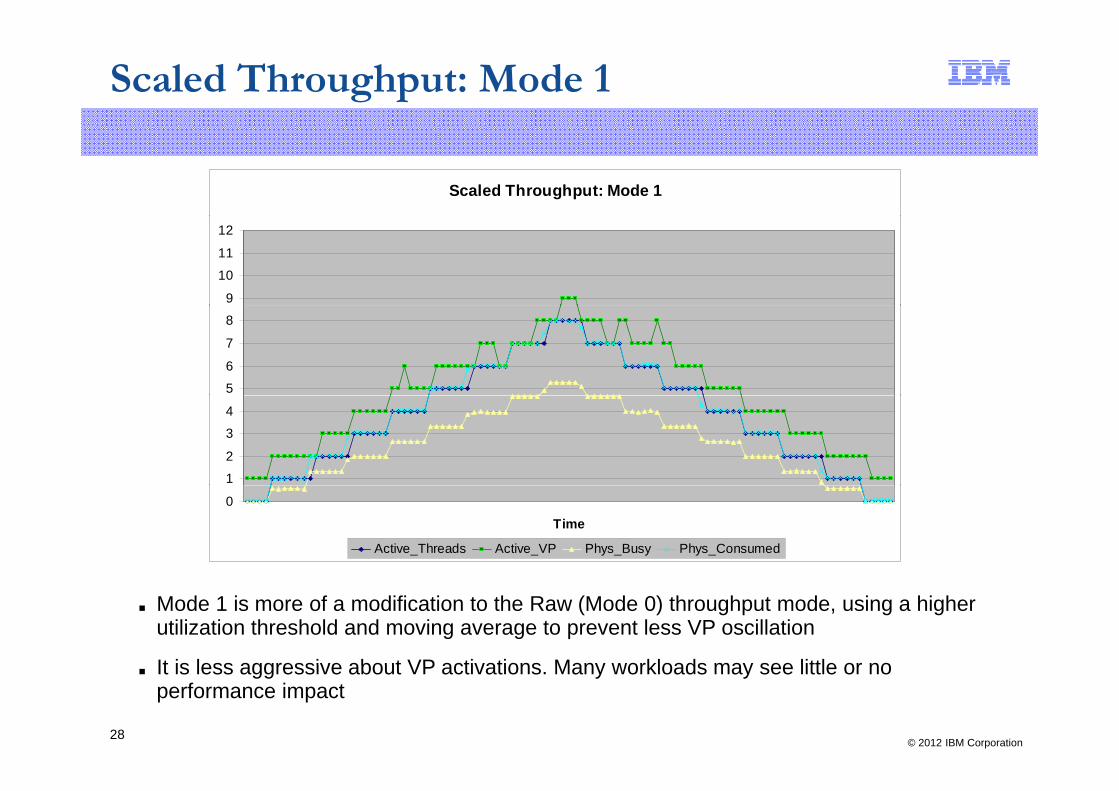
Scaled Throughput: Mode 1
Scaled Throughput: Mode 1
9
10
11
12
5
6
7
8
1
2
3
4
0
Time
Active_Threads Active_VP Phys_Busy Phys_Consumed
■ Mode 1 is more of a modification to the Raw (Mode 0) throughput mode, using a higher utilization threshold and moving average to prevent less VP oscillation
It is less aggressive about VP activations Many workloads may see little or no
© 2012 IBM Corporation28
■ It is less aggressive about VP activations. Many workloads may see little or no performance impact
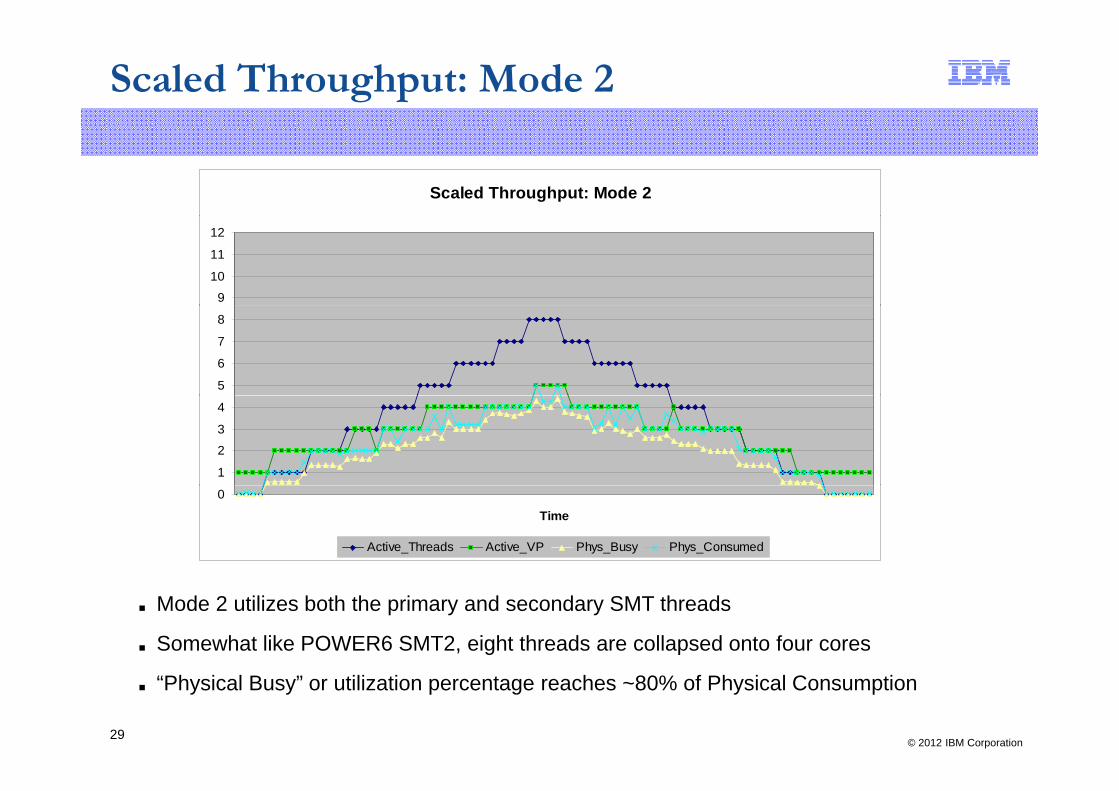
Scaled Throughput: Mode 2
Scaled Throughput: Mode 2
9
10
11
12
5
6
7
8
1
2
3
4
0
Time
Active_Threads Active_VP Phys_Busy Phys_Consumed
■ Mode 2 utilizes both the primary and secondary SMT threads
■ Somewhat like POWER6 SMT2, eight threads are collapsed onto four cores
© 2012 IBM Corporation29
■ “Physical Busy” or utilization percentage reaches ~80% of Physical Consumption
Scaled Throughput: Mode 4
Scaled Throughput: Mode 4
9101112
5678
1
23
4
0
Time
Active_Threads Active_VP Phys_Busy Phys_Consumed
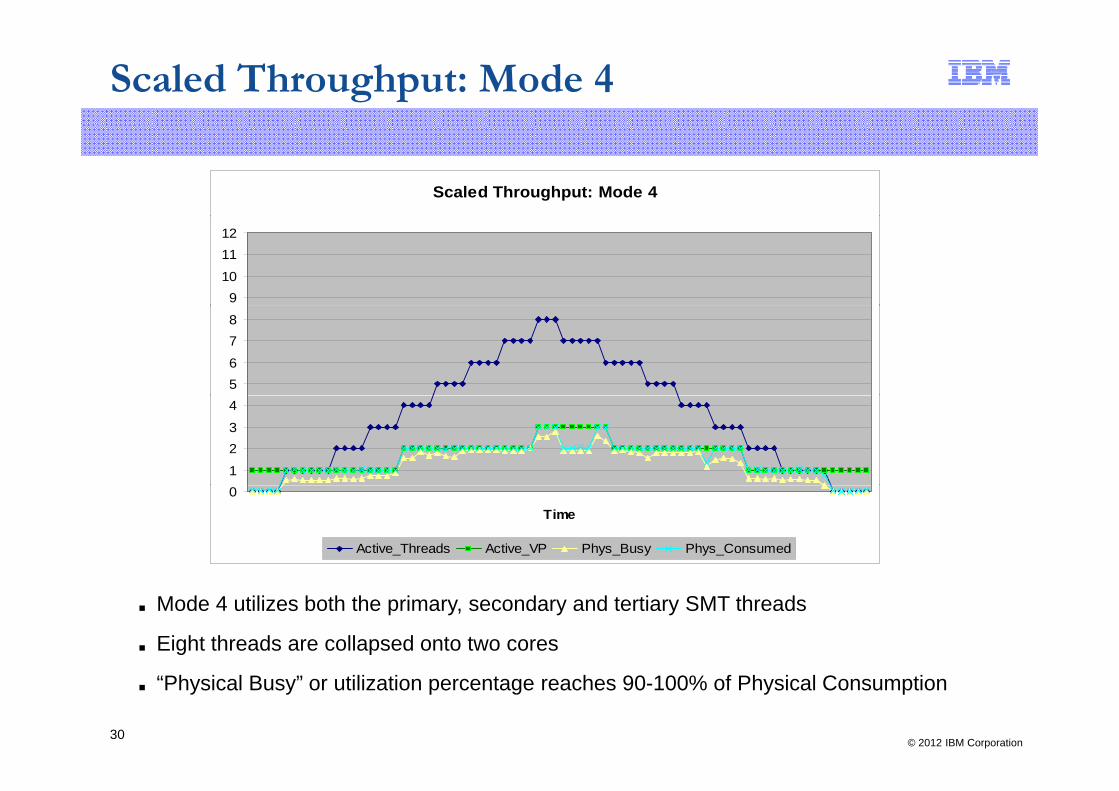
■ Mode 4 utilizes both the primary, secondary and tertiary SMT threads
■ Eight threads are collapsed onto two cores
© 2012 IBM Corporation30
■ “Physical Busy” or utilization percentage reaches 90-100% of Physical Consumption
Tuning (other)
■ Never adjust the legacy vpm_fold_threshold without L3 Support guidance
■ Remember that Virtual Processors activate and deactivate on 1 second boundaries. The legacy schedo tunable vpm_xvcpus allows enablement of more VPs than required by the workload. This is rarely needed, and is over-ridden when Scaled Mode is active.
If RSET bi d f ti d bi d kl d■ If you use RSET or bindprocessor function and bind a workload– To a secondary thread, that Virtual Processor will always stay in at least SMT2 mode– Likewise, if you bind to a tertiary thread, that Virtual Processor cannot leave SMT4
mode– These functions should only be used to bind to primary threads unless you know what
you are doing or are an application developer familiar with the RSET API– Use bindprocessor –s to list primary, secondary and tertiary threads
A recurring question is “How do I know how many Virtual Processors are active?”■ A recurring question is How do I know how many Virtual Processors are active?– There is no tool or metric that shows active Virtual Processor count– There are ways to guess this, and looking a physical consumption (if folding is
activated), physc count should roughly equal active VPs– nmon Analyser makes a somewhat accurate representation, but over long intervals y p , g
(with a default of 5 minutes), it does not provide much resolution– For an idea at a given instant, you can use: echo vpm | kdb
© 2012 IBM Corporation31
Virtual Processors
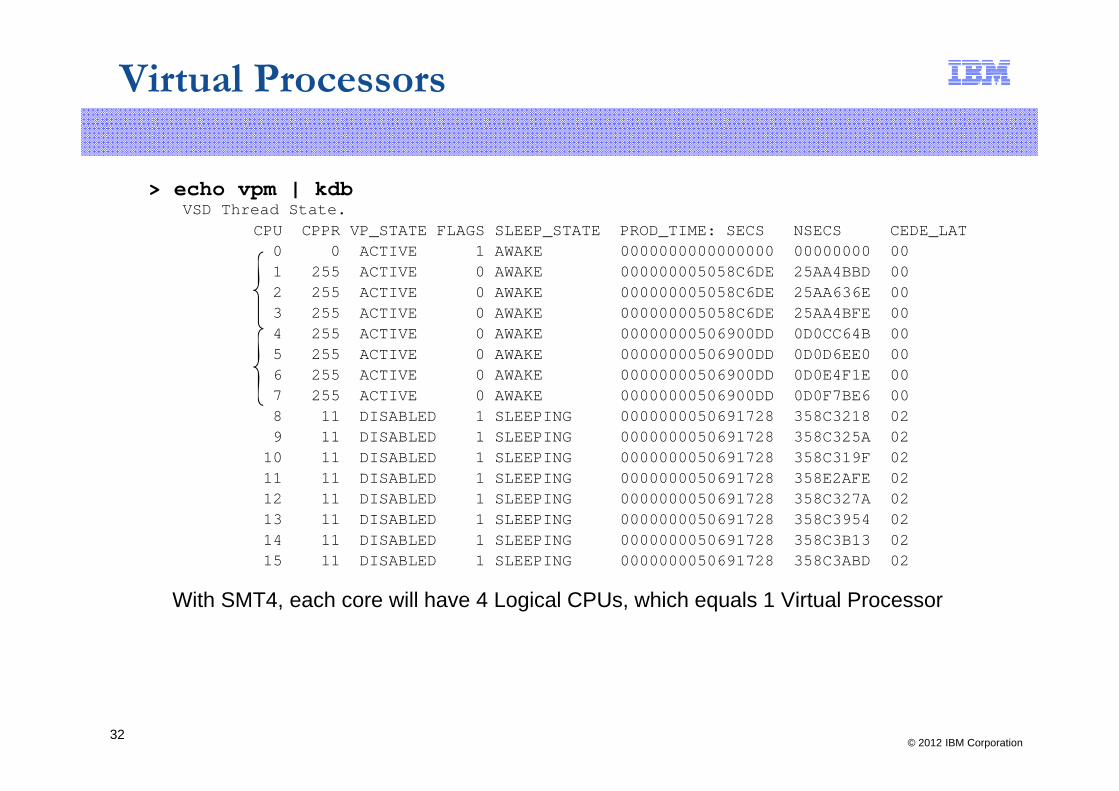
> echo vpm | kdbVSD Thread State.
– CPU CPPR VP_STATE FLAGS SLEEP_STATE PROD_TIME: SECS NSECS CEDE_LAT– 0 0 ACTIVE 1 AWAKE 0000000000000000 00000000 00– 1 255 ACTIVE 0 AWAKE 000000005058C6DE 25AA4BBD 00– 2 255 ACTIVE 0 AWAKE 000000005058C6DE 25AA636E 00– 3 255 ACTIVE 0 AWAKE 000000005058C6DE 25AA4BFE 00– 4 255 ACTIVE 0 AWAKE 00000000506900DD 0D0CC64B 00– 5 255 ACTIVE 0 AWAKE 00000000506900DD 0D0D6EE0 00– 6 255 ACTIVE 0 AWAKE 00000000506900DD 0D0E4F1E 00– 7 255 ACTIVE 0 AWAKE 00000000506900DD 0D0F7BE6 00– 7 255 ACTIVE 0 AWAKE 00000000506900DD 0D0F7BE6 00– 8 11 DISABLED 1 SLEEPING 0000000050691728 358C3218 02– 9 11 DISABLED 1 SLEEPING 0000000050691728 358C325A 02– 10 11 DISABLED 1 SLEEPING 0000000050691728 358C319F 02– 11 11 DISABLED 1 SLEEPING 0000000050691728 358E2AFE 02– 12 11 DISABLED 1 SLEEPING 0000000050691728 358C327A 02– 13 11 DISABLED 1 SLEEPING 0000000050691728 358C3954 02– 14 11 DISABLED 1 SLEEPING 0000000050691728 358C3B13 02– 15 11 DISABLED 1 SLEEPING 0000000050691728 358C3ABD 02
With SMT4, each core will have 4 Logical CPUs, which equals 1 Virtual Processor
© 2012 IBM Corporation32
Affinity ReviewAffinity Review
© 2012 IBM Corporation33
Affinity: Review
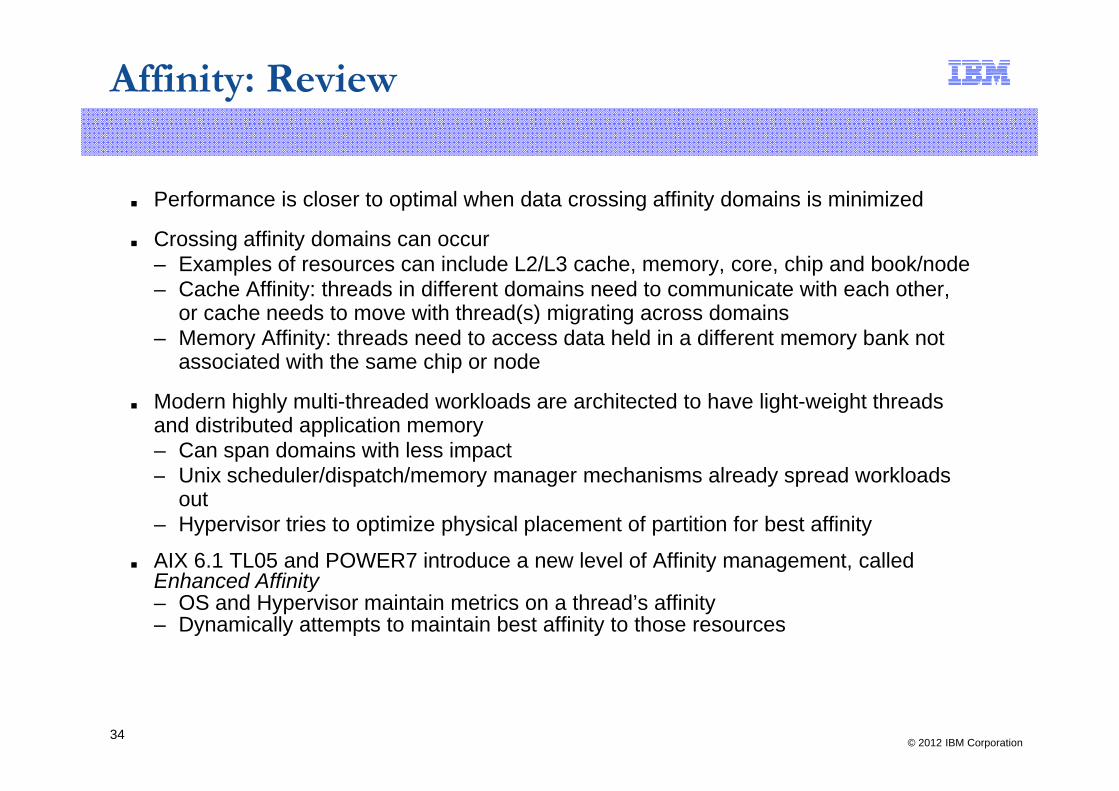
■ Performance is closer to optimal when data crossing affinity domains is minimized
■ Crossing affinity domains can occur– Examples of resources can include L2/L3 cache, memory, core, chip and book/node– Cache Affinity: threads in different domains need to communicate with each other,
h d t ith th d( ) i ti d ior cache needs to move with thread(s) migrating across domains– Memory Affinity: threads need to access data held in a different memory bank not
associated with the same chip or node
M d hi hl lti th d d kl d hit t d t h li ht i ht th d■ Modern highly multi-threaded workloads are architected to have light-weight threads and distributed application memory – Can span domains with less impact– Unix scheduler/dispatch/memory manager mechanisms already spread workloads p y g y p
out– Hypervisor tries to optimize physical placement of partition for best affinity
■ AIX 6.1 TL05 and POWER7 introduce a new level of Affinity management, called E h d Affi itEnhanced Affinity– OS and Hypervisor maintain metrics on a thread’s affinity– Dynamically attempts to maintain best affinity to those resources
© 2012 IBM Corporation34
AIX Enhanced Affinity
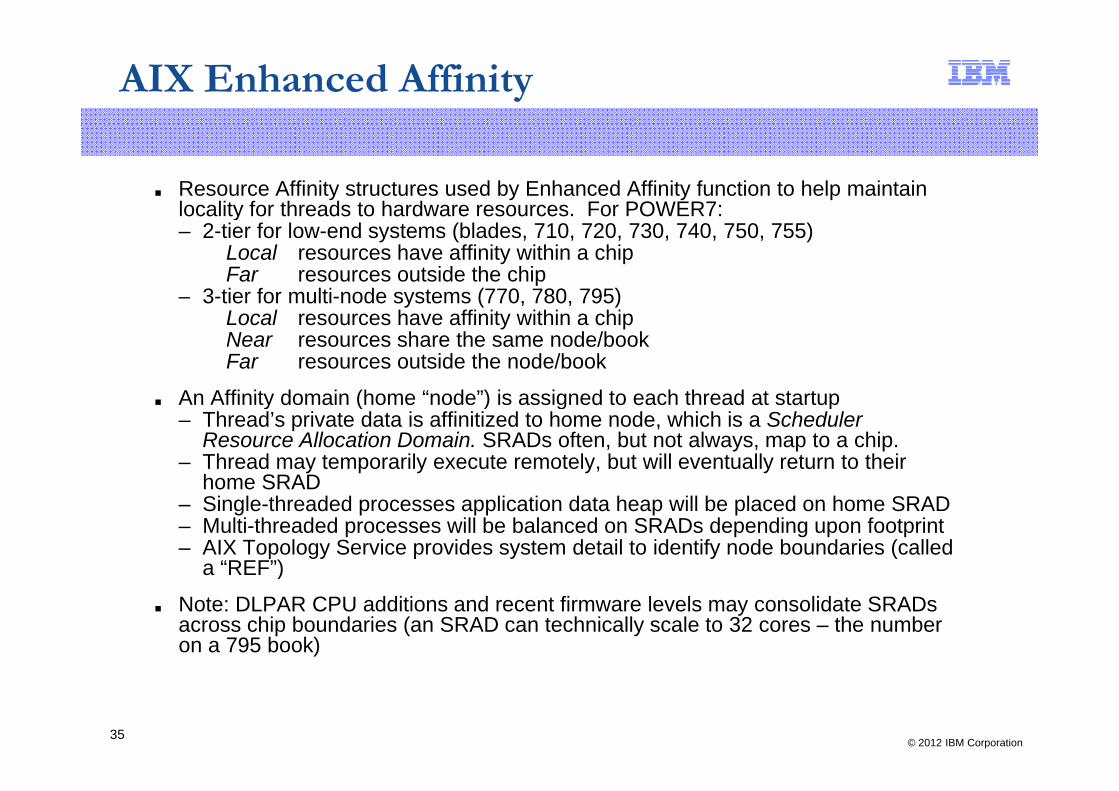
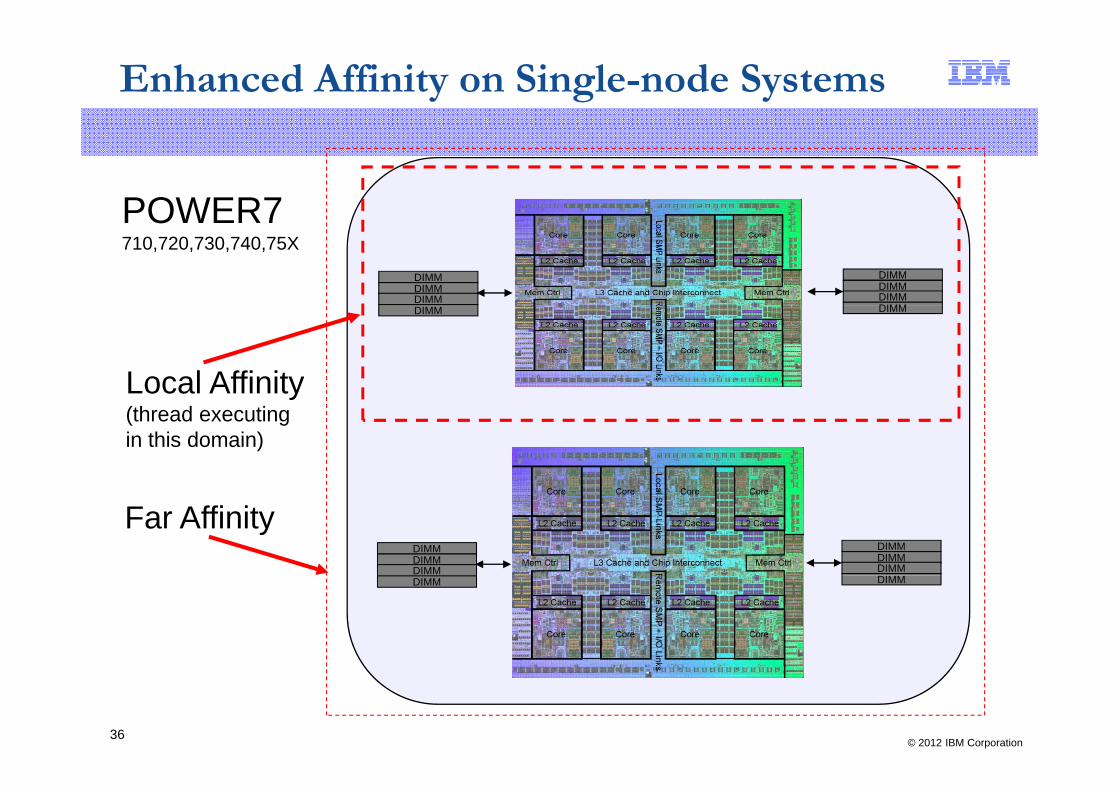
■ Resource Affinity structures used by Enhanced Affinity function to help maintain locality for threads to hardware resources. For POWER7:locality for threads to hardware resources. For POWER7: – 2-tier for low-end systems (blades, 710, 720, 730, 740, 750, 755)
Local resources have affinity within a chipFar resources outside the chip
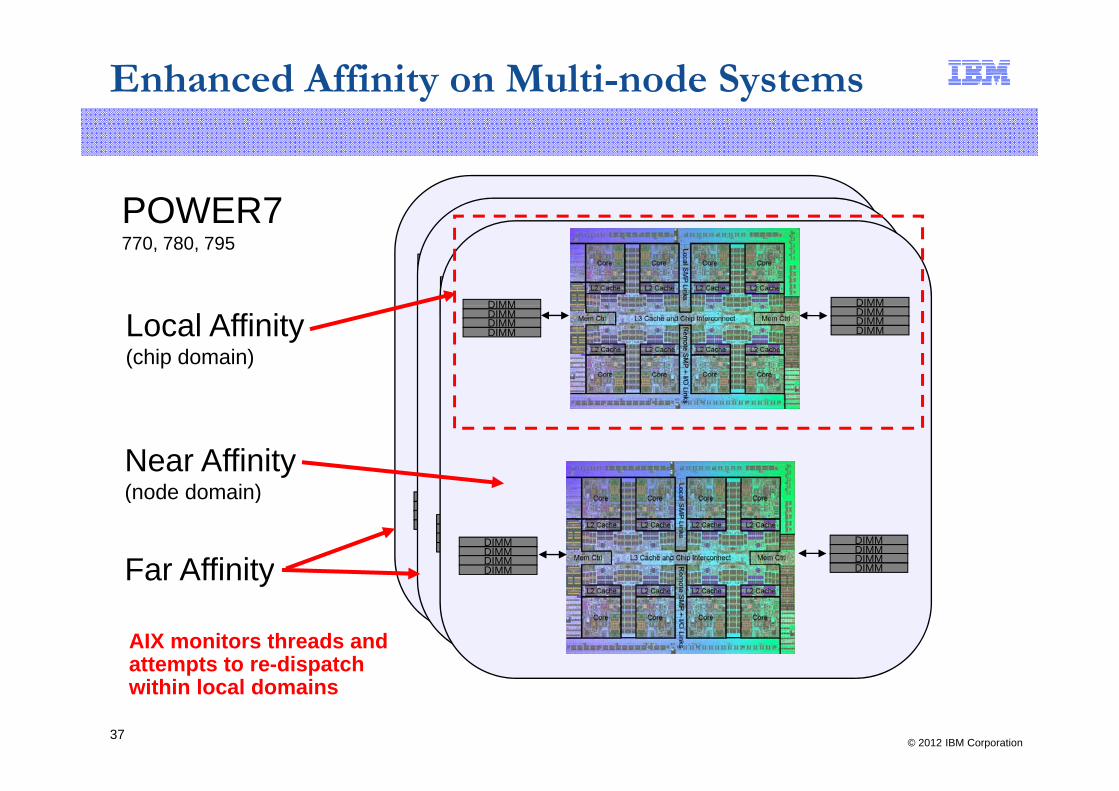
– 3-tier for multi-node systems (770, 780, 795)y ( , , )Local resources have affinity within a chipNear resources share the same node/bookFar resources outside the node/book
An Affinity domain (home “node”) is assigned to each thread at startup■ An Affinity domain (home node ) is assigned to each thread at startup– Thread’s private data is affinitized to home node, which is a Scheduler
Resource Allocation Domain. SRADs often, but not always, map to a chip.– Thread may temporarily execute remotely, but will eventually return to their
home SRADhome SRAD– Single-threaded processes application data heap will be placed on home SRAD– Multi-threaded processes will be balanced on SRADs depending upon footprint– AIX Topology Service provides system detail to identify node boundaries (called
a “REF”)a )
■ Note: DLPAR CPU additions and recent firmware levels may consolidate SRADs across chip boundaries (an SRAD can technically scale to 32 cores – the number on a 795 book)
© 2012 IBM Corporation35
Enhanced Affinity on Single-node Systems
POWER7DIMMDIMMDIMM
DIMMDIMMDIMMDIMM
POWER7710,720,730,740,75X
DIMM DIMM
Local Affinityy(thread executingin this domain)
Far AffinityDIMMDIMMDIMM
DIMMDIMMDIMM
DIMM DIMM
© 2012 IBM Corporation36
Enhanced Affinity on Multi-node Systems
POWER7POWER7770, 780, 795
DIMMDIMMDIMMDIMM
DIMMDIMMDIMMDIMMDIMM
DIMMDIMMDIMM
DIMMDIMMDIMMDIMMDIMM DIMM
Local Affinity(chip domain)
DIMM DIMMDIMMDIMMDIMMDIMM
DIMMDIMMDIMMDIMM
Near Affinity( d d i )(node domain) DIMM
DIMMDIMMDIMM
DIMMDIMMDIMMDIMMDIMM
DIMMDIMMDIMM
DIMMDIMMDIMMDIMMDIMM
DIMMDIMMDIMM
DIMMDIMMDIMMDIMMFar AffinityFar Affinity
AIX monitors threads and attempts to re-dispatch
© 2012 IBM Corporation37
attempts to re-dispatch within local domains
Enhanced Affinity
■ The important thing to understand is that affinity information was hard to come by in older AIX levels and architectures, but is now well instrumented in POWER7
– You can monitor the affinity with performance tools on dedicated or shared LPARs
– The biggest impact on performance relating to affinity will be significant far dispatches on 3-tier systems (threads dispatched across node boundaries)
■ A new tool, lssrad, displays hierarchy and topology information for memory and scheduler
– If you dynamically change CPU or memory configurations, use the lssrad output to determine the systems balanceFragmented CPU and memory will result in poorer performance common in– Fragmented CPU and memory will result in poorer performance – common in DLPAR tests/environments (performance degrades during tests)
– Partitions can have multiple resource domains– Partitions will only be able to see logical resource domains (mapped to “REF”
node boundaries, but you cannot assume these map to specific physical drawer , y p p p ynumbers). Nevertheless, affinity metrics can still be monitored to determine local, near and far dispatches
■ Performance tools topas, mpstat, svmon and curt have been modified to report affinity informationaffinity information
■ For more information, contact us for presentations or see Nigel’s AIXperf Blog on topic:
https://www.ibm.com/developerworks/mydeveloperworks/blogs/aixpert/?lang=en
© 2012 IBM Corporation38
https://www.ibm.com/developerworks/mydeveloperworks/blogs/aixpert/?lang en
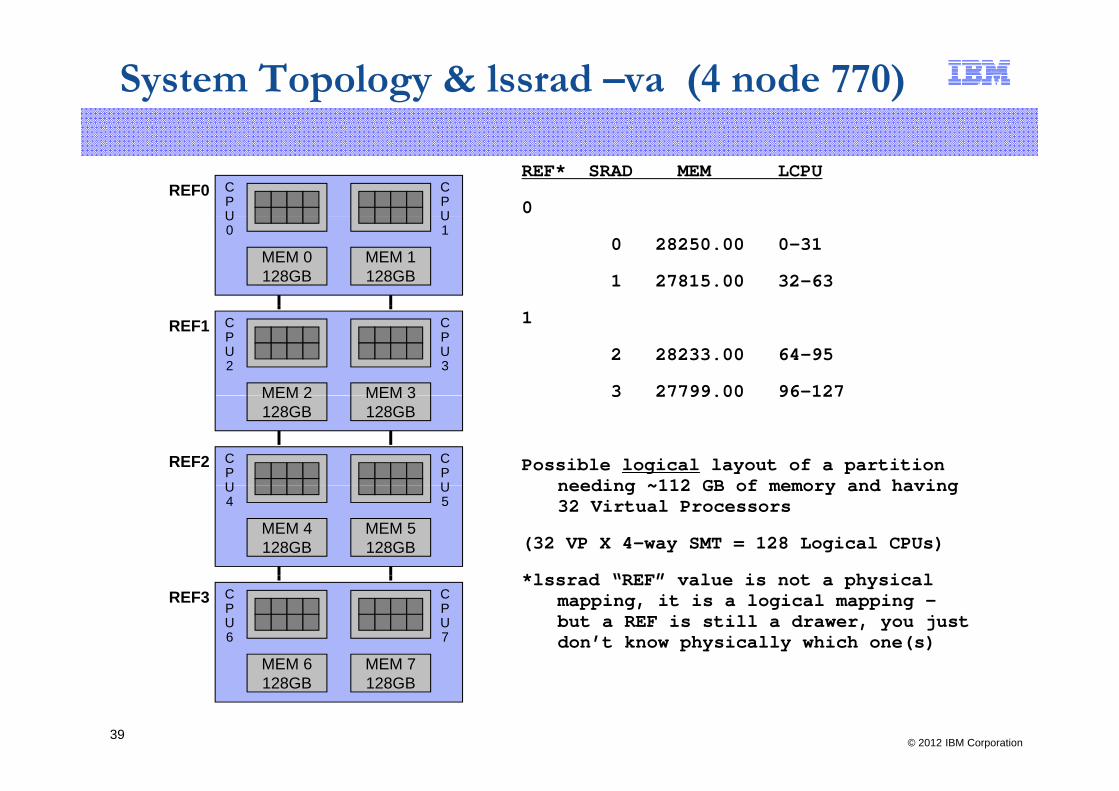
System Topology & lssrad –va (4 node 770)
REF* SRAD MEM LCPU
0REF0 C
PU
CPU
0 28250.00 0-31
1 27815.00 32-63MEM 0128GB
MEM 1128GB
U0
U1
1
2 28233.00 64-95
3 27799.00 96-127MEM 2
REF1
MEM 3
CPU2
CPU3
3 27799.00 96 127
Possible logical layout of a partition needing ~112 GB of memory and having
MEM 2128GB
MEM 3128GB
REF2 CPU
CPU needing ~112 GB of memory and having
32 Virtual Processors
(32 VP X 4-way SMT = 128 Logical CPUs)
*l d “REF” l i t h i l
MEM 4128GB
MEM 5128GB
U4
U5
*lssrad “REF” value is not a physical mapping, it is a logical mapping –but a REF is still a drawer, you just don’t know physically which one(s)
MEM 6
REF3
MEM 7
CPU6
CPU7
© 2012 IBM Corporation39
MEM 6128GB
MEM 7128GB
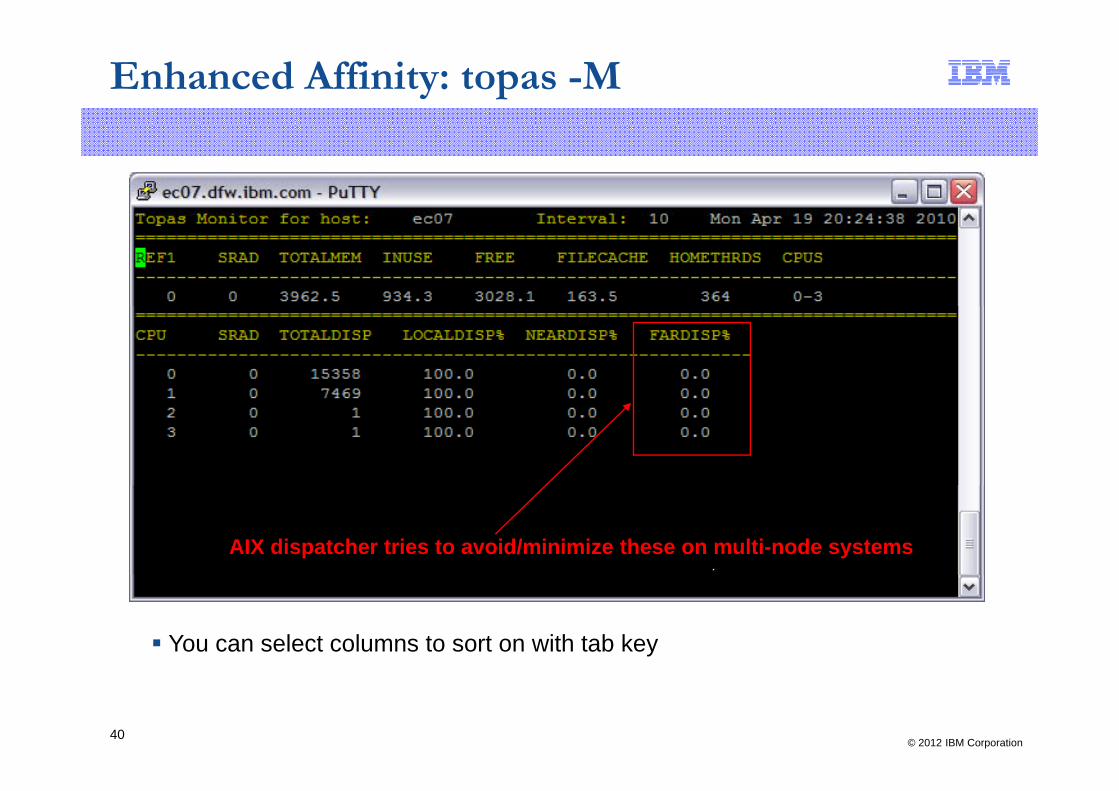
Enhanced Affinity: topas -M
AIX dispatcher tries to avoid/minimize these on multi-node systems
You can select columns to sort on with tab key
© 2012 IBM Corporation40
Dynamic System OptimizerDynamic System Optimizer
© 2012 IBM Corporation41
Active vs Dynamic System Optimizer
■ Dynamic System Optimizer (DSO) is a rebranding and enhancement to y y p ( ) gthe legacy Active System Optimizer (ASO)– ASO is a free AIX feature which autonomously tunes the allocation of
system resources to improve performanceDSO i l d dditi l h d f f t i bl t fil t– DSO includes additional charged-for features via an enablement fileset
– It is probably easier to adopt the DSO moniker with the understanding that there are two components, and the “ASO” daemon is the name of the process doing the actual workthe process doing the actual work
■ Legacy ASO provided function for optimizing cache and memory affinityM it kl d f hi h d tili ti– Monitors workloads for high cpu and memory utilization
– Associates targeted workloads to a specific core or set of cores– Determines if memory pages being accessed can be relocated for
higher affinity to cache & corehigher affinity to cache & core– Designed for POWER7 and originally shipped with AIX 7.1 TL01
© 2012 IBM Corporation42

What does Dynamic System Optimizer do?
■ If ASO provides best affinity for core/cache and memory, what does DSO p y yadd?– Dynamic migration to Large Pages (16MB MPSS)
• Conversion of memory pages to larger sizesO SG• Think Oracle SGA
– Data Stream Pre-fetch Optimizations. Dynamically modifies algorithms used for controlling how data is moved into processor cache from main memorymemory
■ All function has been back-ported to AIX 6.1 TL08 and enhanced for AIX 7 1 TL02 d POWER77.1 TL02 and POWER7+
© 2012 IBM Corporation43
All this affinity? Confused?
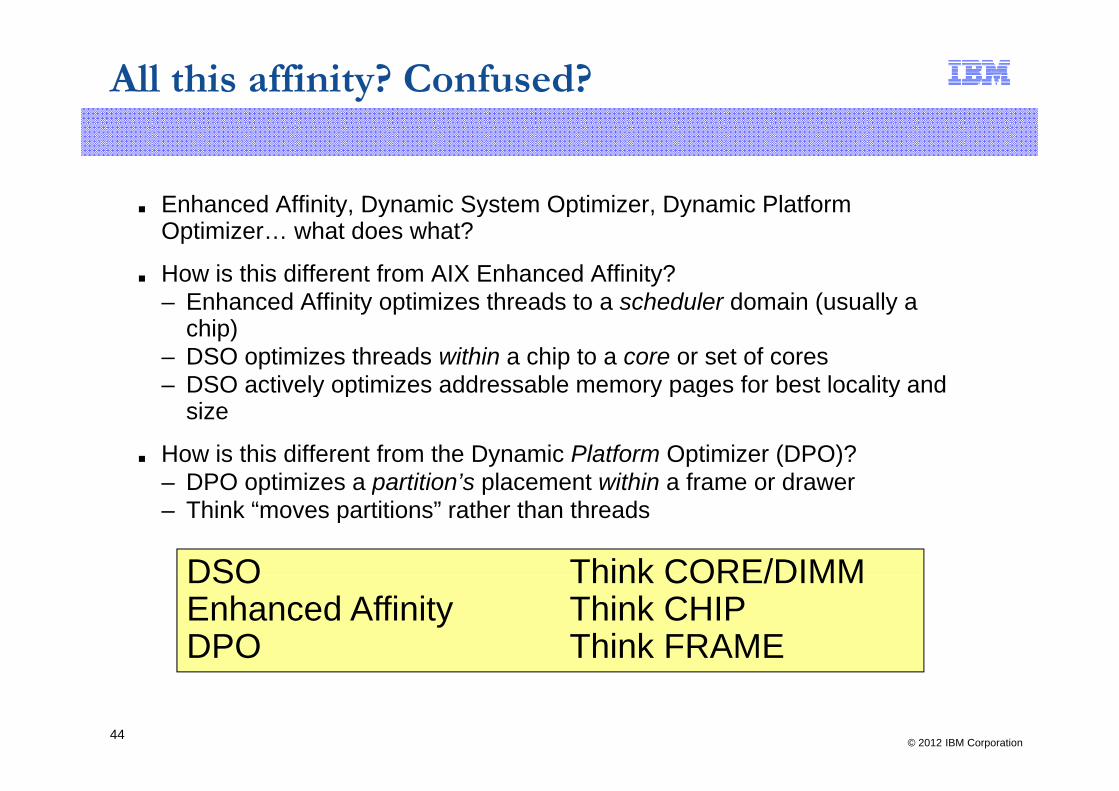
■ Enhanced Affinity, Dynamic System Optimizer, Dynamic Platform y y y p yOptimizer… what does what?
■ How is this different from AIX Enhanced Affinity?– Enhanced Affinity optimizes threads to a scheduler domain (usually aEnhanced Affinity optimizes threads to a scheduler domain (usually a
chip)– DSO optimizes threads within a chip to a core or set of cores– DSO actively optimizes addressable memory pages for best locality and y p y p g y
size
■ How is this different from the Dynamic Platform Optimizer (DPO)? – DPO optimizes a partition’s placement within a frame or drawerDPO optimizes a partition s placement within a frame or drawer– Think “moves partitions” rather than threads
DSO Think CORE/DIMMDSO Think CORE/DIMMEnhanced Affinity Think CHIPDPO Think FRAME
© 2012 IBM Corporation44
DSO Architecture
Monitoring Optimizations
ASO/DSO Analysis
Workload
AIX 6 1 TL08 / AIX 7 1
Resource Allocations
Monitoring p Workload
Kernel Statistics
AIX 6.1 TL08 / AIX 7.1
Performance Monitoring Unit
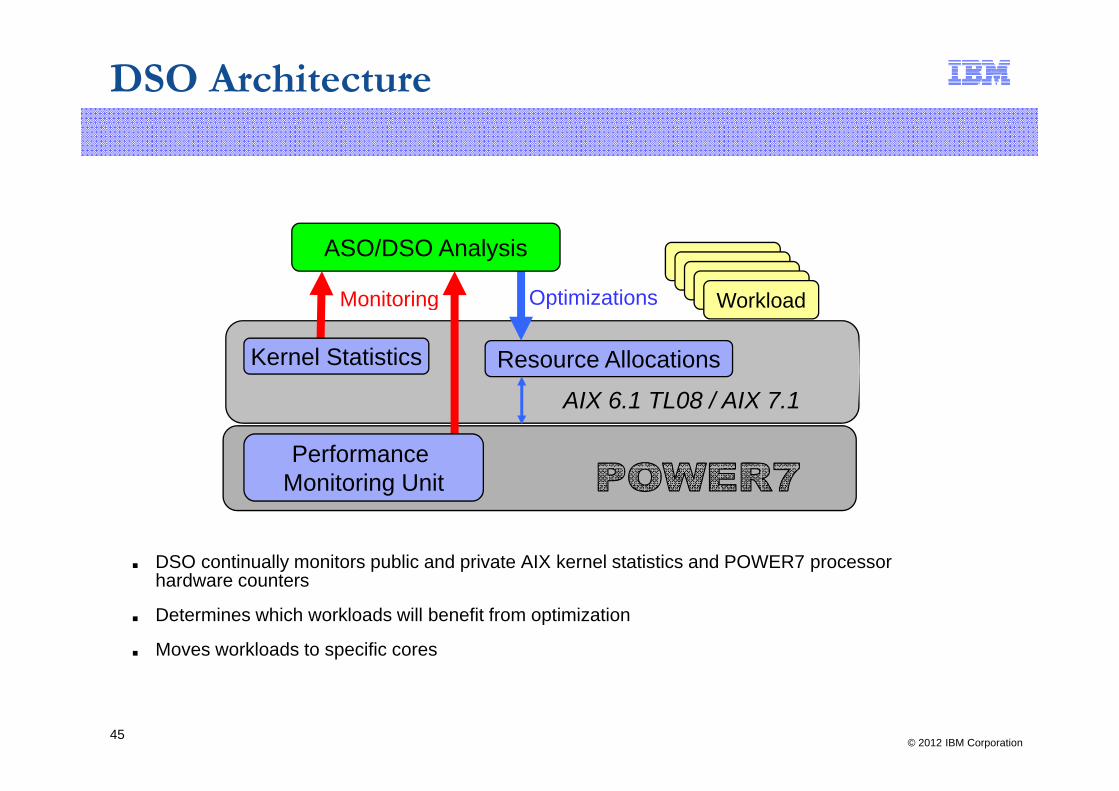
■ DSO continually monitors public and private AIX kernel statistics and POWER7 processor h d t
Monitoring Unit
hardware counters
■ Determines which workloads will benefit from optimization
■ Moves workloads to specific cores
© 2012 IBM Corporation45
What are Hardware Counters?
■ POWER processors have always included hardware instrumentation in the form of the Performance Monitor Unit (PMU)form of the Performance Monitor Unit (PMU)
■ This hardware facility collects events related to the operations in the processor
■ See Jeff Stuecheli’s POWER7 Micro-architecture A PMU Event Guided■ See Jeff Stuecheli s POWER7 Micro-architecture, A PMU Event Guided Tour, in section PE112
■ Performance Monitor Counter data analysis using Counter Analyzer, Qi Liang, 2009ghttp://www.ibm.com/developerworks/aix/library/au-counteranalyzer/index.html
© 2012 IBM Corporation46
What is DSO to AIX?
■ ASO/DSO is a Unix System Resource Controller (SRC) service– Transparent optimization does not require active administrator intervention– Acts like any other kernel service– Low overhead, high gain
Configurable via smitty src or CLI– Configurable via smitty src or CLI
■ Active tuning hibernates if no gains achieved and wakes up when instrumentation indicates possible performance improvements
■ Focuses on long-term run-time analysis of processor and memory allocations based on affinity metrics
Utilizes some aspects of AIX 6 1 Enhanced Affinity but focus is a set of■ Utilizes some aspects of AIX 6.1 Enhanced Affinity, but focus is a set of cores within a chipset
© 2012 IBM Corporation47
ASO/DSO General
■ ASO is designed to improve the performance of workloads that are long-lived, multi-threaded and have stable, non-trivial core/cache utilizationthreaded and have stable, non trivial core/cache utilization
■ The greater the communication between threads, the higher the potential for ASO to improve performance.
Greatest benefit when running in dedicated processor LPAR environments on large■ Greatest benefit when running in dedicated processor LPAR environments, on large multi-chip or multi-node configurations
■ ASO can be enabled at the system or process level monitoring is done before and after placementsp
■ Operates on a process-wide scope, does not tune individual threads within a process
■ No optimization of single-threaded processes which will remain managed by existing AIX scheduler mechanismsAIX scheduler mechanisms
■ Improvements are limited to what can be achieved via manual tuning
■ No optimization of workloads that are already members of Resource Set (RSET) attachments or controlled by bindprocessor()attachments or controlled by bindprocessor()
■ If most of the heavy workloads fall under manual tuning, ASO will hibernate
© 2012 IBM Corporation48
ASO/DSO Requirements
■ POWER7/POWER7+ dedicated or virtualized partitions
■ ASO AIX 7.1 TL01– Cache and memory affinity
■ DSO AIX 6/1 TL08 and AIX 7.1 TL02SO f– Legacy ASO function
– 16 MB MPSS– Pre-fetch support
Not supported in Active Memory Sharing environments■ Not supported in Active Memory Sharing environments
■ Capped shared processor environments must have a minimum entitlement of 2 cores
■ Consumption for unfolded Virtual Processors must be sufficiently high to allow ti i tioptimizations
■ Dedicated partitions cannot have Virtual Processor Folding enabled – this occurs when Energy Management features are active in dedicated environments
■ No reboot is required after applying DSO fileset, ASO will recognize it automatically
■ Filesetsbos.aso 7.1.2.0 Active System Optimizerd 1 1 0 0 D i S t O ti i ASO t i
© 2012 IBM Corporation49
dso.aso 1.1.0.0 Dynamic System Optimizer ASO extension
ASO Cache Affinity
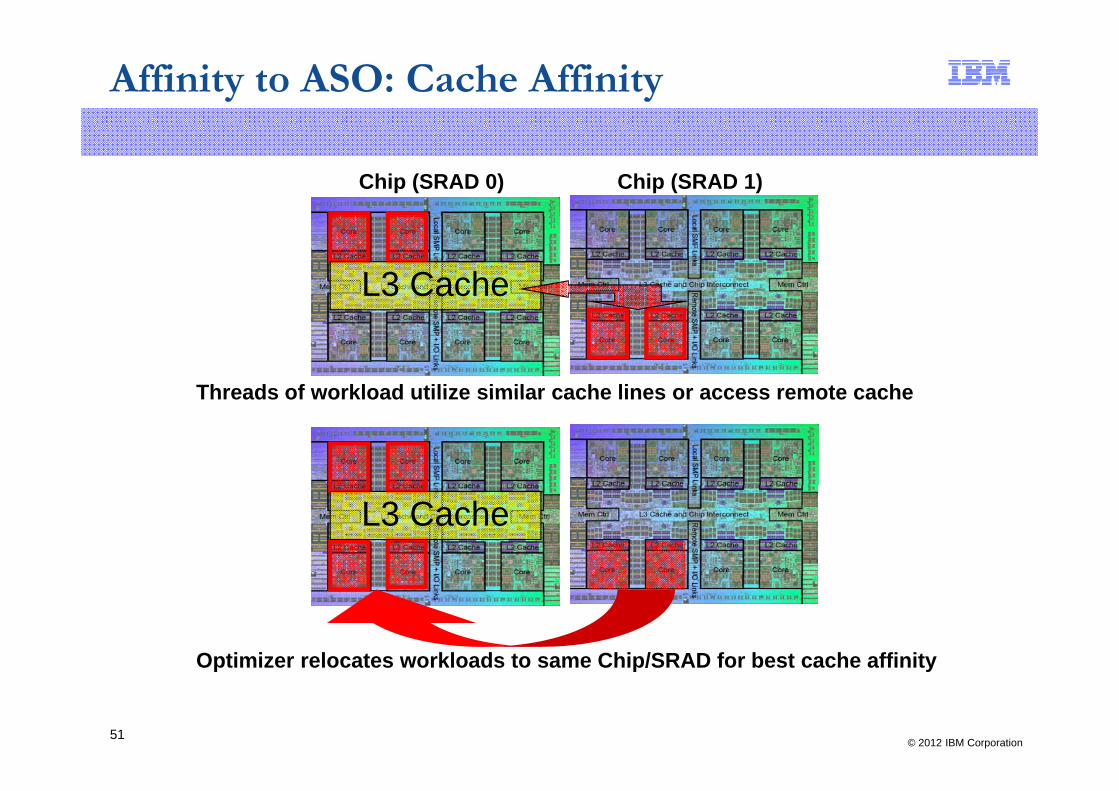
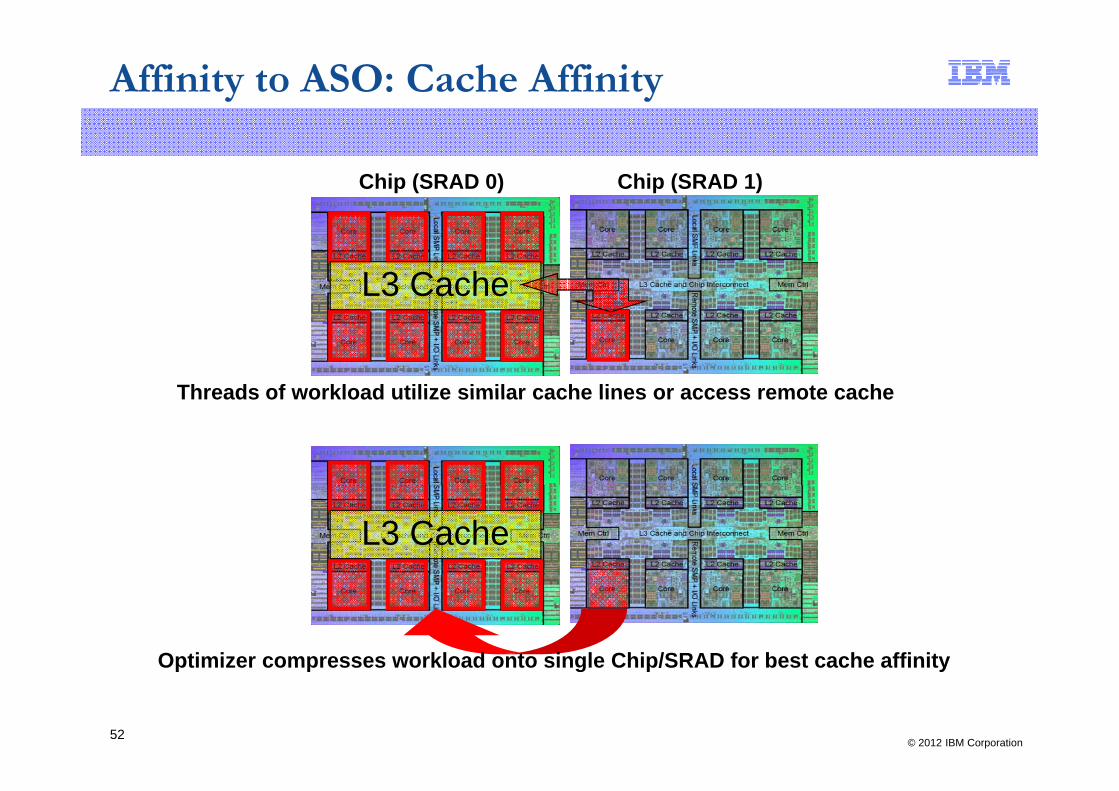
■ Cache Affinity■ Cache Affinity– The initial task of ASO is to optimize the placement of workloads so
threads of a process are grouped into the smallest affinity domain that provides the necessary CPU and memory resources• Locality by grouping cores located in chips• Consolidating workloads by cache activity
– ASO can be of benefit on single chip systemsTh d th t h h i t ti ith th ki i il• Threads that have heavy interaction with the same core, making similar requests to L2 and L3 cache
• Optimize for lock contention – software threads contending for a lock can be minimized to the subset of hardware (SMT) threads executing oncan be minimized to the subset of hardware (SMT) threads executing on the same core for best sharing
– Workload• Multi-threaded workloads with 5+ minute periods of stabilityp y• Minimum 0.1 core utilization
© 2012 IBM Corporation50
Affinity to ASO: Cache Affinity
Chip (SRAD 0) Chip (SRAD 1)
L3 Cache
Threads of workload utilize similar cache lines or access remote cacheThreads of workload utilize similar cache lines or access remote cache
L3 Cache
Optimizer relocates workloads to same Chip/SRAD for best cache affinity
© 2012 IBM Corporation51
Optimizer relocates workloads to same Chip/SRAD for best cache affinity
Affinity to ASO: Cache Affinity
Chip (SRAD 0) Chip (SRAD 1)
L3 Cache
Threads of workload utilize similar cache lines or access remote cacheThreads of workload utilize similar cache lines or access remote cache
L3 Cache
Optimizer compresses workload onto single Chip/SRAD for best cache affinity
© 2012 IBM Corporation52
Optimizer compresses workload onto single Chip/SRAD for best cache affinity

ASO Memory Affinity
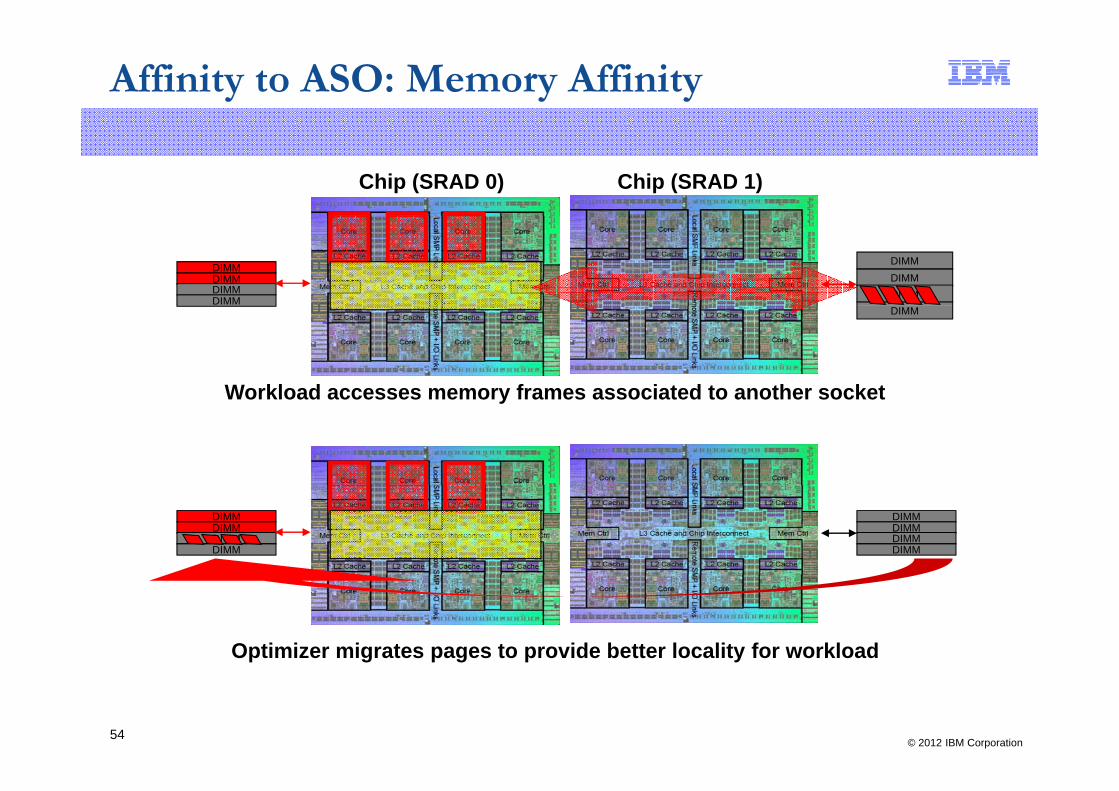
■ Memory Affinityy y– The second task for ASO is to optimize memory allocation such that
frequently accessed pages of memory are localized as possible to where the workload is running
– Given that a workload needs a “local” affinity domain, memory affinity can only be applied once a workload has been optimized for cache affinity
– Memory page migrations are continually monitoredWorkload– Workload• Minimum 0.1 core utilization• Multi-threaded workloads with 5+ minute periods of stability• Single-threaded workloads are not considered since their process• Single-threaded workloads are not considered since their process
private data is affinitized by the kernel• Workloads currently must fit within a single Scheduler Resource
Affinity Domain (SRAD). An SRAD typically caps to a single y ( ) yp y p gchip/socket in POWER7, but DLPAR operations can impact that.
© 2012 IBM Corporation53
Affinity to ASO: Memory Affinity
Chip (SRAD 0) Chip (SRAD 1)
DIMMDIMMDIMMDIMM
DIMMDIMMDIMM
Workload accesses memory frames associated to another socket
DIMM
Workload accesses memory frames associated to another socket
DIMMDIMMDIMMDIMM
DIMMDIMMDIMMDIMM
Optimizer migrates pages to provide better locality for workload
© 2012 IBM Corporation54
16MB MPSS
■ Multiple Page Segment Size (MPSS)– AIX has supported 4K and 64K page sizes within the same 256 MB segment– POWER6 with AIX 6.1 and above allow autonomic conversion between 4K and 64K
pages based on workload needs– 16 MB page sizes have been supported via manual tuning and effectively had to be16 MB page sizes have been supported via manual tuning and effectively had to be
managed as pinned pages (allocated and managed up front)– AIX 6.1 TL8 and AIX 7.1 TL2 introduces the capability to mix 16 MB pages with
other sizes within a memory segment. This allows autonomic conversions to 16 MB pagespages.
■ Processors use Translation Lookaside Buffers (TLB) and Effective to Real Address Translation (ERAT) when addressing real memory
Processor architectures can only have so many TLB’s That number and the page– Processor architectures can only have so many TLB s. That number and the page size defines how much of main memory can be directly mapped.
– Larger page sizes allow more of memory to be directly mapped, and for fewer address lookups to have to be performed. This can minimize TLB/ERAT misses.P i i ll hi i i b i d d f h il d– Processor instrumentation allows this activity to be monitored, and for heavily used memory regions to be targeted for promotion to 16 MB pages
© 2012 IBM Corporation55
DSO: 16 MB Activity
■ WorkloadsTh id l kl d i hi h l S t V i E l– The ideal workload is one which uses large System V memory regions. Examples would include databases using large shared memory regions (Oracle SGA), or Java JVMs instances with large heap(s)
– Workloads could be either multi-threaded or a group of single threaded processesMinimum 2 cores stable CPU utilization over 10 minutes– Minimum 2 cores stable CPU utilization over 10 minutes
– Minimum 16 GB of system memory– Historically, Oracle specialists have been wary to use 16 MB pages because they
had to be pre-allocated and it is not always clear what the DB’s internal memory patterns are MPSS support makes this more flexible for DSO to monitor and adjustpatterns are. MPSS support makes this more flexible for DSO to monitor and adjust.
■ Behavior– DSO will monitor a workload for at least 10 minutes before beginning any migration– Migrations of small (4K) to medium (64K) memory frames to 16 MB is not a rapidMigrations of small (4K) to medium (64K) memory frames to 16 MB is not a rapid
process. Lab tests with migrating double-digit SGA’s are measured in hours. SGA’s on the order of 64 GB or larger could take half a day.
– You should not try to assess performance improvements until migration is complete, there is no quick way to do apples-to-apples comparisonsq y pp pp p
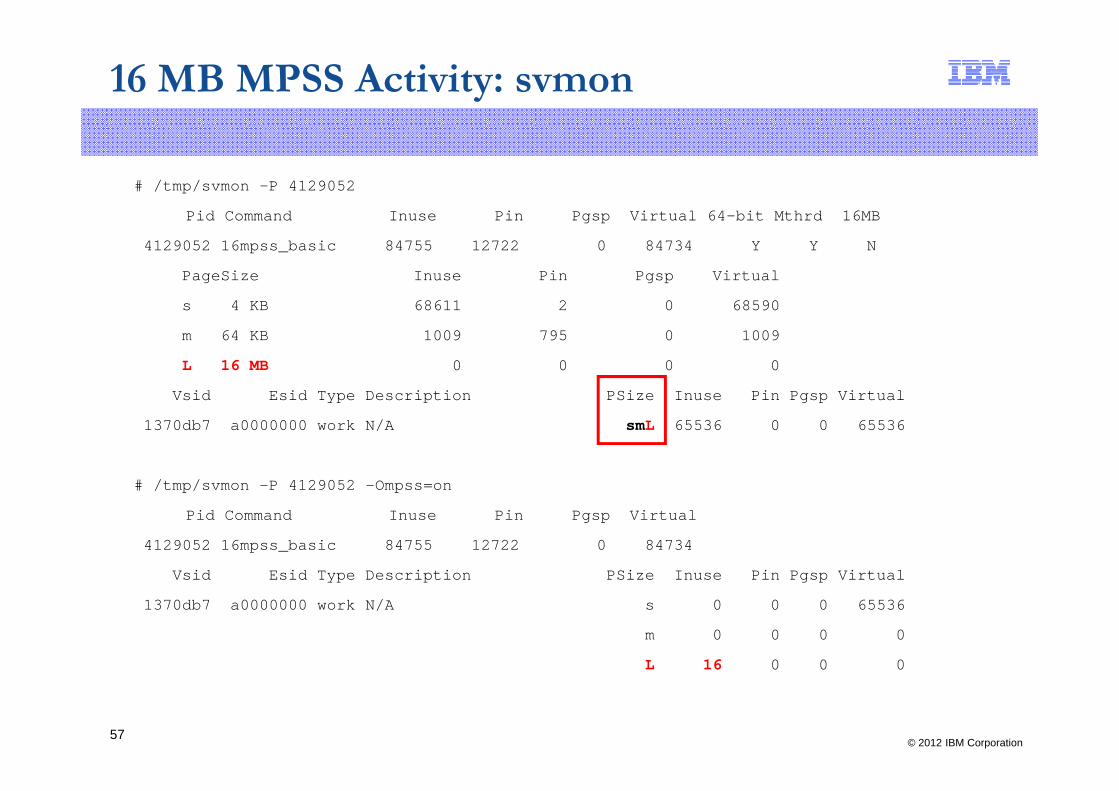
– Customers using the ESP would not have seen 16 MB activity using the svmon tool because the updates for that support were completed after the beta
© 2012 IBM Corporation56
16 MB MPSS Activity: svmon
# /tmp/svmon -P 4129052
Pid Command Inuse Pin Pgsp Virtual 64-bit Mthrd 16MBPid Command Inuse Pin Pgsp Virtual 64-bit Mthrd 16MB
4129052 16mpss_basic 84755 12722 0 84734 Y Y N
PageSize Inuse Pin Pgsp Virtual
s 4 KB 68611 2 0 68590s 4 KB 68611 2 0 68590
m 64 KB 1009 795 0 1009
L 16 MB 0 0 0 0
Vsid Esid Type Description PSize Inuse Pin Pgsp VirtualVsid Esid Type Description PSize Inuse Pin Pgsp Virtual
1370db7 a0000000 work N/A smL 65536 0 0 65536
# /tmp/svmon -P 4129052 -Ompss=on# /tmp/svmon -P 4129052 -Ompss=on
Pid Command Inuse Pin Pgsp Virtual
4129052 16mpss_basic 84755 12722 0 84734
Vsid Esid Type Description PSize Inuse Pin Pgsp VirtualVsid Esid Type Description PSize Inuse Pin Pgsp Virtual
1370db7 a0000000 work N/A s 0 0 0 65536
m 0 0 0 0
L 16 0 0 0
© 2012 IBM Corporation57
L 16 0 0 0

POWER7 Pre-fetch: Review
■ POWER7 architecture provides a dedicated register to control memory pre-fetching– Register is the Data Stream Control Register (DSCR)g g ( )– Allows control over enablement, depth and stride of pre-fetching
■ POWER pre-fetch instructions can be used to mask latencies of requests to the memory controller and fill cache.
The POWER7 chip can recognize memory access patterns and initiate pre fetch– The POWER7 chip can recognize memory access patterns and initiate pre-fetch instructions automatically
– Control over how aggressive the hardware will pre-fetch, i.e. how many cache lines will be pre-fetched for a given reference, is controlled by the DSCR
■ The dscrctl command can be used to query and set the system wide DSCR value # dscrctl -q
■ A system administrator can change the system wide value using the dscrctl commandcommand # dscrctl [-n | -b] –s <value>
Disengage the data prefetch feature : dscrctl -n -s 1
Returning to default: d tl 0Returning to default: dscrctl –n –s 0
■ This is a dynamic system-wide setting and easy to change/check
■ May yield 5-10% performance improvement with some applications
© 2012 IBM Corporation58
DSO Pre-fetch
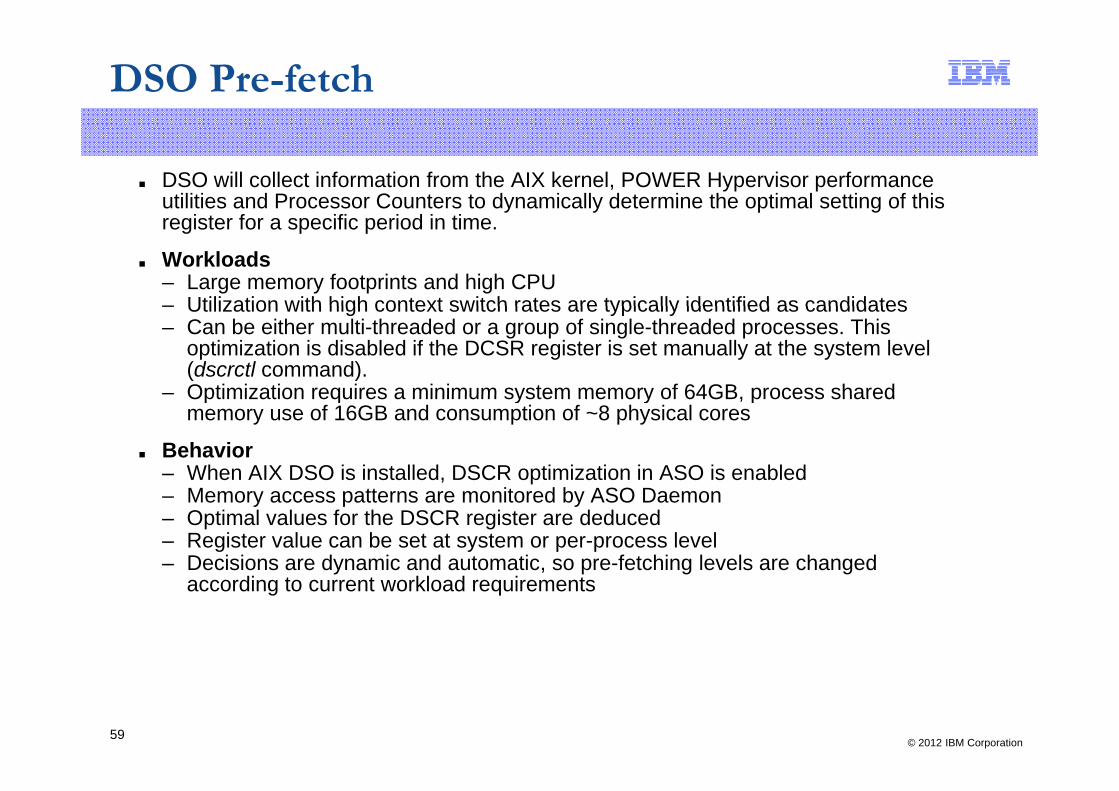
■ DSO will collect information from the AIX kernel, POWER Hypervisor performance utilities and Processor Counters to dynamically determine the optimal setting of this
i t f ifi i d i tiregister for a specific period in time.
■ Workloads– Large memory footprints and high CPU– Utilization with high context switch rates are typically identified as candidates– Utilization with high context switch rates are typically identified as candidates– Can be either multi-threaded or a group of single-threaded processes. This
optimization is disabled if the DCSR register is set manually at the system level (dscrctl command).
– Optimization requires a minimum system memory of 64GB process sharedOptimization requires a minimum system memory of 64GB, process shared memory use of 16GB and consumption of ~8 physical cores
■ Behavior– When AIX DSO is installed, DSCR optimization in ASO is enabled– Memory access patterns are monitored by ASO Daemon– Optimal values for the DSCR register are deduced– Register value can be set at system or per-process level– Decisions are dynamic and automatic, so pre-fetching levels are changed
according to current workload requirements
© 2012 IBM Corporation59
ASO/DSO Usage
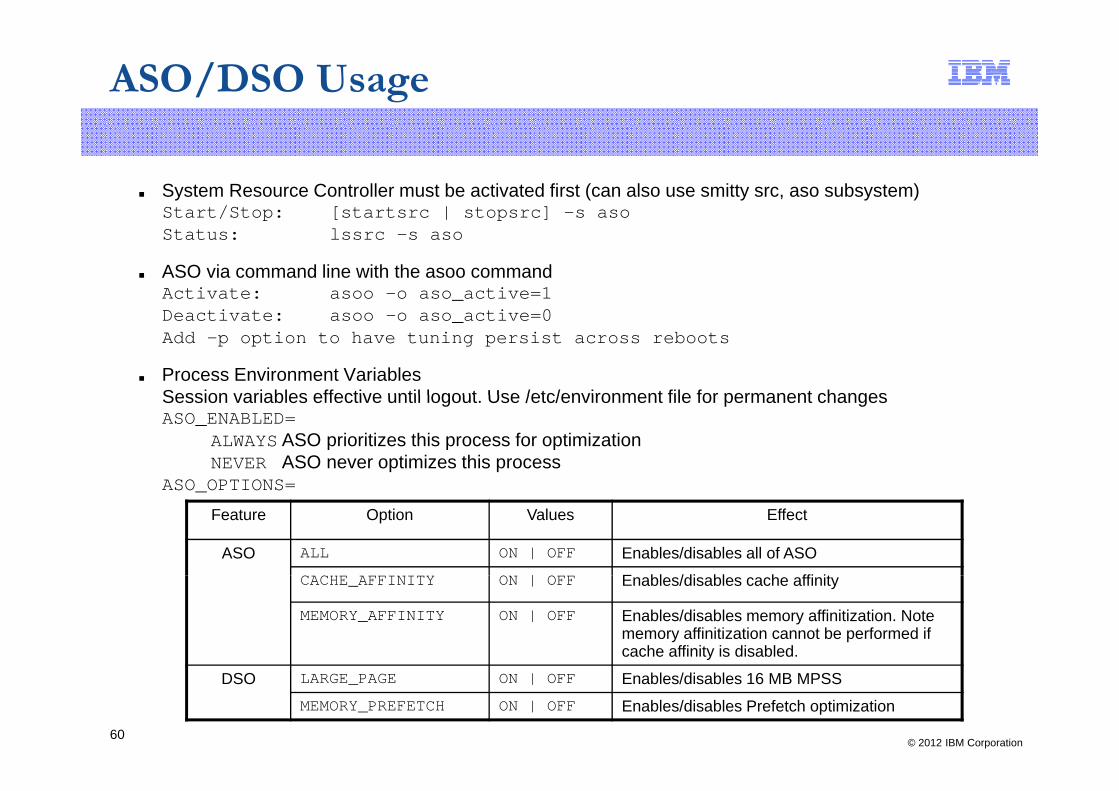
■ System Resource Controller must be activated first (can also use smitty src, aso subsystem)Start/Stop: [startsrc | stopsrc] –s asoStart/Stop: [startsrc | stopsrc] s asoStatus: lssrc –s aso
■ ASO via command line with the asoo commandActivate: asoo –o aso_active=1Deactivate: asoo –o aso_active=0Add –p option to have tuning persist across reboots
■ Process Environment VariablesSession variables effective until logout Use /etc/environment file for permanent changesSession variables effective until logout. Use /etc/environment file for permanent changes ASO_ENABLED=
ALWAYS ASO prioritizes this process for optimizationNEVER ASO never optimizes this process
ASO OPTIONS=ASO_OPTIONS=
Feature Option Values Effect
ASO ALL ON | OFF Enables/disables all of ASO| E bl /di bl h ffi itCACHE_AFFINITY ON | OFF Enables/disables cache affinity
MEMORY_AFFINITY ON | OFF Enables/disables memory affinitization. Note memory affinitization cannot be performed if cache affinity is disabled.
© 2012 IBM Corporation60
DSO LARGE_PAGE ON | OFF Enables/disables 16 MB MPSSMEMORY_PREFETCH ON | OFF Enables/disables Prefetch optimization
ASO Debug ?
■ If you open a PMR on ASO, collection scripts do not include the ASO log files. You should collect any output from the /var/log/aso/ directory and includeshould collect any output from the /var/log/aso/ directory and include.
■ Debug options are available from the system resource controller level– Start SRC startsrc –s aso– Activate ASO asoo –o aso active=1– Activate ASO asoo –o aso_active=1– Enable debug asoo –o debug_level=3 (3=highest, dynamic)– Execute workload– Disable debug asoo –o debug_level=0– Forward aso_debug.out file to IBM Support
© 2012 IBM Corporation61
Logging
■ Log files maintained by ASO– /var/log/aso/aso.log will tell you if ASO is operational– /var/log/aso/aso_process.log shows optimizations performed on processes– Activities on processes and PIDs are logged
■ Documentation for interpreting log files is not currently provided by IBM– But they are ascii-readable output files like most SRC daemons– Some behavior and tolerances used by ASO can be divined by watching the output
© 2012 IBM Corporation62
aso_process.log: Cache Affinity
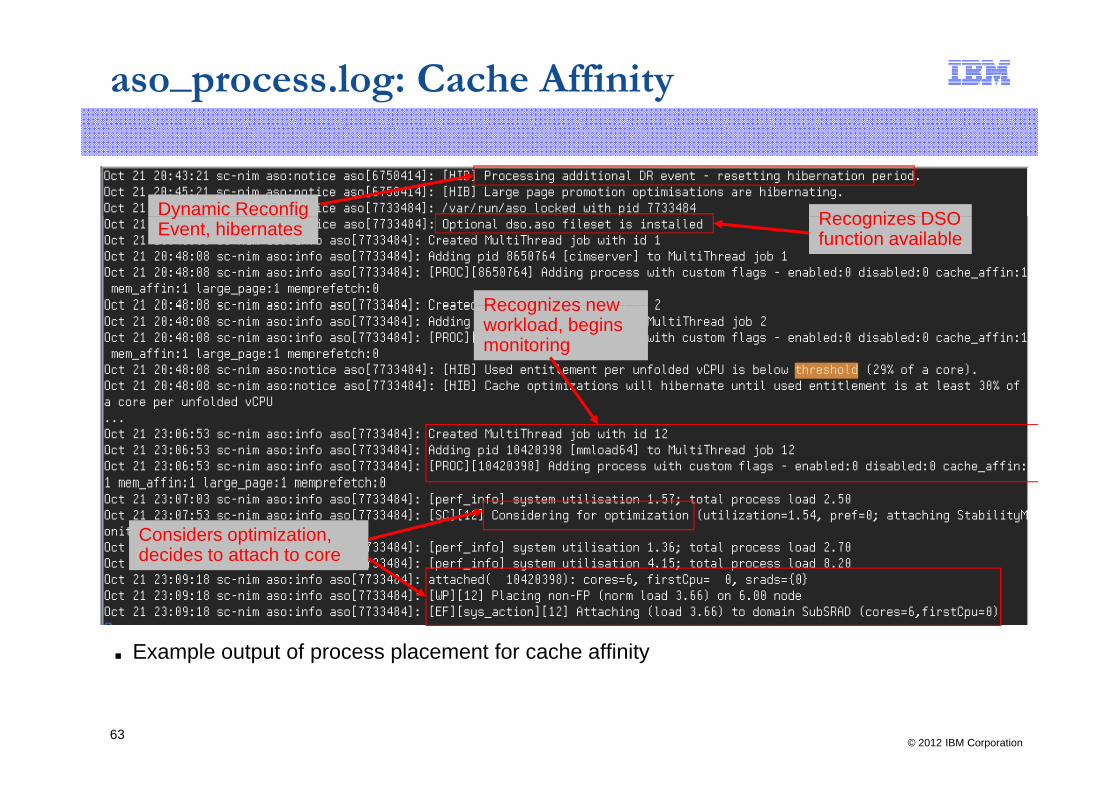
Dynamic Reconfig Recognizes DSOy gEvent, hibernates
Recognizes new
Recognizes DSOfunction available
Recognizes new workload, begins monitoring
Considers optimization, decides to attach to core
■ Example output of process placement for cache affinity
© 2012 IBM Corporation63
aso_process.log: Cache Affinity
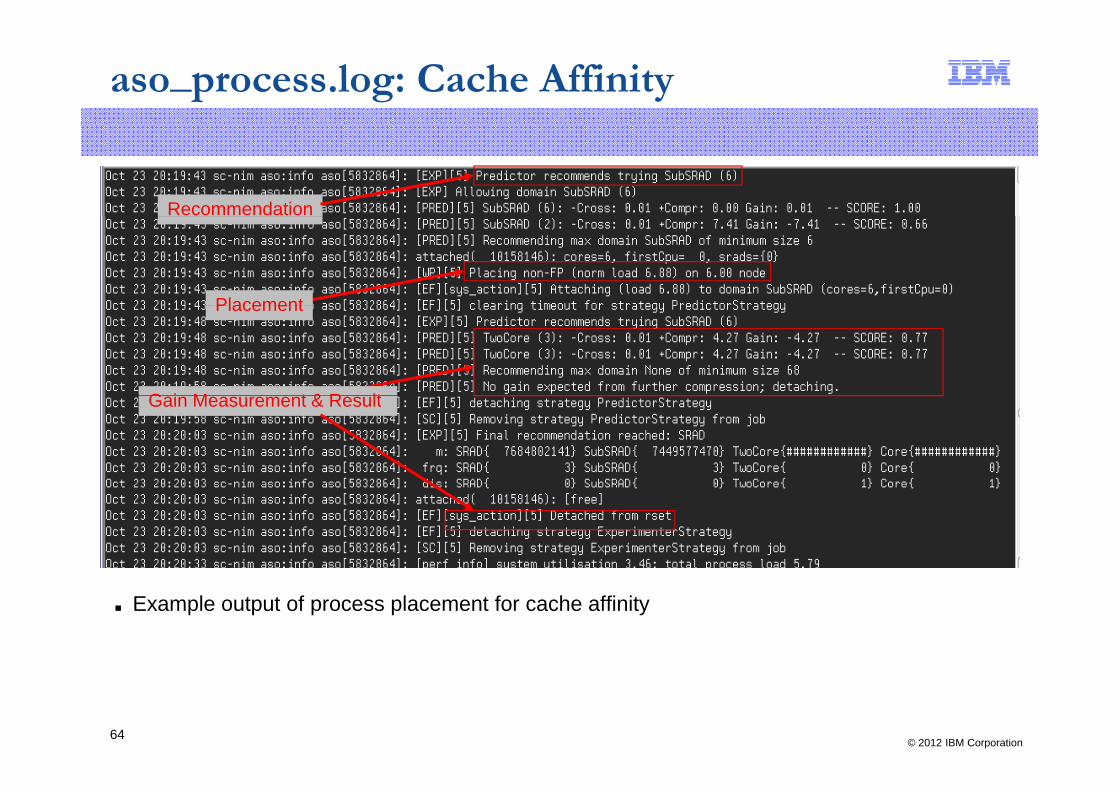
Recommendation
PlacementPlacement
G i M t & R ltGain Measurement & Result
■ Example output of process placement for cache affinity
© 2012 IBM Corporation64
aso_process.log: Memory, Large Pages
Attaching to coresg
Large Page/TLBLarge Page/TLB profiling
Not enough gain, removing cache memory large pagecache, memory, large page and pre-fetch attempts
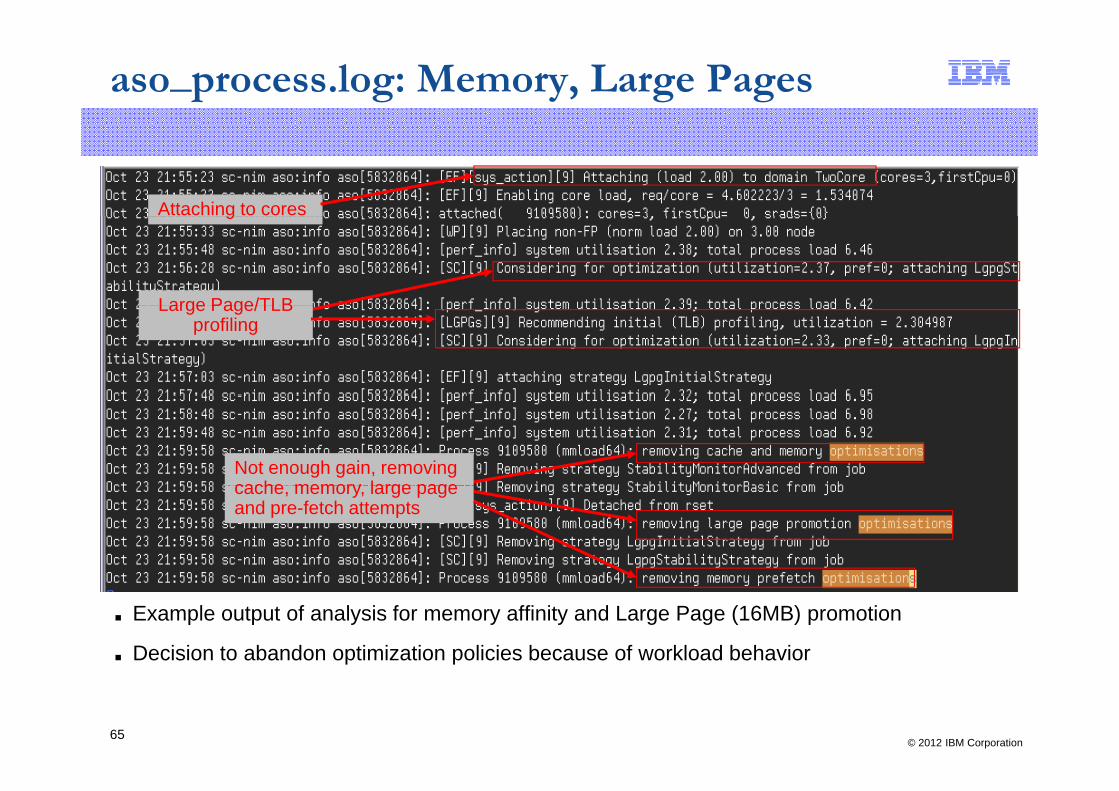
■ Example output of analysis for memory affinity and Large Page (16MB) promotion
■ Decision to abandon optimization policies because of workload behavior
© 2012 IBM Corporation65
Miscellaneous New FeaturesMiscellaneous New Features
© 2012 IBM Corporation66
Hardware Page Table Ratio
■ All partitions have an associated Hardware Page Table (HPT)The memory set aside is a ratio to the Maximum Memory size defined for the– The memory set aside is a ratio to the Maximum Memory size defined for the partition for use by Hypervisor
– The default for POWER5 to POWER7 servers is 1:64 and is a profile attribute■ POWER7+ servers have two default HPT ratios
1 128 f AIX Li d VIOS titi th t d di t d– 1:128 for AIX, Linux and VIOS partitions that use dedicated memory• Saves Hypervisor memory• Will not impact performance*
– 1:64 for IBM i partitions and all shared memory partitions■ Can I change my existing POWER7 systems to 1:128 with updated HMC/firmware?
– Probably not an issue in deploying new partitions, but likely not worth the effort to redo existing environments unless you have run out of memory
– For * above, there are situations where AIX Support has requested customers define a higher Maximum Memory setting so that a partition would have a largerdefine a higher Maximum Memory setting so that a partition would have a larger HPT. Any previous guidance takes precedence over this new capability.
■ Commands for HPT– Display partition ratio
lshwres –m [partition] –r mem –level lpar –F curr hpt ratiolshwres m [partition] r mem level lpar F curr_hpt_ratio– Config ratio for a partition
chsyscfg –r prof –m [partition] –I “name=p1,lpar_id=1,hpt_ratio=1:64”
© 2012 IBM Corporation67
Idle Power Save Mode
■ New power saving mode that occurs when the system is very idleg y y– Entered when all cores have utilization less than 10% for 240 seconds– Exited when any core has utilization over 10% for 10 seconds
■ Unlikely to affect performance but can b disabled via Advanced System■ Unlikely to affect performance, but can b disabled via Advanced System Management or HMC CLI
■ Possible symptom: idle system (> 240 seconds) has poor performance for 10 seconds after workload startseconds after workload start
© 2012 IBM Corporation68

Very Small Partitions
■ Firmware and AIX have previously supported entitlement settings down to one tenth of a physical core
– Allows for many smaller partitions to be configured– Entitlement is guaranteed every 10 msec– These partitions typically may have a poor throughput rate because they areThese partitions typically may have a poor throughput rate because they are
only guaranteed 1 msec of the 10 msec of the operating systems dispatch window
– Workloads may spend a large part of their tiny dispatch time reloading cache
■ Entitlement feature support down to 0.5 of a physical core will result in these partitions only running from 0.5 to 1.0 msec of a dispatch cycle
© 2012 IBM Corporation69
50 msec Dispatch Window
■ Hypervisor and AIX operate on a 10 msec dispatch wheel, with 100 dispatch indo s e er secondwindows every second
■ Legacy AIX timeslice tunable can be used to have the scheduler run a fixed priority thread across 10 msec dispatch windows, but the dispatcher itself still operates on a 10 msec cycle. This is rarely, if ever, used and should only be doneoperates on a 10 msec cycle. This is rarely, if ever, used and should only be done upon request by AIX Support.
■ Hypervisor 760 firmware will be able to support a 50 msec dispatch interval– Independent of the OS cycle
N t t d 770/780/795 d l– Not supported on 770/780/795 models– Partitions would have longer dispatch cycles but would also wait longer for their
turn to execute (50 dispatch windows per second versus default 100)– Could enable busy small partitions to run longer and have higher throughput
W kl d th t h ti i t d/ f t I/O– Workloads that have narrow response time requirements and/or frequent I/O operations will be negatively impacted (such as OLTP)
■ This feature allows certain benchmarks to have higher throughput levels
■ Customers should not experiment with this, it is more of an enablement feature that may be exploited for throughput workloads (think PureSystems)
© 2012 IBM Corporation70
BackupBackup
© 2012 IBM Corporation71
APARs to KnowAPARs to Know
© 2012 IBM Corporation72
Updates: POWER7 & AIX
■ The most problematic performance issues with AIX have been resolved– Memory Affinity Domain Balancingy y g– Scheduler/Dispatch defects– Wait process defect– TCP Retransmit– Shared Ethernet defects– Shared Ethernet defects
■ The next slide provides the APARs to resolve the major issues– We strongly recommend updating to these levels if you encounter performance
issues. AIX Support will likely push you to these levels before wanting to doissues. AIX Support will likely push you to these levels before wanting to do detailed research on perfomance PMRs.
– All customer Proof-of-Concept or tests should use these as minimum recommended levels to start with
■ Some of these can impact the VIOS. For related updates in the future, monitor:
https://www14.software.ibm.com/webapp/set2/sas/f/vios/home.html
© 2012 IBM Corporation73
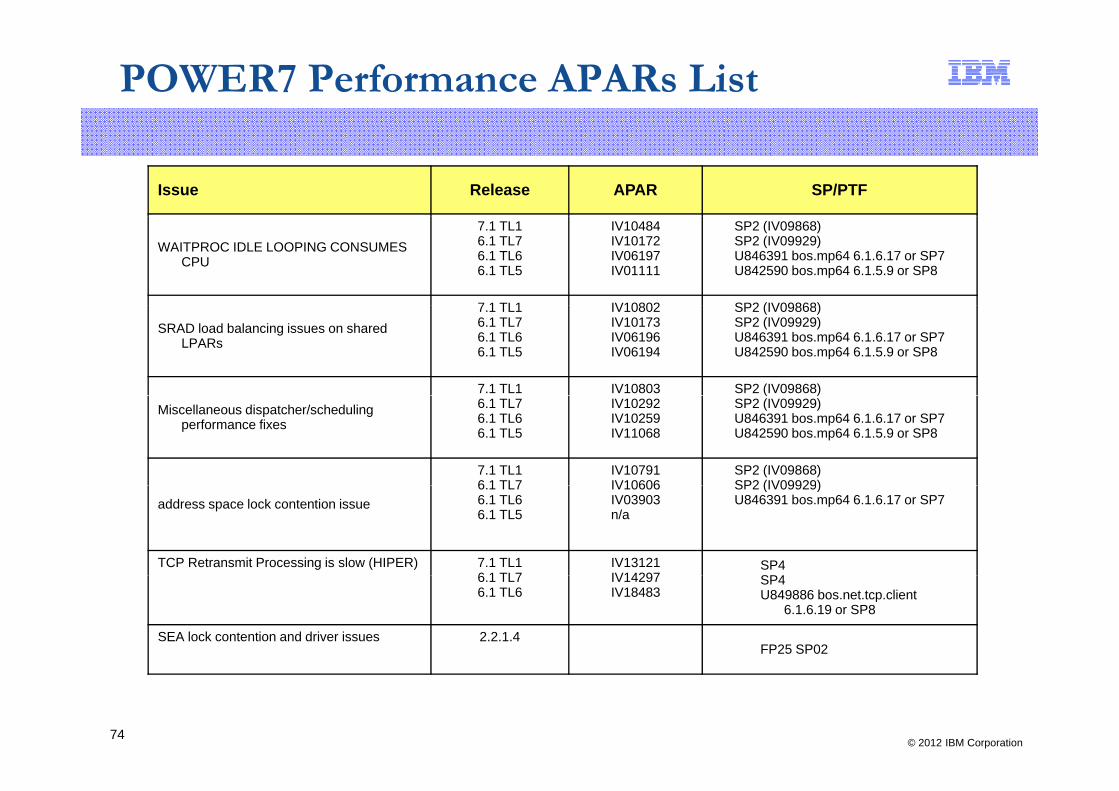
POWER7 Performance APARs List
Issue Release APAR SP/PTF
WAITPROC IDLE LOOPING CONSUMES CPU
7.1 TL16.1 TL76.1 TL66.1 TL5
IV10484IV10172IV06197IV01111
SP2 (IV09868)SP2 (IV09929)U846391 bos.mp64 6.1.6.17 or SP7U842590 bos.mp64 6.1.5.9 or SP8
7 1 TL1 IV10802 SP2 (IV09868)SRAD load balancing issues on shared
LPARs
7.1 TL16.1 TL76.1 TL66.1 TL5
IV10802IV10173IV06196IV06194
SP2 (IV09868)SP2 (IV09929)U846391 bos.mp64 6.1.6.17 or SP7U842590 bos.mp64 6.1.5.9 or SP8
7.1 TL1 IV10803 SP2 (IV09868)Miscellaneous dispatcher/scheduling
performance fixes6.1 TL76.1 TL66.1 TL5
IV10292IV10259IV11068
( )SP2 (IV09929)U846391 bos.mp64 6.1.6.17 or SP7U842590 bos.mp64 6.1.5.9 or SP8
7.1 TL16 1 TL7
IV10791IV10606
SP2 (IV09868)SP2 (IV09929)
address space lock contention issue6.1 TL76.1 TL66.1 TL5
IV10606IV03903n/a
SP2 (IV09929)U846391 bos.mp64 6.1.6.17 or SP7
TCP Retransmit Processing is slow (HIPER) 7.1 TL16 1 TL7
IV13121IV14297
SP4SP46.1 TL7
6.1 TL6IV14297IV18483
SP4U849886 bos.net.tcp.client
6.1.6.19 or SP8
SEA lock contention and driver issues 2.2.1.4FP25 SP02
© 2012 IBM Corporation74
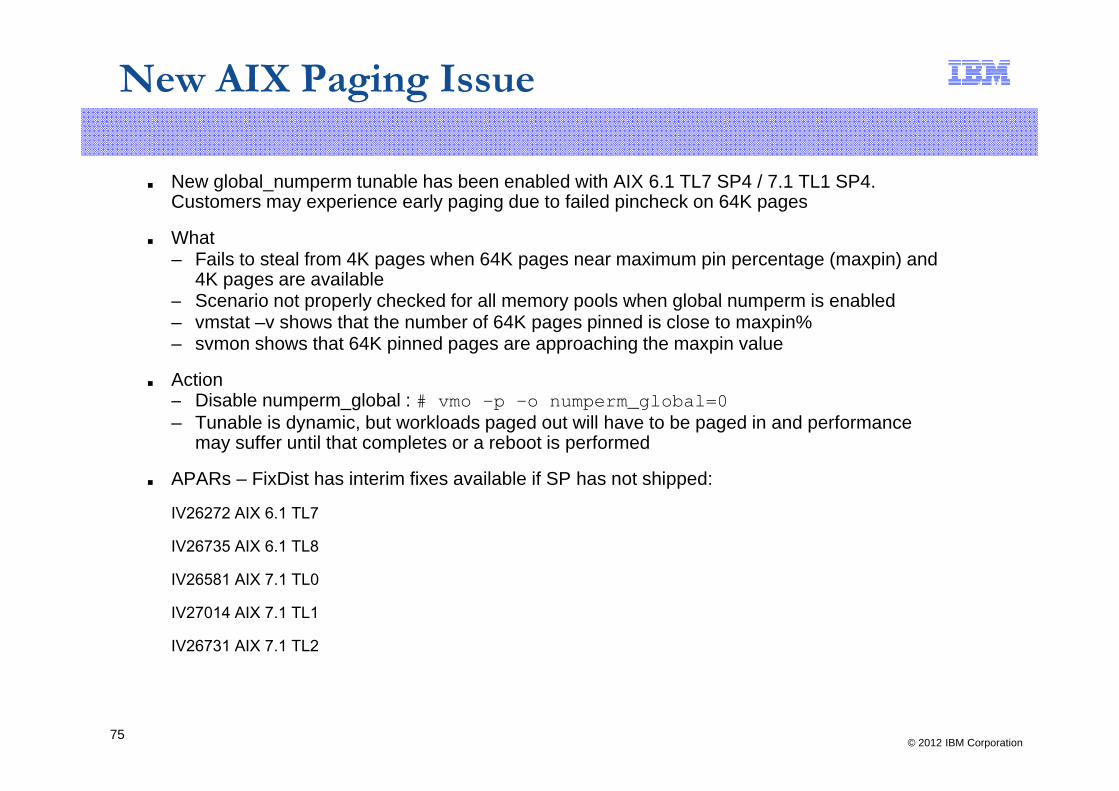
New AIX Paging Issue
■ New global_numperm tunable has been enabled with AIX 6.1 TL7 SP4 / 7.1 TL1 SP4. Customers may experience early paging due to failed pincheck on 64K pages
■ What– Fails to steal from 4K pages when 64K pages near maximum pin percentage (maxpin) and
4K pages are available– Scenario not properly checked for all memory pools when global numperm is enabledScenario not properly checked for all memory pools when global numperm is enabled– vmstat –v shows that the number of 64K pages pinned is close to maxpin%– svmon shows that 64K pinned pages are approaching the maxpin value
■ ActionDi bl l b l # l b l 0– Disable numperm_global : # vmo -p -o numperm_global=0
– Tunable is dynamic, but workloads paged out will have to be paged in and performance may suffer until that completes or a reboot is performed
■ APARs – FixDist has interim fixes available if SP has not shipped:pp
IV26272 AIX 6.1 TL7
IV26735 AIX 6.1 TL8
IV26581 AIX 7 1 TL0IV26581 AIX 7.1 TL0
IV27014 AIX 7.1 TL1
IV26731 AIX 7.1 TL2
© 2012 IBM Corporation75

Entitlement, Memory & P i i PlPartition Placement
© 2012 IBM Corporation76
Entitlement & Partition Placement
■ The hypervisor will attempt to pack partitions onto the smallest number of chips/drawers. Other features like System Partition Processor Limit (SPPL) can bechips/drawers. Other features like System Partition Processor Limit (SPPL) can be used to influence placement on POWER7 795 (Backup material)
The hypervisor uses shared processor partition’s desired processing units■ The hypervisor uses shared processor partition s desired processing units (entitlement) or the number of dedicated cores along with memory requirements to place partitions– For example, if the entitlement is 16.0 and the system contains POWER7 two-
chip drawers (16 cores) it would try to contain it in a single drawerchip drawers (16 cores), it would try to contain it in a single drawer– If memory requirements will fit within a drawer, that information will also be used
by the hypervisor
■ If you have partitions undersized in entitlement, the hypervisor may pack many of them into a single drawer, rather than spreading them across drawers– By default, after placement has been made, the hypervisor will try to dispatch
Virtual Processors associated with those partitions within the drawerIf h f Vi l P d k i d i h h i i– If the sum of Virtual Processors and work associated with those partitions exceeds the physical resources of the drawer, it will then be forced to dispatch Virtual Processors to other drawers within the shared pool. This will lead to lower memory affinity and longer latencies.
© 2012 IBM Corporation77
Memory & Partition Placement
■ Partition Placement is effected by the Maximum Memory sizing and not just the Desired Memory (the desired allocation at boot time)Desired Memory (the desired allocation at boot time)
■ If partitions have high differences between Maximum Memory versus Desired Memory settings, the closer Maximum Memory is to the DIMM population of a drawer, the more likely it will decide to spread a partition across drawers.drawer, the more likely it will decide to spread a partition across drawers.– It is very common to see customers running with Maximum Memory set 2-3X of
Desired– Beware customers doing this when the differences are > 64 GB of memory.
Architects and customers should be able to get closer than this!Architects and customers should be able to get closer than this!– See Tracy Smith’s Architecting and deploying of Enterprise class Power
Systems
■ Memory requirements include the size of the partitions Hardware Page Table■ Memory requirements include the size of the partitions Hardware Page Table (HPT) and this must be accounted for– Each logical partition has a hardware page table (HPT). The HPT is allocated in
the server firmware memory overhead for the logical partition, and the size of the HPT can affect the performance of the logical partitionthe HPT can affect the performance of the logical partition.
– The HPT ratio is the ratio of the HPT size to the Maximum Memory (not Desired Memory) value for the logical partition.
© 2012 IBM Corporation78
Partition Placement
■ Entitlement plays an important part in the decision-making for the OS and the hypervisor Low entitlement high Virtual Processor ratios and high physicalhypervisor. Low entitlement, high Virtual Processor ratios, and high physical consumption do not help the hypervisor’s partition placement – they will lead to lower affinity to physical resources
■ Hypervisor and Operating System affinity mechanisms for chip intra-node and■ Hypervisor and Operating System affinity mechanisms for chip, intra node and inter-node will may not work properly if Maximum Memory setting and Entitlement sizings are not realistic. This can impact performance.
■ Having additional Capacity-On-Demand cores and memory populated, even if not g p y y p p ,used, give the hypervisor more freedom for optimal partition placement– Best practices for many-node systems is to ensure that CPU resources and
memory are evenly populated to prevent either drawers having active CPUs but no memory or vice-versano memory, or vice-versa
– System Planning tools do not provide physical mappings to optimize cpu and memory population choices. More flexibility and options are in development.
© 2012 IBM Corporation79

VIOS & Java general Best P tiPractices
© 2012 IBM Corporation80
POWER7 Virtual I/O Server
■ Does VIOS have to be treated differently with POWER7?– In general, it’s not something specific to POWER7, it’s specific to Server Consolidation
ffefforts– With more cores per chip, 32-way single-node systems, 64 to 128-way multi-node systems
becoming more common, consolidation efforts result in more complex Virtual I/O Servers resident on POWER7 systemsHigher capacity Extra High Bandwidth adapters are becoming more prevalent and require– Higher capacity Extra-High Bandwidth adapters are becoming more prevalent and require more VIOS memory
■ Speaking from my own experience, many customers are doing larger consolidations on POWER7 and “going live” with very little, or no, realistic production-level testing
■ Study update and sizing presentations that are available– James Nash’s Virtual I/O Server Sizing– Linda Flanders Virtual I/O Server Update: New Features– And others available to the field Developerworks and TechdocsAnd others available to the field, Developerworks and Techdocs
■ Redbook updates– IBM PowerVM Virtualization Managing and Monitoring SG-24-7590-03– Various Virtual I/O Server Monitoring Agents and tool coverage
■ Tech Docs– Katharina Probst’s Include VIOS Partitions into SAP Performance Monitoring
http://www.ibm.com/support/techdocsSearch on VIOS and SAP
© 2012 IBM Corporation81
Virtual I/O Server: Review
■ VIOS that will see moderate I/O, or non-production, and will not fully stress adapters– Use micropartitioning, uncapUse micropartitioning, uncap– 0.5 entitlement, 2 Virtual Processors, Variable Capacity Weighting of 255– Standard Memory:
• 2 GB + 512 MB for each Extra-High Bandwidth Adapter• 102 MB for each IVE/Host Ethernet Adapter portp p
■ AIXpert Blog https://www.ibm.com/developerworks/mydeveloperworks/blogs/aixpert/entry/rule_of_thumb_sizing_the_virtual_i_o_server78?lang=en
– For every 16 CPUs, 1.0 shared and 2 GB (assumes CPU workloads, not high IO)10 Gb Ethernet or 8 Gb SAN and using that bandwidth 2X memory to 4GB– 10 Gb Ethernet or 8 Gb SAN and using that bandwidth, 2X memory to 4GB
– High IO that will stress adpaters or many tiny VMs – 6 to 8 GB– 32-way and higher machines mixing test, development and production, warrant
production VIOS and non-production VIOS
■ DeveloperWorks VIOS Sizing link with Field Specialists’ experiences:https://www.ibm.com/developerworks/wikis/display/virtualization/VIOS+Sizing
■ Use Workload Estimator, System Planning Tool (NPIV memory planning) and VIOS P f Ad i ( b dl d VIOS H lth Ad i )Performance Advisor (now bundled VIOS Health Advisor)
■ Very high network throughput VIOS (10 Gb, SEA, etc) must be sized for cpu and in some cases running in dedicated donating mode may provide best performance (see Rosa Davidson’s Return to Basics sessions)
© 2012 IBM Corporation82
Rosa Davidson s Return to Basics sessions)
SEA/VE, 10 Gb: Tuning
■ If you are not reaching expected bandwidth with SEA or multiple-stream Virtual Ethernet, you can adjust memory buffers by size y j y y#chdev -l [ent device] -a min_buf_tiny=2048 -a min_buf_small=2048 -a min_buf_medium=256 -a min_buf_large=48 -a min_buf_huge=64
– Large send/receive must be enabled on any SEA bridge and physical adaptersLarge send/receive must be enabled on any SEA bridge and physical adapters– Small packet workloads (< 512 bytes) at 10 Gb speeds may require special
tunings– Driving 10 Gb throughput requires significant cpu resources (whether dedicated
or shared adapter) Consuming two POWER7 CPUs is not unusualor shared adapter). Consuming two POWER7 CPUs is not unusual.– Larger MTU’s (9K for general tuning or 64K for Virtual Switch ethernet) will
significantly reduce CPU utilization
■ Defects that have impacted all types of AIX environments have also impacted the■ Defects that have impacted all types of AIX environments have also impacted the VIOS– Complaint: “ping or ftp is slow, varies across different VIOS”– Apply Firmware, Dispatcher & SEA APARs mentioned in service issues slides
© 2012 IBM Corporation83
POWER7 Best Practices: Java
■ Best Practices for Java performance on POWER7http://www-304.ibm.com/partnerworld/wps/servlet/ContentHandler/stg_ast_sys_java_performance_on_power7g y j
■ For Linuxhttps://www.ibm.com/developerworks/wikis/display/LinuxP/Java+Performance+on+POWER7
■ Many optimizations are only available in Java 6 SR7 and abovey p y– Java 6 SR7 enhanced for POWER7 instructions– Software pre-fetch– Autonomic 64KB page sizes support with AIX 6.1http://www.ibm.com/developerworks/java/jdk/aix/faqs.html
■ Websphere Application Server (WAS)– V7 & V8 provide specific exploitation of POWER6 & POWER7 instructions and
64KB page sizes– V8 includes scaling footprint reduction Java Persistence API (JPI)V8 includes scaling, footprint reduction, Java Persistence API (JPI)
improvements
© 2012 IBM Corporation84
POWER7 SPPL ReviewPOWER7 SPPL Review
© 2012 IBM Corporation85

Affinity: POWER7 795 Partition Placement/Licensing
Firmware eFW7.2 levels and above support System Partition Processor Limit (SPPL)
Partitions are optimally grouped to physical resources based based on size and available resources
Applies to shared or dedicated environments
Licensing updates in Firmware eFW7.3 and later expand this function At system power on treat all processors and memory as licensed
f fPlace all the partitions as optimally as possible from a performance viewpointMay require spreading a partition across multiple chips/drawers/books to ensure memory
and processors on domains (i.e. try to ensure if memory from a domain there is also a processor from the domain and visa versa).
Optimization of other hardware components might also cause spreading of larger partitions across domains (i.e. to provide additional internal bus bandwidth, spread >24 way processor partitions across multiple books)
Unlicense individual processors that have not been assigned to partitionsUnlicense individual processors that have not been assigned to partitionsFirst choice is to unlicense processors that do not have any memory DIMMs connected to
the processorSecond is to spread out the unlicensed processors across the domains such that each
domain would have similar number of unlicensed processors
© 2012 IBM Corporation86
domain would have similar number of unlicensed processors

System Partition Processor Limit (SPPL) on HMC
Systems ManagementPropertiesp
Advanced Tab
The following section in Managing the HMC infocenter topic provides a reference to System Partition Processor Limit (SPPL):
htt // blib b ld ib /i f t / / 3 1 5/i d j ?t i / 7h 1/ P ti ht
© 2012 IBM Corporation87
http://publib.boulder.ibm.com/infocenter/powersys/v3r1m5/index.jsp?topic=/p7ha1/smProperties.htm
Affinity: POWER7 795 Partition Placement/Licensing
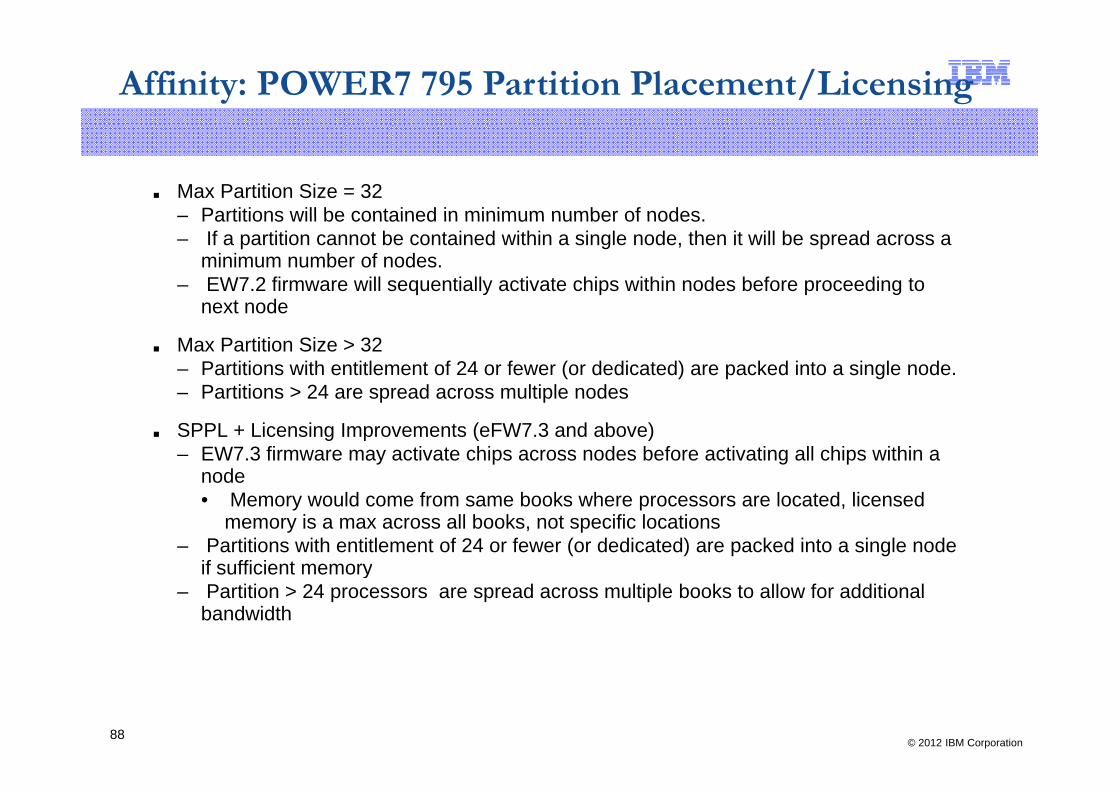
■ Max Partition Size = 32– Partitions will be contained in minimum number of nodes– Partitions will be contained in minimum number of nodes.– If a partition cannot be contained within a single node, then it will be spread across a
minimum number of nodes.– EW7.2 firmware will sequentially activate chips within nodes before proceeding to
next nodenext node
■ Max Partition Size > 32– Partitions with entitlement of 24 or fewer (or dedicated) are packed into a single node.– Partitions > 24 are spread across multiple nodesPartitions > 24 are spread across multiple nodes
■ SPPL + Licensing Improvements (eFW7.3 and above)– EW7.3 firmware may activate chips across nodes before activating all chips within a
node • Memory would come from same books where processors are located, licensed
memory is a max across all books, not specific locations – Partitions with entitlement of 24 or fewer (or dedicated) are packed into a single node
if sufficient memoryy– Partition > 24 processors are spread across multiple books to allow for additional
bandwidth
© 2012 IBM Corporation88