operational impacts of lean manufacturing: the case of a
TRANSCRIPT
Recebido:
15/08/2018
Aprovado:
30/01/2019
Operational impacts of lean manufacturing: the case of a consumer goods industrial
company
Ricardo Santos Cruz1, Centro Universitário SENAI CIMATEC
Paulo Soares Figueiredo2, Escola de Administração da UFBA
Francisco Uchoa Passos3, Centro Universitário SENAI CIMATEC
Elisabeth Regina Loiola da Cruz Souza4, Escola de Administração da UFBA
This study aims to verify the effect of implementing a lean manufacturing
(LM) system on operational performance in an industrial company’s
production line. There are few studies that seek to quantitatively verify the
effect of implementing an LM system on the operational performance of a
company, and that is the main objective of this research. In this case-
based study, the LM implementation in the company studied is compared
with best practices and reference models, ascertaining the degree of
adherence of the company’s program. The operational performance, in
terms of three key dimensions of cost, quality and lead time, is compared
before and after the implementation of the LM program. By comparing the
means of quantitative indicators related to the three performance
dimensions, evidence was found of significant gains in the operational
performance, and it was demonstrated that the company followed many of
the best practices of LM implementation found in the literature. This study
contributes to managers and to the literature on LM by measuring its
apparent impacts on operational performance.
Keywords: Operational performance. Value chain. Lean manufacturing.
Best practices.
ABSTRACT
1. [email protected]; 2. Av. Reitor Miguel Calmon, s/n - Vale do Canela, Salvador - BA, 40110-903,
[email protected]; 3. [email protected]; 4. [email protected]
CRUZ, R.S.; FIGUEIREDO, P. S.; PASSOS, F.U.; SOUZA, E.R.L.C. Operational impacts of lean manufacturing: the case of a
consumer goods industrial company. GEPROS. Gestão da Produção, Operações e Sistemas, v. 14, n. 4, p. 279 - 304, 2019.
DOI: 10.15675/gepros.v14i4.2362
GEPROS. Gestão da Produção, Operações e Sistemas, Bauru, Ano 14, nº 4, out-dez/2018, p. 1-23. DOI: 10.15675/gepros.v13i4.1965
Editor Responsável: Prof.
Dr. Hermes Moretti Ribeiro da
Silva
GEPROS. Gestão da Produção, Operações e Sistemas, v. 14, nº4, p. 279 - 304, 2019.

280
Operational impacts of lean manufacturing: the case of a consumer
goods industrial company
GEPROS. Gestão da Produção, Operações e Sistemas, v. 14, nº 4, p. 279 - 304, 2019.
1. INTRODUÇÃO
In the early 1960s, consumer demand and the growth of competitors forced companies
to pursue new manufacturing practices. This dynamic led Japanese companies in the
automotive sector, particularly the Toyota Motor Company, to develop a different method,
which was later called the Toyota Production System (TPS) (OHNO, 1997; WOMACK;
JONES, 1990; CUSUMANO, 1998).
Lean manufacturing (LM), derived from the TPS, emerged as a management
philosophy focused on prioritizing improvements in production through systematic and
continuous elimination of losses in a productive system; its central objective is to deliver the
maximum value using the least amount of resources possible. When this production system is
properly adapted and applied to a company, it provides excellent results, as there are
numerous opportunities to reduce or eliminate waste (OHNO, 1997).
Companies that adopt the LM system, using its management tools, discover that the
implementation of this system should not only be based on teaching techniques to their
employees; attention must also be paid to the human side of LM in order to have successful
implementation (SHAH; WARD 2003).
Failures in the implementation processes of lean philosophy and practices in
productive environments are largely due to the inadequacy of theories derived from the TPS
or a lack of understanding thereof. The TPS is a system whose functioning depends on a
correct interrelationship between all its elements, not a partial application of its tools. Before
its implementation can begin, it is thus necessary to establish a holistic vision, in order to
accurately understand TPS concepts and principles (PASA 2004; LIKER, 2007; PASCALE;
ATHOS, 1982; BOZDOGAN et al., 2000). A shallow understanding of how the TPS
functions causes leaders to confuse lean tools with the principles that underpin them. This
leads to failures in attempts to replicate it (BOWEN; SPEAR ,1999; LIKER, 2007;
NONAKA; TAKEUCHI, 2004).
Shah and Ward (2003) found that LM practices contribute substantially to improving
the operational performance of factories, although implementation requires increasingly
tailored solutions. For this reason, implementing LM management in a productive system is a

281
Operational impacts of lean manufacturing: the case of a consumer
goods industrial company
GEPROS. Gestão da Produção, Operações e Sistemas, v. 14, nº 4, p. 279 - 304, 2019.
complex task. Even so, different authors have published studies regarding best practices for
implementing LM.
The need to use indicators that can assess the LM implementation process is
important, as, according to Karlsson and Ahlstrom (1997), it is common for decreases in
productivity and discouragement with the system’s adoption to occur during the initial periods
of implementation; these aspects are usually detected by traditional accounting systems.
According to Battaglia (2006), most companies’ indicators are traditionally linked to financial
results, production volume and the efficiency of manpower and machinery. Traditional
performance measurement indicators, in particular, do not adequately assess the performance
of value streams that are relevant to the company, focusing only on evaluating process and
individual operations (MASKELL; BAGGALEY, 2011). Generally, this performance data
does not constitute complete relevant information, and when this happens, the organization
faces difficulties in promoting the intended improvements. It is therefore necessary to be able
to correctly analyze the data and use it for good decision making, which is the essence of
performance management (MARTINS, 2002).
This paper presents an attempt to ascertain the operational impact of implementing
LM in production lines. To this end, it verified the adoption of practices prescribed for
implementing LM in the company studied and sought to relate the adoption of these practices
with the subsequent impact on operational performance. It is thus a case study (YIN, 1994),
restricted to the environment of a production unit.
Based on the previous reflection, the following research question emerges: “what is
the operational impact of implementing an LM program in a non-durable consumer goods
company, measured in a specific ex post period?”. This study’s objective is thus to verify the
effect of implementing an LM system on that company’s operational performance.
Although LM is widely recognized for its effectiveness in continually improving
productivity, product quality and on-time delivery to customers, only 10% or less of
companies globally are able to implement LM with the expected success, using lean tools,
techniques and technologies to improve their operational performance (VIENAZINDIENE;
CIARNIENE, 2013). Therefore, to contribute to increasing knowledge and experience in this
area, it is interesting to show—even in a single case study—another example of the results of
adopting LM practices in terms of improving operational performance.
282
Operational impacts of lean manufacturing: the case of a consumer
goods industrial company
GEPROS. Gestão da Produção, Operações e Sistemas, v. 14, nº 4, p. 279 - 304, 2019.
2. LITERATURE REVIEW
This chapter presents and discusses theoretical postulates of LM, focused on concepts
and processes for its implementation, and highlights the best LM practices that have already
been validated in the literature. It also includes arguments that establish associations between
LM implementation/use and operational performance.
2.1. LM Implementation
Karlsson and Ahlstrom (1997) proposed measuring the progress made in a company’s
efforts to become lean by measuring determinants that characterize the application of LM
principles in industrial companies. Nine determinants were identified: waste elimination,
continuous improvement, zero defects, just-in-time deliveries, existence of pull production,
use of multifunctional teams, decentralization, integration of functions and existence of
vertical information systems. For each determinant, the authors selected several variables that
could adequately characterize it. Measuring the evolution of these variables over time would
define the progress achieved in the implementation of the respective LM practices. However,
this model has two practical limitations: (1) it does not establish a single quantity to measure
the degree of implementation of all LM practices in a company in an integrated manner, and
(2) its use is conditioned on the adoption of the same set of determinants and variables, such
that the results produced by the model could provide relative comparisons between different
companies.
Without the force of an established norm or standard for LM implementation, it will
be very difficult to obtain the consensus mentioned above. Soriano-Meier and Forrester
(2002), in turn, relied upon the model proposed by Karlsson and Ahlstrom (1997) and the
extent of managerial commitment to implementing LM practices to propose a quantity, called
degree of leanness (DOL), which should be used to measure the degree of implementation of
LM practices in industrial companies. According to the authors, the DOL is defined as “the
mean of the changes that occurred in a given period, measured by the nine determinants of
lean production as defined by Karlsson and Ahlstrom (1997)”. As seen, although the
definition proposed by Soriano-Meier and Forrester (2002) suggests adopting a single
quantity to measure the implementation of LM practices, it implies a temporal limitation that
precludes its use for other periods of time. As a means to circumvent some of the limitations

283
Operational impacts of lean manufacturing: the case of a consumer
goods industrial company
GEPROS. Gestão da Produção, Operações e Sistemas, v. 14, nº 4, p. 279 - 304, 2019.
discussed and to help corporate managers implement the concepts of lean operation in their
organizations, the Society of Automotive Engineers (SAE) developed two standards, called
(1) SAE J4000 – Identification and Measurement of Best Practices in the Implementation of
Lean Operations and (2) J4001 – Implementation of the Lean Operation User Manual. An
explanation of their contents and details regarding their application are presented below.
The implementation of LM depends upon beginning a process of cultural change in
organizations, which will be followed by employee training and the implementation of
principles and techniques to sustain it, making it possible to efficiently combat losses in the
productive system (WOMACK; JONES, 1990).
The implementation of LM philosophy and principles can be described as performing
a set of actions and processes that begins with planning the change, continues with defining
the success factors, and ends with implementing practices and measuring progress and
barriers.
Although many variables can affect the success of implementation, Alavi (2003),
Bamber and Dale (2000), Boyer and Sovilla (2003), Parks (2002), and Womack and Jones
(1990) agree that management is crucial. According to Boyer and Sovilla (2003), top
management should not only demonstrate commitment and leadership but should also work to
build interest in the implementation and communicate the change to everyone within the
organization. Alavi (2003), Boyer and Sovilla (2003) and Emiliani (2001) argue that
management should be visibly linked to the project and participate in LM events. Worly and
Doolen (2006) argue that management's lack of investment in the LM implementation can
also affect the implementation’s success in a less visible manner. If employees feel that the
executive team does not respect their efforts, they may become discouraged. Boyer and
Sovilla (2003) suggest that although it is often desirable to lead the change from the factory
floor, it is important that a transition is performed. Investments in manufacturing support
infrastructure are important (SORIANO-MEIER; FORRESTER, 2002), as is the existence of
incentive systems for managers and operators (KOH; SIM; KILLOUGH, 2004). On the other
hand, Shah and Ward (2003) concluded that factors with little influence are the age of the
plant and the degree of the operators’ unionization.
Based on these studies, it is clear that the success of an LM implementation depends
on the particularities of each company, according to the interrelationships between the
different factors mentioned above. Lewis (2000) makes the caveat that companies’ trajectories

284
Operational impacts of lean manufacturing: the case of a consumer
goods industrial company
GEPROS. Gestão da Produção, Operações e Sistemas, v. 14, nº 4, p. 279 - 304, 2019.
for implementing LM are unique in most cases, and it is therefore necessary to make
adaptations for each organizational, technological and environmental context external to the
organization.
Summarizing the conclusions of different studies, such as Martinez and Perez (2001),
Radnor and Walley (2008), Duque and Cadavid (2007), Upadhye, Bollbach (2012) and
Ciarniene and Vienazindiene (2012), the authors Vienazindiene and Ciarniene (2013) present
a diagram of what would, in their opinion, be a model for successful “lean” implementation.
(Figure 1).
Figure 1 – Model for Lean implementation
Source: Adapted from Vienazindiene and Ciarniene (2013).
To successfully implement the LM concept, many researchers emphasize some
behavioral qualities, such as top management commitment, leadership ability, and
management style (SUNDA; BALAJI; KUMAR, 2014). In essence, these qualities would
facilitate the integration of the entire organizational infrastructure through strong leadership
and a strategic management vision (TALEGHANI; MOUSAVIAN, 2013). The fact is that
some organizations that implemented LM reported enormous benefits, whereas others did not
achieve the desired results. Some companies that reported initial gains following
implementation were able to continually improve while others failed to continually improve.
Anand and Kodali (2009) believe that companies, or individual managers, have adopted the
lean approach with an incomplete understanding of LM and, as a result, the company has not
been able to reap all the benefits that the Toyota paradigm enjoys. According to Sundar et al.

285
Operational impacts of lean manufacturing: the case of a consumer
goods industrial company
GEPROS. Gestão da Produção, Operações e Sistemas, v. 14, nº 4, p. 279 - 304, 2019.
(2014), most research on lean systems focuses on only one or two elements, or a combination
of two or three elements. To implement LM successfully, there is a need to incorporate all the
lean elements and arrange them in a sequence.
2.2. Implementations guidelines
This subsection’s objective is to present some authors’ guidelines for implementing
LM, which provide guides for lean transformation processes because they have a certain
degree of structure and detail. These implementation guides serve to stimulate a systemic
understanding of the operating mechanisms of the new concept or paradigm, guiding leaders
toward an understanding of LM principles and enablers.
Guide models proposed by entities recognized as important in the scientific and
business circles, which have a great deal of control over the topic of LM, will be presented
succinctly below, following the brevity imposed on this text. Three guide models are referred
to here: that of the Lean Enterprise Institute (LEI), that of Productivity Inc., and that of the
Massachusetts Institute of Technology (MIT).
LEI (2005) established a lean roadmap that can assist in the selection of the best
training sequence for those interested in their training courses. This guide is not rigid and
allows for customization of the lean preparation program, according to the application
environment, the trainee’s role and the company’s stage in the lean transformation. It should
be emphasized that all training processes must begin with value stream mapping in order to
avoid the common mistake of applying isolated techniques, rather than creating a system that
constructs a lean value stream. The guide defines 6 phases in the implementation process:
value stream mapping; modifying the skill of change agents, managing policies, achieving
process stability, creating a continuous flow of operations and materials, and creating pull
production.
Productivity Inc. (2007) presents a guide model for implementing LM, divided into 5
phases: planning, application on a pilot scale, deployment to the entire plan, integration, and
continuous excellence.
The guide model for LM implementation from MIT, according to Crabill et al. (2000),
was established based on practical experiences with implementing lean production in the
operations of several US aerospace plants. The Lean Aerospace Initiative (LAI) consortium,
mediated by MIT, conducted a study to validate this model. This guide proposes six steps:
286
Operational impacts of lean manufacturing: the case of a consumer
goods industrial company
GEPROS. Gestão da Produção, Operações e Sistemas, v. 14, nº 4, p. 279 - 304, 2019.
focusing on the value stream, developing lean structure and behavior, creating and refining
the implementation plan, implementing lean activities, and focusing on continuous
improvement.
2.3. Expected results of LM
The literature regarding the benefits of LM is vast, but there have been few studies that
quantify these benefits. Patel and Patange (2017) reviewed the literature on this topic and
concluded that having a LM system is now becoming a part of any type of organization.
Additionally, LM are broadly used for eliminating different types of waste and increasing
profits by making processes more efficient. Basu, Gosh and Dan (2018) created a list of
empirically demonstrated benefits of LM. Singh, Singh and Singh (2018) confirmed an
improvement in productivity due to LM implementation, in a case study. Similarly,
Vinayagasundaram and Kannan (2015) discovered that foundries in India that implemented
LM had an increase of 15 to 20% in their output. Kumar and Kumar (2015) proposed and
empirically tested a list of benefits and drawbacks of LM implementation, concluding that the
benefits outweigh the obstacles. Nallusamy (2016) found a significant relationship between
the practice of LM activities and defect rate and turnover rate. Zawislak (2015) found that LM
leads to a reduction in costs. Abdulmalek and Rajgopal (2007) demonstrate reductions in lead
time and a lower inventory level of in-process raw material. Melton (2005) points to
advantages such as a lower lead time for customers, lower inventory levels for the
manufacturer, better knowledge management, and more robust processes (meaning fewer
errors and therefore less reworking). Detty and Yingling (2000), in a simulation-based study,
found reductions in all of these performance variables: inventory, space occupation, transport,
labor and equipment required, order lead time, setup time, production lead time, and variation
in supplier demand. Shah and Ward (2003), in a regression study using a large sample,
concluded that 23% of the operational performance variation in the companies studied was
explained by lean practices. In other words, these practices have yielded important positive
results.
On the other hand, there are several reports of difficulties and obstacles to
implementing LM. Although the benefits of LM are widely known, many companies have yet
to implement it. Some reasons for this lack of implementation can be noted: companies have
287
Operational impacts of lean manufacturing: the case of a consumer
goods industrial company
GEPROS. Gestão da Produção, Operações e Sistemas, v. 14, nº 4, p. 279 - 304, 2019.
not heard about this organizational model; they do not know how to implement it; they do not
understand Lean principles; they do not have the support of top management; they are
unaware of the benefits brought by this model or do not know how to quantify them; or they
consider there to be investment costs. These issues were identified by companies as obstacles
to implementing LM in Kumar and Kumar (2015). It is also important to point out that
different configurations of the manufacturing environment can make it difficult to implement
LM, or even worsen the results of LM implementation. For instance, having a flexible
production-mix and high fluctuation of the demand for customized products might
compromise the benefits of LM implementation (TAJ; MOROSAN, 2011; SAHIN, 2000).
According to Maskell and Baggaley (2011), even without a precise definition of what
lean companies are, at least three characteristics are essential: lean methods, culture, and
relationships. These authors consider that when companies adopt lean methods, they obtain
operational improvements on the factory floor, which spread throughout the organization and
end up creating a new organizational culture that strengthens lean thinking. Lean practices
should be a set of actions that are planned, implemented and evaluated in order to achieve
strategies (NOGUEIRA, 2007).
3. RESEARCH METHODS AND TECHNIQUES
This case study (YIN, 1994) was performed by collecting secondary data from reports,
complemented by primary data obtained in semi-structured interviews using a questionnaire,
applied to managers and employees in the engineering and operation areas, in order to gather
information about the LM model implemented. The questionnaire was developed in a way as
to allow comparisons among LM implementation models (the LEI, Productivity Inc. (PROD)
and MIT guides), with an extensive checklist that was devised to identify the use of different
practices and tools prescribed by these models.
The model of the company studied was compared with existing theoretical postulates
regarding LM implementation, according to bibliographic research on the subject.
Quantitative aspects were analyzed to compare the mean indicators of the company's
operational performance after LM implementation, with the same indicators obtained in the
past, before the implementation. To this end, the non-parametric Mann-Whitney test was
used, which is suitable for independent samples of smaller sizes. The most common criteria
for measuring operational performance brought about by a philosophy such as LM are

288
Operational impacts of lean manufacturing: the case of a consumer
goods industrial company
GEPROS. Gestão da Produção, Operações e Sistemas, v. 14, nº 4, p. 279 - 304, 2019.
efficiency (cost and capital), reliability (products, delivery and cost), quality, delivery speed
and flexibility (product mix) (WHEELWRIGHT, 1978). The indicators used in the present
study are based on these criteria.
The company that is the focus of this study is multinational in the non-durable
consumer goods sector, ranked among the three largest companies in the non-durable products
segment in Brazil. Further details about the company cannot be provided for reasons of
confidentiality.
3.1. Development of the survey tools
The questionnaire was divided into two sections. The first section, which had 15
questions, sought information about practices in LM implementation, such as application of
tools, personnel involved, team roles and responsibilities and managerial preparation of
leadership. This questionnaire made it possible to analyze the company’s adherence to best
practices in LM implementation. The second section of the instrument, which had 13
questions, focused on difficulties and opportunities, communication during the
implementation, the motivational process, conflict resolution and improvements related to LM
implementation, but with an operational bias.
A pre-test of the questionnaire was carried out with 12 students from a university
center located in the city of Salvador in order to verify if the questions were easy to
understand, if they measured what they intended to measure, and the average response time.
Adaptations and improvements were made.
After development and pre-test of the questionnaire, semi-structured interviews were
performed. All the interviews were recorded in full. The target population totaled 20 company
employees: 10 production operators, 3 managers and 7 engineers. The respondents were
chosen as follows: the operators were selected randomly, without considering any aspect such
as age, gender, employment time or hierarchical level; the only condition was having
participated in the entire implementation process. The managers and engineers were chosen
because they had participated in and guided the process. All of them were mid-level
managers, however we can affirm that the perception of the top-level managers regarding the
strategic objectives and systemic view of the LM implementation process were shared with
these mid-level managers and with the collaborators, since this shared vision was an
important part of the process and an effort to divulge and generate commitment at all levels
289
Operational impacts of lean manufacturing: the case of a consumer
goods industrial company
GEPROS. Gestão da Produção, Operações e Sistemas, v. 14, nº 4, p. 279 - 304, 2019.
was an important part of the plan.
The quantitative data regarding operational performance in the two periods chosen
were collected directly in the company's system. Performance data were collected for two 7-
month periods, one before and one after the implementation, with a time period of 4 months
between the two periods, which corresponded to the time when LM was effectively
implemented in the company. The periods were chosen based on the limitations that were
found: The implementation of LM in the company was made recently, so the period of data
collection was restricted to the time period available for analysis. A longer period of time for
the collection would have been better, however the authors are convinced that the periods are
representative, based on the opinion of the three managers that were interviewed.
4. RESULTS AND DISCUSSION
This chapter will present (a) a measurement of the LM implementation process in the
company studied and its respective critical analysis, in comparison with the analysis model
defined for this, and (b) a comparison between the operational performance results before and
after the LM implementation.
The company is one of the three largest companies in the specific market in which it
operates, and it decided to implement LM in order to maintain competitiveness and improve
the performance of its production line, which uses comparatively old but non-obsolete
machinery. With the new production system, the company hoped to make significant gains in
terms of time, quality and cost.
The company studied has 2 (two) production lines; lean production was implemented
in only one of them. It produces two types of products (one in each line), using five different
kinds of packaging. It is important to point out that the time required to change tools is
significant and represents about 5% of operating time. The production line is only partially
automated, and is labor-intensive. The company manufactures products in both made-to-order
and made-to-stock modes. The cost of products, as presented in this study, represents the
unitary value of cost accrued for accounting purposes, following Brazilian legislation
(MARTINS et al. 2000).
In the 18-month period during implementation, no internal factors—such as
technology or the makeup of the team—or external factors—such as raw material price or
market oscillations or seasonality—were significant enough to change the expected result of

290
Operational impacts of lean manufacturing: the case of a consumer
goods industrial company
GEPROS. Gestão da Produção, Operações e Sistemas, v. 14, nº 4, p. 279 - 304, 2019.
the line’s transformation. The LM tools that were applied were therefore essential to the
results obtained.
4.1. Implementation guide of the company studied
LM implementation took place in the company studied in stages (preparation,
diagnosis, design and implementation), in which people who actively participated in the
implementation were selected. These people were the change agents and were divided into
work fronts (Figure 2). It focused on a sanitary napkin production line in Camaçari, with a
current production of 37,000 boxes and a sale of 50,000 boxes in the northeast region; the
current contribution margin is 8%, which can reach a maximum of 45% on the curve of the
plant’s development and maturity. The implementation lasted a total of 14 weeks, divided as
follows:
a. Preparation (1 week)
b. Diagnosis (2 weeks)
c. Design (1 week)
d. Implementation (10 weeks)
Figure 2 – Implementation phases carried out at the Company
Source: The authors (2019).
a. Preparation: In this stage, the teams are assembled, the work is planned, the
information is analyzed, communications are sent and doubts about the implementation are
cleared up.
b. Diagnosis: In this stage, the flow of materials and information is analyzed,
observations on the operation are taken into account, and the roles and responsibilities are

291
Operational impacts of lean manufacturing: the case of a consumer
goods industrial company
GEPROS. Gestão da Produção, Operações e Sistemas, v. 14, nº 4, p. 279 - 304, 2019.
presented, discussing incentives and performance management. Differences in the mindset
and skill of each employee directly involved at all levels are identified through discussions,
surveys and interviews. The current results are compared with the objectives, and milestones
are identified to measure and record the impacts.
c. Design: In this stage, the system is technically verified to meet future customer
needs, process efficiency, cost, quality and safety, workload and support structure, and actions
to improve the new method of working are identified.
d. Implementation: In this stage, the actions that were suggested during the
diagnosis and design phase are performed. Implementation plans are developed for each work
front, the actions are implemented, and the changes that were made are evaluated and
improved, in addition to operators on the production line being trained.
Some tools and tasks related to the LM methodology were implemented in this stage.
They were the following: 5S, TPM, Kanban, visual management, Kaizen, Gemba, SMED,
pull system, standardized work, quality at the source and communication. Figure 3 shows the
timeline of the phases of the implementation process.
Figure 3 – Timeline of implementation phases
Source: the authors (2019).
4.2. Comparison between benchmarks of LM implementation and practices used the
company
The evidence gathered here aims to contribute to the literature that establishes
operational performance advantages for companies that adopt LM. The objective is to
determine the company’s degree of adherence to best practices, in the process of
implementing LM in the production line. The premise is that a high degree of adherence can
bring benefits to the company, in the dimensions indicated in the literature review.

292
Operational impacts of lean manufacturing: the case of a consumer
goods industrial company
GEPROS. Gestão da Produção, Operações e Sistemas, v. 14, nº 4, p. 279 - 304, 2019.
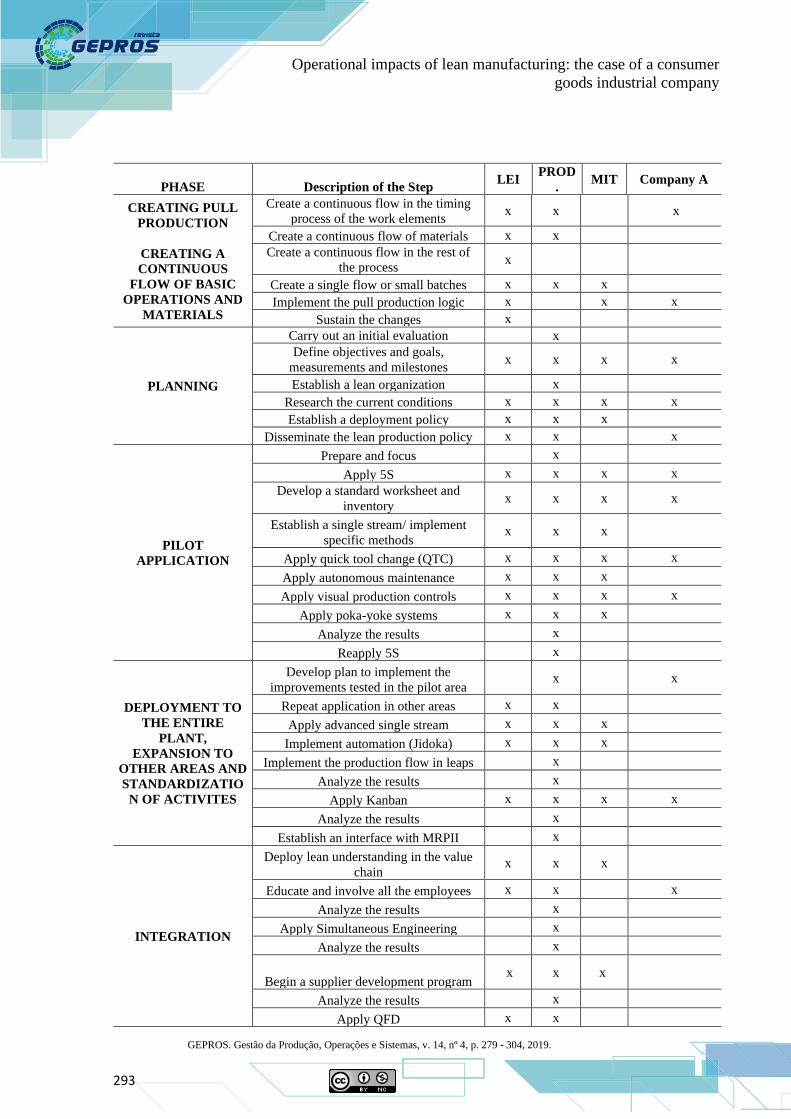
Table 1 shows a breakdown of the phases in all three implementation guides and
compares the guides’ practices, activities or recommendations with what was done at the
company studied. This table unifies the main and most relevant approaches to LM concepts
taken from the three guides. An “X” in the table signifies the presence of the practice in a
guide or at the company. The LM implementation stages, as show on table 1 below, were
defined in a discretionary way. The company did not follow a single model of LM
implementation. However, all three models (LEI, PROD and MIT) were used as benchmark
and were consulted during the planning stage. Table 1 thus presents the main concepts from
the LEI, Productivity Inc. (PROD) and MIT guides, as well as the concepts uses or applied at
the company studied (Company A).
Table 1 – Comparative table of implementation guides
PHASE Description of the Step LEI
PROD
. MIT Company A
VALUE STREAM
MAPPING
Develop an understanding of the key LM
concepts x x x x
Visualize the stream and locate losses x x x
Eliminate the losses x x x
Expand the value stream to the entire
business process x x x
Adapt management methods to the new
reality x x x
MODIFYING THE
SKILL OF THE
CHANGE AGENTS
Introduce lean production principles and
techniques throughout the company x x x x
Develop studies and applications that
show people the way x x x x
Obtain agreements, commitment,
cooperation and support x x
React productively to resistance x x
Focus Kaizen activities on the points of
greatest gain and impact x x x x
MANAGING
POLICIES
Define the company’s current needs and
priorities x x x x
Deploy strategic guidelines (Hoshim
Kamri) x x
Develop a master plan x x x
Share understanding and commitment x x
Establish a lean mindset x x x
Sustain a lean transformation x x x x
ACHIEVING BASIC
STABILITY
Identify losses that cause production line
stability problems x x
Implement TPM x x x x
Determine the annual capacity level x
Increase the stability of the value flow x
293
Operational impacts of lean manufacturing: the case of a consumer
goods industrial company
GEPROS. Gestão da Produção, Operações e Sistemas, v. 14, nº 4, p. 279 - 304, 2019.
PHASE Description of the Step LEI
PROD
. MIT Company A
CREATING PULL
PRODUCTION
CREATING A
CONTINUOUS
FLOW OF BASIC
OPERATIONS AND
MATERIALS
Create a continuous flow in the timing
process of the work elements x x x
Create a continuous flow of materials x x
Create a continuous flow in the rest of
the process x
Create a single flow or small batches x x x
Implement the pull production logic x x x
Sustain the changes x
PLANNING
Carry out an initial evaluation x
Define objectives and goals,
measurements and milestones x x x x
Establish a lean organization x
Research the current conditions x x x x
Establish a deployment policy x x x
Disseminate the lean production policy x x x
PILOT
APPLICATION
Prepare and focus x
Apply 5S x x x x
Develop a standard worksheet and
inventory x x x x
Establish a single stream/ implement
specific methods x x x
Apply quick tool change (QTC) x x x x
Apply autonomous maintenance x x x
Apply visual production controls x x x x
Apply poka-yoke systems x x x
Analyze the results x
Reapply 5S x
DEPLOYMENT TO
THE ENTIRE
PLANT,
EXPANSION TO
OTHER AREAS AND
STANDARDIZATIO
N OF ACTIVITES
Develop plan to implement the
improvements tested in the pilot area x x
Repeat application in other areas x x
Apply advanced single stream x x x
Implement automation (Jidoka) x x x
Implement the production flow in leaps x
Analyze the results x
Apply Kanban x x x x
Analyze the results x
Establish an interface with MRPII x
INTEGRATION
Deploy lean understanding in the value
chain x x x
Educate and involve all the employees x x x
Analyze the results x
Apply Simultaneous Engineering x
Analyze the results x
Begin a supplier development program x x x
Analyze the results x
Apply QFD x x

294
Operational impacts of lean manufacturing: the case of a consumer
goods industrial company
GEPROS. Gestão da Produção, Operações e Sistemas, v. 14, nº 4, p. 279 - 304, 2019.
PHASE Description of the Step LEI
PROD
. MIT Company A
Analyze the results x
Study the results and revise the strategies x
EXCELLENCE
Break paradigms x x x
Invest in R&D to find new methods and
technologies x x
Publish results x x x x
Celebrate success x x
SOURCE: Adapted from Productivity Inc. (2007); Massachusetts Institute of Technology (MIT), according to
Crabill et al. (2000); Lean Enterprise Institute (LEI) (2005).
The conditions for carrying out LM implementation depend on the particularities of
the company adopting this methodology (LEWIS, 2000); although the terminology of the
phases or stages are different in all the guides, there are many similarities in the application,
as the tools practically do not change.
After examining the comparative table, it can be concluded that the company’s
adherence to the three implementation guides is partial, but considerable. Of a total of 65
practices found in the three guides, the company followed 25 practices. Individually, the MIT
guide advocates 25 practices, the Productivity Inc. guide advocates 40 practices, and the LEI
guide advocates 55 practices. However, an analysis based only on the number of practices
adopted may not be very enlightening without some additional comments.
According to the implementation phases proposed by the guides and the company’s
model for implementing LM, some comparisons should be presented:
1. In all the guides presented, VSM is performed in a clear manner, becoming a
premise for implementation. However, the company studied does not show clarity at this
stage, which may become a limitation in the implementation.
2. The company studied does not apply any type of deployment of lean
understanding in the value stream, meaning that not all areas will be involved in the
implementation.
3. There is no supplier development program, resulting in difficulties in replacing
or purchasing parts and in developing improvements in conjunction with the company.
4. The guides suggest applying autonomous maintenance; this is one of the
fundamental pillars for successful implementation. However, the company studied is still at a
basic level on this subject.
295
Operational impacts of lean manufacturing: the case of a consumer
goods industrial company
GEPROS. Gestão da Produção, Operações e Sistemas, v. 14, nº 4, p. 279 - 304, 2019.
5. As positive points, there are similarities between the guides and the company
studied in the following topics: application of 5S, TPM, a focus on Kaizen activities,
application of visual controls, research on current conditions, Kanban, standard work, a focus
on teaching people the means, LM concepts, and sustainability of lean understanding.
It can therefore be concluded that LM implementation in the line studied was in
accordance with many of the practices recommended and suggested in the literature. The
company's effort is expected to be reflected in operational performance gains ( ZAWISLAK,
2015; ABDULMALEK; RAJGOPAL, 2007; MELTON, 2005; SHAH; WARD, 2003; BASU,
GOSH; DAN, 2018; SINGH, SINGH; SINGH, 2018; VINAYAGASUNDARAM;
KANNAN, 2015; KUMAR; KUMAR, 2015; NALLUSAMY, 2016; ZAWISLAK, 2015).
This analysis is performed below.
4.3. Critical analysis of the implementation
After collecting data through interviews—comprising a total of 20 interviews with 3
managers, 7 engineers and 10 production operators—the most important data regarding LM
implementation in the production line studied were compiled. The implementation team was
arranged as follows:
1 plant manager, 1 LM manager, 10 engineers (2 process, 4 continuous improvement,
3 maintenance and 1 production engineer), 1 HR analyst, 2 trainees, 1 level III operator and 1
material analyst.
In this context, 20% of respondents admitted that they did not know about or
understand the process of implementing LM in the plant as a whole. They did not know the
stages, or the start and end dates, or what the implementation activities were. With regard to
leadership, six out of ten production operators indicated that they should have had more
support, particularly in the application of LM tools. The leader’s attitude was also indicated in
the sense of the desire for immediate results. Forty percent of all respondents indicated a lack
of planning and business sustainability and stated that the result was more important for all
aspects, regardless of whether or not there was planning. Although there was no specific LM
training for management, the managers demonstrated full knowledge on the use of the tools to
be applied during LM implementation.
Regarding the use of LM methodology and tools, knowledge was superficial, and there
were many gaps. For example, 100% of respondents did not know how to identify/describe
296
Operational impacts of lean manufacturing: the case of a consumer
goods industrial company
GEPROS. Gestão da Produção, Operações e Sistemas, v. 14, nº 4, p. 279 - 304, 2019.
the value stream mapping (VSM) that was used during the implementation, which indicates a
fundamental failure in LM implementation. According to Rother and Shook (2003), value
stream is every action (adding value or not) necessary to bring a product across all the flows
essential to each manufactured product, provided it has manufacturing steps.
5S was a positive point, as 100% of respondents had full knowledge on the subject,
knew how to apply it and had positive experiences relating 5S to waste reduction.
With regard to the behavioral area, 30% of the operators interviewed admitted that
they felt pressure during the implementation to achieve the expected result and stated that any
other result was not acceptable.
Regarding safety, this was a positive point because 100% of respondents pointed to the
safety issue as their main value within the company. This demonstrated the top management's
commitment to the well-being of its employees at work.
4.4. Operational performance
This section will present the operational performance of the production line before and
after LM implementation, divided into four (4) large blocks of indicators.
a) Financial – Cost: considers the value of the product’s cost after manufacture.
b) Productivity – OEE indicator: a known indicator, used by the company, which
is calculated by the following expression: fraction of available operating time multiplied by
the efficiency index of the equipment and multiplied by the fraction of approved products
(Rama and Abraham, 1997).
c) Waste (expressed as production scrap): considers the quantity of products that
were to be produced in a given period divided by what was actually produced and approved.
d) Safety: measures the number of accidents or incidents at the plant.
Financial Results:
Table 2 shows the financial results, before and after the implementation process took
place in the factory.

297
Operational impacts of lean manufacturing: the case of a consumer
goods industrial company
GEPROS. Gestão da Produção, Operações e Sistemas, v. 14, nº 4, p. 279 - 304, 2019.
Table 2 – Financial results before and after implementation
7 months before implementation 7 months after implementation
Jan/14 Dec/14
80.2 65.3
Feb/14 Jan/15
59.1 50.2
Mar/14 Feb/15
51.8 48.1
Apr/14 Mar/15
61.2 49.3
May/14 Apr/15
47.7 46.4
Jun/14 May/15
50.4 35.1
Jul/14 Jun/15
50.1 39.6
Financial (unit cost)
Mean= 57.2 Mean=47.7
Unit: Brazilian Real; Source: The authors (2019).
The mean cost of the product seven months before implementation was R$ 57.2 per
1000 units produced; seven months after implementation, the mean was R$ 47.7 per 1000
units produced. In other words, after implementation, there was a gain of 19.9% (Table 2).
The cost of the product produced was reduced, demonstrating the effectiveness of the
implementation.
Figure 4 – Mean Cost of Product: Evolution during the two periods
Source: The authors (2019).
Figure 4 shows the evolution of cost during the two periods. The non-parametric Mann
Whitney test revealed that there is a statistically significant difference between the financial
results of the line before and after the LM implementation, with 95% confidence (U = 10; p
value = 0.03673).

298
Operational impacts of lean manufacturing: the case of a consumer
goods industrial company
GEPROS. Gestão da Produção, Operações e Sistemas, v. 14, nº 4, p. 279 - 304, 2019.
Productivity Results
Table 3 – Productivity result before and after implementation (OEE)
7 months before implementation 7 months after implementation
Jan/14 Dec/14
31.8% 45.6%
Feb/14 Jan/15
43.6% 51.8%
Mar/14 Feb/15
44.4% 47.6%
Apr/14 Mar/15
41.0% 48.6%
May/14 Apr/15
53.4% 69.7%
Jun/14 May/15
48.9% 62.8%
Jul/14 Jun/15
48.0% 71.5%
Productivity
Mean= 44.4 Mean=56.8
Unit: Percentage; Source: The authors (2019).
The mean OEE values during the seven months before implementation was 44.4%.
After seven months of implementation, the mean OEE values increased to 56.8%, resulting in
a productivity gain of 27.9% after implementation, proving the effectiveness of the
implementation (Table 3).
Figure 5 – Productivity: Evolution during the two periods
Source: The authors (2019).
Figure 5 shows the evolution of OEE values during the two periods. The non-
parametric Mann Whitney test revealed that there is a statistically significant difference
between the results of the line before and after LM implementation, with 95% confidence (U
= 9; p value = 0.02743).

299
Operational impacts of lean manufacturing: the case of a consumer
goods industrial company
GEPROS. Gestão da Produção, Operações e Sistemas, v. 14, nº 4, p. 279 - 304, 2019.
Waste Results
Table 4 – Waste results before and after implementation
7 months before implementation 7 months after implementation
Jan/14 Dec/14
17.8% 11.3%
Feb/14 Jan/15
16.8% 10.7%
Mar/14 Feb/15
14.9% 10.4%
Apr/14 Mar/15
15.5% 10.7%
May/14 Apr/15
11.5% 7.9%
Jun/14 May/15
11.7% 5.9%
Jul/14 Jun/15
11.6% 4.9%
Waste
Mean=14.25 Mean= 8.82
Unit: Percentage; Source: The authors (2019).
Table 4 indicates that the mean waste results seven months before implementation was
14.25%; after (seven) months of implementation, the mean was reduced to 8.82%. There was
thus a significant gain; that is, after implementation, the quantity of culled products decreased
by 61.2%, indicating the effectiveness of the implementation.
Figure 6 – Mean Waste fractions: Evolution during the two periods
Source: The authors (2019).
Figure 6 shows the evolution of mean waste values during the two periods. The non-
parametric Mann Whitney test revealed that there is a statistically significant difference
between the results of the line before and after LM implementation, with 95% confidence (U
= 0; p value = 0.00107).

300
Operational impacts of lean manufacturing: the case of a consumer
goods industrial company
GEPROS. Gestão da Produção, Operações e Sistemas, v. 14, nº 4, p. 279 - 304, 2019.
Safety Level Results (accidents or incidents at the plant)
Table 5 – Accidents and incidents before and after implementation
7 months before implementation 7 months after implementation
Jan/14 Dec/14
0 0
Feb/14 Jan/15
0 0
Mar/14 Feb/15
0 0
Apr/14 Mar/15
0 0
May/14 Apr/15
0 0
Jun/14 May/15
0 0
Jul/14 Jun/15
0 0
Safety
Mean=0 Mean= 0
Unit: Number of events; Source: The authors (2019).
The safety level (accidents and incidents at the plant), shown on table 5, was completely
stable after seven months of implementation, with no occurrences. Given the conditions under
which the company operates, this result was expected for the line.
6. CONCLUSIONS
This study analyzed and demonstrated the changes that occurred in operational
performance after implementing an LM system. The productivity, waste and cost indicators
had significant gains between the two periods analyzed, confirming that there were
indications of the positive impact of LM on the line investigated.
This work concisely corroborates and confirms the studies cited in the literature
review, which establish a direct relationship between LM implementation and operational
performance. The company studied follows some of the best practices found/suggested in the
literature regarding LM. The opportunities identified serve as a suggestion of future
improvements to be implemented in the company
The results of this study may be useful to academics interested in the impacts of LM
on operational performance and to managers who seek to understand implementation
practices for Lean concepts in industrial companies.

301
Operational impacts of lean manufacturing: the case of a consumer
goods industrial company
GEPROS. Gestão da Produção, Operações e Sistemas, v. 14, nº 4, p. 279 - 304, 2019.
Like any empirical study, this research has limitations. By being based on a single
case, it is not possible to generalize results, and the external validity is small. However, it was
found relatively strong evidence that the LM implementation had positive impacts on the
operational performance of the company. This study was also limited by the short amount of
time available for collecting data regarding the LM implementation, with the aim of
comparing operational performance before and after the process. One suggestion for future
studies is to use a large sample, with an online questionnaire, thus increasing the external
validity, which is limited in a case study.
REFERENCES
ABDULMALEK, F. A., RAJGOPAL, J. Analyzing the benefits of lean manufacturing and
value stream mapping via simulation: A process sector case study. International Journal of
production economics, v.107, n.1, p. 223-236, 2007.
ALAVI, S. The right way [lean manufacturing]. Manufacturing Engineer, v. 82, n.3, p.32-
35, 2003.
ANAND, G., KODALI, R. Development of a framework for lean manufacturing
systems. International Journal of Services and Operations Management, v. 5, n.5, p. 687-
716, 2009.
BAMBER, L., DALE, B. G. Lean production: a study of application in a traditional
manufacturing environment. Production planning & control, v.11, n.3, p.291-298, 2000.
BASU, P., GHOSH, I., DAN, P. K. Structural equation modelling based empirical analysis of
technical issues for lean manufacturing implementation in the Indian context. In:
INDUSTRIAL TECHNOLOGY AND MANAGEMENT. 2018. 7th. Anais…International
Conference on (pp. 57-61). IEEE, 2018.
BATTAGLIA, F., PICCHI, F., FERRO, J. R. Desenvolvimento Lean de produtos. Resumo
baseado nos Portugueses, 2006.
BOYER, M., SOVILLA, L. How to identify and remove the barriers for a successful lean
implementation. Journal of Ship Production, v.19, n.2, p.116-120, 2003.
BOWEN, H. K.; SPEAR, S. Decoding the DNA of the Toyota production system. Harvard
Business Review, 1999.
BOZDOGAN, K., MILAUSKAS, R., MIZE, J., NIGHTINGALE, D., TANEJA, A.,
TONASZUCK, D. Transitioning to a lean enterprise: a guide for leaders. Massachusetts
Institute of Technology, v 1., 2000.

302
Operational impacts of lean manufacturing: the case of a consumer
goods industrial company
GEPROS. Gestão da Produção, Operações e Sistemas, v. 14, nº 4, p. 279 - 304, 2019.
ČIARNIENĖ, R.; VIENAŽINDIENĖ, M. Lean manufacturing: theory and
practice. Economics and management, v.17, n.2, p.726-732, 2012.
CRABILL, J.; AIR, U. S.; GRUMMAN, N.; MEADOWS, D.; MILLER, C.; PRATT, B. S.
Production Operations Level Transition-To-Lean Roadmap. Production Operations
Transition-To-Lean Team, 2000.
DETTY, R. B.; YINGLING, J. C. Quantifying benefits of conversion to lean manufacturing
with discrete event simulation: a case study. International Journal of Production
Research, v.38, n.2, p. 429-445, 2000.
DUQUE, D. F.; RIVERA CADAVID, L. Lean manufacturing measurement: the relationship
between lean activities and lean metrics. Estudios gerenciales, v.23, n.105, p. 69-83, 2007.
EMILIANI, M. L. Origins of lean management in America: the role of Connecticut
businesses. Journal of management History, v.12, n.2, p. 167-184, 2006.
KARLSSON, C.; ÅHLSTRÖM, P. A lean and global smaller firm? International Journal
of Operations & Production Management, v. 17, n.10, p. 940-952, 1997.
KUMAR, R..; KUMAR, V. Lean manufacturing in Indian context: A survey. Management
Science Letters, v.5, n.4, p. 321-330, 2015.
LEI - LEAN ENTERPRISE INSTITUTE. 2005. “Lean Roadmap.” Disponível em:
http://www.lean.org.br/Events/LeanRoadMap.cfm. Acesso em 12 Set 2017.
LIKER, J.; MEIER, D. O Modelo Toyota: Campo de Aplicação [The Toyota Way
Fieldbook]. Ed. Bookman, Porto Alegre. Portuguese., 2007.
MARTÍNEZ SÁNCHEZ, A.; PÉREZ PÉREZ, M. Lean indicators and manufacturing
strategies. International Journal of Operations & Production Management, v. 21, n. 11,
p.1433-1452, 2001.
MARTINS, E.; GELBCKE, E. R.; IUDÍCIBUS, S. D. Manual de contabilidade das
sociedades por ações. São Paulo: Atlas, 2000.
MASKELL, B. H.; BAGGALEY, B.; GRASSO, L. Practical lean accounting: a proven
system for measuring and managing the lean enterprise. CRC Press, 2011.
MELTON, T. The benefits of lean manufacturing: what lean thinking has to offer the process
industries. Chemical engineering research and design, v. 83, n.6, p. 662-673, 2005.
NALLUSAMY, S. Frequency analysis of lean manufacturing system by different critical
issues in Indian automotive industries. International Journal of Engineering Research in
Africa, v. 23, p. 181-187, 2016.

303
Operational impacts of lean manufacturing: the case of a consumer
goods industrial company
GEPROS. Gestão da Produção, Operações e Sistemas, v. 14, nº 4, p. 279 - 304, 2019.
NOGUEIRA, M. D. G. S. Proposta de método para avaliação de desempenho de práticas
da produção enxuta-ADPPE. 116f. 2007. Dissertação (mestrado em engenharia de
produção) – Universidade Federal do Rio Grande do Sul, Porto Alegre, RS, 2007.
NONAKA, I.; TAKEUCHI, H. Criação de conhecimento na empresa. Elsevier Brasil,
2004.
OHNO, T. O sistema Toyota de produção além da produção. Bookman, SP, 1997.
PARKS, C. M. Instill lean thinking. Industrial Management, v.44, n.5, p. 14-14, 2002.
PASA, G. S. Uma abordagem para avaliar a consistência teórica de sistemas produtivos.
188f. 2004. Tese (Doutorado em engenharia de produção) – Universidade Federal do Rio
Grande do Sul, Porto Alegre, RS, 2004.
PATEL, J. S.; PATANGE, G. S. A Review on Benefits of Implementing Lean
Manufacturing. International Journal of Scientific Research in Science and Technology,
v. 3, p. 249-252, 2017.
PRODUCTIVITY INC. Lean Production Implementation Roadmap: A Guide for the
Lean Journey. Disponível em:
http://www.advancedmanufacturing.com/January00/pdf/leanroadmap. Acesso em 02 mar
2017.
RADNOR, Z.; WALLEY, P. Learning to walk before we try to run: adapting lean for the
public sector. Public money and management, v.28, n.1, p. 13-20, 2008.
ROTHER, M.; SHOOK, J. Aprendendo a enxergar. São Paulo: Lean Institute Brasil, 2003.
SAHIN, F. Manufacturing competitiveness: Different systems to achieve the same
results. Production and Inventory Management Journal, v.41, n.1, p. 56, 2000.
SHAH, R.; WARD, P. T. Lean manufacturing: context, practice bundles, and
performance. Journal of operations management, v. 21, n.2, p. 129-149, 2003.
SINGH, J.; SINGH, H.; SINGH, G. Productivity improvement using lean manufacturing in
manufacturing industry of Northern India: A case study. International Journal of
Productivity and Performance Management, v.67 n. 8, p. 1394-1415, 2018.
SORIANO-MEIER, H.; FORRESTER, P. L. A model for evaluating the degree of leanness of
manufacturing firms. Integrated Manufacturing Systems, v. 13, n.2, p. 104-109, 2002.
SUNDAR, R.; BALAJI, A. N.; KUMAR, R. S. A review on lean manufacturing
implementation techniques. Procedia Engineering, v. 97, p.1875-1885, 2014.

304
Operational impacts of lean manufacturing: the case of a consumer
goods industrial company
GEPROS. Gestão da Produção, Operações e Sistemas, v. 14, nº 4, p. 279 - 304, 2019.
TALEGHANI, M.; MOUSAVIAN, S. J. The role of total quality management in performance
improvement of new enterprises (Case study: Insurance industries of northern Iran). Journal
of Mechanical and Industrial Engineering Research, v.2, n.2, p.52, 2013.
VIENAZINDIENE, M.; CIARNIENE, R. Lean manufacturing implementation and progress
measurement. Economics and management, v.18, n. 2, p. 366-373, 2013.
VINAYAGASUNDARAM, M. R.; KANNAN, V. Implementation of Lean manufacturing
practices and its impact on productivity in Coimbatore foundries. International Journal of
Modern Engineering Research, v.5, n.5, 2015.
WHEELWRIGHT, S. C. Reflecting corporate strategy in manufacturing decisions. Business
horizons, v.21, n.1, p.57-66, 1978.
WOMACK, J. P.; JONES, D. T.; ROOS, D. Machine that changed the world. Simon and
Schuster, 1990.
YIN, R. K. Case study research: design and methods. Thousand Oaks, CA, 1994.
ZAWISLAK, P. A. Apresentação à edição brasileira [Introduction to the Brazilian
edition]. IN: Tidd, J.; Bessant, J.; Pavitt, K. Gestão da inovação [Innovation management].
Porto Alegre: Bookman, 2015.