operating update third quarter 2013 - green river energygreenriver-energy.com/pdf-files/newfield...
TRANSCRIPT

Operating Update – Third Quarter 2013 November 4, 2013
@NFX is periodically published to keep stockholders aware of current operating activities at Newfield. It may include estimates of expected production volumes, costs and expenses, recent changes to hedging positions and commodity pricing.
TABLE OF CONTENTS
Operating Highlights 2
Anadarko Basin 4
Uinta Basin 16
Williston Basin 19
Eagle Ford 20
Guidance 21
Hedge Summaries 23

2
OPERATING HIGHLIGHTS:
� 3Q13 domestic liquids production increased 9% over 2Q13. Liquids comprised about half of 3Q13 domestic production.
� Announced NEW “STACK” play. 3Q13 average net production from the Anadarko Basin was up 5,000 BOEPD over 2Q13 and averaged 22,200 BOEPD. 2013e net production in the Anadarko Basin was raised to 7.3 MMBOE.
� YTD SXL well costs in the Williston Basin average $8.7 million gross, including ~$0.8 million in facilities and artificial lift. Total 2013e production in the Williston moved higher to 4.4 MMBOE, up more than 40% Y-o-Y.
� Eagle Ford SXL (7,500’) well costs YTD are $7.3 million gross, including ~$0.3 million in facilities. Recent SXL completions will contribute to 12,200 BOEPD avg. for 4Q13.
� Record well in the Uinta Basin -- Patterson Wasatch XL (3,200’ lateral) well IPs at more than 2,200 BOEPD gross. The first Wasatch SXL will spud in 4Q13. Recent SXL wells in Uteland Butte IP at nearly 1,700 BOEPD gross. Uinta Basin expected to produce 8.4 MMBOE in 2013, up 8% Y-o-Y.
� Signed agreement to sell Malaysian business for $898 million with expected closing in early 2014.
NET AVG. PRODUCTION BY REGION (BOEPD)
2Q13 3Q13
Rockies 34,380 36,500
Mid-Cont. 60,220 60,850
Gulf Coast 15,050 15,380
Int’l 19,840 18,140
TOTAL 129,490 130,870
OPERATED RIGS BY AREA
2Q13 3Q13
Uinta 6 6
Anadarko 7 7
Williston 4 4
Eagle Ford 2 1
TOTAL 19 18
PRODUCTION, CAPITAL AND LIQUIDITY:
2013 estimated net production increased for second time this year to approximately 48 MMBOE (previous guidance 46 – 47 MMBOE).
2013 capital investments to total about $2 billion including the previously announced Anadarko Basin acquisition and excluding capitalized internal costs. In 3Q13, we invested $584 million ($431 million in continuing operations, $62 million in acquisitions and $91 million in discontinued operations).
At September 30, 2013, we had an outstanding balance of $440 million on our $1.4 billion credit facility.
Following Board of Directors’ approval, we plan to provide 2014-16 guidance before year-end 2013. Newfield today reiterated its corporate level growth and capital investment forecasts disclosed in its current “three-year plan” (2013-15), which was issued in February 2013.

0
20
40
60
80
100
120
1Q12* 2Q12* 3Q12* 4Q12* 1Q13 2Q13 3Q13 4Q13e 1Q14e 2Q14e 2H14e 2015e
MB
OEP
D (n
et)
Eagle Ford
Williston
Anadarko**
Uinta
3
*Excludes Production from Assets Sold
**Includes SCOOP and STACK; Excludes Granite Wash
100
37
76.4
50.9 59.0
NET AVG. PRODUCTION BY AREA (BOEPD)
2Q13 3Q13 4Q13e
Uinta 22,500 23,100 24,900
Anadarko** 17,200 22,200 25,800
Williston 11,800 13,400 13,500
Eagle Ford 7,500 8,200 12,200
TOTAL 59,000 66,900 76,400
66.9
>80.0
2014-16 production and capital guidance
by area to be disclosed before
YE13, following Board approval
“In February 2013, we presented a three-year plan. Today, we have year one largely behind us and we have even greater confidence in our ability to hit our corporate level targets. In doing so, we intend to double liquids production from our four key plays by the end of 2015.”
-- Lee K. Boothby

N E W F IELD E X PLORAT ION C O M PA NY ( N Y S E:N FX) 4
GROWTH
EXECUTION INVENTORY
FAVORABLE
ENVIRONMENT
� Proven operating team � Track record of value creation � More than a decade of
experience in Oklahoma
� >225,000 net acres � Multiple pay horizons � Decade-plus of drilling
inventory
� ~175% YoY production growth � 2012-15 prod. CAGR: 88% � Extensive resource & inventory
� Existing field infrastructure � Attractive commodity markets � Reasonable regulatory
environment

� It is a “new” oil resource play
� STACK combines the Meramec and Woodford Shales
� Meramec is 275’ – 475’ thick
� We are developing ~700’ of oil saturated column
� >225,000 net acres in the Anadarko Basin
� It combines multiple, “stacked” geologic horizons
� We have more than 170,000 net acres prospective for the Woodford
� We have more than 150,000 net acres prospective for the Meramec
� It provides compelling economics today… and room for efficiency improvements
� EUR range: 800 – 1,000 MBOE/well
� 70% Liquids (40% oil)
� >35% ROR*
5 * $90 oil / $3.50 Gas

6
Legacy NFX Acreage
Recent Acreage Acquisition
Woodford Plays
Meramec Play
>225,000 total net acres: � >170,000 net acres prospective for
the Woodford � >150,000 net acres prospective for
the Meramec
TX
OK
SCOOP 75,000 net acres
STACK >150,000 net acres

7
STACK Meramec STACK Woodford SCOOP Woodford
Thickness 275-475’ 200-300’ 225-350’
Porosity 3-6% 3-7% 3-10%
CHESTER SHALE
(Regional Topseal)
SYCAMORE
MERAMEC
Upper
Lower
OSAGE
WOODFORD SHALE – Source Rock
STACK SCOOP
~ 700
’ of O
il Sa
turated Interval
HUNTON
STACK � Proved concept � Tested SXL wells in
Woodford & Upper Meramec
2014 STACK Plan � Assess
― Lower Meramec ― Development spacing ― Completion optimization
� HBP Acreage
Tested Horizons
North South

0
10
20
30
40
50
MB
OEP
D (n
et)
NET AVG. QUARTERLY PRODUCTION (BOEPD)
3Q13 4Q13e 1Q14e
Oil 5,500 6,600 7,600
Gas 10,200 11,700 14,500
NGLs 6,500 7,500 9,400
Total 22,200 25,800 31,500
8
*Includes SCOOP and STACK; Excludes Granite Wash

Operated Results YTD: � 7 producing wells (avg. 93% WI) � 900 BOEPD IP (83% Oil) � 597 BOEPD avg. 90-day rate (74% Oil)
Play Type WI% Gross Perforated Interval (ft)
IP-24hr BOEPD*
30-Day Avg. BOEPD*
60-Day Avg. BOEPD*
Klade Woodford 99% 10,292 1,000 657 521
Brueggen Woodford 99% 10,272 926 556 646
Merveldt Woodford 82% 9,904 637 546 -
Okarche Woodford 88% 10,217 995 795 -
Kretchmar Meramec 100% 9,930 1,054 788 742
Bredel Meramec 94% 10,018 1,137 746 606
Kremeier Meramec 92% 10,175 549 392 -
AVERAGE 93% 10,115 900 640 629
* Gross Wellhead Production
9
Kretchmar 1H-2W 1054 IP BOEPD (79% Oil)
Bredel 1H-5X 1137 BOEPD (71% Oil)
Kremeier 1H-18X 549 BOEPD (95% Oil)
NFX Wells
Merveldt 1H-24X 637 BOEPD (68% Oil)
Okarche 1H-12X 995 BOEPD (84% Oil)
Klade 1H-3X 1000 BOEPD (90% Oil)
Brueggen 1H-2X 926 BOEPD (91% Oil)

10
Depth (ft) 8,000 – 11,000 Lateral Length (ft) >9,000
2013 Average Working Interest, Play Avg. 94%, 59% 2013 Average Net Revenue Interest, Play Avg. 76%, 48%
Gross Development Well Cost (MM$) $9 - 13 Operated Drilling Program
(Wells TD'd) 2013e 8
EUR Split Oil ~40%
NGL ~30% Gas ~30%
Economics ROR >35% Development EUR (MBOE) 800-1,000
ECONOMIC ASSUMPTIONS LOE/Well/Month $9,800/well/month Tax (% of revenue) 1% for 48 months, 7% thereafter Fuel Gas 6%
Realized Prices*: Oil (% WTI) 95%
Gas (% HH) 80% NGLs (% WTI) 35%
Assumes $90/Bbl and $3.50/MMbtu * Includes Gathering and Transportation 0
100
200
300
400
500
600
700
800
0 200 400 600
BO
EP
D
Days Online
Development Type Curve
STACK Oil (>9,000')

11
0
100
200
300
400
500
600
700
800
0 200 400 600
BO
EPD
Days Online
Type Curve (>9,000')
Actuals
STACK (7 wells)

Play Type WI% GPI IP-24hr BOEPD*
30-Day Avg.
BOEPD*
60-Day Avg. BOEPD*
Tina Oil 99% 10,153 1,855 1,305 1,508
Boles Oil 79% 8,008 1,910 1,466 1,341
Campbell Oil 90% 9,859 1,431 1,063 1,174
Floyd Oil 65% 10,132 1,068 737 674
Hunter Oil 76% 10,170 1,589 1,023 1,162
Sublette Oil 50% 4,904 1,081 905 833
Williams Oil 75% 9,672 1,645 - -
AVERAGE 76% 8,985 1,511 1,083 1,115
* Gross Wellhead Production
12
Tina 1H-26X 1855 BOEPD (47% Oil)
Campbell 1H-36X 1431 BOEPD (56% Oil)
Floyd 1H-3X 1068 BOEPD (39% Oil)
Hunter 1H-13X 1589 BOEPD (60% Oil)
Boles 1H-14X 1910 BOEPD (57% Oil)
Williams 1H-7X 1645 BOEPD (68% Oil)
Sublette 1H-22 1081 BOEPD (52% Oil)
Highlights: � ~45,000 net acres in Woodford oil � Move to pad drilling in 2014 � Recent wells outperforming type curve
Operated Results YTD: � 7 producing wells (avg. 76% WI) � 1,511 BOEPD IP (55% Oil) � 1,194 BOEPD avg. 90-day rate (48%
Oil)
NFX Best in Class: � Boles 1H-14X (79% WI)
� Drilled in 38 days (8,000’ SXL) � 6 month payout

Jo Ann 1H-18 1231 BOEPD (11% Oil)
Wilson 1H-3 1168 BOEPD (22% Oil)
Casados 1H-21X 2127 BOEPD (19% Oil)
Branch Pilot 5 New Wells
10,750 BOEPD (25% Oil)
Mashburn 1H-33 1444 BOEPD (33% Oil)
Play Type WI% GPI IP-24hr BOEPD*
30-Day Avg. BOEPD*
60-Day Avg. BOEPD*
Casados Wet Gas 59% 6,698 2,127 1,795 1,875
Wilson Wet Gas 57% 4,879 1,168 786 922
Mashburn Wet Gas 55% 4,886 1,444 537 846
Gregory Wet Gas 39% 4,879 1,688 1,195 1,216
Jo Ann Wet Gas 39% 4,894 1,231 995 1,078
Branch Infills** Wet Gas 89% 7,115 2,150 1,567 1,661
AVERAGE 68% 6,181 1,841 1,314 1,424
* Gross Wellhead Production
** Average of 5 infill wells
13
Gregory 1H-28 1688 BOEPD (35% Oil)
Highlights: � ~30,000 net acres in Woodford Wet Gas � Active pad development � Improved results by reducing perforation
cluster spacing (<75’)
Operated Results YTD: � 10 producing wells (avg. 68% WI) � 1,841 BOEPD avg. IP (34% Oil) � 1,232 BOEPD avg. 90-day rate (22% Oil)
NFX Best in Class: � Gregory 5H-28 (39% WI)
� Drilled in 26 days (4,900’ Lateral)

14
0
200
400
600
800
1000
1200
1400
1600
0 200 400 600
BO
EP
D
Days Online
SCOOP Wet Gas (6,150')
SCOOP Oil (>9,000')
Development Type Curves
SCOOP Wet Gas SCOOP Oil Depth (ft) 14,000 – 16,000 12,000 – 14,000
Lateral Length (ft) 5,000 – 7,500 >9,000 2013 Average Working Interest, Play Avg. 66%, 27% 91%, 47%
2013 Average Net Revenue Interest, Play Avg. 53%, 22% 74%, 38% Total Gross Development Well Cost (MM$) $9 - 11 $11 - 13
LOE ($/Well/Month) $3,800 $9,800
Operated Drilling Program (Wells TD'd)
2012 13 6 2013e 29 7
EUR Split Oil 6% 46%
NGL 44% 29% Gas 50% 26%
Economics ROR >50% >50% Development EUR (MBOE) 2,000 - 2,400 900 - 1,100
ECONOMIC ASSUMPTIONS LOE/Well/Month (Above) Tax (% of revenue) 1% for 48 months, 7% thereafter Fuel Gas 6%
Realized Prices*: Oil (% WTI) 95%
Gas (% HH) 80% NGLs (% WTI) 35%
Assumes $90/Bbl and $3.50/MMbtu * Includes Gathering and Transportation

Wet Gas Type Curve (6,150’) Wet Gas Actuals (6,326’)
Oil Type Curve (>9,000’) Oil Actuals (8,300’)
15
0
400
800
1200
1600
2000
0 200 400 600
BO
EP
D
Days Online
SCOOP Wet Gas (10 wells)
0
400
800
1200
1600
2000
0 200 400 600
BO
EP
D
Days Online
SCOOP Oil (7 Wells)
16
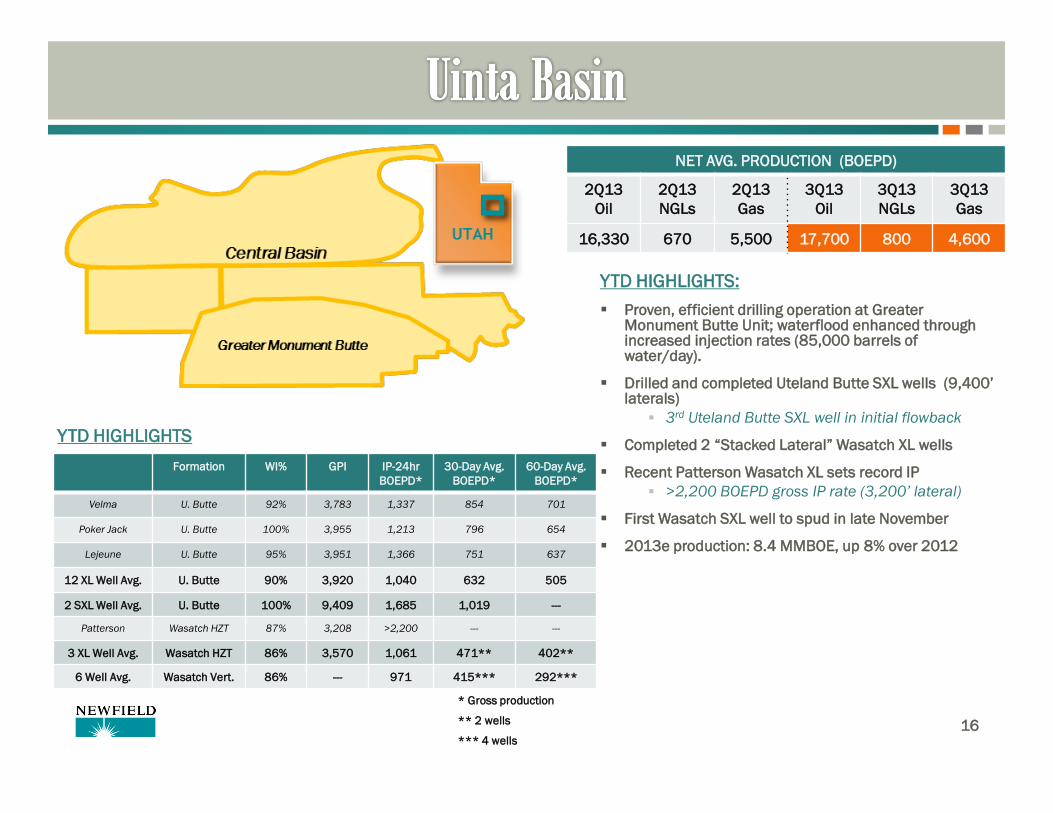
NET AVG. PRODUCTION (BOEPD)
2Q13 Oil
2Q13 NGLs
2Q13 Gas
3Q13 Oil
3Q13 NGLs
3Q13 Gas
16,330 670 5,500 17,700 800 4,600
YTD HIGHLIGHTS
Formation WI% GPI IP-24hr BOEPD*
30-Day Avg. BOEPD*
60-Day Avg. BOEPD*
Velma U. Butte 92% 3,783 1,337 854 701
Poker Jack U. Butte 100% 3,955 1,213 796 654
Lejeune U. Butte 95% 3,951 1,366 751 637
12 XL Well Avg. U. Butte 90% 3,920 1,040 632 505
2 SXL Well Avg. U. Butte 100% 9,409 1,685 1,019 ---
Patterson Wasatch HZT 87% 3,208 >2,200 --- ---
3 XL Well Avg. Wasatch HZT 86% 3,570 1,061 471** 402**
6 Well Avg. Wasatch Vert. 86% --- 971 415*** 292***
YTD HIGHLIGHTS:
� Proven, efficient drilling operation at Greater Monument Butte Unit; waterflood enhanced through increased injection rates (85,000 barrels of water/day).
� Drilled and completed Uteland Butte SXL wells (9,400’ laterals)
� 3rd Uteland Butte SXL well in initial flowback
� Completed 2 “Stacked Lateral” Wasatch XL wells
� Recent Patterson Wasatch XL sets record IP � >2,200 BOEPD gross IP rate (3,200’ lateral)
� First Wasatch SXL well to spud in late November
� 2013e production: 8.4 MMBOE, up 8% over 2012
* Gross production
** 2 wells
*** 4 wells

17
-
100,000
200,000
300,000
400,000
500,000
600,000
700,000
800,000
900,000
1,000,000
To
tal
Gro
ss S
tora
ge
Le
ve
l, B
bls
TOTAL CLOSING STORAGE w/o RAIL OPTIMAL STORAGE LEVEL MAXIMUM STORAGE LEVEL TOTAL CLOSING STORAGE w/ RAIL
� 2Q13 rail option allowed us to manage the impact of scheduled refinery turnaround
� Additional scheduled refinery turnarounds now planned for 2015
� Timing of additional refinery expansion uncertain
Unscheduled refinery downtime
Unscheduled refinery downtime Scheduled refinery turnaround
Moved >250,000 barrels via rail

18
150’
250’
425’
325’
250’
1 Mile
Red Beds
Uteland Butte
Wasatch WSTC 10 HZ TARGET
WSTC 15 HZ TARGET
WSTC 28 HZ TARGET
WSTC 30+ HZ TARGET 1,40
0’ -
Oil
Satu
rate
d Sa
ndst
ones
, Dol
omite
s, &
Lim
esto
nes
UB HZ TARGET
Central Basin drilling inventory is extensive and expanding

19
YTD WELLS
NET AVG. PRODUCTION (BOEPD)
2Q13 Oil
2Q13 NGLs
2Q13 Gas
3Q13 Oil
3Q13 NGLs
3Q13 Gas
9,100 1,000 1,700 9,900 1,200 2,300
Formation WI% GPI IP-24hr BOEPD*
30-Day Avg. BOEPD*
60-Day Avg. BOEPD*
24 SXL Well Avg. Bakken 61% 9,904 2,267 848 711
4 XL Well Avg. Bakken 59% 4,023 2,173 677 463
6 SXL Well Avg. Three Forks 51% 9,341 1,934 674 614
YTD HIGHLIGHTS:
� Gross completed well costs YTD in the Williston are $8.7 MM, including $0.8 MM in facilities and artificial lift.
� “Best-in-class” Johnsrud 2-H (10,000’ lateral) was drilled to TD in 18 days
� 4 operated rigs running. Program dominated by multi-well pads and SXL wells
� 3Q13 production exceeds guidance by 1,600 BOEPD due to better well performance
� Total 2013e production now 4.4 MMBOE � Raised 2013e Y-o-Y production growth to 40%
compared to original estimate of 15%
� In 3Q13, we successfully tested the 2nd bench of the Three Forks
� Gross initial production 1,729 BOEPD � 30-day gross average of 620 BOEPD � Continued assessment planned � Potential to expand development inventory
* Gross Production

20
NET AVG. PRODUCTION (BOEPD)
2Q13 Oil
2Q13 NGLs
2Q13 Gas
3Q13 Oil
3Q13 NGLs
3Q13 Gas
4,100 1,600 1,800 4,600 1,600 2,000
YTD HIGHLIGHTS
YTD HIGHLIGHTS:
We are actively developing West Asherton, located in Dimmit County, Texas.
� 26 wells drilled YTD in West Asherton
� SXLs from common pads lower costs, improve returns
� Average YTD well costs: $7.3 million (7,500’ laterals)
� 2013e net production: 3.0 MMBOE, up ~70% Y-o-Y
* Gross Production
** 19 wells
*** 6 wells
Formation WI% GPI IP-24hr BOEPD*
30-Day Avg. BOEPD*
60-Day Avg. BOEPD*
23 SXL Well Avg. Eagle Ford 100% 8,735 632 549** 652***
3 XL Well Avg. Eagle Ford 100% 4,949 404 310 --

21
2012* 2013e 2014e** 2015e**
Domestic Production:
Oil (MMBO) 11.1 14.0 16.8 - 19.0 20.6 - 25.3
NGLs (MMBbls) 2.3 5.2 7.2 - 8.0 6.9 - 8.5
Natural Gas (BCF) 140 125 114 - 132 112 - 136
Domestic Total (MMBOE) 36.8 40.0 43.0 – 49.0 46.0 – 57.0
YoY Domestic Liquids Growth 27% 43% 38% 20%
YoY Domestic Gas Growth (7%) (11%) 1% --%
YoY Domestic Total Growth 3% 9% 18% 12%
International Production:
Oil (MMBO) 9.9 8.0
Natural Gas (BCF) 1.2 0.0
International Total (MMBOE): 10.1 8.0
Total Production (MMBOE): 46.9 48.0 * Excludes production from assets sold ** We intend to issue our 2014-16 guidance before year-end, following Board of Directors’ approval
Denotes update

22
4Q Domestic 4Q Int’l*
Operating Expenses:
Recurring LOE (per BOE): $5.40 $16.90
Major Expense (per BOE): $2.20 $5.30
Transportation (per BOE): $3.60 ---
Total LOE (per BOE) $11.20 $22.20
Production & Other Taxes (per BOE): $2.70 $26.20
DD&A Expense (per BOE): $17.90 $32.00
General & Administration (G&A), net (per BOE): $5.75** $2.10
Capitalized Internal Costs (per BOE): ($2.90) ($6.25)
Interest Expense (per BOE): $4.95 ---
Capitalized Interest (per BOE): ($1.15) ---
Effective Tax Rate: 36% 75%
Assumptions for 4Q13: WTI $102.57/Bbl and HH $3.64/MMbtu
*Our cost and expense guidance is shown on a unit of production basis. Note that the information is presented SEPARATELY for our domestic and international businesses. Our international operations are considered as “discontinued operations” and their financial results will be shown separately on the income statement.
** The increase in fourth quarter estimated G&A expense is primarily related to a compensation program for substantially all domestic, non-executive employees. See Note 11 in Newfield’s Form 10-Q, Stock-Based Compensation: “Stockholder Value Appreciation Program”.

23
Volume/day Weighted-Average Price
Period Bbls Swaps Swaps w/ Short
Puts2 Collars
Collars w/ Short
Puts1
4Q 2013
2,300 10,000 27,700
$91.10 — —
— $75/97.49 —
— — —
— —
$80/95-$115.59
1Q 2014 15,000 16,000 6,000
$89.60 — —
— $75/95.16 —
— — —
— —
$75.83/90.83-$102.93
2Q 2014 19,000 16,000 6,000
$90.07 — —
— $75/95.16 —
— — —
— —
$75.83/90.83-$102.93
3Q 2014 21,000 16,000 6,000
$89.86 — —
— $75/95.16 —
— — —
— —
$75.83/90.83-$102.93
4Q 2014 23,000 16,000 6,000
$89.95 — —
— $75/95.16 —
— — —
— —
$75.83/90.83-$102.93
1Q 2015 19,000 7,000
$90.37 —
— $66.43/90.05
— —
— —
2Q 2015 19,000 7,000
$90.37 —
— $66.43/90.05
— —
— —
3Q 2015 17,000 10,000
$90.41 —
— $66.60/90.04
— —
— —
4Q 2015 17,000 10,000
$90.41 —
— $66.60/90.04
— —
— —
1 Below $80.00 per Bbl in Q4 2013 and below $75.83 per Bbl in 2014, these contracts effectively result in realized prices that are on average $15.00 per Bbl higher than the cash price that otherwise would have been realized. 2 Below $75.00 per Bbl in Q4 2013 and in 2014, these contracts effectively result in realized prices that are on average $22.49 and $20.16 per Bbl higher, respectively, than the cash price that otherwise would have been realized. Below $66.43 per Bbl for 1H 2015 and $66.60 per Bbl for 2H 2015, these contracts effectively result in realized prices that are on average $23.62 and $23.44 per Bbl higher, respectively, than the cash price that otherwise would have been realized. Note: We have entered into swaption contracts that would potentially hedge 1,460 MBbls of Cal15 production at a weighted-average swap price of $90.00 if exercised on their expiration date of November 29, 2013. Any future potential settlement value will be excluded herein unless and until the swaptions are exercised.

24
Oil Prices
Period $70 $80 $90 $100 $110
4Q 2013 $63 $57 $20 ($4) ($19)
1Q 2014 $64 $41 $7 ($21) ($53)
2Q 2014 $72 $46 $8 ($24) ($61)
3Q 2014 $76 $47 $8 ($27) ($65)
4Q 2014 $80 $49 $8 ($28) ($69)
1Q 2015 $48 $24 $1 ($23) ($46)
2Q 2015 $48 $24 $ - ($23) ($47)
3Q 2015 $50 $25 $1 ($24) ($49)
4Q 2015 $50 $26 $1 ($24) ($49)
The following table details the expected impact to pre-tax income (in millions, except prices) from the settlement of our derivative contracts, outlined on the previous slide, at various NYMEX oil prices.

25
Volume/day Weighted-Average Price
Period MMBtus Swaps Swaps w/ Short
Puts Collars
Collars w/ Short
Puts
4Q 2013 223,600 75,0002
$4.341 —
— —
— —
— $3.00/3.75 - $4.75
1Q 2014 235,000 65,000
$3.98 —
— —
— $3.75 - $4.62
— —
2Q 2014 235,000 65,000
$3.98 —
— —
— $3.75 - $4.62
— —
3Q 2014 235,000 65,000
$3.98 —
— —
— $3.75 - $4.62
— —
4Q 2014 235,000 65,000
$3.98 —
— —
— $3.75 - $4.62
— —
1Q 2015 135,000 105,000
$4.28 —
— —
— $3.93 - $4.74
— —
2Q 2015 135,000 105,000
$4.28 —
— —
— $3.93 - $4.74
— —
3Q 2015 135,000 105,000
$4.28 —
— —
— $3.93 - $4.74
— —
4Q 2015 135,000 105,000
$4.28 —
— —
— $3.93 - $4.74
— —
1 This weighted-average fixed price represents the resultant hedge position, which is a combination of the put spread in our 3-way collar contracts and our fixed price swap contracts. 2 These weighted-average collar prices for the respective period represent contracts for November and December 2013 only.

26
Gas Prices
Period $2 $3 $4 $5
4Q 2013 $52 $31 $5 ($23)
1Q 2014 $52 $25 $ - ($24)
2Q 2014 $53 $25 $ - ($24)
3Q 2014 $53 $26 ($1) ($25)
4Q 2014 $53 $26 ($1) ($24)
1Q 2015 $46 $24 $3 ($11)
2Q 2015 $46 $25 $3 ($11)
3Q 2015 $47 $25 $4 ($12)
4Q 2015 $47 $25 $4 ($12)
The following table details the expected impact to pre-tax income (in millions, except prices) from the settlement of our derivative contracts, outlined on the previous slide, at various NYMEX gas prices.

27
This presentation contains forward-looking statements within the meaning of Section 27A of the Securities Act of 1933, as amended, and Section 21E of the
Securities Exchange Act of 1934, as amended. The words “will”, “believe”, “intend”, “plan”, “expect” or other similar expressions are intended to identify
forward-looking statements. Other than historical facts included in this presentation, all information and statements, such as information regarding planned
capital expenditures, estimated reserves, estimated production targets, drilling and development plans, the timing of production, planned capital expenditures,
and other plans and objectives for future operations, are forward-looking statements. Although as of the date of this presentation Newfield believes that these
expectations are reasonable, this information is based upon assumptions and anticipated results that are subject to numerous uncertainties and risks. Actual
results may vary significantly from those anticipated due to many factors, including drilling results, commodity prices, industry conditions, the prices of goods
and services, the availability of drilling rigs and other support services, the availability of refining capacity for the crude oil Newfield produces in the Uinta Basin
in Utah, the availability of capital resources, labor conditions, severe weather conditions, governmental regulations and other operating risks. Please see
Newfield’s 2012 Annual Report on Form 10-K and subsequent Quarterly Reports on Form 10-Q filed with the U.S. Securities and Exchange Commission (SEC)
for a discussion of other factors that may cause actual results to vary. Unpredictable or unknown factors not discussed herein or in Newfield’s SEC filings could
also have material adverse effects on forward-looking statements. Readers are cautioned not to place undo reliance on forward-looking statements, which
speak only as of the date of this presentation. Unless legally required, Newfield undertakes no obligation to publicly update or revise any forward-looking
statements.
Cautionary Note to Investors – Effective January 1, 2010, the SEC permits oil and gas companies, in their filings with the SEC, to disclose only proved, probable
and possible reserves that meet the SEC’s definitions for such terms. Newfield may use terms in this presentation, such as “resources”, “net resources”, “net
discovered resources”, “net risked resources”, “net lower-risked captured resources”, “net risked captured resources”, “gross resources”, “gross resource
potential”, “gross unrisked resource potential”, “gross unrisked resources”, and similar terms that the SEC’s guidelines strictly prohibit in SEC filings. Investors
are urged to consider closely the oil and gas disclosures in Newfield’s 2012 Annual Report on Form 10-K, available at www.newfield.com, www.sec.gov or by
writing Newfield at 4 Waterway Square Place, Suite 100, The Woodlands, Texas 77380 Attn: Investor Relations.
Forward Looking Statements and Related Matters