martin capital - third quarter 2013
TRANSCRIPT

8/14/2019 Martin Capital - Third Quarter 2013
http://slidepdf.com/reader/full/martin-capital-third-quarter-2013 1/10
October 2013
Macro-Agnosticism & the ‘Invisi-Bubble’
Bubble Anatomy/Bubble Anomaly
Market bubbles are called bubbles for good reason.
They form, they inflate, they grow to an unstablydistorted size, and ultimately they undergo the ef-
fects of rapid decompression in search of equilibri-
um. In a word … they pop. And generally speaking,the bigger the bubble the bigger the bang.
Most of us are pretty good by now, we think, atspotting bubbles. After all, we know what they look
like; we recognize their characteristics, don’t we?Maybe. Maybe not. Not all bubbles look or act the
same.
Market bubbles are most commonly identified by thedestabilizing speculation that accompanies them—a
Gold Rush mentality, one might say. They are often
described as manias, crazes, financial orgies in whichthe only direction appears to be up, and no one
wants to be seen as the last to jump on the gravytrain. Think here of the typical investor in 1999 asthe dot-com insanity neared its zenith. Think of the
leveraged home-speculating and flipping frenzy thatpeaked in 2006—aided and abetted by the inven-
tion of the securitization sausage machine, the latest
enabler of Wall Street avarice, which ground outsubprime-mortgage-backed securities that author
Michael Lewis later described in The Big Short as
“towers of crap.” Those were classic “bubbles” allright: mad money bidding up the prices of increas-
ingly riskier assets far beyond their actual worth.But what about now? Is there a bubble inflatingagain?
If so, it lacks the signature fervor described in thetwo instances above. Sure, the popular marketindices continue their march into new all-time highground, extending an advance of 159% that began4½ years ago, with no interim correction greater
than 22%. But the telltale signs of emergent retail-investor, greed-driven speculation are conspicuous
by their absence. If anything, whipsawed investorsmay be more reticent and wary than euphoric orintoxicated by Keynesian “animal spirits.” Becauseof their tendency to buy rising markets and sell fall-
ing ones, lay investors have seen their fortunes fallfar short of even the dismal 2.9% average annual
total return, including dividends, of the S&P 500since 2000. Prone, as most investors are, to viewthe future through the rearview mirror, the boom-and-bust image of the last 13 years is anything but
encouraging.
Nevertheless, people often shrug their shoulders,scratch their heads, and simply accept that there
must be good reasons why stocks have been on a
roll. The average investor, after all, is at least onestep removed from the markets for intangible assetsand therefore has comparatively little experience tohelp avoid becoming their occasional Venus flytrapdinner.
8/14/2019 Martin Capital - Third Quarter 2013
http://slidepdf.com/reader/full/martin-capital-third-quarter-2013 2/10
Martin Capital Management, LLCPage 2
QUARTERLY C AP ITAL M ARKETS R EVIEW OCTOBER 2013
When it comes to assessing the state of the real economy, on the other hand, most people are more cir-
cumspect and not so easily taken in. Unlike the distant relationship most have with the markets for stocks,bonds, and beguilingly popular esoterica like ETFs, firsthand experience with keeping a job and paying thebills is a good teacher. People remember that household and business balance sheets took a drubbing five
years ago. Like a boxer now rising from the canvas after a 9-count, the economy appears better than it was when face down on the mat—but it still looks wobbly. Despite recent headlines touting a significant recov -
ery in real estate, for example, people know that their homes are still worth far less (on average, 23% less,according to the most recent Case-Shiller 20-city composite) than they were in 2006.1 And despite the infu-
sion of trillions of stimulus dollars, gut instinct tells them that the opportunity to work toward the Ameri-can dream is, for many people, receding rather than expanding.
Labor Contractions?
Looking deeply into unemployment data helps explain the accuracy of that gut-level sentiment. The truthis that the employment situation in the U.S. remains worse than it was pre-crisis—but somewhat better thanin the dark days of 2009. The good news: We now have 6 million more people working than in 2009. The
bad news: We have 1.5 million fewer people employed today than in 2006. But these cyclical employmentnumbers must also be viewed against the structural background reality of a changing, not static, populationbase. Let’s dig a little deeper.
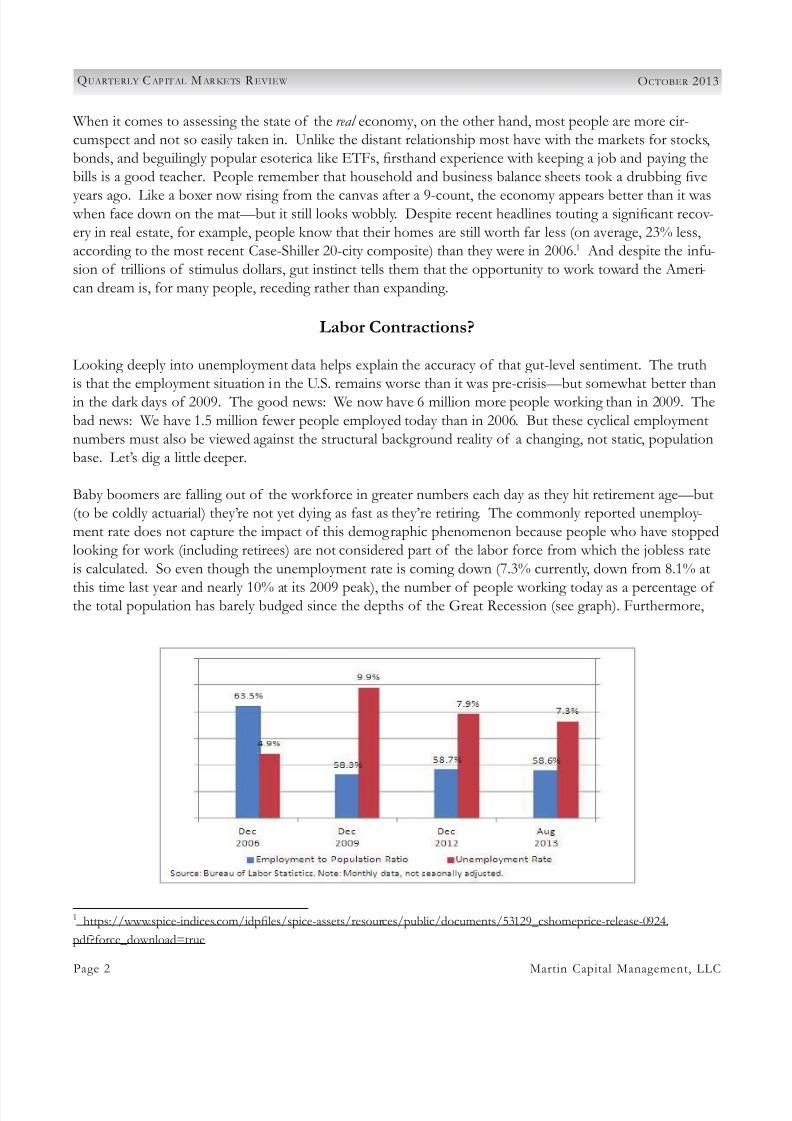
Baby boomers are falling out of the workforce in greater numbers each day as they hit retirement age—but(to be coldly actuarial) they’re not yet dying as fast as they’re retiring. The commonly reported unemploy -ment rate does not capture the impact of this demographic phenomenon because people who have stoppedlooking for work (including retirees) are not considered part of the labor force from which the jobless rate
is calculated. So even though the unemployment rate is coming down (7.3% currently, down from 8.1% at
this time last year and nearly 10% at its 2009 peak), the number of people working today as a percentage ofthe total population has barely budged since the depths of the Great Recession (see graph). Furthermore,
1 https://www.spice-indices.com/idpfiles/spice-assets/resources/public/documents/53129_cshomeprice-release-0924.
pdf?force_download=true

8/14/2019 Martin Capital - Third Quarter 2013
http://slidepdf.com/reader/full/martin-capital-third-quarter-2013 3/10
Page 3Martin Capital Management, LLC
QUARTERLY C AP ITAL M ARKETS R EVIEW OCTOBER 2013
4.5 million Americans aged 16-54 have fallen out of the workforce since 2006 for a wide variety of reasons,and they also are not counted in the standard jobless rate. If they were, unemployment would be back at9.7% today. Thus, the Fed’s toolbox may arguably have had a superficial impact on the unemployment rateover the last five years, but not on the more substantive structural employment issues facing the United
States reflected in the stubborn employment-to-population ratio which we feel is a more comprehensivemetric. Given the lack of ability to address the real problem, and the potentially dire unintended conse-
quences of long-term accommodative monetary policy experimentation, the risks certainly appear to out-
weigh the gains.
In addition, an increasing number of Americans are finding that government benefits (unemployment, welfare, and other forms of assistance) actually pay better than a real job. According to a Cato Institutestudy 2 citing Department of Commerce statistics, welfare benefit recipients in Hawaii can make the equiva-
lent of part-time employment paying $17.50 an hour! In fact, the study shows that government assistance
programs pay better than a minimum-wage job in 35 of the 50 states. Thus, the disincentives from an ever- widening social safety net are often seemingly at cross-purposes with the mission and policies of the Federal
Reserve to manage—i.e., reduce—real unemployment. And in a cruel twist, that safety net is apparentlyfull of holes: The Census Bureau’s most recent report3 shows that 44% of U.S. citizens defined as livingin poverty now meet the criteria for being in “deep poverty”—i.e., earning half or less of poverty incomeguidelines. That’s the highest rate of deep poverty since data first became available on the subject in 1975.
Of course, what really matters is a future no one can predict. We spend a fair amount of time imagin-
ing different scenarios as if we were writing to you in 2020, and our vision is anything but 20/20. In very
simple terms, the total percentage of employed persons in this country will continue to decline unless theeconomy adds jobs at the same rate it adds citizens. If the civilian population4 continues growing at therecent rate of 1% (2.45 million new people each year) and the ranks of the employed also grow at 1% (1.4
million new jobs each year), the employment-to-population ratio will remain constant rather than show -ing improvement. That’s essentially what has happened over the last five years, despite the decline in thestandard unemployment rate. In theory, real GDP needs to grow at 2.4% or better for unemployment toimprove at all. Chairman Bernanke himself noted that a 1% decline in the unemployment rate would ef -fectively require GDP growth of 4.4%5 —a rate not seen since early 2004. 2013 GDP growth is expected to
finish far below those thresholds at 1.6%, despite consensus forecasts issued two years ago for a growth rateof 2.5% in 2013. Similar forecasts for 2014 and 2015 GDP now predict 2.6% and 3% respectively for thenext two years, but rosy prognostications, as we’ve seen, are subject to downward revisions that reflect thereality of persistent headwinds that denial will not quell.
2 http://www.statisticbrain.com/welfare-statistics/
3 Reported in the Wall Street Journal , October 11, 2013: http://online.wsj.com/news/articles/SB1000142405270230450040457912
7603306039292?KEYWORDS=poverty
4 “Civilian population” defined as non-military, non-institutionalized people aged 16 and older.
5 Okun’s Law says unemployment will rise if real GDP does not grow as fast as potential GDP (defined as Productivity plus Labor
Force Growth). Citing Okun’s Law, Chairman Bernanke said, “To achieve a 1 percentage point decline in the unemployment ratein the course of a year, real GDP must grow approximately 2 percentage points faster than the rate of growth of potential GDPover that period,” in a speech before the National Association for Business Economics on March 26, 2012.

8/14/2019 Martin Capital - Third Quarter 2013
http://slidepdf.com/reader/full/martin-capital-third-quarter-2013 4/10
Martin Capital Management, LLCPage 4
QUARTERLY C AP ITAL M ARKETS R EVIEW OCTOBER 2013
As for the nation’s balance sheet, in certain respects analogousto that of a household (see illustration at right)6, high levels ofdebt have constrained growth. Money spent on debt servicecannot be spent on flat-screen TVs unless the banking system
recycles the payments, which it presently is not doing for lackof demand—and because of tightened, “once burned, twiceshy” lending standards among financial institutions. Despite allthe talk about deleveraging, total nonfinancial debt in the econ-
omy relative to GDP is stubbornly stuck at a record high of275% with public debt utterly detached from tax revenues—letalone common sense (see graph below)7. Although private-sector indebtedness has gone down in the last five years, ad-
ditional public-sector borrowing has offset that reduction.
Profits, Agnostics … and Prophets
Today’s market bulls base much of their opti-mism on ballyhooed statistics surrounding cor-
porate profits and profit margins, both of whichare at all-time highs. Lest we forget, profits arethe comparatively volatile residual after all ex-
penses are deducted from revenues. Throughoutmodern history, profit margins and the growthrate in profits have shown a strong tendency to
revert to their long-term means, with the averagefor the latter being 6.5% before being adjusted for inflation.
Understandably, the majority of investment managers focus on what is immediately relevant to the goalof optimizing short-term performance: the trend in reported corporate profits. But when queried aboutthe business impact of ever-changing macroeconomic forces and thief-in-the-night tail risks, most claim tobe agnostic8, arguing that it’s simply too time-consuming or cognitively challenging to think top-down andbottom-up simultaneously. Besides, they claim with some justification, the two orientations require differentmindsets and are accordingly difficult to integrate on a practical level.
Most of the time, it is true that “macro-agnostic” investment managers are not penalized for their intense
focus on specific businesses. However, when they turned a blind eye to the build-up of manifold andmyriad excesses culminating in the 2008 financial crisis, macro-agnosticism cost their clients dearly. Duringthe panic, some investors capitulated to their fears and turned paper losses into real ones. Others waxed
6 Source: Heritage Foundation calculations based on data from the Congressional Budget Office, Updated Budget Projections: Fiscal
Years 2013 to 2023, May 2013, http://www.cbo.gov/publication/44172.
7 Source: www.bond-bubble.com.
8 Convinced that essence and impact of large-scale economics are highly uncertain and/or unknowable because of complexity,
and therefore largely ignored in the analysis of specific business investment opportunities.

8/14/2019 Martin Capital - Third Quarter 2013
http://slidepdf.com/reader/full/martin-capital-third-quarter-2013 5/10
Page 5Martin Capital Management, LLC
QUARTERLY C AP ITAL M ARKETS R EVIEW OCTOBER 2013
philosophical, saying in effect, “We suffer our way to wisdom.” In the main, our industry overstated gainsfrom 2004 to 2007 because it failed to price in risks that were clearly visible to those whose peripheral vision wasn’t occluded by denial. To be sure, there are times when the markets actually price in more risk than ex-
ists and create a value investor’s nirvana—most recently, for example, in the mid-1970s and the early 1980s.
This, most certainly, is not one of those times. Our judgment is that the gains of the last several years willagain prove illusory and fleeting. They were built upon the fragile foundation of an unsustainable monetarypolicy that will eventually have to be unwound with potentially destabilizing economic consequences—ifequally destabilizing levels of inflation are to be avoided.
As to why we haven’t ridden the “mirage bull” right up to the edge of the invisible abyss, it’s because no onecan see exactly where the edge is or when to jump off in the nick of time. One step too late and gravityseals your fate. Investment managers in today’s environment end up acting like the conflicted St. Augustineduring his hedonistic years as a young adult, when he conformed to the mores of his peers in order to gain
acceptance and avoid ridicule. It was during this period that he uttered his famously oxymoronic prayer,“Make me chaste, Lord … but not yet.”
A Brief History of Fed Tinkering
Under the Fed’s zero-bound interest rate policy, nominal short-term rates have actually been negative whentaking into account roughly 2% inflation in the CPI since 2008 and those rates are expected to remainsquashed underfoot through 2015 or longer.
“Quantitative Easing”9 (QE) began as a crisis re-
sponse tool to purchase mortgage-backed securities
from beleaguered financial intermediaries. It has
mushroomed from an initial $600 billion program toone that has expanded the central bank’s balance sheetby a total of nearly $3 trillion as of today.
On June 19 of this year, it appeared the valve on thespending spigot might at least begin to be turned
down. Chairman Bernanke announced that the Fed would “taper” its bond purchases, perhaps by $10billion to $20 billion per month, beginning as early as
September, contingent on continued positive eco-
nomic data. The S&P 500 abruptly fell 3.4% in the
next three days, and markets around the world felt theresulting tremors. Just three months later, at the Sep-
tember 18 press conference, Bernanke announced thatthe Fed had decided to hold off on those plans
9 A Reuters/Ipsos poll released on September 18 indicated that73% of Americans don’t know what “quantitative easing” means. One woman replied, “I was asking my husband if he’d heard
anything because he does stocks and all that. He didn’t really know either.” I am writing, with a high degree of confidence, tothe other 27%. An article on the poll results is available at: http://www.reuters.com/article/2013/09/17/us-usa-fed-poll-idUS-
BRE98G18K20130917

8/14/2019 Martin Capital - Third Quarter 2013
http://slidepdf.com/reader/full/martin-capital-third-quarter-2013 6/10
Martin Capital Management, LLCPage 6
QUARTERLY C AP ITAL M ARKETS R EVIEW OCTOBER 2013
to scale back, stating that “… conditions in the job market today are still far from what all of us would liketo see.”10 The Fed’s balance sheet now stands at $3.7 trillion and, since it is unlikely that tapering will beginuntil the first quarter, that astronomical number will continue to grow.
Legally, the Fed is under no obligation to sell the almost $3 trillion in financial assets it has acquired since2008, equivalent to approximately 36% of the public debt issued by the Treasury since the crisis began. Intheory at least, it can effectively finance a large portion of the federal deficit indefinitely since it has thepower to create money out of thin air to make the purchases. Also, theoretically if not practically, when thegrowth in the supply of money greatly exceeds the growth in the supply of goods and services, the pricesof those goods and services must eventually rise. Alas, theoretical explanations notwithstanding, there is nofree lunch. Applying the law of diminishing returns to the impact of monetary policy on the prices of risk
assets, it takes larger and larger injections of QE gas to grow the ever-expanding market balloon to the samedegree. As the Fed thrusts more hydrogen into the pumped-up market, the prices of risk assets rise higherand higher above their underlying fundamentals. And that’s not all. Each new round of QE also adds fuelto the future consumer price inflation fire, creating the possibility that this balloon morphs into the Hinden -
burg.
Former Secretary of the Treasury Hank Paulson, who was the champion of TARP, has been a media favor-
ite of late as the nation observed the fifth anniversary of the Lehman collapse. Back in the midst of the2008 crisis, Paulson summed up the triage state of mind by saying, “I’m not going to speculate on hypo-
theticals about intervention.” Even the more cerebral Bernanke evoked the crisis mindset as things wereunraveling: “There are no atheists in foxholes and no ideologues in a financial crisis,” he said in 2008. As aresult, the consequences of the last five years of experimentation continue to be pushed off into the future,quite likely coming home to roost on someone else’s watch.
Beware. Despite the fixation on problems of the moment, the longer-term consequences can be worse than
the Band-Aid® cures. The origins of double-digit inflation and interest rates in the early 1980s, for example,and the concurrent record low valuations in risk assets, stemmed in large measure from Arthur Burns’ politi -cally compromised monetary regime of the 1970s. In complex systems, the inputs are often highly intercon-
nected; and the outcomes, in terms of order of magnitude and timing, are utterly unpredictable. It is doubt-
ful, for instance, that anyone in Colorado worried about future flooding risks while battling drought-fueled
forest fires in 2012, but the scorched earth most certainly magnified the impact of this summer’s deluge.
Our awareness of the broader macroeconomic landscape prior to 2008 allowed us to detect the conditionsfor a financial flash flood, and we entered the bear market and crisis with nearly 70% of our assets in cash.Our Total Account Composite11 was down less than 7% in 2008 while the broader market (S&P 500) was
10 Federal Reserve Chairman Ben Bernanke’s September 18, 2013, press conference transcript: http://www.federalreserve.gov/mediacenter/files/FOMCpresconf20130918.pdf
11 Martin Capital Management, LLC is an investment advisor registered with the U.S. Securities and Exchange Commission. MCM’s
primary investment objective is to achieve above-average long-term growth at below-average risk of permanent capital loss. The MCM
Total Account Composite shows the performance of assets held in fully discretionary fee-paying accounts that have given MCM author-
ity to invest 100% of the account and are managed per our model portfolio. Returns are calculated in U.S. dollars. The composite
is net of all management fees and includes the reinvestment of all income but does not reflect the effect of taxes. The inception date
for the composite is January 1, 2000. The S&P 500 Total Return Index is an unmanaged market capitalization-weighted index
of 500 common stocks chosen for market size, liquidity, and industry group representation to represent U.S. equity performance.
S&P 500 returns do not include consideration for fees or taxes. Past performance is no guarantee of future results.

8/14/2019 Martin Capital - Third Quarter 2013
http://slidepdf.com/reader/full/martin-capital-third-quarter-2013 7/10
8/14/2019 Martin Capital - Third Quarter 2013
http://slidepdf.com/reader/full/martin-capital-third-quarter-2013 8/10
Martin Capital Management, LLCPage 8
QUARTERLY C AP ITAL M ARKETS R EVIEW OCTOBER 2013
funded increasingly by unstable short-term funding. At the same time, asset bubbles areaccompanied by weakening underwriting standards, and less-stringent margins and smallerhaircuts. And asset bubbles are characterized by many investors chasing the same asset, and
so there is generally wide-spread participation in the growth and nurturing of the bubble.
Perhaps our recent asset bubble was the result of a perfect storm [referring to the
housing bubble with a rather familiar evocative phrase—comment and empha-
sis mine], one that will not recur for decades. But it is my view that asset bubblesare a feature of our financial landscape; that what happened before could hap-
pen again; and that the growth and after-effects of asset bubbles reflect particu-
lar financial institution decisions and particular regulatory policy choices or laps-
es. In my view, their emergence is usually neither intentional nor accidental …
Raskin concluded her July speech with the following thoughts:
Even within the regulated sector, crafting appropriate financial regulation to addressasset bubbles is challenging. In reality, it is hard to know in real time when asset priceshave deviated sharply from fundamentals. Asset price increases often initially reflectimproving fundamentals and may only subtly and gradually change into reflections ofspeculative excess. Prior to the peak of housing prices, interest rates were low, makingmortgage payments affordable; real incomes were rising; population was growing; and
household formation was high—all “fundamental” determinants of the demand forhousing and house prices. At some point, however, house prices were driven less by thesefundamentals and more by speculation and weak underwriting. Ultimately, this drove
house prices to unsustainably high levels. Regulatory intervention was much too late.
Ms. Raskin is so right on so many of the points she makes in her speech. Her hindsight is perfectly 20/20.However, because this bubble in risk assets is atypical , it does not fit the neat and tidy existing bubble models.It is right there before her eyes, “a feature of our financial landscape,” and yet she doesn’t see it because it
lacks the conventional markers of the well-known tulip mania or dot-com craze or, at least directly, most ofthe characteristics Raskin mentioned in her eloquent speech.
You see, this bubble was born of desperation, first by the misguided monetary policy regime and then byinvestors who are sure to become its unsuspecting victims as they look for return— any return—in all the
wrong places.14 My criticism, though, is not intended to be directed toward one person. Ms. Raskin has
plenty of company. The members of the FOMC—the rotating Federal Reserve Bank presidents and themembers of the Federal Reserve Board—are, to a man or woman, remarkable people as individual profes-
sionals. But as a group … well, the following might be food for thought:
14 See “Bubbles of Our Own Design” by Frank K. Martin (http://www.martinfocusedvaluefund.com/commentaries/bubbles-of-our-own-design/#more-501 ).

8/14/2019 Martin Capital - Third Quarter 2013
http://slidepdf.com/reader/full/martin-capital-third-quarter-2013 9/10
Page 9Martin Capital Management, LLC
QUARTERLY C AP ITAL M ARKETS R EVIEW OCTOBER 2013
The anthropological classic, Charles Mackay’s Extraordinary Popular Delusions and the Mad-
ness of Crowds , first published in 1841, teems with seemingly endless truth-is-stranger-than-fiction historical accounts of crowd follies that predictably dumbfound readers.
The iconoclastic market speculator turned statesman, Bernard Baruch, “The Lone Wolfon Wall Street,” provocatively summarized the 1932 edition’s unspoken synopsis in theforeword with a quotation from the German philosopher Johann Friedrich von Schiller(1759–1805) that leaves one yearning for more: “Anyone taken as an individual is tolera-
bly sensible and reasonable—as a member of a crowd, he at once becomes a blockhead.”
True to his customary haughtiness, Baruch feigned: “I’m not smart. I try to observe. Mil-lions saw the apple fall, but Newton was the only one who asked why.” Baruch’s observationis keen. Many may have observed this phenomenon in crowds, but few have asked why.15
The Search for Safe Harbor
Railing against Fed policy, of course, doesn’t change it. But there’s no question the central bank is a primemover of markets in the current environment. So how does one find a balance between putting all of one’schips on the market roulette table where Ben Bernanke (soon, it appears, Janet Yellen) affects the spin ofthe wheel—or fretfully burying one’s life savings in the backyard? How does an investment manager (andthus an investor) find a safe harbor when the usual ports have been made so unattractive? The answer is by viewing and synthesizing both the macro and micro fields of vision.
Like the majority of our value-investing kinfolk, we spend most of our collective time and energy in the
relative obscurity of our workshop, looking at individual businesses in painstaking detail. We are, in that
role, a bit like Santa’s elves building inventory for Christmas. It’s not very glamorous work 364/365ths
of thetime, but one special day makes it all worthwhile. The elves build with a time target in mind, while we build with a price target. Other than that (and the funny slippers), we’re pretty much the same.
Elves, however, are so intensely focused on the details of their work that they rarely have the time or in-
clination to check the weather report. Sending the Big Guy into the teeth of an oncoming storm with aheavily loaded sleigh could end in disaster (yes, a crash, one might say). If, on the other hand, everything iscalm, who cares what the forecast says? Holiday metaphors notwithstanding, there are times when having a
macro perspective is far less necessary than today. You would not have needed a top-down view in 1920, forexample, or in 1932 or 1982 when stock prices were so cheap and equities so reviled that they had nowhereto go but up. In our view, the most recent fair-weather, bottom-up-only, macro-agnostic days ended in 1999
and have yet to return.
Thus, the long span since 2000 has called for a most rigorous and disciplined overlay of top-down vision asa complement to (not replacement for) traditional value-based fundamental analysis of specific businesses. Without that broader perspective, one would have been subjected to two of the three most destructive bear
markets since the crash of 1929–32. Although no more certain of timing than we were in 1999 or in 2007, we feel circumstances today demand nothing less than near total preoccupation with protecting your capital.
15 See “Fireside Chat No. 6” by Frank K. Martin (http://www.mcmadvisors.com/podcasts/Fireside_Chat__6.mp3.pdf ).

8/14/2019 Martin Capital - Third Quarter 2013
http://slidepdf.com/reader/full/martin-capital-third-quarter-2013 10/10
Martin Capital Management, LLCPage 10
QUARTERLY C AP ITAL M ARKETS R EVIEW OCTOBER 2013
Distorted markets have been accepted by many as the “new normal.” So were the “Nifty 50” and the cer-tainty of ever-rising dot-com stock prices in the late ’90s. Both turned out to be illusions that caused a greatdeal of agony once the ecstasy evaporated. Distortions, by definition, are not normal. But like the atypical“invisi-bubble,” distortions aren’t always easy to identify while they’re happening.
Thus, we remain vigilant. And we continue to believe it is possible—and necessary—to see both the forestand the trees in order to fulfill our highest obligation: to continue acting in the best interests of our clients. As noted investment manager Francois Sicart said recently: “The attitude of many professional investorstoward the current market makes me think of a crowd enjoying a dance party on top of an active volcano. They know it is going to erupt but, instead of planning an exit, they keep dancing while trying to guess the
exact date and time of the eruption.”
We choose not to join the flashmob currently doing the Electric Slide at the summit of Mt. St. Helens. Asfiduciaries, we strongly believe the prudent course in the current environment is to: 1) Protect your capital,2) Continue doing the painstaking work of fundamental, business-specific research to construct an inven-
tory of ideas well-suited to a concentrated value portfolio, and 3) Hold cash as a vehicle to take advantageof those future opportunities when they arise.
Frank K. Martin
October 2013