open access remote sensing data to examine the long-term trend in the normalized difference...
TRANSCRIPT
Remote Sens. 2010, 2, 2729-2747; doi:10.3390/rs2l22729
Article
OPEN ACCESS
Remote Sensing ISSN 2072-4292
www.mdpi.com/journallremotesensing
The Browning of Alaska's Boreal Forest
Mary Beth Parent and David Verbyla *
Department of Forest Sciences, School of Natural Resources and Agricultural Sciences, University of
Alaska Fairbanks, Fairbanks, AK 99775, USA; E-Mail: [email protected]
* Author to whom correspondence should be addressed; E-mail: [email protected];
Tel.: +1-907-474-5553; Fax: +1-907-474-6184.
Received: 28 October 2010; in revised form: 18 November 2010 / Accepted: 2 December 2010 / Published: 8 December 2010
Abstract: We used twelve Landsat scenes from the 1980s-2009 and regional 2000-2009
MODIS data to examine the long-term trend in the normalized difference vegetation index
(NDVI) within unburned areas of the Alaskan boreal forest. Our analysis shows that there
has been a declining trend in NDVI in this region, with the strongest "browning trend"
occurring in eastern Alaska where the climate during the growing season is relatively dry
and warm. Possible reasons for the "browning trend" are decreased vegetation due to
temperature-induced drought stress and increased infestations of insect pests.
Keywords: boreal forest; Alaska; NDVI; browning; climate warming
1. Introduction
The greatest climate warming over the past 50 years in North America has occurred in Alaska and
northwest Canada [1]. This warming has led to substantial physical and biological changes including
record sea-ice retreat [2], permafrost thawing [3], record summer warmth [4], and an increase in
growing season length [5]. In the arctic tundra, there has been an increase in vegetation productivity as
indexed by the Normalized Difference Vegetation Index (NDVI) [6], consistent with field-based
historic photography [7], and experimental warming studies [8]. In contrast to the increasing NDVI in
arctic tundra, there has been a declining trend in NDVI in boreal Alaska documented at several spatial
scales [9-11]. These boreal results were all based on the NDVI data produced as part of the National
Aeronautics and Space Administration Global Inventory, Monitoring and Modeling Studies (GIMMS)
project. However, this observed "browning" trend may be due to a bias towards negative trends in the

Remote Sens. 2010,2 2730
GIlVfNIS NDVI data set. For example, a recent study [12J detected posItlVe NDVI trends in
re-vegetating burned areas in central boreal Canada using a I-kIn A VHRR NDVI dataset, yet the
GllvlMS NDVI did not increase in most of these burned areas. The objective of this study is to
determine whether the browning trends in Alaska's boreal region exists based on other NDVI sources
(Tena MODIS and Landsat TMfETM-+- NDVI).
In this study, we analyzed the long term (mid-1980s to present) trend using NDVI computed from
historic Landsat sensor data by developing a time series of NDVI for 12 different scene footprints
located within boreal Alaska. Within each scene footprint, we also use MODIS data to document the
NDVI trend since 2000. MODIS NDVI data is obtainable as composite data available every 16 days,
while the Landsat sensor data is typically much more limited in Alaska. In this study, we acquired at
least six years of Landsat images, with at least one image from the 1980s as a time series within each
scene footprint We also assess the potential of a browning bias in the GllvlMS NDVI by comparing
GIMMS and MODIS NDVI from a large regional perspective. We used polygons of burned areas since
1980 to exclude wildfire bums in our analysis.
2. Data and Methods
2 .1 Study Region
Most of Alaska's boreal forest lies in an intermountane region bounded to the north and south by
large mountain ranges resuiting in a west to east climatic gradient (Figure The region is
characterized by isolated mountains, large areas of hilly uplands, meandering rivers with broad
floodplains and extensive wetland regions. Black spruce forests dominate cold sites, such as wetlands
and north-facing slopes, often underlain by permafrost. White spruce occurs on warmer sites such as
active floodplains and south-facing slopes. Deciduous forest (aspen, birch, and balsam poplar) also
occur on warmer sites. The vegetation mosaic of this region is primarily controlled by disturbance
legacies (primarily wildfire) and topographic control of microclimate.
22 GIMMS NDVI Data
The GIMMS 1981--2008 NDVI dataset was obtained from the GIMMS team [14], and also
available from http://ww-w.landcover.org/dataigimmsi. The data are maximum NDVI values
compo sited over a IS-day period, using Advanced Very High Resolution Radiometer (A VHRR)
Global Area Coverage IB data (4km resolution at nadir) and projected to a North American Albers
Equal Area Projection with 64 lan2 pixel size. The data had been conected for sensor degradation,
inter-sensor differences, solar zenith angle, and viewing angle effects due to satellite drift No
atmospheric correction has been applied with GThllMS data, except for major volcanic stratospheric
aerosol periods. Cloud screening was based on an AVHRR channel 5 thermal mask of 0 °C [14].

Remote Sens. 2010,2
Figure 1. Study region of boreal Alaska showing a west to east climatic gradient from
maritime to continental climate [13]. Source: http://www.snap.uaf.edu/gis-maps.
Degrees C
< 15 015 -16 016-17 017-18 _>18
2731
Pixels with an NDVI flag of zero, indicating good quality, were used in this study. In order to
minimize NDVI variation associated with interannual changes in unvegetated pixels, we used only
pixels with a maximum annual GIMMS NDVI above 0.4. In this study, we compared 2000-2008
GIMMS NDVI data with Terra MODIS NDVI data which began with the launch of Terra in 2000. The
GIMMS NDVI from this period originated from the AVHRR onboard NOAA-14 (2000), NOAA-16
(2001-2003), and NOAA-17 (2004-2008) satellites. NOAA-14 and -16 had an afternoon overpass and
NOAA-17 a morning overpass. Absolute change in NDVI among the AVHRR sensors can range up to
0.06, with a bias towards larger NDVI values when comparing NOAA-14 AVHRR with NOAA-16
and NOAA-17 AVHRRs [15].
2.3. MODIS NDVI Data
The MODIS l_km2 NDVI product, MOD13A2, versionS [16] was used in this study, downloaded
from https://wist.echo.nasa.gov/�wist/apilimswelcome/. This product is based on the Terra MODIS
level 2 daily surface reflectance product, which provides red and near-infrared surface reflectance
corrected for the effect of atmospheric gases, thin cirrus clouds and aerosols. This 16-day composite

Remote Sens. 2010,2 2732
product was downloaded in a global sinusoidal projection and then reprojected to the Alaska Albers
Equal Area projection at 1_km2 pixel size. Only pixels with reliability value of zero were used in this
study. To minimize the effect of unvegetated pixels, only pixels with an MODIS NDVI of at least 0.4
were used in this study. Forested pixels typically had maximum NDVI values above 0.8 for broadleaf
forest and above 0.7 for spruce woodland. We computed the linear trend in annual maximum NDVI
from 2000 through 2009 for each 1-km pixel in the MODIS NDVI time series. Using linear regression,
we excluded all pixel trends that were not statistically significant (p > O.OS), and excluded any pixels
that had burned since 1980. With the remaining pixels, we produced a raster of significant regression
slopes for 1-km pixels within the Alaskan boreal region. We also computed linear regressions for each
Landsat scene footprint, based on 2000 through 2009 MODIS maximum NDVI values.
The day of year for each NDVI pixel in the composite was retained to determine the time period
during the growing season when boreal NDVI was near its maximum. This time period was used to
define the annual peak growing season period that was then used to restrict our analysis to this period
(Figure 2).
Figure 2. Mean MODIS NDVI by day of year of NDVI observation for two Landsat
scenes. Based on these data, we defined our annual peak growing season study period as
from day 170 (June 19) to day 220 (August 8). Day to day variation in mean NDVI is likely
due to daily variation in proportion of conifer versus broadleaf pixels. Interannual variation
is likely due to climatic conditions, with 2007 being an earlier spring start of growing
season. (A) P7SR1S (WRS Path7S Row1S) covers a western part of the region. (B) P70R14
(WRS Path70Row14) covers an eastern part of the Alaskan boreal region.
A) P75R15 0.9.,-------------------------,
0.8
;; 0.7 C Z III g 0.6 ::E c:: '"
o • � '" o 0
q. 0 DO .. 1]0 ::E 0.5 �CT • • 0 [)II. � . .
0.4
o o DItJ-o. 0
o 0 nO _ � DO 0 � . •
.
. o ... 0 o � • 0 .0
. �
• 0 .. 0
. . . ..
0 2007 . 2008
120 130 140 150 160 170 180 190 200 210 220 230 240 250 260 Day of Year

Remote Sens. 2010,2
::r :> 0.70 j � I !2 I g 0.513 i :::; I § i <> J" • :i 0.50 I 'Il 00 iIiJ • � 00 !I COil
! 0 .,p § I ;::: a "I! O.AO 1:,
I 0.30 +--�
8) P7ilR14
o c
120 130 140 150 160 i7G 1S0 190 200 210 220 230 240 250 260 Day of Year
2.4. Landsat Tl\.1/ETM Data
2733
The 1985-2009 Landsat NDVI data were compiled from Landsat 4 and 5 Thematic Mapper (TM)
and Landsat-7 Enhanced Thematic Mapper Plus (ETM+) data downloaded from the United States
Geological Survey (USGS) website from (http://glovis.usgs.gov/). The twelve scene footprints were
chosen to span across the east to west climatic gradient (Figure 3) within the boreal zone of Alaska.
Figure 3. Location of twelve Landsat scenes used in this study
! !
I
!
Remote Sens. 2010,2 2734
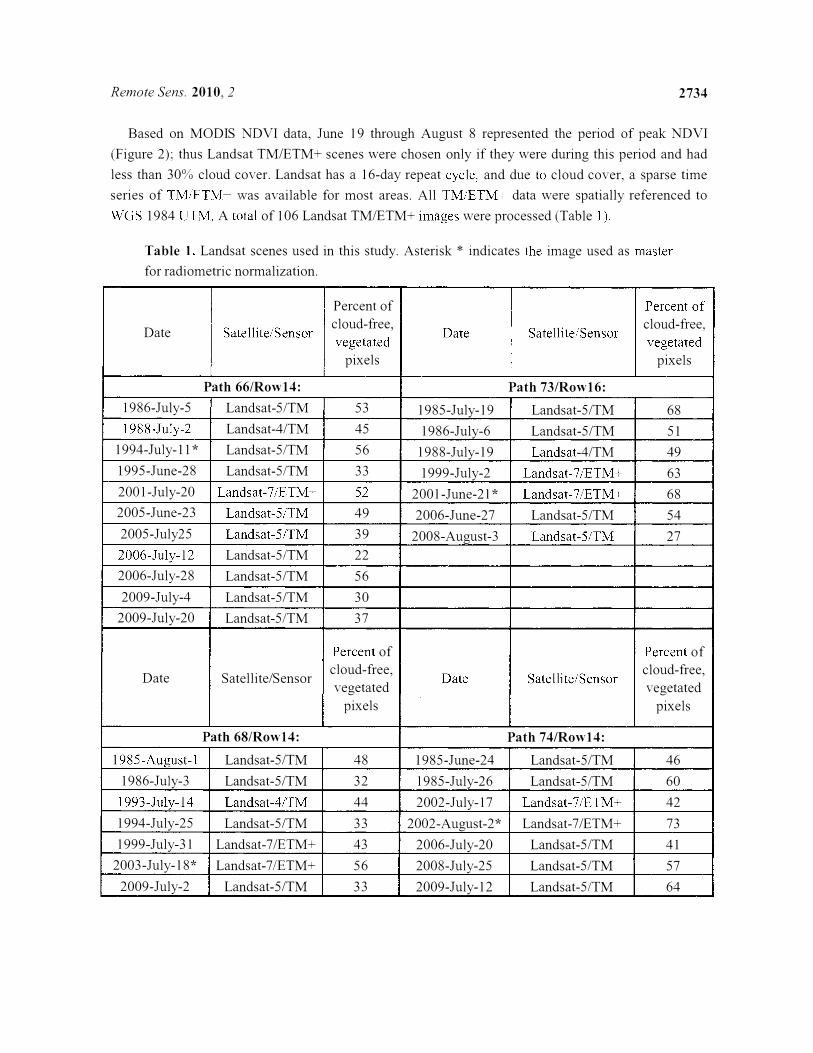
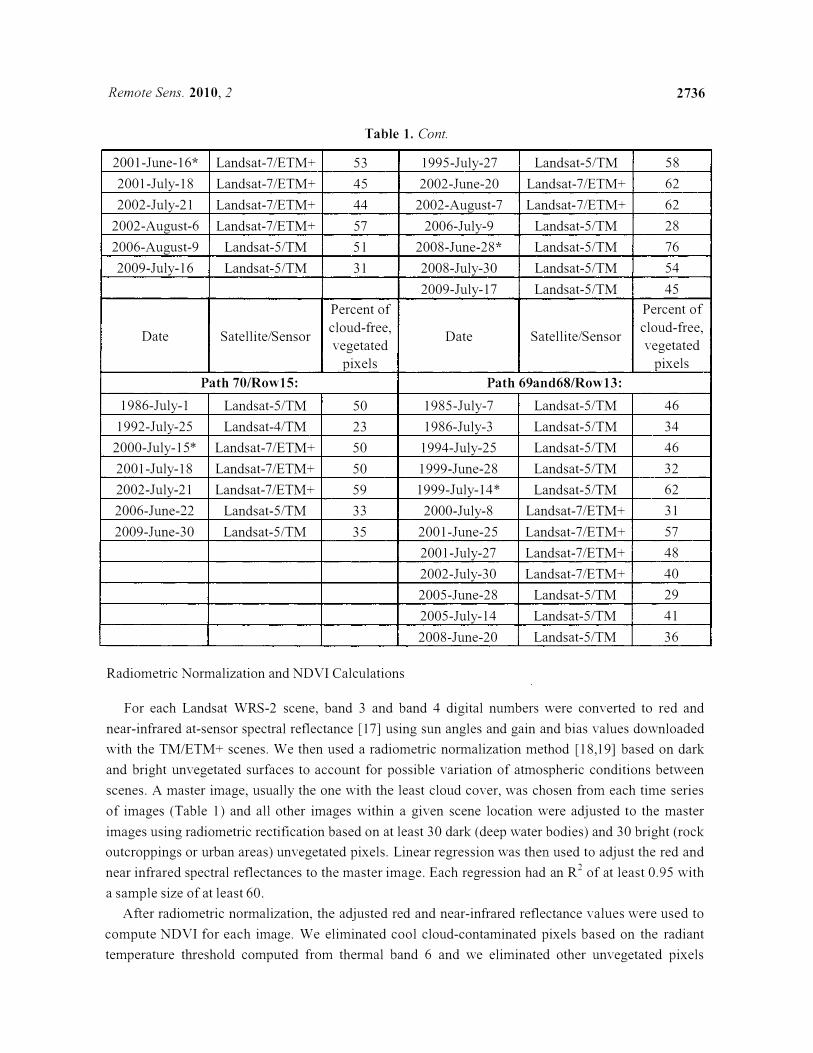
Based on MODIS NDVI data, June 19 through August 8 represented the period of peak NDVI
(Figure 2); thus Landsat TM/ETM+ scenes were chosen only if they were during this period and had
less than 30% cloud cover. Landsat has a 16-day repeat cycle, and due to cloud cover, a sparse time
series of TI\.{'ETM-t- 'was available for most areas. All TMJETM+ data were spatially referenced to
WGS 1984 UT'vf. A total of 106 Landsat TM/ETM+ images were processed (Table 1)
Table 1. Landsat scenes used in this study. Asterisk * indicates the image used as master
for radiometric normalization.
Percent of i I Percent of I !
cloud-free, ! I cloud-free, Date Satellite/Sensor
vegetated Date Satellite/Sensor :
vegetated I I pixels I pixels
! i Path 66!Row14: Path 73/Row16:
1986-July-S Landsat-S ITM I 53 1985-July-19 Landsat-S/TM 68
1988-July-2 Landsat-4iTM 45 1986-July-6 Landsat-SiTM Sl
1994-Juiy-ll * Landsat -5 ITM S6 1 988-July-1 9 Landsat -4/TM 49
1995-June-28 i Landsat-SITM 33 1 999-July-2 Landsat-7/ETM+ 63
2001-July-20 I Landsat-7!ETM-t- . ,\n �L 2001-June-21 * Landsat-7/ETM� 68
200S-June-23 Landsat-SiTM 49 2006-June-27 Landsat -S /TM S4
200S-July25 Landsat-SITM 39 2008-August-3 Landsat-5iTM 27
2006-July·12 : Landsat-5lTM 22
2006-July-28 Landsat-SiTM 56
2009-July-4 Landsat-5/TM 30
2009-July-20 Landsat -SITM 37
Percent of Percent of
Date Satellite/Sensor I cloud-free, Date Satellite/Sensor
cloud-free,
vegetated vegetated
I pixels pixels
Path 68!Row14: Path 74/Row14:
1 98S-August-l Landsat-S/TM 48 1985-June-24 Landsat-5/TM 46
1986-Juiy-3 Landsat-5/TM 32 1985-July-26 Landsat-SITM 60
1993-July-14 Landsat-4iTM 44 2002-July-17 Landsat-7/ETM+ 42
1 994-July-2S Landsat-5/TM 33 2002-August-2* Landsat-7/ETM+ 73
1999-July-31 Landsat-7iETM+ 43 2006-July-20 Landsat-S/TM 41
2003-July-18* Landsat-7 !ETM+ 56 2008-July-2S Landsat-SITM 57
2009-July-2 Landsat-5/TM 33 2009-July-12 Landsat-SITM 64

Remote Sens. 2010,2 2735
Table 1. Cant.
Percent of Percent of
Date Satellite/Sensor cloud-free,
Date Satellite/Sensor cloud-free,
vegetated vegetated
pixels pixels
Path 68/Row15: Path 75/Row15:
1 986-July-3 Landsat-5/TM 58 1985-August-2 Landsat-5/TM 57
1986-AugustA Landsat-5/TM 49 1986-July-4 Landsat-5/TM 61
1993-July-14 Landsat-4/TM 63 1992-July-12 Landsat-4/TM 42
1995-July-28 Landsat-5/TM 70 1 992-July-28 Landsat-4/TM 37
1999-July-31 Landsat-7iETM+ 54 1999-June-30 Landsat-7/ETM+ 62
2000-July-l Landsat-7/ETM+ 35 2001-June-19 Landsat-7/ETM+ 42
2002-July-23 Landsat-7/ETM+ 62 2002-June-22 Landsat-7/ETM+ 59
2003-July-18* Landsat-5/TM 67 2008-June-14* Landsat-5/TM 58
2009-August-3 Landsat-5/TM 67 2009-July-3 Landsat-5/TM 59
Percent of I Percent of
Date Satellite/Sensor cloud-free,
Date Satellite/Sensor cloud-free,
vegetated vegetated
pixels pixels
Path 70IRow13: Path 75/Row16:
1985-July-14 Landsat-5/TM 41 1985-August-2 Landsat-5/TM 55
1986-July-17 Landsat-5/TM 49 1992-July-28 Landsat-4/TM 32
1994-August-08 Landsat-5/TM 44 1999-June-30 Landsat-7/ETM-r 53
1999-July-5 Landsat-5/TM 35 2000-July-2 Landsat-7/ETM+ 50
2001-July-7 Landsat-7/ETM+ 53 2002-June-22 Landsat-7/ETM+ 64
200 I-July- I8 Landsat-7 IETM+ 52 2009-July-3 * Landsat-5/TM 74
2002-August-6 Landsat-7/ETM+ 51
2006-August-9 Landsat-5/TM 30
2009-July-16* Landsat-5/TM 66
Percent of Percent of
Date Satellite/Sensor cloud-free,
Date Satellite/Sensor cloud-free,
vegetated vegetated
pixels pixels
Path 70/Row14: Path 77IRow13:
1985-July-30 Landsat-5/TM 38 1985-July-31 Landsat-5/TM 57
1991-June-29 Landsat-5/TM 38 1986-July-2 Landsat-5lTM 77 1999-August-6 Landsat-5/TM 45 1988-June-29 Landsat-4/TM 62
2000-July-15 Landsat-7/ETM+ 39 1992-July-29 Landsat-4lTM 30
Remote Sens. 2010,2 2736
Table 1. Cant.
2001-June-16* Landsat-7IETM+ 53 1 995-July-27 Landsat-5/TM 58
200 I-July-l 8 Landsat-7IETM+ 45 2002-June-20 Landsat-7IETM+ 62
2002-July-21 Landsat-7/ETM+ 44 2002-August-7 Landsat -7/ETM+ 62
2002-August-6 Landsat-7/ETM+ 57 2006-July-9 Landsat-5/TM 28
2006-August-9 Landsat-5/TM 51 2008-June-28* Landsat-5/TM 76
2009-July-16 Landsat-5/TM 31 2008-July-30 Landsat-5/TM 54
2009-July-17 Landsat-5/TM 45
Percent of Percent of
Date Satellite/Sensor cloud-free,
Date Satellite/Sensor cloud-free,
vegetated vegetated
pixels pixels
Path 701Row15: Path 69and68/Row13:
1 986-July-l Landsat-5/TM 50 1985-July-7 Landsat-5/TM 46
1 992-July-25 Landsat-4/TM 23 1 986-July-3 Landsat-5/TM 34
2000-July-15* Landsat-7/ETM+ 50 1 994-July-25 Landsat-5/TM 46
200 I-July-l 8 Landsat-7IETM+ 50 1 999-June-28 Landsat-5/TM 32
2002-July-21 Landsat-7IETM+ 59 1 999-July-14 * Landsat-5/TM 62
2006-June-22 Landsat-5/TM 33 2000-July-8 Landsat-7/ETM+ 31
2009-June-30 Landsat-5/TM 35 2001-June-25 Landsat-7IETM + 57
2001-July-27 Landsat-7IETM+ 48
2002-July-30 Landsat-7/ETM+ 40
2005-June-28 Landsat-5/TM 29
2005-July-14 Landsat-5/TM 41
2008-June-20 Landsat-5/TM 36
Radiometric Normalization and NDVI Calculations
For each Landsat WRS-2 scene, band 3 and band 4 digital numbers were converted to red and
near-infrared at-sensor spectral reflectance [17] using sun angles and gain and bias values downloaded
with the TMlETM+ scenes. We then used a radiometric normalization method [18,19] based on dark
and bright unvegetated surfaces to account for possible variation of atmospheric conditions between
scenes. A master image, usually the one with the least cloud cover, was chosen from each time series
of images (Table 1) and all other images within a given scene location were adjusted to the master
images using radiometric rectification based on at least 30 dark (deep water bodies) and 30 bright (rock
outcroppings or urban areas) unvegetated pixels. Linear regression was then used to adjust the red and
near infrared spectral reflectances to the master image. Each regression had an R2 of at least 0.95 with
a sample size of at least 60.
After radiometric normalization, the adjusted red and near-infrared reflectance values were used to
compute NDVI for each image. We eliminated cool cloud-contaminated pixels based on the radiant
temperature threshold computed from thermal band 6 and we eliminated other unvegetated pixels

Remote Senso 2010,2 2737
based on a NDVI threshold specific to each scene to mask cloud shadows, water bodies and rock
outcroppings. We excluded any areas that were burned since 1980 (http://agdcousgs.gov/data/blm!
fire/index.html ), since recently burned areas would have a sharp decline in NDVI, while older burned
areas would have an increase in NDVI due to revegetation, and our primary focus was on the regional
NDVI trend in unburned forests. With these areas eliminated, the mean NDVI was calculated for the
entire image in the time series. Using simple linear regression, mean NDVI trend between 1985 and
2009 was then determined for each scene location, based on the slope and statistical significance of the
regression line. For each scene we also computed the mean NDVI at each time period for those pixels
that had reliable NDVI values (cloud-free, vegetated) throughout the entire time series.
25 Comparing GIMlvlS and MODIS NDVI Trends
Criticism of the GllYfMS NDVI as a data set biased to "browning trends" in the boreal region [12],
was based on a comparison of the coarse resolution GllYfMS NDVI (64 km2 pixels) with a finer
resolution NDVI dataset (1 km2 pixels) within relatively small burned areas. Thus scale may have been
a factor in this reported "browning bias". We felt that a fairer comparison would be to examine mean
GIIvlMS NDVI versus MODIS NDVI from a larger regional perspective, with regions larger than
15 million hectares. Therefore we compared the mean annual maximum NDVI within the eastern and
western boreal region (Figure 1) based on GllYfMS and MODIS NDVI from 2000 through 2008. Only
pixels with annual maximum NDVI values above 0.4 were used in this analysis to minimize the effect
of variations in unvegetated pixels.
3. Results and Discussion
3.1. GIMMS and AfODISNDVI Trends
There was a strong correlation (Pearson's r = 0.91, P < 00001) between GIMMS and MODIS annual
maximum NDVI values within the eastern boreal regiono However, there was a weak correlation
(Pearson's r = -0012, P = 0.750) from the western boreal region (Figure 4). One possible explanation
for this pattern might be more cloud-contamination of the GThtIMS data in the western boreal region.
For example, in 2001 and 2007 the GllYfMS NDVI decreased, while the MODIS NDVI increased from
the western boreal region. During the late July 2001 and 2007 composite periods, most of the pixels
within the western boreal region were flagged as unreliable in the 1\,10DIS product, likely due to cloud
contamination (Figure 5), while the GIT\1MS product flagged most of these pixels as good quality,
resulting in reduced mean NDVI within the regiono Because of the potential of cloud-contamination
artificially causing a "browning trend" based on GllvIMS NDVr data, we restricted the remaining
analysis to MODIS and Landsat TMiETM+ NDVI valueso

Remote Sens. 2010,2
Figure 4. Mean annual maximum NDVI from MODIS and GIMMS NDVI products within
2 large boreal regions (eastern boreal region = 34.5 million ha, western boreal
region = 19 million ha). The lower NDVI and poor interannual correlation of the GIMMS
Western Boreal NDVI is likely due to clouds reducing the GIMMS NDVI in this region.
> 0 Z K '" ::!: r:: '" ., ::!:
> 0 z K '" ::E c: '" ... ::E
Eastern Boreal Region o.s,------------------------------------------------------,
0.75
'O"""" D'
0.7
0.65 1999 2GGG 2001 2G02
0.79
0.77
0.75
0.73
Q 0.71
0.69
0.67 ._.-0' 0-'-'
0.65 1999 2000 2001 2002
b
2G03 2G()4 2G05 20G6 Year
Western Boreal Region
a
0 .... --.0 ········0.
2003 2004 2005 2006 Year
__ MODIS NDVI • • -0 ••• GIMMS NDVI
,0"'-"'-.0
2007 2GOS 20G9
0
2007 2008 2009
2738

Remote Sens. 2010,2
Figure 5. MODIS and GIMMS mean NDVI by composite periods of 200l. The period of
maximum NDVI is typically from late June to early August in boreal Alaska. Declines in
mean NDVI during this period is likely due to clouds reducing the mean NDVI value.
> 0 Z c: <0 ., :2
0.8
0.75
0.7
0.65
0.6
0.55 E1"
2001 Composite Periods
0._ '-'d
'�'\"
\\:
\�
--.-1.100IS Eastern Boreal --.{]--- GIW.1S Eastern Boreal _'.'OO'S Western Boreal ---0--- G IMI,I S Western Boreal
0.5 +------,----,----,----.,-----.-------, 5/29/2001 6/18/2001 7/812001 7/28/2001 8/1712001 9/6/2001 9/26/2001
Last Day of Composite Period
3.2. Longer Term Trends Based on Landsat TMlETM+ NDVI
2739
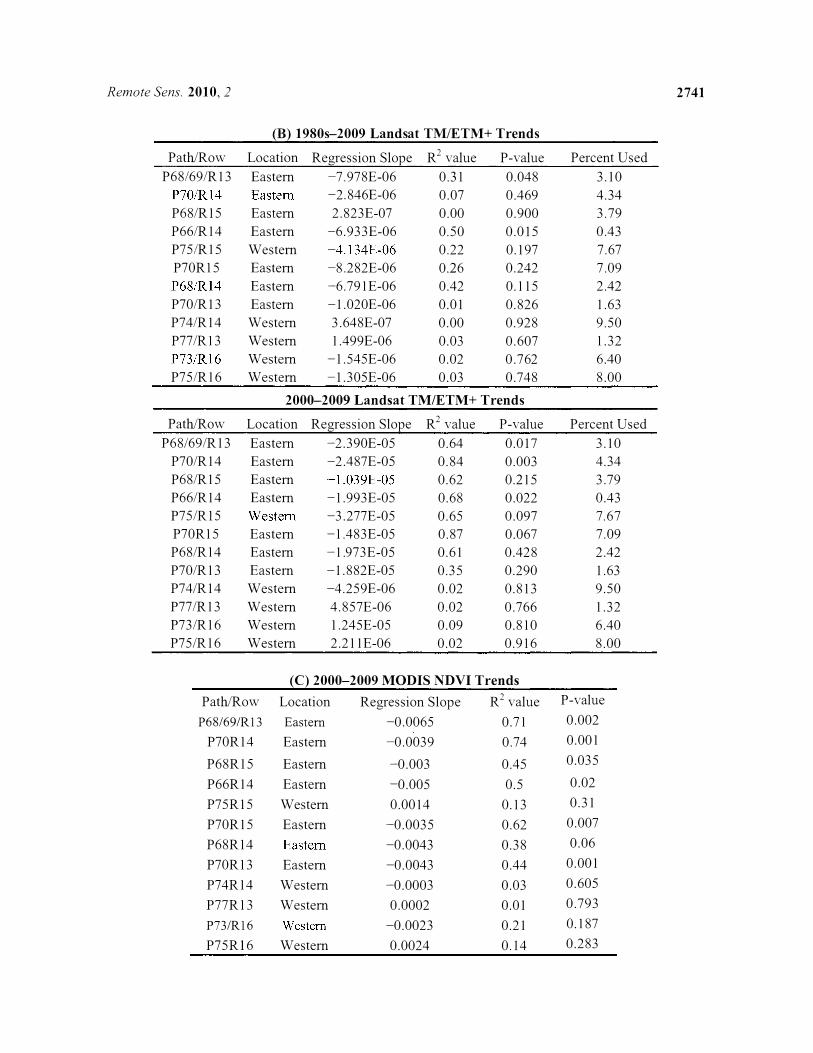
The scenes with the strongest "browning trend" or decline in NDVI were from the eastern boreal
zone where summer growing season is the hottest and driest within boreal Alaska (Table 2; Figure 3),
with no significant trends in western boreal Alaska based on MODIS and TMlETM+ NDVI. The
number of pixels of each Landsat TM/ETM+ image used to calculate NDVI could be as low as one
third of the scene (Table 1). The varying amounts of pixels used was due to high cloud contaminations,
smoke from active forest fires, and omitting previous fire areas. This shifting of usable pixels was
likely a source of substantial variation in the TMlETM+ NDVI time series. To address this issue we
evaluated the pixels that were vegetated and used in every scene in the time series. This left 0.43 to
9.5% of the scene available to be analyzed. As seen in Table 2, there was little change between using
all available pixels and using only reliable pixels from all time periods even though many fewer pixels
were used. The scenes in eastern boreal Alaska that had a strong significant negative trend when
looking at all pixels kept similar trends when assessing only the common pixels.
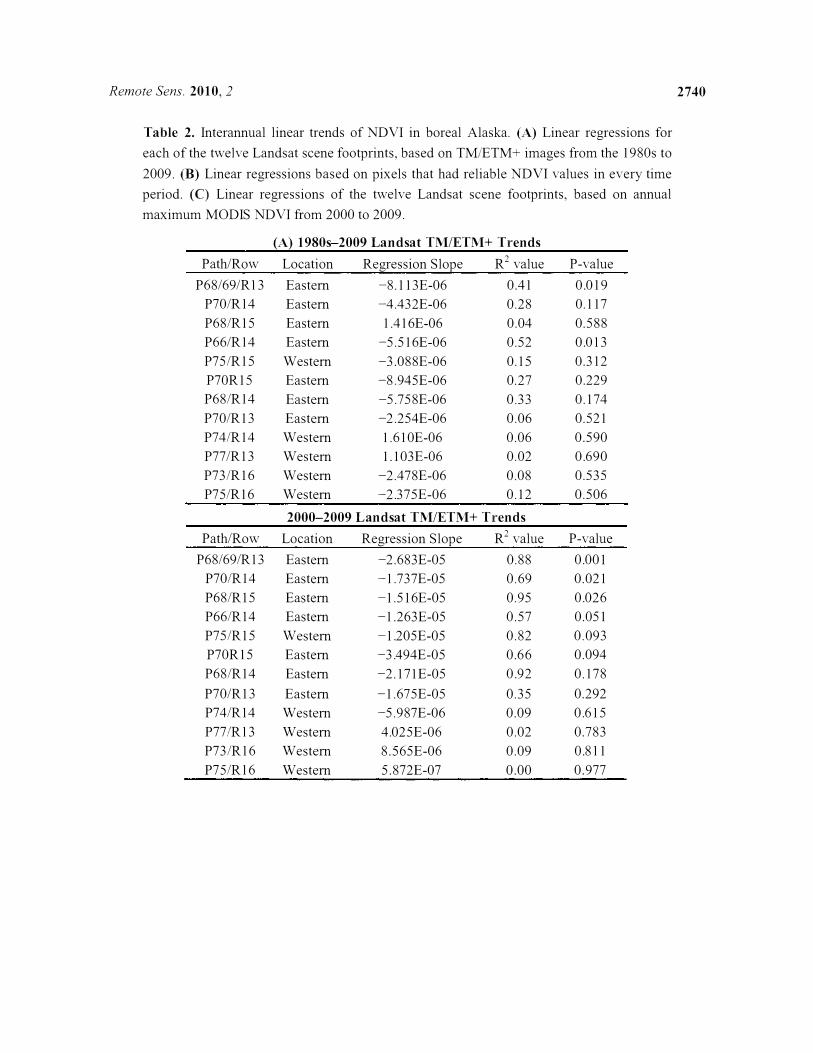
Remote Sens. 2010, 2 2740
Table 2. Interannual linear trends of NDVI in boreal Alaska. (A) Linear regressions for
each of the twelve Landsat scene footprints, based on TMlETM+ images from the 1980s to
2009. (B) Linear regressions based on pixels that had reliable NDVI values in every time
period. (C) Linear regressions of the twelve Landsat scene footprints, based on annual
maximum MODIS NDVI from 2000 to 2009.
(A) 1980s-2009 Landsat TMlETM+ Trends
Path/Row Location Regression Slope R2 value P-value
P68/69/RI3 Eastern -8.113E-06 0.41 0.019
P701R14 Eastern -4.432E-06 0.28 0.117
P681R15 Eastern 1.416E-06 0.04 0.588
P66/R14 Eastern -5.516E-06 0.52 0.013
P751R15 Western -3.088E-06 0.15 0.312
P70R15 Eastern -8.945E-06 0.27 0.229
P681R14 Eastern -5.758E-06 0.33 0.174
P70/R13 Eastern -2.254E-06 0.06 0.521
P741R14 Western 1.610E-06 0.06 0.590
P77/R13 Western 1.103E-06 0.02 0.690
P731R16 Western -2.478E-06 0.08 0.535
P751R16 Western -2.375E-06 0.12 0.506
2000-2009 Landsat TMlETM+ Trends
Path/Row Location Regression Slope R2 value P-value
P68/69/R13 Eastern -2.683E-05 0.88 0.001
P701R14 Eastern -1.737E-05 0.69 0.021
P681R15 Eastern -1.516E-05 0.95 0.026
P661R14 Eastern -1.263E-05 0.57 0.051
P751R15 Western -1.205E-05 0.82 0.093
P70R15 Eastern -3.494E-05 0.66 0.094
P681R14 Eastern -2.17IE-05 0.92 0.178
P70/R13 Eastern -1.675E-05 0.35 0.292
P741R14 Western -5.987E-06 0.09 0.615
P77IR13 Western 4.025E-06 0.02 0.783
P731R16 Western 8.565E-06 0.09 0.811
P751R16 Western 5.872E-07 0.00 0.977
Remote Sens. 2010,2 2741
(B) 1980s-2009 Landsat TlVIIETM+ Trends
Path/Row Location Regression Slope R2 value P-value Percent Used
P68/69/R13 Eastern -7.978E-06 031 0.048 3.10
P70/R14 Eastern -2.846E-06 0.07 0.469 4.34
P68/RlS Eastern 2.823E-07 0.00 0.900 3.79
P66/R14 Eastern -6.933E-06 O.SO O.OlS 0.43
P7S!R15 Western -4.134E-06 0.22 0.197 7,67
P70RI5 Eastern -8.282E-06 026 0.242 7.09
P68/R14 Eastern -6.791E-06 0.42 0.115 2.42
P70/R13 Eastern -1.020E-06 0.01 0.826 1.63
P74/R14 Western 3.648E-07 0.00 0.928 9.50
P77/R13 Western 1.499E-06 0.03 0.607 1.32
P73/R16 Western -1.54SE-06 0.02 0.762 6.40
P75/R16 Western -1.305E-06 0.03 0.748 8.00
2000-2009 Landsat TM/ETM+ Trends
Path/Row Location Regression Slope R2 value P-value Percent Used
P68!69/R13 Eastern -2.390E-05 0.64 0.017 3.10
P70/R14 Eastern -2.487E-05 0.84 0.003 4,34
P68/R15 Eastern -1.039E-05 0.62 0215 3.79
P66/R14 Eastern -1.993E-05 0.68 0.022 0.43
P75/RlS Western -3.277E-05 0.6S 0.097 7.67
P70RI5 Eastern -1.483E-05 0.87 0.067 7.09
P68/R14 Eastern -1.973E-05 0.61 0.428 2.42
P70/R13 Eastern -1.882E-05 0.35 0.290 1.63
P74!R14 Western -4.259E-06 0.02 0.813 9.50
P77/R13 Western 4.857E-06 0.02 0.766 1.32
P73/R16 Western 1.245E-05 0.09 0.810 6.40
P75!R16 Western 2.211E-06 0.02 0.916 8.00
(C) 2000-2009 MODIS NDVI Trends
Path/Row Location Regression Slope R2 value P-value
P68/69/R13 Eastern -0.0065 0.71 0.002
P70R14 Eastern -0.0039 0.74 0.001
P68R15 Eastern -0.003 0.45 0.035
P66R14 Eastern -0.005 0.5 0.02
P75R15 Western 0.0014 0.13 0.31
P70R15 Eastern -0.0035 0.62 0.007
P68R14 Eastern -0.0043 0.38 0.06
P70R13 Eastern -0.0043 0.44 0.001
P74R14 Western -0.0003 0.03 0.605
P77R13 Western 0.0002 0.01 0.793
P73/R16 Western -0.0023 0.21 0.187
P75R16 Western 0.0024 0.14 0.283

Remote Sens. 2010,2 2742
3.3. Pixel-Level Trends Based on MODIS 2000-2009 NDVI
The regional pattern of pixel-level trends based on linear regressions of MODIS 2000-2009 NOV I
also reflects the west to east climatic gradient, with pixels having the strongest declining trend in
NOVI occurring in the warmest, driest region of boreal Alaska (Figure 6).
Figure 6. Pixel-level regression slopes based on 2000-2009 MODIS annual maximum
NOVI values. Only regression slopes with p-values of <0.05 are displayed in this figure.
Areas burned since 1980 were excluded and are portrayed as black polygons in this figure.
3.4. Potential Causes of NDVI Browning Trends
Regressions Slope
_ < -0. 0 1 o -D . 0 1 to - 0 . 00 5 o -D. O � to '" 0.00 5 o -o . oo� to -0.01 _ � ,"O.O l
Although wildfire occurs throughout boreal Alaska, we excluded all areas within bum perimeters
since 1980, and therefore the NOVI trends are not due to wildfires. There are several likely reasons for
the decreasing NOVI trends in boreal Alaska. Based on tree ring and stable isotope data [4], summer
warming in eastern boreal Alaska since the mid-1970s is unprecedented over the past 100 years and
2004 was the warmest summer in the past 200 years. With warmer summers and longer growing

Remote Sens. 2010, 2 2743
seasons, insect life cycles can be shortened and survival increased, leading to major new insect
outbreaks especially in eastern Alaska. For example, since 1989 there has been a dramatic increase in
the area of boreal forest infested especially with the aspen leaf miner, the willow leaf blotch miner and
the spruce budworm (Figure 7).
Figure 7. Examples of growing pest infestations in boreal Alaska. Data acquired from
http://agdc.usgs.gov/. Aspen leaf miner (A) infests primarily quaking aspen and balsam
poplar while willow leaf blotch miner (B) infests all species of willow excluding feltleaf
willow. Spruce budworm (C) infests primarily white spruce, a species also experiencing
widespread regional growth decline based on tree-ring studies.
A
B
iii
350000
300000
60000
50000
;. 40000
� � ;; '" f! <t
C
iii £, "t:I Qj of! :l t; ;; '" Qj .'i
30000 1 20000
120000 ,
100000
80000
60000
40000
20000
0
Aspen Leaf Miner
Willow Leaf Miner
Spruce Budworm
11_11.11
Remote Sens. 2010,2 2744
The appearance of willow ieaf blotch miner and spruce budworm infestations in boreal Alaska is
new and did not occur prior to 1990. The prolonged multi-year infestation of aspen leaf miner is also
new, with previous outbreaks crashing after one or two years.
The aspen leaf miner populiella) hardly existed in Alaska in 2000 but in 2007 it
occupied over 300,000 hectares. The aspen leaf miner can be found feeding on the epidermal cells on
both the top and bottom of aspen leaves and gives the leaves a silver appearance. They do not enter the
mesophyll cells and thus do not significantly impact NIR reflectance. However, damage done to the
leaf epidermis can damage stomates and affect leaf vlater. The trees are able to survive when the aspen
leaf miner is present, but stunted grovvth has been found and highly damaged leaves abscise about four
weeks earlier than unharmed leaves [20]
Willow leaf blotch miner (Micrurapteryx salicifoliella) has also expanded significantly since it was
first found in Alaska in 1991 [21] < Vhllow are broadleaf shrubs that would likely contribute
substantially to the NDVI response in black spruce stands and other wetland types. Eggs are cemented
to the underside of the leaf in late May and hatch into the leaf in early June. They feed on the
mesophyil which would likely cause a decline in NIR reflectance and NDVI by mid-summer.
Spruce budworm (Choristoneura fiiiniferana and Choristoneura orae) outbreaks have been very
distructive across boreal Alaska. Eggs are deposited a few inches from where the new bud will grow
and hatch over a period of a few weeks so that some will hatch when the buds emerge [22l All ages of
trees are suseptible to spruce budwOlID but the more mature spruce stands have a better chance of
survival [23]. Population fluxuations have been observed from 5 to 40 years [22J which is more
retlected in the Figure 7 where the spruce budworm has been present in the late 1980's while the aspen
leaf miner and willow leaf blotch miner "vere not.
Summer water deficits in eastern boreal Alaska have increased in recent years due to increased
evapotranspiration, and decreased regional water balance associated with longer, hotter
summers [4,24l This has likely lead to decreased tree growth due to drought stress. Based on tree-ring
studies, there has been a widespread negative correlation between tree growth and summer temperature
in both white spruce [25] and black spruce [26]. Growth of boreal deciduous species is thought to be
less sensitive to the higher summer temperatures, but more sensitive to drought since the relatively
high transpiration rates in deciduous stands hastens the onset of soil water deficits in early
summer [27l
4. Conclusions
Based on both Landsat TM/ETM-t- and MODIS NDVI, there has been a browning trend in eastern
boreal Alaska. The strongest browning trend occurred in the v/armest, driest region of boreal Alaska
and at the lovvest elevation zones within that region. There are many potential reasons for the observed
browning trend including decreased vegetation production due to temperature-induced drought stress,
reduction of phytomass due to increased insect infestations, and increased tree and shrub mortality due
both to drought stress and insect infestations. There were no significant NDVI trends in western
Alaska. This was likely due to the more maritime climate of this boreal region leading to less impact of
a warming climate and associated drought-stress and increased insect infestations relative to eastern
boreal Alaska.

Remote Sens. 2010, 2 2745
Although Landsat and MODIS NDVI gave similar results, each had unique advantages. Landsat
TMlETM+ with a higher spatial resolution allowed for the elimination of cloud and cloud shadows, as
well as small unvegetated areas. With TM data available since the 1980s, longer-term trends are
possible to document using Landsat TMlETM+ data. Landsat scenes typically had large amounts of
cloud and cloud shadow contamination while the MODIS NDVI product was composited over a
15 day-period and available for several composite periods during each growing season since 2000. The
GIMMS NDVI data were not significantly correlated with MODIS NDVI data for the eastern boreal
region, likely due to cloud contamination substantially influencing GIMMS NDVI values.
Acknowledgements
We thank the anonymous reviewers, G. Juday, and P. Heiser for helping us improve earlier versions
of the manuscript. This research was supported by the Bonanza Creek Long-Term Ecological Research
(LTER) program, funded jointly by NSF grant DEB-0423442 and USDA Forest Service, Pacific
Northwest Research Station grant PNW01-Nl1261952-231.
References and Notes
1. Clegg, B.F.; Hu, F. S. An oxygen-isotope record of Holocene climate change in the south-central
Brooks Range, Alaska. Quat. Sci. Rev. 2010, 29, 928-939.
2. Zhang, J.; Lindsay, R; Steele, M.; Schweiger, A. What drove the dramatic retreat of arctic sea ice
during summer 20017 Geophys. Res. Lett. 2008, 35, L11505, doi: 1O.1029/2008GL034005.
3. Hinzman, L.D.; Bettez, N.D.; Bolton, W.R.; Chapin, F. S. , III.; Dyurgerov, M.; Fastie, C.L.;
Griffith, B.; Hollister, RD.; Hope, A.; Huntington, H.P. Evidence and implications of recent
climate change in northern Alaska and other arctic regions. Climatic Change 2005, 72, 251-298.
4. Barber, V.A.; Juday, G.P.; Finney, B.P.; Wilmking, M. Reconstruction of summer temperatures in
interior Alaska from tree-ring proxies: Evidence for changing synoptic climate regimes. Climatic
Change 2004, 63, 91-120.
5. Wendler, G.; Shulski, M. A century of climate change for Fairbanks, Alaska. Arctic 2009, 62,
295-300.
6. Jia, G.J.; Epstein, H.E.; Walker, D.A. Greening of arctic Alaska, 1981-2001. Geophys. Res. Lett.
2003, 30, 2067, doi: 10.1 029/2003GLO 18268.
7. Tape, K.; Sturm, M.; Racine, C. The evidence for shrub expansion in northern Alaska and the
pan-arctic. Glob. Change BioI. 2006, 12, 686-702.
8. Walker, M.D.; Wahren, C.H.; Hollister, RD. Plant community response to experimental warming
across the tundra biome. Proc. Nat. Acad. Sci. USA 2006, 103, 1342-1346.
9. Zhou, L.; Tucker, c.J.; Kaufmann, RK.; Slayback, D.; Shabanov, N.V.; Myneni, R.B. Variations
in northern vegetation activity inferred from satellite data of vegetation index during 1981 to
1999. J. Geophys. Res. 2001, 106, 0069-20083.
10. Goetz, S.J.; Bunn, A.G.; Fiske, G.J.; Houghton, R.A. Satellite-observed photosynthetic trends
across boreal North America associated with climate and fire disturbance. Proc. Nat. Acad. Sci.
USA 2005, 102, 13521-13525.

Remote Sens. 2010,2 2746
11. Verbyla, D. The greening and browning of Alaska based on 1982-2003 satellite data. Glob. Ecol.
Biogeogr. 2008,1 7,547-555.
12. Alcaraz-Segura, D.; Chuvieco, E.; Epstein, H.E.; Kasischke, E.S.; Trishenko, A. Debating the
greening vs. Browning of the North American boreal forest: Differences between satellite datasets
Glob. Change Bio!. 2010, 160-770 .
13. Stafford, J.M.; Wendler, G.; Curtis, J. Temperature and precipitation of Alaska: 50 year trend
analysis. TheaI'. Appf. Climatol. 2000, 67, 33-44.
14. Tucker, C.J. ; Pinzon, J.E.: Brown, M.E.; Slayback, D.A.; Pak, E.W.; Mahoney, R.; Vermote, ET;
EISaleous, N. An extended AVHRR 8-�'il NDVI data set compatible with MODIS and SPOT
vegetation NDVI. Int. J. Remote Sens. 2005,26,4485-4498.
15. Fensholt, R.; Rasmussen, K.; Nielsen, T.T., Mbow, C Evaluation of earth observation based long
tenn vegetation trends�Intercomparing NDVI time series trend analysis consistency of Sahel
from A VHRR GIM},1S, Tena MODIS and SPOT VGT data. Remote Sens. Environ. 2009, 113,
1886-1898.
16. Huete, A.; Didan, K.;Miura, T.; Rodriguez, E.P.; Gao, X.: Feneira, LG. Overview of the
radiometric and biophysical performance of the MODIS vegetation indices. Remote Sens. Environ.
2002, 83, 195-213.
17. Chander, G.: Markham, B.L., Helder, D.L. Summary of current radiometric calibration
coefficients for Landsat MSS, TM, ETM+, and EO-l ALI sensors. Remote Sens. Environ. 2009,
113, 893-903.
18. Hall, F.G.; Strebel, D.E.: Nickeson, J.E.; Goetz, S.J. Radiometric rectitlcation: toward a common
radiometric response among multi date, multisnesor images. Remote Sens. Environ. 1991, 35,
11-27.
19. Schroeder, T.A.; Cohen, W.B.; Song, c.; Canty, M.J.; Yang, Z. Radiometric correction of
multi-temporal Landsat data for characterization of early successional forest patterns in western
Oregon. Remote Sens. Environ. 2006, 103, 16-26.
20. Wagner, D.; DeFoliart, L.; Doak, P. Irapact of epidermal leaf mining by the aspen leaf miner
(Phyllocnistis populiella) on the growth, physiology, and leaf longevity of quaking aspen.
Oecologia 2008, 157, 259-267.
21. Furniss, M.M.; Holsten, E1-L; Foote, J\r1J.; Bertram, M. Biology of a Willow Leafulotch Miner,
lWicrurapteryx
736-741.
(Lepidoptera: Gracillariidae) in Alaska. Environ. Entomol. 2001, 30,
22. Volney, WJ.A.; Fleming, R.A. Spruce budworm (Choristoneura spp.) biot"ype reactions to forest
and climate characteristics. Glob. Change Biol. 2007, 13, 1630-1643.
23. Werner, R.A.; Raffa, K.F.; Illman, B.L. Dynamics of Phyiophagous Insects and their pathogens in
Alaskan boreal forests. In Alaska's Changing Boreal Forest; Chapin, F.S., ill, Oswood, M.W.,
Van Cleve, K., Viereck, L.A. .. Verbyla, D.L., Eds.; Oxford University Press: New York, NY,
USA, 2006; pp. 134-135.
24. Zhang, K.; Kimball, lS.; Mu, Q.; Jones, L.A.; Goetz, S.J.; Running, S.W. Satellite based analysis
of northern ET trends and associated changes in regional water balance from 1983 to 2005.
J. Hydrol. 2009, 379,92-110.

Remote Sens. 2010,2 2747
25. McGuire, A.D.; Ruess, R.W.; Lloyd, A.; Yarie, J.; Clein, J.S.; Juday, G.P. Vulnerability of white
spruce tree growth in interior Alaska in response to climate variability: dendrochronological,
demographic, and experimental perspectives. Canad J Forest Res. 2010,40, 1197-1209.
26. Wilkimg, M.; Myers-Smith, 1. Changing climate sensitivity of blacks spruce (Picea mariana Mill.)
in a peatland-forest landscape in interior Alaska. Dendrochron 0 logic 2008, 25, 167-175.
27. Kljun, N.; Black, T.A; Griffis, T.J.; Barr, A.G.; Gaumont-Guay, D.; Morgenstern, K.;
McCaughey, J.H.; Nesic, Z. Response of net ecosystem productivity of three boreal forest stands
to drought. Ecosystems 2006, 9, 1128-1144.
© 2010 by the authors; licensee MDPI, Basel, Switzerland. This article is an open access article
distributed under the terms and conditions of the Creative Commons Attribution license
(http://creativecommons.org/licenseslby/3.01).