open access full text article original research regulatory
TRANSCRIPT
© 2012 Carew and Florkowski, publisher and licensee Dove Medical Press Ltd. This is an Open Access article which permits unrestricted noncommercial use, provided the original work is properly cited.
International Journal of Wine Research 2012:4 33–44
International Journal of Wine Research
Regulatory and institutional developments in the Ontario wine and grape industry
Richard Carew1
Wojciech J Florkowski2
1Agriculture and Agri-Food Canada, Pacific Agri-Food Research Centre, Summerland, BC, Canada; 2Department of Agricultural and Applied Economics, University of Georgia, Griffin, GA, USA
Correspondence: Richard Carew Agriculture and Agri-Food Canada, Pacific Agri-Food Research Centre, 4200 Highway 97, Summerland, British Columbia, Canada Tel +1 25 0494 6429 Email [email protected]
Abstract: The Ontario wine industry has undergone major transformative changes over the last
two decades. These have corresponded to the implementation period of the Ontario Vintners
Quality Alliance (VQA) Act in 1999 and the launch of the Winery Strategic Plan, “Poised for
Greatness,” in 2002. While the Ontario wine regions have gained significant recognition in
the production of premium quality wines, the industry is still dominated by a few large wine
companies that produce the bulk of blended or “International Canadian Blends” (ICB), and
multiple small/mid-sized firms that produce principally VQA wines. This paper analyzes how
winery regulations, industry changes, institutions, and innovation have impacted the domestic
production, consumption, and international trade, of premium quality wines. The results of the
study highlight the regional economic impact of the wine industry in the Niagara region, the
success of small/mid-sized boutique wineries producing premium quality wines for the domestic
market, and the physical challenges required to improve domestic VQA wine retail distribution
and bolster the international trade of wine exports. Domestic success has been attributed to the
combination of natural endowments, entrepreneurial talent, established quality standards, and
the adoption of improved viticulture practices.
Keywords: Ontario, wine, quality standards
IntroductionThe Canadian wine industry underwent a major transformation following the enact-
ment of the Canada/US Free Trade Agreement (CUSFTA) in 1989 and the adoption
of policies in the early 1990s to promote the production of premium quality wines.
The Ontario Vintners Quality Alliance (VQA) Act (1999) allowed consumers to
identify quality wines made in Ontario, based on the origin of the grapes, quality of
the vintage, and production methods.1 Such regulatory measures created incentives
for small (,20,000 cases per annum) and mid-sized wineries (20,000–100,000 cases
per annum) to alter production strategies and improve consumer acceptance.
Ontario accounts for the bulk of Canadian premium wine production, produces
90% of the wine, and grows 80% of the harvestable grapes in Canada. This wine region
demonstrates how a minor wine-producing area in the international wine industry can
develop a dynamic, competitive industry within a relatively short time, through the
combination of innovation, entrepreneurial talent, and increased wine tourism.
This paper analyzes the performance of the Ontario wine and grape industries
in terms of a combination of institutional, structural, and market development
factors. The role the Liquor Control Board of Ontario (LCBO), industry organi-
zations, support institutions, and regulations have played in the development and
Dovepress
submit your manuscript | www.dovepress.com
Dovepress 33
O R I G I n A L R E S E A R C H
open access to scientific and medical research
Open Access Full Text Article
http://dx.doi.org/10.2147/IJWR.S33523
In
tern
atio
nal J
ourn
al o
f Win
e R
esea
rch
dow
nloa
ded
from
http
s://w
ww
.dov
epre
ss.c
om/ b
y 54
.70.
40.1
1 on
07-
Dec
-201
8F
or p
erso
nal u
se o
nly.
Powered by TCPDF (www.tcpdf.org)
1 / 1
International Journal of Wine Research 2012:4
enhanced competitiveness of the Ontario wine region is
also considered. The next section reviews the Canadian
and Ontario wine and grape industries, wine distribution,
and industry policies. Government regulations and their
influence on the importation and interprovincial movement
of wine products and effects on direct market sales across
provincial boundaries, are addressed in this section. The
third section examines the Ontario grape industry in terms
of varietals grown and pricing practices. The fourth section
examines the role of technological change and Research
and Development (R&D) institutions in providing improved
viticulture innovations for uptake by the grape and winery
establishments. Concluding remarks are provided in the
final section.
The Canadian wine industryThe Canadian wine industry has a long history, starting in
1927 when the LCBO was instituted to regulate the import
and retail sale of alcoholic beverages, to the establishment of
the 1999 VQA appellation system to develop standards rating
and certifying quality wines.2 In the early days, the Canadian
wine industry was based on the cultivation of hardy native
grape species (eg, Vitis labrusca) and the production of forti-
fied and sweet table wines.3,4 The 1960s were marked by a shift
in Canadians’ consumption habits to drier wines, mainly port
and sherry types.5 The development of the modern Canadian
wine industry commenced with the advent of the CUSFTA
in 1989 and the subsequent adoption of wine regulations to
promote the production of premium quality wines. New wine
regulation resulted in the phase-out of Canada’s protectionist
wine tariff structure, increased plantings of European grape
varieties (V. vinifera), and improved wine quality and global
competitiveness of Canadian wines.5
The Canadian wine industry is small by North American
standards when compared with large US wine regions such
as California and Washington. Canadian manufacturing
wine value-added totaled CAD $593 million (mln) and
total employment of 3567 persons in 2009.6 Since 1998,
the Canadian wine sector has accounted for about 0.3% of
the manufacturing sector with an average annual real GDP
growth rate of 7.6%.7 The expansion of the Canadian winery
industry since the late 1990s is attributed to improved quality
standards and expanded promotion of Canadian wines.2,3
The bulk of the Canadian wine industry is concentrated
in Ontario followed by British Columbia (BC), Quebec,
and Nova Scotia. In 2009, there were 364 Canadian grape
wineries, up from 299 in 2006, with most of them located
in BC and Ontario.8 Canadian wineries, liquor stores, and
agencies reported wine sales valued at CAD $5.8 billion in
2010, up from CAD $2.4 billion in 1998.9 The growth of sales
value exceeded the growth of volume. The corresponding
increase in volume sales is 76%, from 259.9 million liters
(milL) in 1998 to 456.4 milL in 2010. Much of the growth
in wine sales can be attributed to the rising popularity of red
wines; red and rosé wines account for 62% of total volume
sales.10 Import volumes accounted for approximately 50%
of Canadian domestic wine sales with Canadian import vol-
umes increasing by 73% from 203 milL in 1998 to 350 milL
in 2010 (Table 1).11 There has been a slight declining trend
in Canadian bulk wine imports from the US over the last
few years.12 Bulk wines are less expensive to transport and
account for about 40% of Canada wine imports from the
United States.
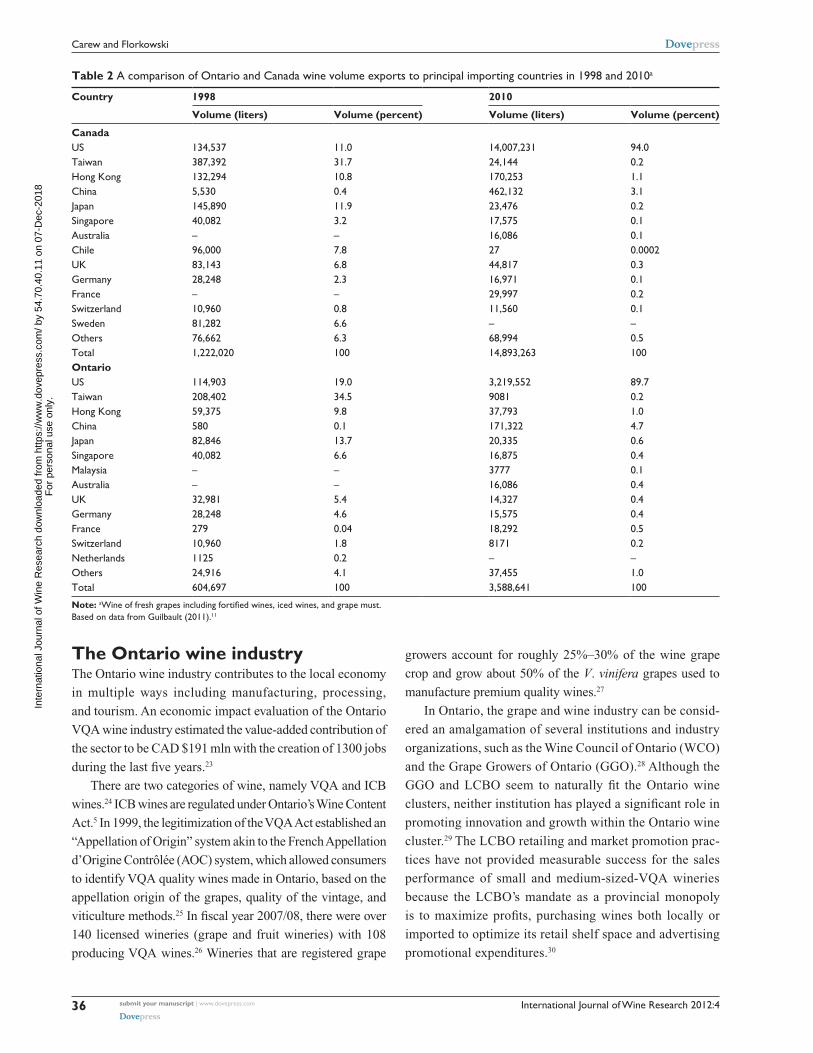
Canada is a relatively small player on the international
wine market with export sales totaling CAD $28 mln in 2010,
up from CAD $6 mln in 1998. As shown in Table 2, Cana-
dian wine exports to the world had increased from 1.2 milL
in 1998 to 14.9 milL by 2010 with the bulk destined for the
United States.11 Wine exports from Ontario represent a large
portion of the country’s total wine exports’ share, which
declined from 49.5% in 1998 to 24.1% in 2010. Although
more wine has been exported in relative and absolute terms
from Ontario and Canada recently, the American market is
slightly less important for Ontario wines (Ontario’s 89.7%
versus Canada’s 94.0%) than Canadian overall wine ship-
ments. The most noticeable difference in wine exports from
Ontario and Canada has been the almost complete cessation
of exports to major Asian markets, with the exception of the
emerging wine market in China. Also, the importance of the
European market has diminished, except for, surprisingly, the
increase in wine exports from Ontario to France. National
export wine programs have been developed by the federal
government to bolster the exports of Canadian wine to selected
foreign markets and US cities.13
Shifting trends in the production of higher quality wines
have impacted the structure of the Canadian wine sector. In
the 1990s, Vincor International Inc (Canada’s largest winery),
consolidated its operations by acquiring vineyards and investing
in the growing of the high-quality premium European grapes
required to produce premium wines.14 Vincor’s expansion
strategy in foreign markets included strengthening its technical
capability by procuring wine-making technology, wine makers,
and vineyard managers from reputable wine-producing
countries. Vincor acquired a portfolio of mid-sized or estate
wineries in Canada along with sales distribution networks
in California. By 2004, Vincor had extended its operations
submit your manuscript | www.dovepress.com
Dovepress
Dovepress
34
Carew and Florkowski
Inte
rnat
iona
l Jou
rnal
of W
ine
Res
earc
h do
wnl
oade
d fr
om h
ttps:
//ww
w.d
ovep
ress
.com
/ by
54.7
0.40
.11
on 0
7-D
ec-2
018
For
per
sona
l use
onl
y.
Powered by TCPDF (www.tcpdf.org)
1 / 1
International Journal of Wine Research 2012:4
globally through the acquisitions of product brands in the US,
New Zealand, Australia, and South Africa.15
Canadian wine demand, distribution and regulationsThe increasing popularity of wines is attributed to the
popularity of red wines. The consumed wine volume per
adult for both red and white wines increased from 11.3 liters
in 1998 to 16.8 liters in 2010.16 Canadian wine consumption
levels are relatively low when compared on a global basis,
but this is likely to be influenced in the near future by the
changing demographic make-up of wine drinkers.17 Most of
the growth in Canadian wine consumption has been associ-
ated with a rapid increase in the consumption of premium
quality wines. Ontario VQA table wine sales increased by
an impressive 78% from CAD $162 mln in 2001/02 to CAD
$288 mln in 2010/11 but in relative terms were outpaced
by the British Columbia VQA wine sales, which increased
by 175% from CAD $70 mln to CAD $193 mln over the
same period.18,19
After Canadian Prohibition was repealed in 1927,
the responsibility to regulate the sale of alcohol was
assigned to provincial governments through the enactment
of Canada’s federal Importation of Intoxicating Liquors
Act in 1928. This Act granted the provincial liquor
control boards monopolistic power over the importation,
inter-provincial shipment, and retailing of wine in
Canada.20 The boards are the only entities that can legally
import wine into Canada and, with the exception of
Alberta, own and operate retail stores.21 Alberta privatized
alcohol retailing in 1993.
In general, the bulk of wine retail sales occur through
Provincial Government-owned and licensed liquor stores.
However, the two large wineries (Vincor, Andrew Peller
Ltd) in Ontario that have brand recognition own most of the
368 private retail stores in Ontario.22 VQA premium quality
wines produced by small/mid-sized wineries are generally
sold through on-site winery stores, off-site private stores, and
restaurants. Inter-provincial wine trade restrictions have lim-
ited business opportunities in Ontario to domestic wine sales
within provincial jurisdictions. It is still illegal, for example,
to ship wine directly to customers across provincial borders
in Canada without going through their liquor control board.
The limited production of small boutique wineries impedes
them from shipping to government retail liquor stores and
restricts Canadians’ access to some of the best wines. The
removal of the inter-provincial trade restrictions would offer
an alternative distribution channel, and allow direct sales
from small wineries to consumers in provinces without a
wine industry.
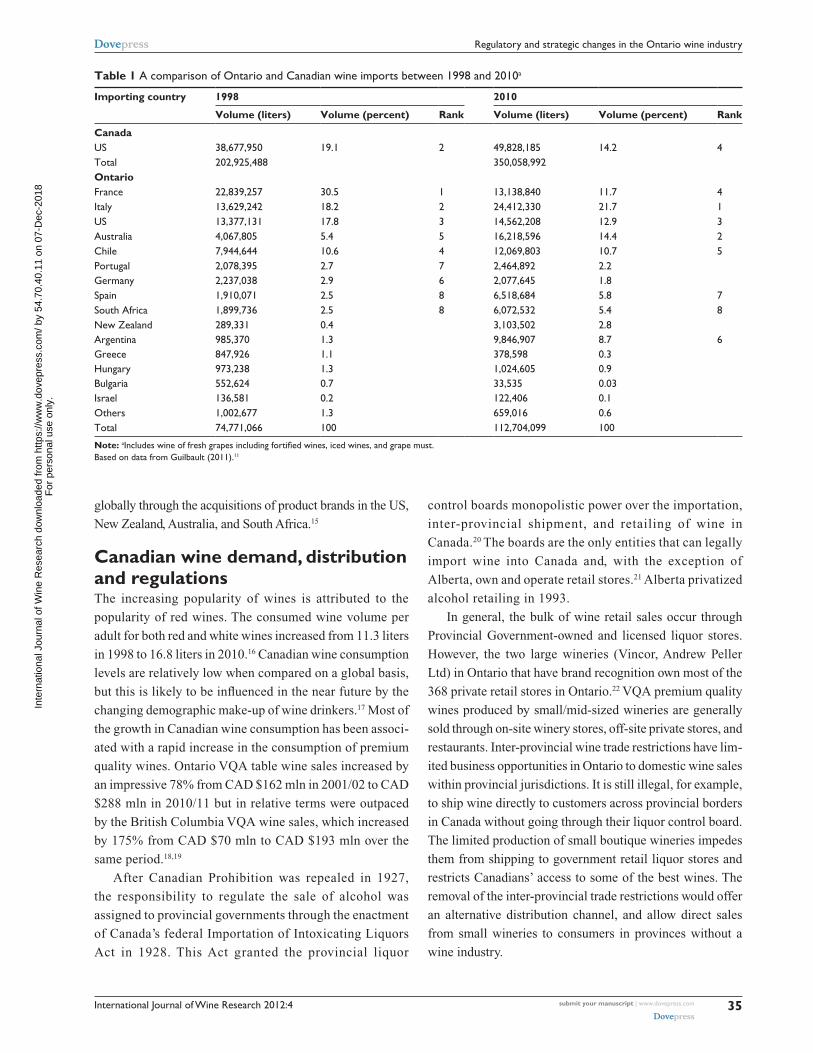
Table 1 A comparison of Ontario and Canadian wine imports between 1998 and 2010a
Importing country 1998 2010
Volume (liters) Volume (percent) Rank Volume (liters) Volume (percent) Rank
CanadaUS 38,677,950 19.1 2 49,828,185 14.2 4Total 202,925,488 350,058,992OntarioFrance 22,839,257 30.5 1 13,138,840 11.7 4Italy 13,629,242 18.2 2 24,412,330 21.7 1US 13,377,131 17.8 3 14,562,208 12.9 3Australia 4,067,805 5.4 5 16,218,596 14.4 2Chile 7,944,644 10.6 4 12,069,803 10.7 5Portugal Germany
2,078,395 2,237,038
2.7 2.9
7 6
2,464,892 2,077,645
2.2 1.8
Spain 1,910,071 2.5 8 6,518,684 5.8 7South Africa 1,899,736 2.5 8 6,072,532 5.4 8new Zealand Argentina Greece Hungary Bulgaria Israel
289,331 985,370 847,926 973,238 552,624 136,581
0.4 1.3 1.1 1.3 0.7 0.2
3,103,502 9,846,907 378,598 1,024,605 33,535 122,406
2.8 8.7 0.3 0.9 0.03 0.1
6
Others 1,002,677 1.3 659,016 0.6Total 74,771,066 100 112,704,099 100
Note: aIncludes wine of fresh grapes including fortified wines, iced wines, and grape must.Based on data from Guilbault (2011).11
submit your manuscript | www.dovepress.com
Dovepress
Dovepress
35
Regulatory and strategic changes in the Ontario wine industry
Inte
rnat
iona
l Jou
rnal
of W
ine
Res
earc
h do
wnl
oade
d fr
om h
ttps:
//ww
w.d
ovep
ress
.com
/ by
54.7
0.40
.11
on 0
7-D
ec-2
018
For
per
sona
l use
onl
y.
Powered by TCPDF (www.tcpdf.org)
1 / 1
International Journal of Wine Research 2012:4
The Ontario wine industryThe Ontario wine industry contributes to the local economy
in multiple ways including manufacturing, processing,
and tourism. An economic impact evaluation of the Ontario
VQA wine industry estimated the value-added contribution of
the sector to be CAD $191 mln with the creation of 1300 jobs
during the last five years.23
There are two categories of wine, namely VQA and ICB
wines.24 ICB wines are regulated under Ontario’s Wine Content
Act.5 In 1999, the legitimization of the VQA Act established an
“Appellation of Origin” system akin to the French Appellation
d’Origine Contrôlée (AOC) system, which allowed consumers
to identify VQA quality wines made in Ontario, based on the
appellation origin of the grapes, quality of the vintage, and
viticulture methods.25 In fiscal year 2007/08, there were over
140 licensed wineries (grape and fruit wineries) with 108
producing VQA wines.26 Wineries that are registered grape
growers account for roughly 25%–30% of the wine grape
crop and grow about 50% of the V. vinifera grapes used to
manufacture premium quality wines.27
In Ontario, the grape and wine industry can be consid-
ered an amalgamation of several institutions and industry
organizations, such as the Wine Council of Ontario (WCO)
and the Grape Growers of Ontario (GGO).28 Although the
GGO and LCBO seem to naturally fit the Ontario wine
clusters, neither institution has played a significant role in
promoting innovation and growth within the Ontario wine
cluster.29 The LCBO retailing and market promotion prac-
tices have not provided measurable success for the sales
performance of small and medium-sized-VQA wineries
because the LCBO’s mandate as a provincial monopoly
is to maximize profits, purchasing wines both locally or
imported to optimize its retail shelf space and advertising
promotional expenditures.30
Table 2 A comparison of Ontario and Canada wine volume exports to principal importing countries in 1998 and 2010a
Country 1998 2010
Volume (liters) Volume (percent) Volume (liters) Volume (percent)
CanadaUS 134,537 11.0 14,007,231 94.0Taiwan 387,392 31.7 24,144 0.2Hong Kong 132,294 10.8 170,253 1.1China 5,530 0.4 462,132 3.1Japan 145,890 11.9 23,476 0.2Singapore 40,082 3.2 17,575 0.1Australia – – 16,086 0.1Chile 96,000 7.8 27 0.0002UK 83,143 6.8 44,817 0.3Germany 28,248 2.3 16,971 0.1France – – 29,997 0.2Switzerland 10,960 0.8 11,560 0.1Sweden 81,282 6.6 – –Others 76,662 6.3 68,994 0.5Total 1,222,020 100 14,893,263 100OntarioUS 114,903 19.0 3,219,552 89.7Taiwan 208,402 34.5 9081 0.2Hong Kong 59,375 9.8 37,793 1.0China 580 0.1 171,322 4.7Japan 82,846 13.7 20,335 0.6Singapore 40,082 6.6 16,875 0.4Malaysia – – 3777 0.1Australia – – 16,086 0.4UK 32,981 5.4 14,327 0.4Germany 28,248 4.6 15,575 0.4France 279 0.04 18,292 0.5Switzerland 10,960 1.8 8171 0.2netherlands 1125 0.2 – –Others 24,916 4.1 37,455 1.0Total 604,697 100 3,588,641 100
Note: aWine of fresh grapes including fortified wines, iced wines, and grape must.Based on data from Guilbault (2011).11
submit your manuscript | www.dovepress.com
Dovepress
Dovepress
36
Carew and Florkowski
Inte
rnat
iona
l Jou
rnal
of W
ine
Res
earc
h do
wnl
oade
d fr
om h
ttps:
//ww
w.d
ovep
ress
.com
/ by
54.7
0.40
.11
on 0
7-D
ec-2
018
For
per
sona
l use
onl
y.
Powered by TCPDF (www.tcpdf.org)
1 / 1
International Journal of Wine Research 2012:4
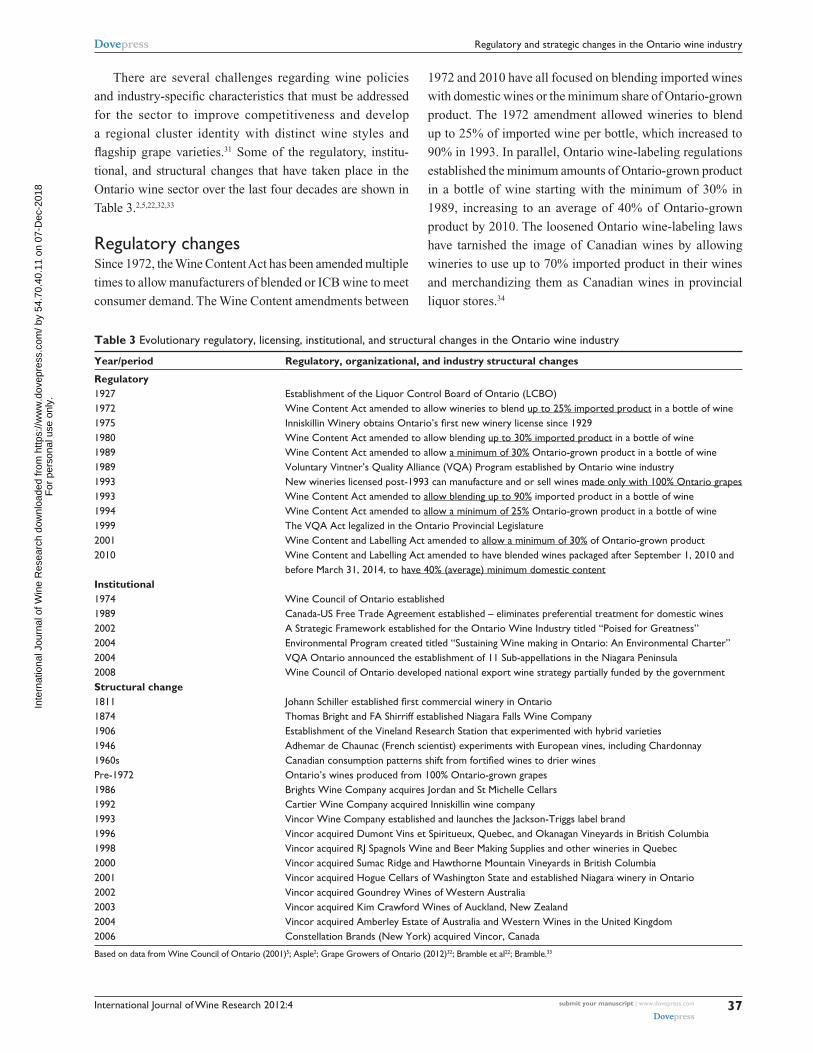
There are several challenges regarding wine policies
and industry-specific characteristics that must be addressed
for the sector to improve competitiveness and develop
a regional cluster identity with distinct wine styles and
flagship grape varieties.31 Some of the regulatory, institu-
tional, and structural changes that have taken place in the
Ontario wine sector over the last four decades are shown in
Table 3.2,5,22,32,33
Regulatory changesSince 1972, the Wine Content Act has been amended multiple
times to allow manufacturers of blended or ICB wine to meet
consumer demand. The Wine Content amendments between
1972 and 2010 have all focused on blending imported wines
with domestic wines or the minimum share of Ontario-grown
product. The 1972 amendment allowed wineries to blend
up to 25% of imported wine per bottle, which increased to
90% in 1993. In parallel, Ontario wine-labeling regulations
established the minimum amounts of Ontario-grown product
in a bottle of wine starting with the minimum of 30% in
1989, increasing to an average of 40% of Ontario-grown
product by 2010. The loosened Ontario wine-labeling laws
have tarnished the image of Canadian wines by allowing
wineries to use up to 70% imported product in their wines
and merchandizing them as Canadian wines in provincial
liquor stores.34
Table 3 Evolutionary regulatory, licensing, institutional, and structural changes in the Ontario wine industry
Year/period Regulatory, organizational, and industry structural changes
Regulatory1927 Establishment of the Liquor Control Board of Ontario (LCBO)1972 Wine Content Act amended to allow wineries to blend up to 25% imported product in a bottle of wine1975 Inniskillin Winery obtains Ontario’s first new winery license since 19291980 Wine Content Act amended to allow blending up to 30% imported product in a bottle of wine1989 Wine Content Act amended to allow a minimum of 30% Ontario-grown product in a bottle of wine1989 Voluntary Vintner’s Quality Alliance (VQA) Program established by Ontario wine industry1993 new wineries licensed post-1993 can manufacture and or sell wines made only with 100% Ontario grapes1993 Wine Content Act amended to allow blending up to 90% imported product in a bottle of wine1994 Wine Content Act amended to allow a minimum of 25% Ontario-grown product in a bottle of wine1999 The VQA Act legalized in the Ontario Provincial Legislature2001 Wine Content and Labelling Act amended to allow a minimum of 30% of Ontario-grown product2010 Wine Content and Labelling Act amended to have blended wines packaged after September 1, 2010 and
before March 31, 2014, to have 40% (average) minimum domestic contentInstitutional1974 Wine Council of Ontario established1989 Canada-US Free Trade Agreement established – eliminates preferential treatment for domestic wines2002 A Strategic Framework established for the Ontario Wine Industry titled “Poised for Greatness”2004 Environmental Program created titled “Sustaining Wine making in Ontario: An Environmental Charter”2004 VQA Ontario announced the establishment of 11 Sub-appellations in the niagara Peninsula2008 Wine Council of Ontario developed national export wine strategy partially funded by the governmentStructural change1811 Johann Schiller established first commercial winery in Ontario1874 Thomas Bright and FA Shirriff established niagara Falls Wine Company1906 Establishment of the Vineland Research Station that experimented with hybrid varieties1946 Adhemar de Chaunac (French scientist) experiments with European vines, including Chardonnay1960s Canadian consumption patterns shift from fortified wines to drier winesPre-1972 Ontario’s wines produced from 100% Ontario-grown grapes1986 Brights Wine Company acquires Jordan and St Michelle Cellars1992 Cartier Wine Company acquired Inniskillin wine company1993 Vincor Wine Company established and launches the Jackson-Triggs label brand1996 Vincor acquired Dumont Vins et Spiritueux, Quebec, and Okanagan Vineyards in British Columbia1998 Vincor acquired RJ Spagnols Wine and Beer Making Supplies and other wineries in Quebec2000 Vincor acquired Sumac Ridge and Hawthorne Mountain Vineyards in British Columbia2001 Vincor acquired Hogue Cellars of Washington State and established niagara winery in Ontario2002 Vincor acquired Goundrey Wines of Western Australia2003 Vincor acquired Kim Crawford Wines of Auckland, new Zealand2004 Vincor acquired Amberley Estate of Australia and Western Wines in the United Kingdom2006 Constellation Brands (new York) acquired Vincor, Canada
Based on data from Wine Council of Ontario (2001)5; Asple2; Grape Growers of Ontario (2012)32; Bramble et al22; Bramble.33
submit your manuscript | www.dovepress.com
Dovepress
Dovepress
37
Regulatory and strategic changes in the Ontario wine industry
Inte
rnat
iona
l Jou
rnal
of W
ine
Res
earc
h do
wnl
oade
d fr
om h
ttps:
//ww
w.d
ovep
ress
.com
/ by
54.7
0.40
.11
on 0
7-D
ec-2
018
For
per
sona
l use
onl
y.
Powered by TCPDF (www.tcpdf.org)
1 / 1
International Journal of Wine Research 2012:4
The Wine Content Act has not benefitted the marketing
of VQA wines by small/mid-sized wineries because wine
policies have facilitated the production of ICB wines by
large wineries for sale in LCBO retail stores, reducing the
available shelf sale for VQA wines. Less than 2.5% of the
LCBO monopoly wine product listings are dedicated to
VQA wines, while ICB wines dominate the limited shelf
space allocated to domestic Canadian wines in LCBO retail
stores.35 It appears that the VQA Act that allowed product
differentiation based on wine quality and region of origin
did not improve access to the LCBO distribution system
and therefore wine tourism offers an alternative distribution
channel, although of limited capacity.
Institutional developmentsInstitutional changes that affected the structure of the
wine industry include the 1974 establishment of the
Wine Council of Ontario. In 1989, the CUSFTA elimi-
nated the preferential treatment of domestic wines and
increased the competition from imported wines on the
Ontario market. These institutional changes created the vol-
untary VQA Program in 1989, which was legalized in 1999
by the Ontario Provincial Legislature. In 2004, the VQA
Ontario undertook additional action to further differentiate
Ontario wines from imported wines and established 11 sub-
appellations in the Niagara Peninsula.
Structural changesStructural changes were characterized by acquisitions and
mergers of multiple wineries. The first major acquisition
took place in 1986 followed by the acquisition of Inniskillin
by Cartier Wine Company in 1992. In 2006, Vincor itself
was purchased by Constellation Brands of New York. The
interests of 90 small/mid-sized wineries are represented by
the WCO, which is a non-profit trade association. Effective
November 2009, two large wineries and four smaller ones
with a significant VQA portfolio left the WCO to form the
Winery and Grower Alliance of Ontario.36
Wine marketing strategies have differed markedly
between the small/mid-sized and large wineries.37 Large
wineries have tended to augment their competitive advantage
by carrying a wider range of product brands and package con-
tainers that appeal to consumers of varying tastes, prefer-
ences, and price points.
Ontario wine demand and distributionBetween 1998 and 2010, Ontario wines sales increased by
116% from CAD $875 mln to CAD $1.8 billion.9 Most of
the domestic wine sales increases were attributed to higher
import volumes, which increased by 51% from 75 milL in
1998 to 113 milL in 2010, as illustrated in Table 1.11 There
has been a noticeable shift in the New World volume wine
supply to the Ontario market, particularly from countries such
as Australia, Chile, and Argentina. Among Old World wine
producers, Italy is the only wine supplier that significantly
increased its supply to the Ontario market. Ontario consumers
are drinking more wine and wine sales per adult increased
from 10.5 liters in 1998 to 14.3 liters in 2010.16 These rapid
increases in wine sales per adult are partly attributed to higher
incomes, with the Ontario median family income averaging
CAD $65,414 over the 2005–2009 period.38
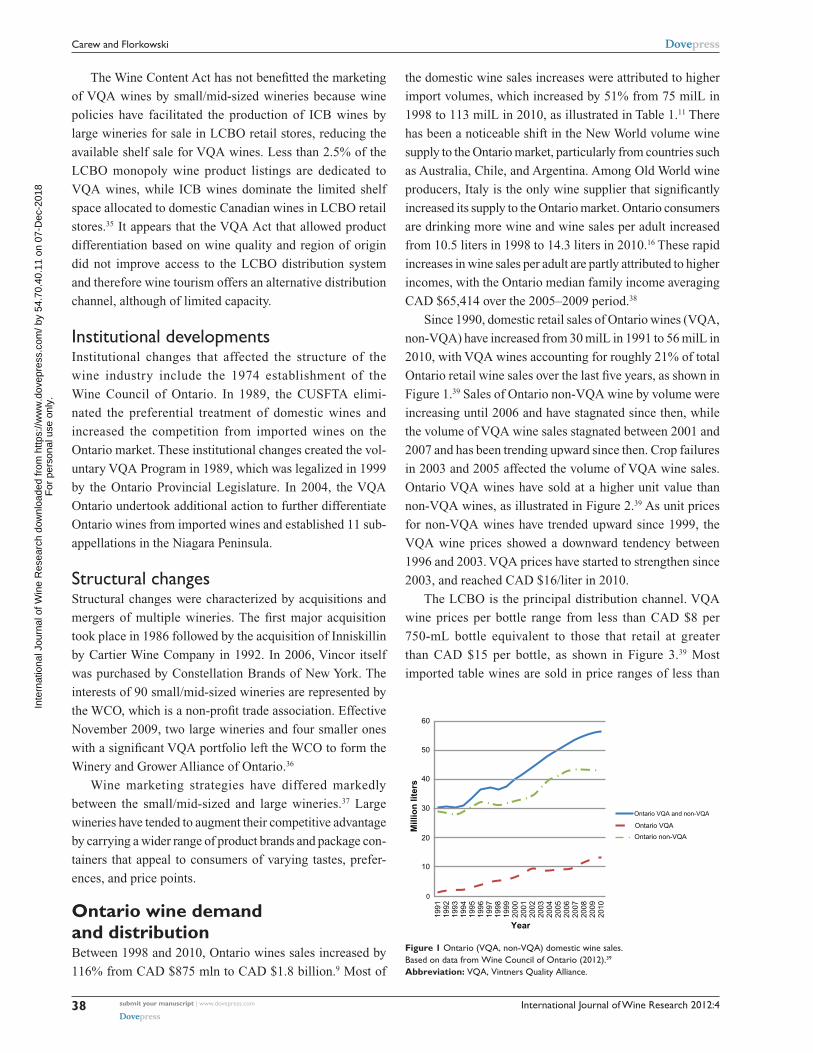
Since 1990, domestic retail sales of Ontario wines (VQA,
non-VQA) have increased from 30 milL in 1991 to 56 milL in
2010, with VQA wines accounting for roughly 21% of total
Ontario retail wine sales over the last five years, as shown in
Figure 1.39 Sales of Ontario non-VQA wine by volume were
increasing until 2006 and have stagnated since then, while
the volume of VQA wine sales stagnated between 2001 and
2007 and has been trending upward since then. Crop failures
in 2003 and 2005 affected the volume of VQA wine sales.
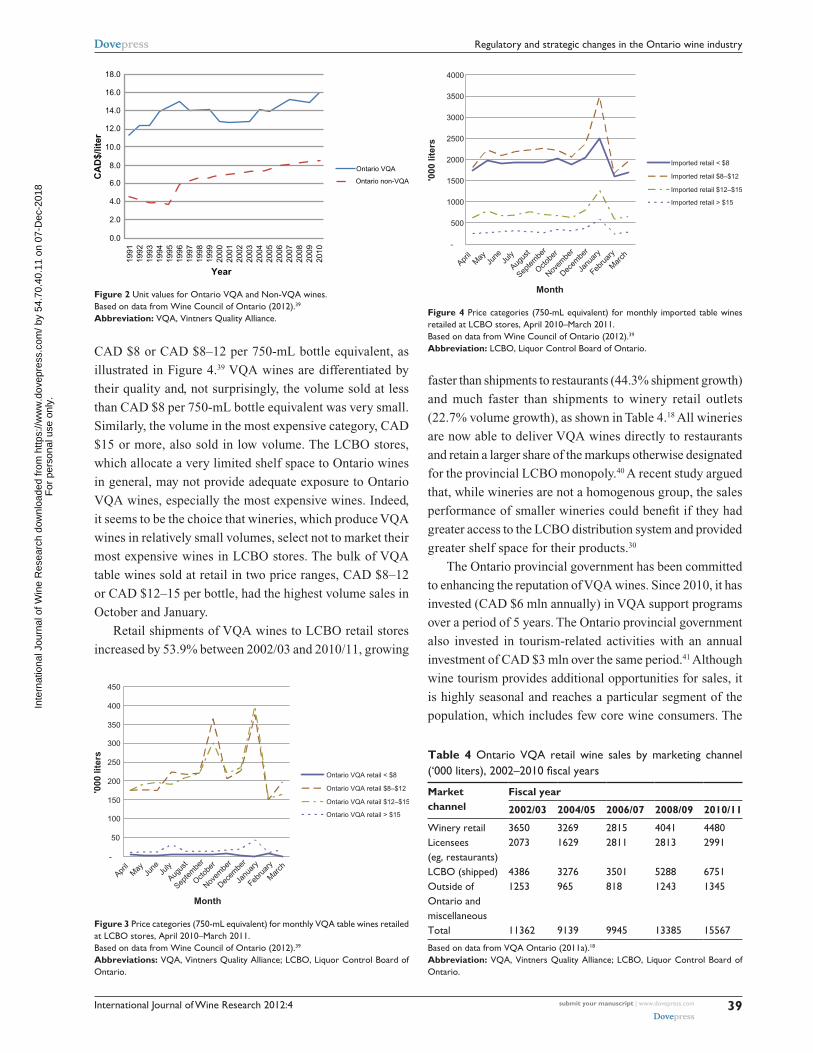
Ontario VQA wines have sold at a higher unit value than
non-VQA wines, as illustrated in Figure 2.39 As unit prices
for non-VQA wines have trended upward since 1999, the
VQA wine prices showed a downward tendency between
1996 and 2003. VQA prices have started to strengthen since
2003, and reached CAD $16/liter in 2010.
The LCBO is the principal distribution channel. VQA
wine prices per bottle range from less than CAD $8 per
750-mL bottle equivalent to those that retail at greater
than CAD $15 per bottle, as shown in Figure 3.39 Most
imported table wines are sold in price ranges of less than
60
Ontario VQA and non-VQA
Ontario VQA
Ontario non-VQA
50
40
30
20
10
0
Year
Mill
ion
lite
rs
1991
1992
1993
1994
1995
1996
1997
1998
1999
2000
2001
2002
2003
2004
2005
2006
2007
2008
2009
2010
Figure 1 Ontario (VQA, non-VQA) domestic wine sales.Based on data from Wine Council of Ontario (2012).39
Abbreviation: VQA, Vintners Quality Alliance.
submit your manuscript | www.dovepress.com
Dovepress
Dovepress
38
Carew and Florkowski
Inte
rnat
iona
l Jou
rnal
of W
ine
Res
earc
h do
wnl
oade
d fr
om h
ttps:
//ww
w.d
ovep
ress
.com
/ by
54.7
0.40
.11
on 0
7-D
ec-2
018
For
per
sona
l use
onl
y.
Powered by TCPDF (www.tcpdf.org)
1 / 1
International Journal of Wine Research 2012:4
CAD $8 or CAD $8–12 per 750-mL bottle equivalent, as
illustrated in Figure 4.39 VQA wines are differentiated by
their quality and, not surprisingly, the volume sold at less
than CAD $8 per 750-mL bottle equivalent was very small.
Similarly, the volume in the most expensive category, CAD
$15 or more, also sold in low volume. The LCBO stores,
which allocate a very limited shelf space to Ontario wines
in general, may not provide adequate exposure to Ontario
VQA wines, especially the most expensive wines. Indeed,
it seems to be the choice that wineries, which produce VQA
wines in relatively small volumes, select not to market their
most expensive wines in LCBO stores. The bulk of VQA
table wines sold at retail in two price ranges, CAD $8–12
or CAD $12–15 per bottle, had the highest volume sales in
October and January.
Retail shipments of VQA wines to LCBO retail stores
increased by 53.9% between 2002/03 and 2010/11, growing
faster than shipments to restaurants (44.3% shipment growth)
and much faster than shipments to winery retail outlets
(22.7% volume growth), as shown in Table 4.18 All wineries
are now able to deliver VQA wines directly to restaurants
and retain a larger share of the markups otherwise designated
for the provincial LCBO monopoly.40 A recent study argued
that, while wineries are not a homogenous group, the sales
performance of smaller wineries could benefit if they had
greater access to the LCBO distribution system and provided
greater shelf space for their products.30
The Ontario provincial government has been committed
to enhancing the reputation of VQA wines. Since 2010, it has
invested (CAD $6 mln annually) in VQA support programs
over a period of 5 years. The Ontario provincial government
also invested in tourism-related activities with an annual
investment of CAD $3 mln over the same period.41 Although
wine tourism provides additional opportunities for sales, it
is highly seasonal and reaches a particular segment of the
population, which includes few core wine consumers. The
Ontario VQA
Ontario non-VQA
18.0
16.0
14.0
12.0
10.0
8.0
6.0
4.0
2.0
0.0
Year
CA
D$/
liter
1991
1992
1993
1994
1995
1996
1997
1998
1999
2000
2001
2002
2003
2004
2005
2006
2007
2008
2009
2010
Figure 2 Unit values for Ontario VQA and non-VQA wines.Based on data from Wine Council of Ontario (2012).39
Abbreviation: VQA, Vintners Quality Alliance.
-
50
100
150
200
250
300
350
400
450
'000
lite
rs
Ontario VQA retail < $8
Ontario VQA retail $8–$12
Ontario VQA retail $12–$15
Ontario VQA retail > $15
April
May
June
July
Augus
t
Septe
mbe
r
Octobe
r
Novem
ber
Decem
ber
Janu
ary
Febru
ary
Mar
ch
Month
Figure 3 Price categories (750-mL equivalent) for monthly VQA table wines retailed at LCBO stores, April 2010–March 2011.Based on data from Wine Council of Ontario (2012).39
Abbreviations: VQA, Vintners Quality Alliance; LCBO, Liquor Control Board of Ontario.
-
500
1000
1500
2000
2500
3000
3500
4000
April
May
June
July
Augus
t
Septe
mbe
r
Octobe
r
Novem
ber
Decem
ber
Janu
ary
Febru
ary
Mar
ch
Month
'000
lite
rs
Imported retail < $8
Imported retail $8–$12
Imported retail $12–$15
Imported retail > $15
Figure 4 Price categories (750-mL equivalent) for monthly imported table wines retailed at LCBO stores, April 2010–March 2011.Based on data from Wine Council of Ontario (2012).39
Abbreviation: LCBO, Liquor Control Board of Ontario.
Table 4 Ontario VQA retail wine sales by marketing channel (‘000 liters), 2002–2010 fiscal years
Market channel
Fiscal year
2002/03 2004/05 2006/07 2008/09 2010/11
Winery retail 3650 3269 2815 4041 4480Licensees (eg, restaurants)
2073 1629 2811 2813 2991
LCBO (shipped) 4386 3276 3501 5288 6751Outside of Ontario and miscellaneous
1253 965 818 1243 1345
Total 11362 9139 9945 13385 15567
Based on data from VQA Ontario (2011a).18
Abbreviation: VQA, Vintners Quality Alliance; LCBO, Liquor Control Board of Ontario.
submit your manuscript | www.dovepress.com
Dovepress
Dovepress
39
Regulatory and strategic changes in the Ontario wine industry
Inte
rnat
iona
l Jou
rnal
of W
ine
Res
earc
h do
wnl
oade
d fr
om h
ttps:
//ww
w.d
ovep
ress
.com
/ by
54.7
0.40
.11
on 0
7-D
ec-2
018
For
per
sona
l use
onl
y.
Powered by TCPDF (www.tcpdf.org)
1 / 1
International Journal of Wine Research 2012:4
value of VQA impact on wine tourism accounted for about
CAD $10 mln in 2010.23
To reduce the foreign grape content in Canadian wines
and enhance the reputation of Canadian-produced wines,
the Ontario government announced regulatory changes that
encourage local wineries to manufacture wines entirely from
domestic grapes and strengthened labeling regulations to
allow consumers to differentiate Canadian-content wines
from blended wines.42
Ontario wine grape productionOntario has four principal designated viticulture areas
(DVAs): Niagara Peninsula, Lake Erie North Shore, Pelee
Island, and Prince Edward County. The Niagara Peninsula is
Ontario’s largest viticulture area and accounts for over 90%
of Ontario’s grape volume production.26
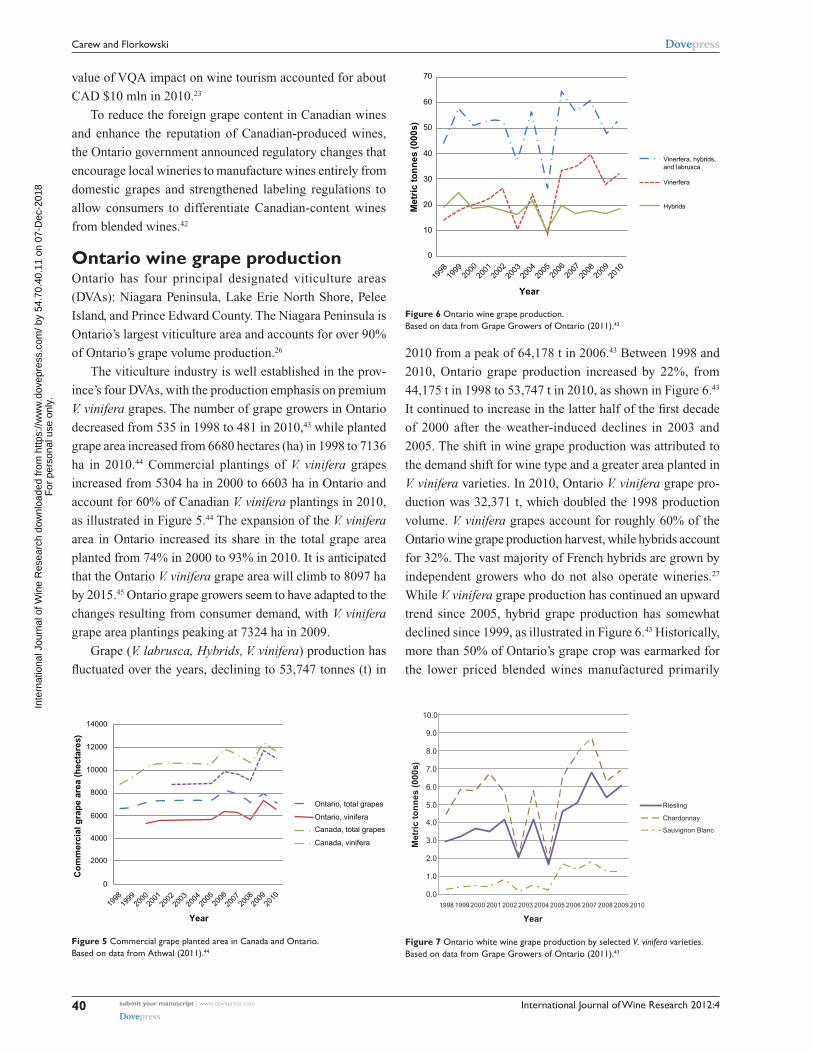
The viticulture industry is well established in the prov-
ince’s four DVAs, with the production emphasis on premium
V. vinifera grapes. The number of grape growers in Ontario
decreased from 535 in 1998 to 481 in 2010,43 while planted
grape area increased from 6680 hectares (ha) in 1998 to 7136
ha in 2010.44 Commercial plantings of V. vinifera grapes
increased from 5304 ha in 2000 to 6603 ha in Ontario and
account for 60% of Canadian V. vinifera plantings in 2010,
as illustrated in Figure 5.44 The expansion of the V. vinifera
area in Ontario increased its share in the total grape area
planted from 74% in 2000 to 93% in 2010. It is anticipated
that the Ontario V. vinifera grape area will climb to 8097 ha
by 2015.45 Ontario grape growers seem to have adapted to the
changes resulting from consumer demand, with V. vinifera
grape area plantings peaking at 7324 ha in 2009.
Grape (V. labrusca, Hybrids, V. vinifera) production has
fluctuated over the years, declining to 53,747 tonnes (t) in
2010 from a peak of 64,178 t in 2006.43 Between 1998 and
2010, Ontario grape production increased by 22%, from
44,175 t in 1998 to 53,747 t in 2010, as shown in Figure 6.43
It continued to increase in the latter half of the first decade
of 2000 after the weather-induced declines in 2003 and
2005. The shift in wine grape production was attributed to
the demand shift for wine type and a greater area planted in
V. vinifera varieties. In 2010, Ontario V. vinifera grape pro-
duction was 32,371 t, which doubled the 1998 production
volume. V. vinifera grapes account for roughly 60% of the
Ontario wine grape production harvest, while hybrids account
for 32%. The vast majority of French hybrids are grown by
independent growers who do not also operate wineries.27
While V. vinifera grape production has continued an upward
trend since 2005, hybrid grape production has somewhat
declined since 1999, as illustrated in Figure 6.43 Historically,
more than 50% of Ontario’s grape crop was earmarked for
the lower priced blended wines manufactured primarily
14000
Ontario, total grapes
Ontario, vinifera
Canada, total grapes
Canada, vinifera
12000
10000
8000
6000
4000
2000
Year
Co
mm
erci
al g
rap
e ar
ea (
hec
tare
s)
0
1998
1999
2000
2001
2002
2003
2004
2005
2006
2007
2008
2009
2010
Figure 5 Commercial grape planted area in Canada and Ontario.Based on data from Athwal (2011).44
0.0
1.0
2.0
3.0
4.0
5.0
6.0
7.0
8.0
9.0
10.0
1998 1999 2000 2001 2002 2003 2004 2005 2006 2007 2008 2009 2010
Year
Met
ric
ton
nes
(00
0s)
Riesling
Chardonnay
Sauvignon Blanc
Figure 7 Ontario white wine grape production by selected V. vinifera varieties.Based on data from Grape Growers of Ontario (2011).43
70
60
50
40
30
20
Vinerfera, hybrids,and labrusca
10
Year
Met
ric
ton
nes
(00
0s)
0
1998
1999
2000
2001
2002
2003
2004
2005
2006
2007
2008
2009
2010
Vinerfera
Hybrids
Figure 6 Ontario wine grape production.Based on data from Grape Growers of Ontario (2011).43
submit your manuscript | www.dovepress.com
Dovepress
Dovepress
40
Carew and Florkowski
Inte
rnat
iona
l Jou
rnal
of W
ine
Res
earc
h do
wnl
oade
d fr
om h
ttps:
//ww
w.d
ovep
ress
.com
/ by
54.7
0.40
.11
on 0
7-D
ec-2
018
For
per
sona
l use
onl
y.
Powered by TCPDF (www.tcpdf.org)
1 / 1
International Journal of Wine Research 2012:4
by the larger wineries.46 However, this trend has changed
over the last few years, with greater plantings of V. vinifera
grape varieties for the premium VQA wine market.
The top V. vinifera grape varietals grown in Ontario, in
terms of production volume, were “Chardonnay,” “ Riesling,”
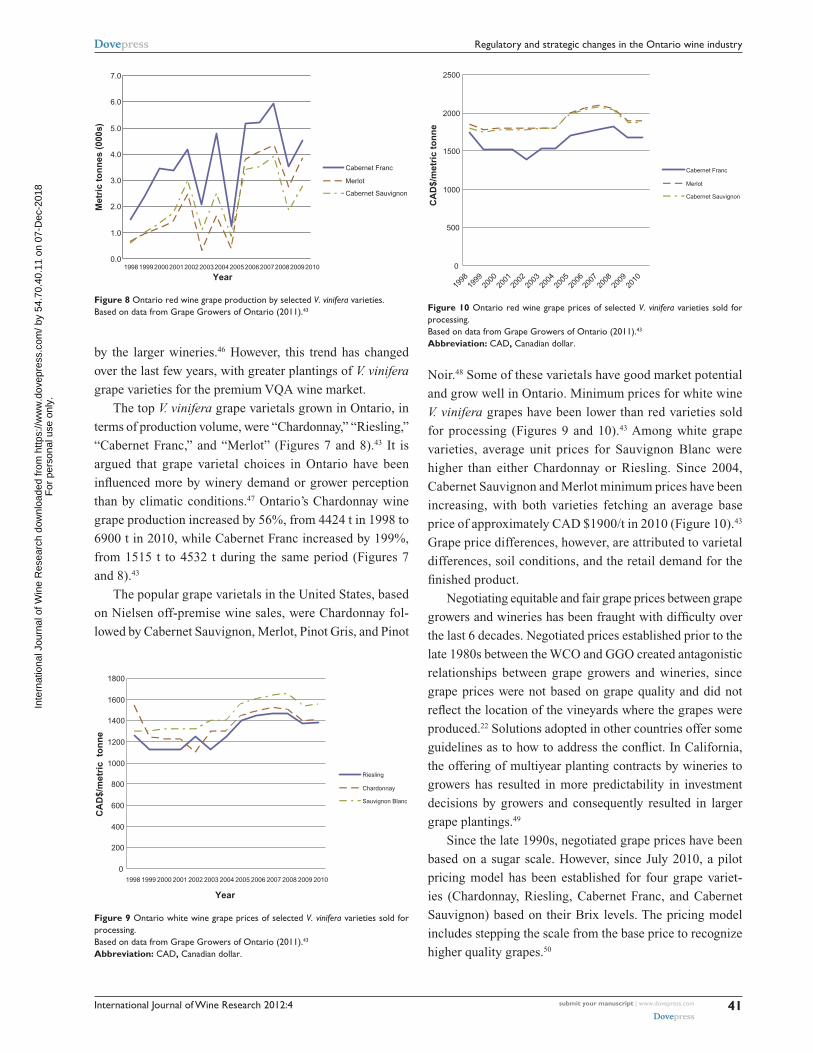
“Cabernet Franc,” and “Merlot” (Figures 7 and 8).43 It is
argued that grape varietal choices in Ontario have been
influenced more by winery demand or grower perception
than by climatic conditions.47 Ontario’s Chardonnay wine
grape production increased by 56%, from 4424 t in 1998 to
6900 t in 2010, while Cabernet Franc increased by 199%,
from 1515 t to 4532 t during the same period (Figures 7
and 8).43
The popular grape varietals in the United States, based
on Nielsen off-premise wine sales, were Chardonnay fol-
lowed by Cabernet Sauvignon, Merlot, Pinot Gris, and Pinot
Noir.48 Some of these varietals have good market potential
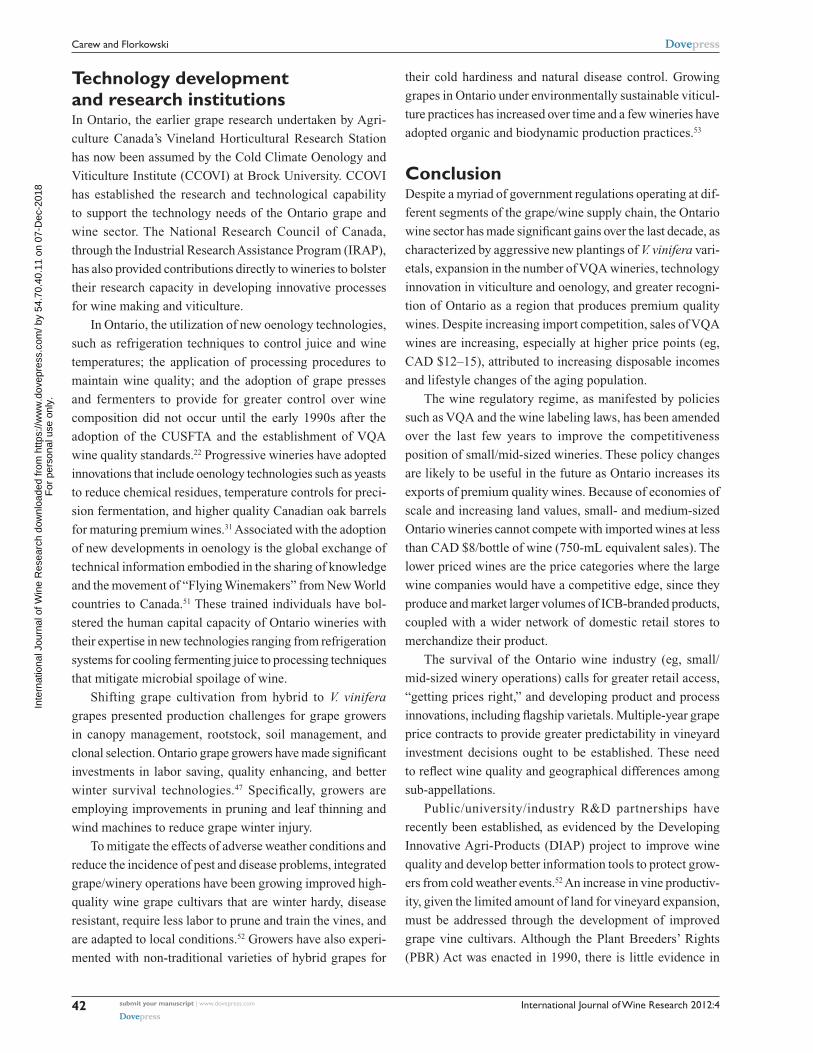
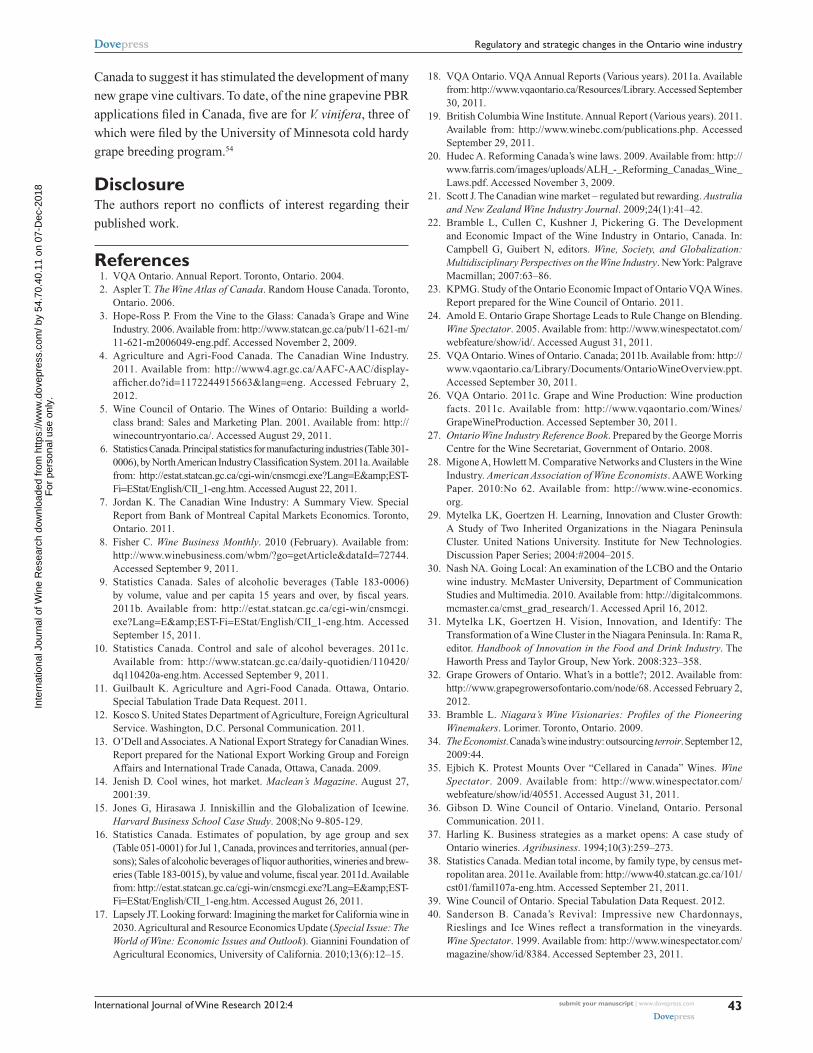
and grow well in Ontario. Minimum prices for white wine
V. vinifera grapes have been lower than red varieties sold
for processing (Figures 9 and 10).43 Among white grape
varieties, average unit prices for Sauvignon Blanc were
higher than either Chardonnay or Riesling. Since 2004,
Cabernet Sauvignon and Merlot minimum prices have been
increasing, with both varieties fetching an average base
price of approximately CAD $1900/t in 2010 (Figure 10).43
Grape price differences, however, are attributed to varietal
differences, soil conditions, and the retail demand for the
finished product.
Negotiating equitable and fair grape prices between grape
growers and wineries has been fraught with difficulty over
the last 6 decades. Negotiated prices established prior to the
late 1980s between the WCO and GGO created antagonistic
relationships between grape growers and wineries, since
grape prices were not based on grape quality and did not
reflect the location of the vineyards where the grapes were
produced.22 Solutions adopted in other countries offer some
guidelines as to how to address the conflict. In California,
the offering of multiyear planting contracts by wineries to
growers has resulted in more predictability in investment
decisions by growers and consequently resulted in larger
grape plantings.49
Since the late 1990s, negotiated grape prices have been
based on a sugar scale. However, since July 2010, a pilot
pricing model has been established for four grape variet-
ies (Chardonnay, Riesling, Cabernet Franc, and Cabernet
Sauvignon) based on their Brix levels. The pricing model
includes stepping the scale from the base price to recognize
higher quality grapes.50
0.01998199920002001200220032004200520062007200820092010
1.0
2.0
3.0
4.0
5.0
6.0
7.0
Year
Met
ric
ton
nes
(00
0s)
Cabernet Franc
Merlot
Cabernet Sauvignon
Figure 8 Ontario red wine grape production by selected V. vinifera varieties.Based on data from Grape Growers of Ontario (2011).43
0
200
400
600
800
1000
1200
1400
1600
1800
Year
CA
D$/
met
ric
to
nn
e
Riesling
Chardonnay
Sauvignon Blanc
1998 1999 2000 2001 2002 2003 2004 2005 2006 2007 2008 2009 2010
Figure 9 Ontario white wine grape prices of selected V. vinifera varieties sold for processing.Based on data from Grape Growers of Ontario (2011).43
Abbreviation: CAD, Canadian dollar.
0
500
1000
1500
2000
2500
1998
1999
2000
2001
2002
2003
2004
2005
2006
2007
2008
2009
2010
CA
D$/
met
ric
ton
ne
Cabernet Franc
Merlot
Cabernet Sauvignon
Figure 10 Ontario red wine grape prices of selected V. vinifera varieties sold for processing.Based on data from Grape Growers of Ontario (2011).43
Abbreviation: CAD, Canadian dollar.
submit your manuscript | www.dovepress.com
Dovepress
Dovepress
41
Regulatory and strategic changes in the Ontario wine industry
Inte
rnat
iona
l Jou
rnal
of W
ine
Res
earc
h do
wnl
oade
d fr
om h
ttps:
//ww
w.d
ovep
ress
.com
/ by
54.7
0.40
.11
on 0
7-D
ec-2
018
For
per
sona
l use
onl
y.
Powered by TCPDF (www.tcpdf.org)
1 / 1
International Journal of Wine Research 2012:4
Technology development and research institutionsIn Ontario, the earlier grape research undertaken by Agri-
culture Canada’s Vineland Horticultural Research Station
has now been assumed by the Cold Climate Oenology and
Viticulture Institute (CCOVI) at Brock University. CCOVI
has established the research and technological capability
to support the technology needs of the Ontario grape and
wine sector. The National Research Council of Canada,
through the Industrial Research Assistance Program (IRAP),
has also provided contributions directly to wineries to bolster
their research capacity in developing innovative processes
for wine making and viticulture.
In Ontario, the utilization of new oenology technologies,
such as refrigeration techniques to control juice and wine
temperatures; the application of processing procedures to
maintain wine quality; and the adoption of grape presses
and fermenters to provide for greater control over wine
composition did not occur until the early 1990s after the
adoption of the CUSFTA and the establishment of VQA
wine quality standards.22 Progressive wineries have adopted
innovations that include oenology technologies such as yeasts
to reduce chemical residues, temperature controls for preci-
sion fermentation, and higher quality Canadian oak barrels
for maturing premium wines.31 Associated with the adoption
of new developments in oenology is the global exchange of
technical information embodied in the sharing of knowledge
and the movement of “Flying Winemakers” from New World
countries to Canada.51 These trained individuals have bol-
stered the human capital capacity of Ontario wineries with
their expertise in new technologies ranging from refrigeration
systems for cooling fermenting juice to processing techniques
that mitigate microbial spoilage of wine.
Shifting grape cultivation from hybrid to V. vinifera
grapes presented production challenges for grape growers
in canopy management, rootstock, soil management, and
clonal selection. Ontario grape growers have made significant
investments in labor saving, quality enhancing, and better
winter survival technologies.47 Specifically, growers are
employing improvements in pruning and leaf thinning and
wind machines to reduce grape winter injury.
To mitigate the effects of adverse weather conditions and
reduce the incidence of pest and disease problems, integrated
grape/winery operations have been growing improved high-
quality wine grape cultivars that are winter hardy, disease
resistant, require less labor to prune and train the vines, and
are adapted to local conditions.52 Growers have also experi-
mented with non-traditional varieties of hybrid grapes for
their cold hardiness and natural disease control. Growing
grapes in Ontario under environmentally sustainable viticul-
ture practices has increased over time and a few wineries have
adopted organic and biodynamic production practices.53
ConclusionDespite a myriad of government regulations operating at dif-
ferent segments of the grape/wine supply chain, the Ontario
wine sector has made significant gains over the last decade, as
characterized by aggressive new plantings of V. vinifera vari-
etals, expansion in the number of VQA wineries, technology
innovation in viticulture and oenology, and greater recogni-
tion of Ontario as a region that produces premium quality
wines. Despite increasing import competition, sales of VQA
wines are increasing, especially at higher price points (eg,
CAD $12–15), attributed to increasing disposable incomes
and lifestyle changes of the aging population.
The wine regulatory regime, as manifested by policies
such as VQA and the wine labeling laws, has been amended
over the last few years to improve the competitiveness
position of small/mid-sized wineries. These policy changes
are likely to be useful in the future as Ontario increases its
exports of premium quality wines. Because of economies of
scale and increasing land values, small- and medium-sized
Ontario wineries cannot compete with imported wines at less
than CAD $8/bottle of wine (750-mL equivalent sales). The
lower priced wines are the price categories where the large
wine companies would have a competitive edge, since they
produce and market larger volumes of ICB-branded products,
coupled with a wider network of domestic retail stores to
merchandize their product.
The survival of the Ontario wine industry (eg, small/
mid-sized winery operations) calls for greater retail access,
“getting prices right,” and developing product and process
innovations, including flagship varietals. Multiple-year grape
price contracts to provide greater predictability in vineyard
investment decisions ought to be established. These need
to reflect wine quality and geographical differences among
sub-appellations.
Public/university/industry R&D partnerships have
recently been established, as evidenced by the Developing
Innovative Agri-Products (DIAP) project to improve wine
quality and develop better information tools to protect grow-
ers from cold weather events.52 An increase in vine productiv-
ity, given the limited amount of land for vineyard expansion,
must be addressed through the development of improved
grape vine cultivars. Although the Plant Breeders’ Rights
(PBR) Act was enacted in 1990, there is little evidence in
submit your manuscript | www.dovepress.com
Dovepress
Dovepress
42
Carew and Florkowski
Inte
rnat
iona
l Jou
rnal
of W
ine
Res
earc
h do
wnl
oade
d fr
om h
ttps:
//ww
w.d
ovep
ress
.com
/ by
54.7
0.40
.11
on 0
7-D
ec-2
018
For
per
sona
l use
onl
y.
Powered by TCPDF (www.tcpdf.org)
1 / 1
International Journal of Wine Research 2012:4
Canada to suggest it has stimulated the development of many
new grape vine cultivars. To date, of the nine grapevine PBR
applications filed in Canada, five are for V. vinifera, three of
which were filed by the University of Minnesota cold hardy
grape breeding program.54
DisclosureThe authors report no conflicts of interest regarding their
published work.
References 1. VQA Ontario. Annual Report. Toronto, Ontario. 2004. 2. Aspler T. The Wine Atlas of Canada. Random House Canada. Toronto,
Ontario. 2006. 3. Hope-Ross P. From the Vine to the Glass: Canada’s Grape and Wine
Industry. 2006. Available from: http://www.statcan.gc.ca/pub/11-621-m/ 11-621-m2006049-eng.pdf. Accessed November 2, 2009.
4. Agriculture and Agri-Food Canada. The Canadian Wine Industry. 2011. Available from: http://www4.agr.gc.ca/AAFC-AAC/display-afficher.do?id=1172244915663&lang=eng. Accessed February 2, 2012.
5. Wine Council of Ontario. The Wines of Ontario: Building a world-class brand: Sales and Marketing Plan. 2001. Available from: http://winecountryontario.ca/. Accessed August 29, 2011.
6. Statistics Canada. Principal statistics for manufacturing industries (Table 301-0006), by North American Industry Classification System. 2011a. Available from: http://estat.statcan.gc.ca/cgi-win/cnsmcgi.exe?Lang=E&EST-Fi=EStat/English/CII_1-eng.htm. Accessed August 22, 2011.
7. Jordan K. The Canadian Wine Industry: A Summary View. Special Report from Bank of Montreal Capital Markets Economics. Toronto, Ontario. 2011.
8. Fisher C. Wine Business Monthly. 2010 (February). Available from: http://www.winebusiness.com/wbm/?go=getArticle&dataId=72744. Accessed September 9, 2011.
9. Statistics Canada. Sales of alcoholic beverages (Table 183-0006) by volume, value and per capita 15 years and over, by fiscal years. 2011b. Available from: http://estat.statcan.gc.ca/cgi-win/cnsmcgi.exe?Lang=E&EST-Fi=EStat/English/CII_1-eng.htm. Accessed September 15, 2011.
10. Statistics Canada. Control and sale of alcohol beverages. 2011c. Available from: http://www.statcan.gc.ca/daily-quotidien/110420/dq110420a-eng.htm. Accessed September 9, 2011.
11. Guilbault K. Agriculture and Agri-Food Canada. Ottawa, Ontario. Special Tabulation Trade Data Request. 2011.
12. Kosco S. United States Department of Agriculture, Foreign Agricultural Service. Washington, D.C. Personal Communication. 2011.
13. O’Dell and Associates. A National Export Strategy for Canadian Wines. Report prepared for the National Export Working Group and Foreign Affairs and International Trade Canada, Ottawa, Canada. 2009.
14. Jenish D. Cool wines, hot market. Maclean’s Magazine. August 27, 2001:39.
15. Jones G, Hirasawa J. Inniskillin and the Globalization of Icewine. Harvard Business School Case Study. 2008;No 9-805-129.
16. Statistics Canada. Estimates of population, by age group and sex (Table 051-0001) for Jul 1, Canada, provinces and territories, annual (per-sons); Sales of alcoholic beverages of liquor authorities, wineries and brew-eries (Table 183-0015), by value and volume, fiscal year. 2011d. Available from: http://estat.statcan.gc.ca/cgi-win/cnsmcgi.exe?Lang=E&EST-Fi=EStat/English/CII_1-eng.htm. Accessed August 26, 2011.
17. Lapsely JT. Looking forward: Imagining the market for California wine in 2030. Agricultural and Resource Economics Update (Special Issue: The World of Wine: Economic Issues and Outlook). Giannini Foundation of Agricultural Economics, University of California. 2010;13(6):12–15.
18. VQA Ontario. VQA Annual Reports (Various years). 2011a. Available from: http://www.vqaontario.ca/Resources/Library. Accessed September 30, 2011.
19. British Columbia Wine Institute. Annual Report (Various years). 2011. Available from: http://www.winebc.com/publications.php. Accessed September 29, 2011.
20. Hudec A. Reforming Canada’s wine laws. 2009. Available from: http://www.farris.com/images/uploads/ALH_-_Reforming_Canadas_Wine_Laws.pdf. Accessed November 3, 2009.
21. Scott J. The Canadian wine market – regulated but rewarding. Australia and New Zealand Wine Industry Journal. 2009;24(1):41–42.
22. Bramble L, Cullen C, Kushner J, Pickering G. The Development and Economic Impact of the Wine Industry in Ontario, Canada. In: Campbell G, Guibert N, editors. Wine, Society, and Globalization: Multidisciplinary Perspectives on the Wine Industry. New York: Palgrave Macmillan; 2007:63–86.
23. KPMG. Study of the Ontario Economic Impact of Ontario VQA Wines. Report prepared for the Wine Council of Ontario. 2011.
24. Amold E. Ontario Grape Shortage Leads to Rule Change on Blending. Wine Spectator. 2005. Available from: http://www.winespectatot.com/webfeature/show/id/. Accessed August 31, 2011.
25. VQA Ontario. Wines of Ontario. Canada; 2011b. Available from: http://www.vqaontario.ca/Library/Documents/OntarioWineOverview.ppt. Accessed September 30, 2011.
26. VQA Ontario. 2011c. Grape and Wine Production: Wine production facts. 2011c. Available from: http://www.vqaontario.com/Wines/GrapeWineProduction. Accessed September 30, 2011.
27. Ontario Wine Industry Reference Book. Prepared by the George Morris Centre for the Wine Secretariat, Government of Ontario. 2008.
28. Migone A, Howlett M. Comparative Networks and Clusters in the Wine Industry. American Association of Wine Economists. AAWE Working Paper. 2010:No 62. Available from: http://www.wine-economics.org.
29. Mytelka LK, Goertzen H. Learning, Innovation and Cluster Growth: A Study of Two Inherited Organizations in the Niagara Peninsula Cluster. United Nations University. Institute for New Technologies. Discussion Paper Series; 2004:#2004–2015.
30. Nash NA. Going Local: An examination of the LCBO and the Ontario wine industry. McMaster University, Department of Communication Studies and Multimedia. 2010. Available from: http://digitalcommons.mcmaster.ca/cmst_grad_research/1. Accessed April 16, 2012.
31. Mytelka LK, Goertzen H. Vision, Innovation, and Identify: The Transformation of a Wine Cluster in the Niagara Peninsula. In: Rama R, editor. Handbook of Innovation in the Food and Drink Industry. The Haworth Press and Taylor Group, New York. 2008:323–358.
32. Grape Growers of Ontario. What’s in a bottle?; 2012. Available from: http://www.grapegrowersofontario.com/node/68. Accessed February 2, 2012.
33. Bramble L. Niagara’s Wine Visionaries: Profiles of the Pioneering Winemakers. Lorimer. Toronto, Ontario. 2009.
34. The Economist. Canada’s wine industry: outsourcing terroir. September 12, 2009:44.
35. Ejbich K. Protest Mounts Over “Cellared in Canada” Wines. Wine Spectator. 2009. Available from: http://www.winespectator.com/webfeature/show/id/40551. Accessed August 31, 2011.
36. Gibson D. Wine Council of Ontario. Vineland, Ontario. Personal Communication. 2011.
37. Harling K. Business strategies as a market opens: A case study of Ontario wineries. Agribusiness. 1994;10(3):259–273.
38. Statistics Canada. Median total income, by family type, by census met-ropolitan area. 2011e. Available from: http://www40.statcan.gc.ca/101/cst01/famil107a-eng.htm. Accessed September 21, 2011.
39. Wine Council of Ontario. Special Tabulation Data Request. 2012. 40. Sanderson B. Canada’s Revival: Impressive new Chardonnays,
Rieslings and Ice Wines reflect a transformation in the vineyards. Wine Spectator. 1999. Available from: http://www.winespectator.com/magazine/show/id/8384. Accessed September 23, 2011.
submit your manuscript | www.dovepress.com
Dovepress
Dovepress
43
Regulatory and strategic changes in the Ontario wine industry
Inte
rnat
iona
l Jou
rnal
of W
ine
Res
earc
h do
wnl
oade
d fr
om h
ttps:
//ww
w.d
ovep
ress
.com
/ by
54.7
0.40
.11
on 0
7-D
ec-2
018
For
per
sona
l use
onl
y.
Powered by TCPDF (www.tcpdf.org)
1 / 1
International Journal of Wine Research
Publish your work in this journal
Submit your manuscript here: http://www.dovepress.com/international-journal-of-wine-research-journal
The International Journal of Wine Research is an international, peer-reviewed open-access, online journal focusing on all sci-entific aspects of wine, including: vine growing; wine elabora-tion; human interaction with wine; and health aspects of wine. The journal provides an open access platform for the reporting
of evidence based studies on these topics. The manuscript management system is completely online and includes a very quick and fair peer-review system, which is all easy to use. Visit http://www.dovepress.com/testimonials.php to read real quotes from some of our published authors.
International Journal of Wine Research 2012:4
41. Ontario Government. Ministry News – Supporting Ontario’s Wine and Grape Industry, McGuinty Government Strengthens VQA Wines. 2010. Available from: http://www.sse.gov.on.ca/mcs/en/Pages/News_28 Apr2010.aspx. Accessed September 8, 2011.
42. Wingrove J. Ontario raises a toast to local wine with new labelling, tax measures. The Globe and Mail. October 14, 2009:A4.
43. Grape Growers of Ontario. Annual Reports (Various years). St Catharines, Ontario; 2011. Available from: http://www. grapegrowersofontario.com/annual-reports. Accessed April 16, 2012.
44. Athwal R. Statistics Canada, Horticulture Division. Ottawa, Ontario. Special Tabulation Data Request for Grape Area in Ontario and Canada, 1998–2010. Personal Communication. 2011.
45. Canadian Grape and Wine Research Strategy. Championing a Winning Example for Canadian Agriculture. 2007. Available from: http://www. canadianvintners.com/news/documents/GrapeandWineResearch Strategy2007.pdf. Accessed September 22, 2009.
46. Wine Council of Ontario. The Ontario Wine Industry 2003 Year in Review. Vineland, Ontario. 2003.
47. Mussell A, Stiefelmeyer K, Oginskyy A. Schmidt C, Seguin B. 2010. Aligning the Ontario Grape Supply and Demand: A Varietal Plan for the Grape and Wine Industry. Final Report prepared by the George Morris Centre for the Ontario Grape Growers Association. 2010. Available from: http://www.grapegrowersofontario.com/sites/default/files/pdf/Varietal%20Plan%20Executive%20Summary%20Dec-10.pdf. Accessed January 20, 2012.
48. The Wine Economist. Retail wine sales: Big versus hot. 2010. Available from: http://wineeconomist.com/2010/11/30/retail-wine-sales-big-versus-hot-hot-hot/. Accessed January 25, 2012.
49. Goodhue RE, Heien DM, Lee H, Sumner DA. Contract use widespread in wine-grape industry. California Agriculture. 2002;56(3):97–102.
50. Grape Growers of Ontario. Newsletter. Jul 2010; 6:1–8. Available from: http://www.grapegrowersofontario.com. Accessed December 12, 2011.
51. The Wine Economist. Flying winemakers and the globalization of wine. 2008. Available from: http://wineeconomist.com/2008/07/20/ flying-winemakers-and-the-glocalization-of-wine/. Accessed February 1, 2012.
52. Combe MJ. Grape Growers of Ontario. St Catharines, Ontario. Personal Communication; 2012.
53. Kwong LMK, Cyr D, Kushner J, Ogwang T. A semiparametric hedonic pricing model of Ontario wines. Canad ian Journal of Agricultural Economics. 2011;59:361–381.
54. Canadian Food Inspection Agency (CFIA). Plant Breeders’ Rights Database; 2012. Available from: http://www.inspection.gc.ca/english/plaveg/pbrpov/cropreport/grae.shtml. Accessed February 10, 2012.
submit your manuscript | www.dovepress.com
Dovepress
Dovepress
Dovepress
44
Carew and Florkowski
Inte
rnat
iona
l Jou
rnal
of W
ine
Res
earc
h do
wnl
oade
d fr
om h
ttps:
//ww
w.d
ovep
ress
.com
/ by
54.7
0.40
.11
on 0
7-D
ec-2
018
For
per
sona
l use
onl
y.
Powered by TCPDF (www.tcpdf.org)
1 / 1