open access assessment of seismic hazard of territory on ... · 1center of geophysical...
TRANSCRIPT

30 The Open Construction and Building Technology Journal, 2011, 5, 30-40
1874-8368/11 2011 Bentham Open
Open Access
Assessment of Seismic Hazard of Territory on Basis of Modern Methods of Detailed Zoning and Seismic Microzonation
V.B. Zaalishvili*,1 and E.A. Rogozhin
2
1Center of Geophysical Investigations of VSC RAS and RNO-A, Russia;
2Shmidt Institute of Physics of the Earth of RAS,
Russia
Abstract: The new complex method of seismic hazard assessment resulted in creation of the probabilistic maps of seismic
microzonation is presented in this paper. To study seismicity and analyze seismic hazard of the territory the following da-
tabases are formed: macroseismic, seismologic databases and the database of possible seismic source zones (or potential
seismic sources - PSS) as well. Using modern methods (over-regional method of IPE RAS - Russia) and computer pro-
grams (SEISRisk-3 – USA) in GIS technologies there were designed some probabilistic maps of seismic hazard for the
Republic North Ossetia-Alania in intensity units (MSK-64) at a scale of 1:200 000 with exceedance probability being of
2%, 5%, 10% for a period of 50 years, which correspond to recurrence period of 2500, 1000, 500 years, correspondingly.
Moreover, first the probabilistic maps of seismic hazard were made in acceleration units for the territory of Russia. The
map of 5% probability is likely to be used for the large scale building, i.e. the major type of constructions, whereas the
map of 2% probability should be used for high responsibility construction only. The approach based on physical mecha-
nisms of the source is supposed to design the synthesized accelerograms generated using real seismic records interpreta-
tion.
For each of the zoning subject the probabilistic map of the seismic microzonation with location of different calculated in-
tensity (7, 8, 9, 9*) zones is developed (the zones, composed by clay soils of fluid consistency, which can be characterized
by liquefaction at quite strong influences, are marked by the index 9*). The maps in accelerations units show the similar
results.
The complex approach based on the latest achievements in engineering seismology, can significantly increase the ade-
quacy or foundation for assessments and reduce the inaccuracy in earthquake protected design and construction.
Realization of investigations on mapping of seismic hazards such as detailed seismic zoning (DSZ) based on the most ad-
vanced field research methods and analysis of every subject of the Northern Caucasus separately on a scale of 1:200 000
gives the possibility to merge a bit unavailable, at first glance, schemes into geologically and geophysically quite reason-
able map of DSZ for the Northern Caucasus with equal scale system of the source zones.
Keywords: Seismic hazard, probability map, seismicity, soil, microzonation.
INTRODUCTION
In 2007 we compiled out the maps of detailed seismic zoning for the total area of Republic North Ossetia-Alania (RNO-A) in scale 1:200000 with exceedance probability for a period of 50 years (standard time of building or construc-tion durability!) with 2%, 5%, 10%, which corresponds to reiteration of maximum probable earthquake for a period of 500, 1000 and 2500 years. The longer the period of time is the higher the level of possible intensity is. For a period of 500 years only a small part will be occupied by the zone of 7 intensity earthquake, for a period of 1000 years – 8 intensity and at 2500 years 9 intensity earthquake appearance, corre-spondingly.
According to the Musson [1] conception, it is necessary to use the data, which is maximum approximate to the real
*Address correspondence to this author at the 362002, Markova 93a, Vladi-
kavkaz, North Ossetia-Alania, Russian Federation Center of Geophysical
Investigations of Vladikavkaz Scientific Center and the Government of the
Republic of North Ossetia-Alania, Russia; Tel: +7 8672 764084;
Fax: +7 8672 764056; E-mails: [email protected]; [email protected]
engineering-geological conditions, at assessments of territory seismic hazard. For the territory of RNO-A the exposition equal to 1000 years is the most approximate to real condi-tions for mass building. It is necessary to consider greater exposition, for example, 2500 years etc. for unique buildings and constructions
Thus, probability maps of seismic hazard of the North
Ossetia Republic territory were made on basis of modern
methods usage (over-regional method of IPE RAS) and the
usage of computer programs (SEISRisk-3 - USA) in GIS
technologies. Maps are made in intensity units (MSK-64) in
scale 1:200 000 with exceedance probability for a period of
50 years - 2%, 5%, 10%, which correspond to return period of 2500, 1000, 500 years correspondingly.
Besides, for the first time probability maps of seismic
hazard for Russian territory were made in acceleration units
in scale 1:200 000 with exceedance probability for a period
of 50 years - 2%, 5%, 10%. 5% probability maps are rec-
ommended for town-planning problems. One can see great
hazard in the south of RNO-A on the map, where exists the
Assessment of Seismic Hazard of Territory on Basis The Open Construction and Building Technology Journal, 2011, Volume 5 31
increased level of seismic hazard (due to powerful Vladi-kavkaz fault, lying nearby).
As a matter of principle it is possible to make maps in scale 1:100 000 etc., but it actually makes no practical sense. Although accuracy of such maps must be higher, adequacy of the results can be considered as doubtful due to absence of reliable data on local peculiarities of past, i.e. historical earthquakes display. Laboriousness (irretrievable) at that increases multiply.
Creation of such maps for the whole Northern Caucasus is an offer to create detailed maps of seismic hazard for other subjects of Northern Caucasus. Realized for RNO-A action can involve territories of other subjects of Northern Cauca-sus. It is possible to make detailed maps of seismic hazard for the whole Caucasus, including Azerbaijan, Armenia and Georgia, due to the features of spreading of hazardous seis-mic sources, which «neglect» states’ boundaries. It is also possible to develop the maps jointly with Turkey and Iran and it’s real to include such countries as Israel, Egypt, and Lebanon etc.
Maps of detailed seismic zoning can be called «long-term» prediction maps. It means that long-term prediction of hazardous phenomena is realized on their basis and, corre-spondingly the place of earthquake-proof building-stock is determined.
Then, maps of seismic microzonation of cities must be created. According to the above mentioned maps of detailed zoning the maps of seismic microzonation with probability 2%, 5% or 10 %, correspondingly, were made up.
Though, that definitions of the word «zoning» are simi-lar, actually they are quite different in essence. Unlike the maps of detailed seismic zoning, which give seismic poten-tial (Mmax) and source features, the maps of seismic micro-zonation give assessments of soil condition influence (sands, rocks, pebbles, clays etc., their combination; watering; relief (as underground as surface); spectral distribution of incom-ing wave; predominant vibration frequencies on city square etc.) on forming of future earthquake intensity. As a rule, the scale of such maps is 1:10 000, in order to have the opportu-nity of taking them into account at building. Maps can be more detailed (1:5000 etc.) but this makes no sense as the type and physical condition of soils in space on the territory site can change fast. The most important thing is to assess intensity of possible earthquakes on areas with typical soil conditions for city territory.
Maps of seismic microzonation can be made up for the certain territories (cities and settlements, as a rule). It is im-possible to make them up in entire format because of the necessity of geological conditions knowledge on larger terri-tories, which are mostly not built up. We often don’t have such data even for the modern cities! It’s practically impos-sible because the resources will be lost for nothing! And ab-surdity! In the other words there is no the microzonation map even for the territory of RNO-A let alone the whole Northern Caucasus.
Maps of seismic microzonation do not only show the place of earthquake-proof building up, but they also show on what intensity this or that building must be calculated and
designed: on 6, 7, 8 or 9 points. And sometimes even on 10 points (for very soft grounds!). And this suggests invest-ments of different financing for the realization of antiseismic measures (thicker armature, more connections etc.). Seismic risk can considerably be reduced at building-up zones with 7, 8 and 9 point of the calculated intensity by adequate site de-velopment on the territory of city, for example, as social losses will be minimal, though buildings will be damaged in this or that extent.
THE SEISMIC HAZARD ASSESSMENT OF TERRI-TORY
As a rule, today probabilistic assessment of seismic haz-ard is used all over the world for the identification of seismic loads for the engineering projects. The probabilistic ap-proach is a more systematized method for the assessment of quantity, sizes and location of future earthquakes [2-4] than any other methods. Formal procedures for the probabilistic assessment include the determinations of spatio-temporal ambiguities for the expected (future) earthquakes. The com-puter program EQRISK of McGuire became the main stage in the method development [5]. The program became wide-spread and is very popular up to present day. In this connec-tion the probabilistic assessment of seismic hazard is often called Cornell McGuire’s method. The program includes integration on ambiguities distribution.
The Caucasian region is characterized by high intensity of dynamic geological processes [6] and hazards, connected with them, of both natural and man-caused character. The most clearly expressed among these hazards is seismicity, which is accompanied with wide range of secondary proc-esses. Earth surface ruptures, activation of known earlier inactive faults, landslip phenomenon, collapses, avalanches, creep and subsidence of the earth surface, activation of sur-face structures, soil liquefaction and other hazardous phe-nomena can be noted among them.
The investigations on determination and parameterization of the seismic source zones in recent decades has been real-ized by V.P.Solonenko, V.S.Khromovskikh, E.A.Rogozhin, V.I.Ulomov, V.G.Trifonov, I.P.Gamkrelidze and others [7-17].
On basis of the results of the active faults study located southward of the Great Caucasian ridge, parameters of seis-mic source zones were chosen according to data of I.P.Gamkrelidze work [16] and to the north of the ridge they were chosen on data of E.A.Rogozhin and others (Rogozhin et al., 1995–2002). According to the results of the executed expert evaluation of seismic potential ( max) the maps of seismic sources zoning of the territory of RNO-A (zones of possible seismic sources - PSS zones) were made up.
A new original method of more accurate ascertainment of the boundaries of seismogenic source (fault) active part and assessment of the potential of seismic source hazard (at works of detailed seismic zoning – DSZ) has been worked out in recent years [18].
Let’s consider the process of territory seismic hazard as-sessment for explanation of procedure usage by the example of the Central Caucasus (the territory of the Republic of North Ossetia-Alania).
32 The Open Construction and Building Technology Journal, 2011, Volume 5 Zaalishvili and Rogozhin
PSS zones are referred to the active fault systems, singled out on a basis of interpretation of the materials of remote sensing and geological data. Decoding of multispectral three-channel space images of Landsat–4/5 (resolution 30 m) and Landsat–7 (resolution 15 m) was realized. Decoding of space satellite photos was executed in colored multispectral variant as well as in black-and-white variant. Different variants of the image synthesis were used for the analysis of polyzonal scanner pictures. Besides, identification of the lineaments was also executed separately on channels. Combined deduc-tive – inductive approach was used for lineaments identifica-tion: integrated structures were decoded on the base of strongly generalized images with the following zooming in for detailing and vice versa local peculiarities of tectonic and exogenous structures with the following zooming out and generalization. The method of stepwise generalization was used with quantization on the scale levels 1:25000; 1:50000; 1:100000; 1:200000; 1:300000; 1:400000; 1:500000. In the scale range 1:25000 - 1:1 500000 space photomap on basis of snapshots Landsat-7 is used and in the range 1:500000-1:2 millions – space photomap, created on basis of Landsat–4/5 snapshots.
Extensive lineaments systems were identified with known faults, which were qualified on modern stage as ac-tive. The name of PSS zones was formulated on basis of faults and large settlements names. Morpho-kinematics of active faults is the base for qualification of seismic dis-placements kinematics in PSS zones. Hypocenters depth of expected earthquakes was calculated from the depth of fault
plans, the depth on geophysical anomalies data and from the magnitude of expected events.
Maximum magnitude of expected earthquakes (seismic potential, max) was assessed on the results of usage of the over-regional seismotectonic method of seismic hazard as-sessment, offered by G.I.Reisner. Usage of this method, foundation of which are described in the number of publica-tions [19, 20], showed that the Northern Caucasus is the re-gion of very high seismic hazard.
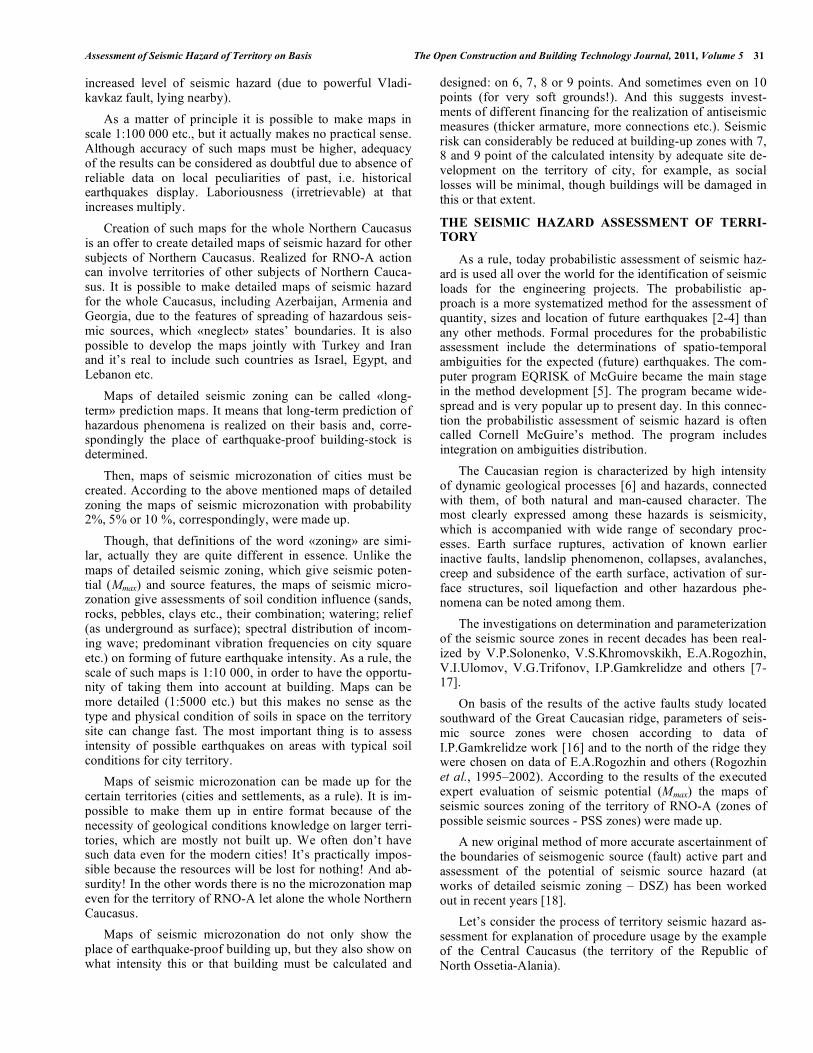
In 2007 it was determined on data of field investigations that for the urbanized territories of RNO-A the most hazard-ous are Vladikavkaz, Mozdok, Sunzha and Tersk PSS zones (Table 1), (Fig.1) [18, 21, 22].
Parameterization of seismic sources was made after crea-tion of these maps, i.e. maximum possible magnitude Mmax for each seismic source was assessed. This is the most diffi-cult problem in the process of parameterization of PSS zones. Mmax was determined on the data of number authors [14, 18, 23].
The second essential parameter, which characterizes ex-pected earthquakes, is sources depth range, where the major-ity of seismic events with corresponding magnitude generate. According to the numerous investigations, Caucasus is the region with upper crust part location of seismic sources – their depth doesn’t exceed 20–25 km (deeper seismicity is observed in Tersk-Sunzha zone in the area of Grozniy city and in Caspian Sea). As sources distribution on depth for this
Fig. (1). Map of PSS zones of the territory of the Republic North Ossetia-Alania (Rogozhin, 2007). Red triangles – basic seismic stations in
the region. Blue and black lines are the state borders of RNO-A.

Assessment of Seismic Hazard of Territory on Basis The Open Construction and Building Technology Journal, 2011, Volume 5 33
region wasn’t executed, average value of depth (equal to 10 km) was taken for calculations (see Table 1).
For the assessment of ratio parameters between reitera-tions during the process of execution of a number of investi-gations on the international projects the earthquake catalogue was checked and specified. The seismicity in each source zone was analyzed on basis of catalogue usage: New Cata-logue… 1982, Corrected Catalogue of Caucasus, Institute of Geophysics Ac. Sci. Georgia (in data base of IG), the Special Catalogue of Earthquakes for GSHAP test area Caucasus (SCETAC), compiled in the frame of the Global Seismic Hazard Assessment Program (GSHAP), for the period 2000 BC - 1993, N.V. Kondorskaya (editor), (Ms>3.5) Earthquake catalogues of Northern Eurasia (for 1992-2000), Catalogue of NSSP Armenia, Special Catalogue for the Racha earth-quake 1991 epicentral area (Inst. Geophysics, Georgia) and also the Catalogue of RNO-A 2004–2006.
Corrected Catalogue of Caucasus contains data for more than 61000 of earthquakes, including 300 historical events [24, 25, 26 and 27], which happened during 2000 years. This catalogue was checked and corrected. Some hypocentral parameters of earthquakes were recalculated.
Threshold of magnitude for the whole catalogue and a and b values of the reiteration law were determined for large tectonic zones, as their calculation for certain PSS zones was impossible because of data absence. Value of b of the reitera-tion law is determined by formula of Gutenberg-Richter:
lg(N/T)= -b ,
where and b are parameters, the inclination and level of recurrence graph at =0.
For each PSS zone (both linear and square) frequency of earthquake origination was studied on basis of observed
seismicity. For study of Gutenberg-Richter ratio earthquakes were referred to the separate faults or PSS zones taking into account accuracy in epicenter determination. Because of the shortage of data about accuracy of location determination average model was accepted. This model supposes that mis-takes have normal distribution with standard deviation equal to 3–4 km. Distances from each event to the all PSS zones were measured and only zones, which were on closer dis-tances from the event than three standard deviations, were taken into account. Based on distances value, weighting co-efficient was assigned to each zone, from the curve of den-sity distribution of the standard deviation possibility.
Earthquake effect was assessed on basis of two different parameters usage: macroseismic intensity and peak ground acceleration ( G ). Macrosiesmic intensity (MSK-64 scale) traditionally was used for the seismic zoning in USSR. It is shown in the paper [28], that macrosiesmic field parameters, which are determined in the catalogue of strong earthquakes, give average values, which describe macroseismic field for moderate earthquakes and far from the epicenter well. In the above mentioned work the parameters are determined for strong earthquakes and relative close distances.
On the other hand, instrumental data of strong motions on Caucasus and neighboring regions allows using G and spectral law of acceleration attenuation for the analysis of seismic hazard. In recent years G is used actively for seismic hazard assessment of the whole Caucasus (Project ISTC 2006) [29], certain countries [30, 31, 32], cities and regions [32, 33 and 34].
Comparison of the attenuation correlations for peak hori-zontal acceleration in Caucasus with similar correlations for the other regions, in particular with models of West and North America shows a good accordance. It is obvious, that
Table 1. PSS Zones for RNO-A Characteristics (Numbers in the Rings on Fig.1)
PSS zone Magnitude H, km Kinematics
1 Mozdok eastern 5.0 10 reverse faulting
1 Mozdok western 4.0 5 strike-slip
2 Tersk 4.5 5 reverse faulting
3 Sunzha northern 6.1 15 reverse faulting
4 Sunzha southern (western branch) 6.5 15 strike-slip
4 Sunzha southern (eastern branch) 6.1 15 reverse faulting
5 Vladikavkaz (western branch) 6.5 15 reverse faulting
5 Vladikavkaz (eastern branch) 7.1 20 reverse faulting
6 Nalchik 5.5 10 strike-slip
7 Mizur 6.2 15 strike-slip
8 Main ridge 6.2 15 reverse faulting
9 Side ridge 6.3 15 reverse faulting
10 Karmadon 6.5 15 reverse faulting

34 The Open Construction and Building Technology Journal, 2011, Volume 5 Zaalishvili and Rogozhin
attenuation in Europe is lower than in Caucasus and neigh-boring region. Predicted peak values in near zone are higher than corresponding values, obtained with the help of the other European models [35].
The maps of seismic hazard, which determine exceed-ance probability of fixed value of impacts during different exposition time, were made up for the territory of RNO-A in the form of set of maps for macroseismic intensity at return period of 50 years with exceedance probability 2%, 5% and 10% in scale 1:200 000 (Fig. 2).
Computer program SEISRISK III, developed in 1987 by Bender and Perkins [36] was used for the calculations. The map of observed maximum intensity was compared with the maps of different periods of exposition and the most real map was chosen on a basis of the analysis of differences between the observed and calculated maps. According to these criteria the map of 5% probability with exceedance probability of 50 years can be recommended for seismic zon-ing of the territory of RNO-A.
The analysis of maps shows that main seismic hazard is connected with the faults or PSS zones, which are close to Vladikavkaz city (Figs. 1 & 2).
As already was mentioned, such map of seismic hazard in scale 1:200000 was created for the territory of RNO-A in 2007. Similar, not detailed maps of seismic hazard exist, but in scale 1: 8 000 000 and therefore they are inferior in de-tails.
The scientists from Vladikavkaz in collaboration with the colleagues from the Institute of Physics of the Earth of RAS not only offer to use large-scale maps but also decided to continue investigations and cover the whole Northern Cau-casus in scale 1:200000. So, maps of seismic hazard can be made up in scale 1:200 000 for the Republics of Chechnya, Ingushetia, Kabardino-Balkaria, Stavropol and Krasnodar areas and the other territories. Taking into account, that faults and other peculiarities of the territory exist out of any boundaries, including state boundaries, it is possible to make unusual but quite physically proved single general map of detailed seismic zoning of the territory of Northern Caucasus in scale 1:200000, moreover, one can make them for differ-ent exposition times and accordingly for different probabili-ties. So, created maps of detailed seismic zoning of RNO-A conform to earthquake realization once in 500 years, 5% - in 1000 years and 2% - in 2500 years. The level of seismic haz-ard grows with the time increase etc.
Essentially, the long-term maps of expected intensities locations are that of described maps of detailed seismic zon-ing. Indeed, that evacuate people from the hazardous terri-tory before expected earthquake is impossible, but it is real to prevent population burring under destroyed or, to be more precise, differently damaged buildings, which is formed on basis of such maps. The more educated society is the less seismic risk, i.e. economic and social losses. So, the priori-ties are clear.
On basis of the given maps it is necessary to make up the maps of seismic microzonation(SMZ) of cities and large settlements of each certain subject of the Federation with the usage of the most modern standard methods and tools, but in scale 1:10 000. The probabilistic maps of SMZ were first
developed in the Center of Geophysical Investigations of Vladikavkaz Scientific Center RAS and RNO-A. Such maps of SMZ are direct and reliable base of earthquake-proof de-sign and object construction.
Created on the above mentioned methodology set of the maps allow to provide equal degree of risk within the terri-tory, covered by each of these maps and is intended for earthquake-proof construction and measures for seismic risk reduction for different categories of responsibility degree and durability [18]. We offer to use the maps of 5% prob-ability for the mass, i.e. major construction, the maps of 2% probability for construction of objects of enhanced responsi-bility. At the same time, it is necessary to remember that the given maps are the essential base for SMZ and creation of corresponding maps.
Besides, it is necessary to note that at usage of the tradi-tional units of macroseismic intensity the boundaries be-tween different zones are characterized by sharp changes, which obviously do not correspond to the real situation of monotonous change of intensity for homogenous soil condi-tions of the investigated territory. No doubt, it will form evi-dent inaccuracies at the assessment of the level of seismic hazard of this or that territory. The practical usage of artifi-cial intensity subdivision, for example, in the form of 7.2 or 8.3 points is not validated enough from the theoretical point of view. So, firstly, it is not usually explained how these fractional assessments are obtained and, secondly, the fol-lowing transition to the acceleration units (obviously, ac-cording to foreign data, as there are no acceleration records for forming reliable correlation in Russia), undoubtedly, forms considerable inaccuracy and it is hardly ever physi-cally proved because of the formality of the parameter of «intensity» itself.
On the other hand, at seismic influence assessment at earthquake - proof design engineers use the acceleration val-ues, (strictly speaking, conveniently) corresponding to speci-fied intensities. Thus, it’s assumed that design acceleration a = 0,1 g corresponds to the intensity 7 earthquake, 0,2g – to the intensity 8, 0,4g – to the intensity 9 etc. At the same time, network of digital stations dislocated on the Southern Caucasus installed in source zones of Spitak (Armenia, 1988), Racha (Georgia, 1991), Barisakho (Georgia, 1992), Baku (Azerbaijan, 2000), Gouban (Georgia, 1991), Tbilisi (Georgia, 2002) and other earthquakes collected seismic re-cords for formation of database of accelerations for Cauca-sus. It makes possible to design maps of the seismic hazard independently in units of PGA. Such maps for the territory of RNO-A for exposition of 50 years with exceedance prob-ability 2%, 5% and 10% in scale 1:200 000 were created (Fig. 3). It is obvious that at changing of smothering step it is possible to obtain smooth variations of accelerations directly used as design impacts.
In contrast to the maps of general seismic zoning (GSZ) with a scale of M 1: 8000000 and, at the best, with the scale M 1:2500000 obtained maps of both types on a scale 1:200000 can be referred to the DSZ type maps.
Thus, these materials allow assessing seismic hazard on a detailed level, according to the known formulas to calculate the macroseismic field of seismic effects on a scale that may provide a reliable basis for SMZ.

Assessment of Seismic Hazard of Territory on Basis The Open Construction and Building Technology Journal, 2011, Volume 5 35
In the next stage we should carry out SMZ. It should be noted that as a basis the maps of different probability of ex-ceedance will be used and as the initial intensity, the value of which corresponds directly to the intensity of the sites, com-posed by average soils or characterized by average soil con-ditions and, therefore, the maps will be referred to the 7, 8 or 9 points (and similarly for acceleration). The zones, com-posed by clay soils of fluid consistency, which can be char-acterized by liquefaction at quite strong influences, are marked by the index 9*. Intensity calculation here supposes the usage of special approaches in the form of direct taking soil nonlinearity into account [37, 38]. The usage of relevant
methods and techniques of SMZ will allow to obtain the cor-respondent maps of SMZ.
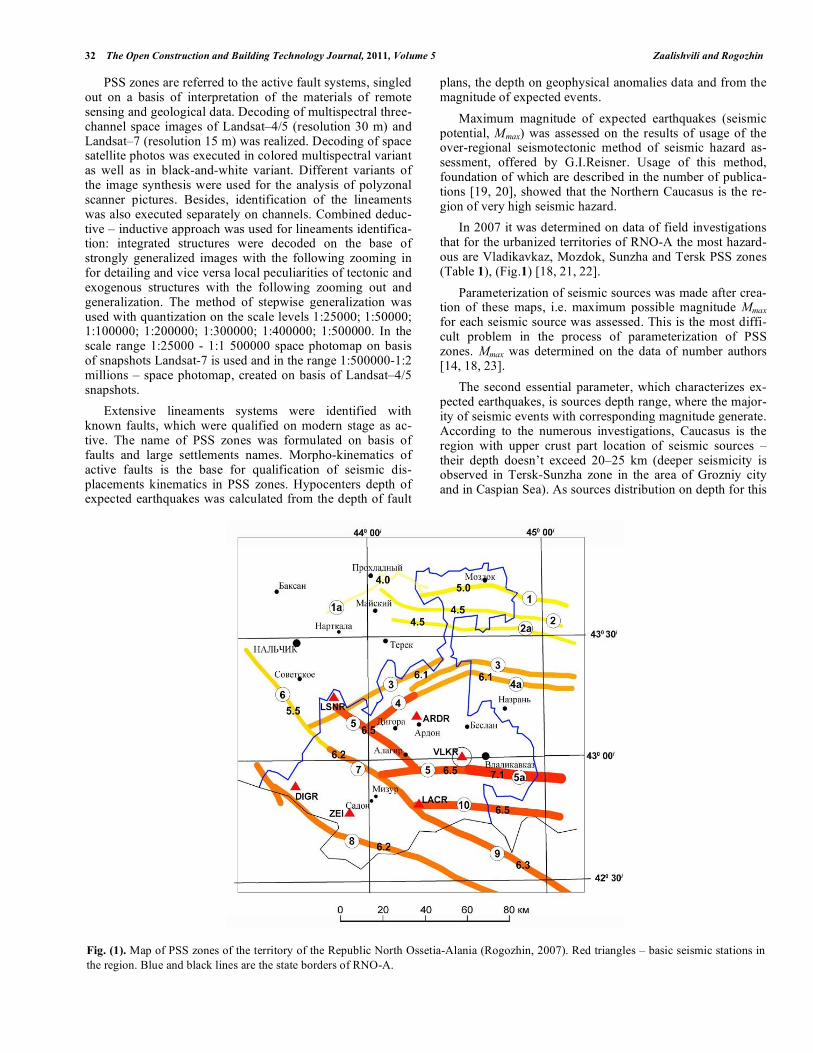
Thus for maps with probability of exceedance 2%, 5% and 10% one can obtain corresponding maps of SMZ with probability of exceedance 2%, 5% and 10%, i.e. probabilistic maps of SMZ (Fig. 4).
Such maps of SMZ except of mentioned developments are also based on materials of local network of seismic ob-servations “Vladikavkaz”. Network was organized for the first time on the urbanized territory of the Northern Caucasus in July 2004. Stations are located on the sites with different typical for the city soils (clays of medium-hard and liquid
Fig. (2). Probabilistic map of seismic hazard (DSZ) in the intensities (MSK-64). with the exceedance probability 5% (a) 2% (b) for RNO-
A territory and adjacent areas (Zaalishvili, 2006).
Fig. (3). Probabilistic map of seismic hazard (DSZ) in accelerations (PGA) with exceedance probability 5% ( ) and 2% (b) for RNO-A terri-
tory (Zaalishvili, 2006).
������� ������� ������� ������� ������� ������� ������� ������ ������ ������� ������� ������� ������ ������ ������� ������� ������� ������� ������� ������� ������� ������� ������� ������� ������� ������� ������� ������� ������� ������� �������������� ������� ������ ������
�������
�������
�������
�������
�������
�������
�������
�������
�������
�������
�������
������
������
�������
�������
�������
������
������
�������
�������
�������
�������
�������
������
�������
�������
�������
�������
�������
�������
�������
�������
�������
�������
�������
������
������
������ ���������������������������������������� ���������������������������������������������������������������������������������������������������������������������������������������������������������������������������������� �������
������
�������
������
�������
�������
�������
�������
�������
�������
�������
�������
�������
�������
�������
�������
�������
�������
�������
�������
�������
������
������
�������
������
�������
������
������
�������
�������
�������
�������
�������
�������
�������
�������
�������
�������
��
� ���������� ���������
��
���
����
��
���������������������������� ! �����������
�������"� ����
�#$%&$'�$()#(%$)*�+���"��,�-�./0121$3$)*�04�#5'##6#('#40/�/#)7/(�.#/$06�04����*#2/%
+',��#()#/�04�8#0.9*%$'23��(:%)$;2)$0(%04���������2(6����"�<�����
+',��=!=��223$%9:$3$<�����
�'$#()$4$'�#6$)0/./04��=!=��223$%9:$3$�326$>2:>2?<�����
�'23#�@�������>& � � � � � � �
��
���
����
��
���������������������������� ! �����������
�������"� ����
�#$%&$'�$()#(%$)*�+���"��,�-�./0121$3$)*�04�#5'##6#('#40/�/#)7/(�.#/$06�04����*#2/%
+',��#()#/�04�8#0.9*%$'23��(:%)$;2)$0(%04���������2(6����"�<�����
+',��=!=��223$%9:$3$<�����
�'$#()$4$'�#6$)0/./04��=!=��223$%9:$3$�326$>2:>2?<�����
�'23#�@�������>& � � � � � � �
������� ������ ������� ������� ������ ������� ������� ������������ ������� ������� ������� ������ ������ ������� ������� ������� ������� ������� ������� ������� ������� ������� ������� ������� ������� ������� ������� ������� ������� ������� ������� ������ ������ ��������������
�������
�������
�������
�������
�������
�������
�������
�������
�������
������
������
�������
�������
�������
������
������
�������
�������
������
�������
�������
�������
�������
�������
�������
�������
�������
�������
�������
�������
�������
�������
�������
�������
������
������
����������������������������������������������������������������������������������������������������������������������������������������������������������������������������������������������������������������������������������������������������
������
�������
�������
�������
�������
�������
�������
�������
�������
�������
�������
�������
�������
������
�������
�������
�������
�������
�����
������
������
�������
�������
�������
������
������
�������
�������
������
�������
�������
�������
�������
�������
�������
�������
������
��������
��������
��������
��������
��������
��������
�������
(���(� �A��� (.��(����2
��!�(����# '��"
��2�# . ��
�/ . 2���2 �
(.�B��0"�2(�������
*.052��0�
�2.'���
��� ��� �0!=�2(52. �
�
�.2'�02.�#�'�0#
�(� ����#�* �
�
�5*(2�
�. ��
�0�( �.#�'�2 � (' ��2B50
���
�
��
0�
0'2
/ 6
*�
�� ��
�(#�'2��.0!'�2 �
��.#�
��2!�"�*.�2�/2 *.*5 ��# '�2�
�
��2�'#��
�.2�
* �*.
�.*5�2
�.#��= *.*5
� 2 # �2/ ( .�
*.*5�0 =
.0 0���
(# �#' �
��!������
�#��2(2� �2 �# �*/
� 2.2 '*
!# 2 2.5=� (�
�
��
�2 2 2B( �" (� �
!# 2.5=�#�� 2(
!#.5= # �( ' �#
�0(��/*�
�2 � ��0�
�
�
�5'2. 2.'
�2 5(*
�� 5=�2 2( '# ��!#.5=�2 2( '# ���2�2�+ ,�#5 (=�
��5=�2.
�2. 2'� ��2�2 2 2��
!2
25
�27�2 �2' (
�25 # �'
� ��� 20 .'+ ,�# �(=5
�5'2*
/ 2(�2�
�2� 2* ��
�*��2
� '0 2��� ."* �� /0.2
����2/2
� ' ** '
!#.5=�2 2. �2/� 5=�2.2�2/�
�2 2� � ���
�*�2'2�!2. #7
��2� 0'5
2 2( �
.2� �2* ��/2 �2*�
.2�!=
!=
�#.5#'�2�2*
.2�!=� �.25���2*
�2. � 2(/0��2 �2'5
� 52/#/2�2��2*� ��
�
(*. 2�� �#'2���2*�#����2*�.�/ ��2 2
�� ����2 2*
!���=�/��
�� ���
�*�2(�
�� 5= 0�!#.5= #� �*���
�* 2(��2� �.50�
(2��2*��(��
� �*��
!#.5=* 2(�
(0'=��'0(0/0!!#.5=��
�*. *�2(�� 5=
�0�*'0��2
��� 2.7
���
�2 2� �
(27
����
�� ��� *'!���= � ���
��
�5��2.2
���!/��
(2((2/ 2*
�
�
2*��.2!
�2�2�*.�2���2*
�2. 2##(
/2�2.�0�
�2��
�2. 2�� 0���2.=�2�
� 2�
��#���2*
��
��5 (2.'
�52�.25�#���
( 5/��
�(�/# ��
*(�
�25��'2.
�0 2� �
�2 2�( �#.�
(0(0!'.� #0. #�'�0#
! �� ��!���( �
� ���������!#.5=�2� 2��
� 250 5 ��
� �
�2/2.�0�
�2. 27
�2� �'�
7'�'��� ��
�
�� �.2/ 2 /�
��5=��.2/ �2 /�
�� 2* .��2*
� 2* �2/ �2 2( 0�� �
�(�/ ��
7.2*�0.2
*.' �
�
�.2' ���� �0�
����
��2*
�0
�2. 2��
�*."�*.
*.5"� ��/0.2 �*.5"��/0.2
��0(2
�����
�0'� ��25�
���0(2#!'�2 �
�.2' 0/0.�
�����
� � �0 2
�2.�5 ��
�2./"�05
�( 50 00� !
((2 0 0#� !
�0 '0 0( ' 0#� ��
72(�� !0 0
�0 �/ 2*�2'' #! �
� �2/�0�
�2� 2/.2 2��
�0!=�2�� 2�
��#(�
�0/�.
�2�0 0 0� !
��#(�0�
�2�/2.0� �2.�
� �� � 0*.
��52�(0! �' 0'
�.50� �' 2 �
�(52� *.�
�2.��� 0.0!
� �0' 27�����
�0!=� 2*2�0 0.��
�*�2(2/
��(/2
�.*/
��������(
��� ��. ' 0#��
�2 0#�
�2�0��2�� (## ' 0#�
! �
�*�52� /2.00� �
�*. 2� �
�0�/2.0�
##. �#. 0 2 '
��! ��
� �
���!�����
� /��'�0#
�2�'�
�� ��
�(� ��.�
�2 ."' 0.� ���
��250 0!0!0�05������
� � �( 0#!��2 00�
!��� 2
�� !00(
72( ���
�2� ��2 *(
�2� �0/�
��2.=! �2�2 0.��
�2.'* ��
((�' 0!
!0.5=� 2(* ��
�2��0( #�
�.#�=� 2(* ��
��5=� 2(* ��
�0!= #� �2��
��5�0#
2(0� !0
!0 �� 20'# '�� �
� 0�2�.2'�2
#�� 2(2#!2�=*! =�0
*
�
��= �=C#. (0!2
('#�25� 2*.��
��2.��
�2/0(B
��( � ��;
* =��= C#.�0�� 20!
* ! �2(2 � �) ��2.=�2(( �#�
#�/0. 0#�0
!#52.���2(/0�#��0!=�2� �#
��5=�*.(
� 0*'0!
!#.5=�*.(
;#(0/( 0#'���
!#.5=� ;
� 2B�#�'�0#
�2 '0 �!�0�
�2� ;0!'�0#
��5=��
;2B
;.2' 0#'�
�/ ' 2�! ��#.' 2 ��
������'�2(�
�0�2.0 0!
�0!0/#0./�# ' 0! �
!#'#(0! �0'
��#!' 0#�
�
�
� .(
� �
�
��2� 0(� �0#�
(*� 20 '! �
������
�.0�7�0#
�
�
�
00'#0 �! � �2'
* 0 ' 0#��5�2� � #��
�
(2!(0�0( ' 2
�
�
2�0! ���
�0 �.2 0#��� �
*!2.0! �# 0#�0 0 2( # ���
�!��
�#( 2���
�
��#.�0 .'��
0 � � ' �#.#�!� 5=
(.� ��
=�
=� �0 �� '!5=�#.#�
�� �##
#. 0 .' 2� �
� '#.# 0#� �
� ;�
������� ������ ������� ������� ������ ������� ������� ������������ ������� ������� ������� ������ ������ ������� ������� ������� ������� ������� ������� ������� ������� ������� ������� ������� ������� ������� ������� ������� ������� ������� ������� ������ ������ ��������������
�������
�������
�������
�������
�������
�������
�������
�������
�������
������
������
�������
�������
�������
������
������
�������
�������
������
�������
�������
�������
�������
�������
�������
�������
�������
�������
�������
�������
�������
�������
�������
�������
������
������
����������������������������������������������������������������������������������������������������������������������������������������������������������������������������������������������������������������������������������������������������
������
�������
�������
�������
�������
�������
�������
�������
�������
�������
�������
�������
�������
������
�������
�������
�������
�������
�����
������
������
�������
�������
�������
������
������
�������
�������
������
�������
�������
�������
�������
�������
�������
�������
������
��������
��������
��������
��������
��������
��������
�������
(���(� �A��� (.��(����2
��!�(����# '��"
��2�# . ��
�/ . 2���2 �
(.�B��0"�2(�������
*.052��0�
�2.'���
��� ��� �0!=�2(52. �
�
�.2'�02.�#�'�0#
�(� ����#�* �
�
�5*(2�
�. ��
�0�( �.#�'�2 � (' ��2B50
���
�
��
0�
0'2
/ 6
*�
�(#�'2��.0!'�2 �
��.#�
��2!�"�*.�2�/2 *.*5 ��# '�2�
�
��2�'#��
�.2�
* �*.
�.*5�2
�.#��= *.*5
� 2 # �2/ ( .�
*.*5�0 =
.0 0���
(# �#' �
��!������
�#��2(2� �2 �# �*/
� 2.2 '*
!# 2 2.5=� (�
�
��
�2 2 2B( �" (� �
!# 2.5=�#�� 2(
!#.5= # �( ' �#
�0(��/*�
�2 � ��0�
�
�
�5'2. 2.'
�2 5(*
�� 5=�2 2( '# ��!#.5=�2 2( '# ���2�2�+ ,�#5 (=�
��5=�2.
�2. 2'� ��2�2 2 2��
!2
25
�27�2 �2' (
�25 # �'
� ��� 20 .'+ ,�# �(=5
�5'2*
/ 2(�2�
�2� 2* ��
�*��2
� '0 2��� ."* �� /0.2
����2/2
� ' ** '
!#.5=�2 2. �2/� 5=�2.2�2/�
�2 2� � ���
�*�2'2�!2. #7
��2� 0'5
2 2( �
.2� �2* ��/2 �2*�
.2�!=
!=
�#.5#'�2�2*
.2�!=� �.25���2*
�2. � 2(/0��2 �2'5
� 52/#/2�2��2*� ��
�
(*. 2�� �#'2���2*�#����2*�.�/ ��2 2
�� ����2 2*
!���=�/��
�� ���
�*�2(�
�� 5= 0�!#.5= #� �*���
�* 2(��2� �.50�
(2��2*��(��
� �*��
!#.5=* 2(�
(0'=��'0(0/0!!#.5=��
�*. *�2(�� 5=
�0�*'0��2
��� 2.7
���
�2 2� �
(27
����
�� ��� *'!���= � ���
��
�5��2.2
���!/��
(2((2/ 2*
�
�
2*��.2!
�2�2�*.�2���2*
�2. 2##(
/2�2.�0�
�2��
�2. 2�� 0���2.=�2�
� 2�
��#���2*
��
��5 (2.'
�52�.25�#���
( 5/��
�(�/# ��
*(�
�25��'2.
�0 2� �
�2 2�( �#.�
(0(0!'.� #0. #�'�0#
! �� ��!���( �
� ���������!#.5=�2� 2��
� 250 5 ��
� �
�2/2.�0�
�2. 27
�2� �'�
7'�'��� ��
�
�� �.2/ 2 /�
��5=��.2/ �2 /�
�� 2* .��2*
� 2* �2/ �2 2( 0�� �
�(�/ ��
7.2*�0.2
*.' �
�
�.2' ���� �0�
����
��2*
�0
�2. 2��
�*."�*.
*.5"� ��/0.2 �*.5"��/0.2
��0(2
�����
�0'� ��25�
���0(2#!'�2 �
�.2' 0/0.�
�����
� � �0 2
�2.�5 ��
�2./"�05
�( 50 00� !
((2 0 0#� !
�0 '0 0( ' 0#� ��
72(�� !0 0
�0 �/ 2*�2'' #! �
� �2/�0�
�2� 2/.2 2��
�0!=�2�� 2�
��#(�
�0/�.
�2�0 0 0� !
��#(�0�
�2�/2.0� �2.�
� �� � 0*.
��52�(0! �' 0'
�.50� �' 2 �
�(52� *.�
�2.��� 0.0!
� �0' 27�����
�0!=� 2*2�0 0.��
�*�2(2/
��(/2
�.*/
��������(
��� ��. ' 0#��
�2 0#�
�2�0��2�� (## ' 0#�
! �
�*�52� /2.00� �
�*. 2� �
�0�/2.0�
##. �#. 0 2 '
��! ��
� �
���!�����
� /��'�0#
�2�'�
�� ��
�(� ��.�
�2 ."' 0.� ���
��250 0!0!0�05������
� � �( 0#!��2 00�
!��� 2
�� !00(
72( ���
�2� ��2 *(
�2� �0/�
��2.=! �2�2 0.��
�2.'* ��
((�' 0!
!0.5=� 2(* ��
�2��0( #�
�.#�=� 2(* ��
��5=� 2(* ��
�0!= #� �2��
��5�0#
2(0� !0
!0 �� 20'# '�� �
� 0�2�.2'�2
#�� 2(2#!2�=*! =�0
*
�
��= �=C#. (0!2
('#�25� 2*.��
��2.��
�2/0(B
��( � ��;
* =��= C#.�0�� 20!
* ! �2(2 � �) ��2.=�2(( �#�
#�/0. 0#�0
!#52.���2(/0�#��0!=�2� �#
��5=�*.(
� 0*'0!
!#.5=�*.(
;#(0/( 0#'���
!#.5=� ;
� 2B�#�'�0#
�2 '0 �!�0�
�2� ;0!'�0#
��5=��
;2B
;.2' 0#'�
�/ ' 2�! ��#.' 2 ��
������'�2(�
�0�2.0 0!
�0!0/#0./�# ' 0! �
!#'#(0! �0'
��#!' 0#�
�
�
� .(
� �
�
��2� 0(� �0#�
(*� 20 '! �
������
�.0�7�0#
�
�
�
00'#0 �! � �2'
* 0 ' 0#��5�2� � #��
�
(2!(0�0( ' 2
�
�
2�0! ���
�0 �.2 0#��� �
*!2.0! �# 0#�0 0 2( # ���
�!��
�#( 2���
�
��#.�0 .'��
0 � � ' �#.#�!� 5=
(.� ��
=�
=� �0 �� '!5=�#.#�
�� �##
#. 0 .' 2� �
� '#.# 0#� �
� ;�
���������������������������� ! �����������
�������"� ����
�-�./0121$3$)*�04�#5'##6#('#40/�/#)7/(�.#/$06�04����*#2/%
+',��#()#/�04�8#0.9*%$'23��(:%)$;2)$0(%�04��������2(6����"�<�����+',��=!=��223$%9:$3$<�����
�'$#()$4$'�#6$)0/./04��=!=��223$%9:$3$�326$>2:>2?<�����
�'23#�@�������>& � � � � � � �
���������������������������� ! �����������
�������"� ����
�-�./0121$3$)*�04�#5'##6#('#40/�/#)7/(�.#/$06�04����*#2/%
�#2>�;/07(6�2''#3#/2)$0(�+;,�#2>�;/07(6�2''#3#/2)$0(�+;,
�'$#()$4$'�#6$)0/./04��=!=��223$%9:$3$�326$>2:>2?<�����
�'23#�@�������>& � � � � � � �
+',��#()#/�04�8#0.9*%$'23��(:%)$;2)$0(%�04��������2(6����"�<�����+',��=!=��223$%9:$3$<�����
36 The Open Construction and Building Technology Journal, 2011, Volume 5 Zaalishvili and Rogozhin
consistence, gravels with filling material of less than 30% and more than 30%, and their assembly).
It must be noted that usage of the maps with high time exposition i.e. maximal magnitude (maximal intensity) for given territory (for return period of 50 years and exceedance probability 2% or 1%) physical nonlinearity of soils neces-sarily must be taken into account with the help of developed tools [37, 38, 39].
Unlike small-scale 1:8 000 000 seismic hazard map of the territory of Russia (GSZ) maps of DSZ in scale 1:200 000 allow taking into account features of specific seismic
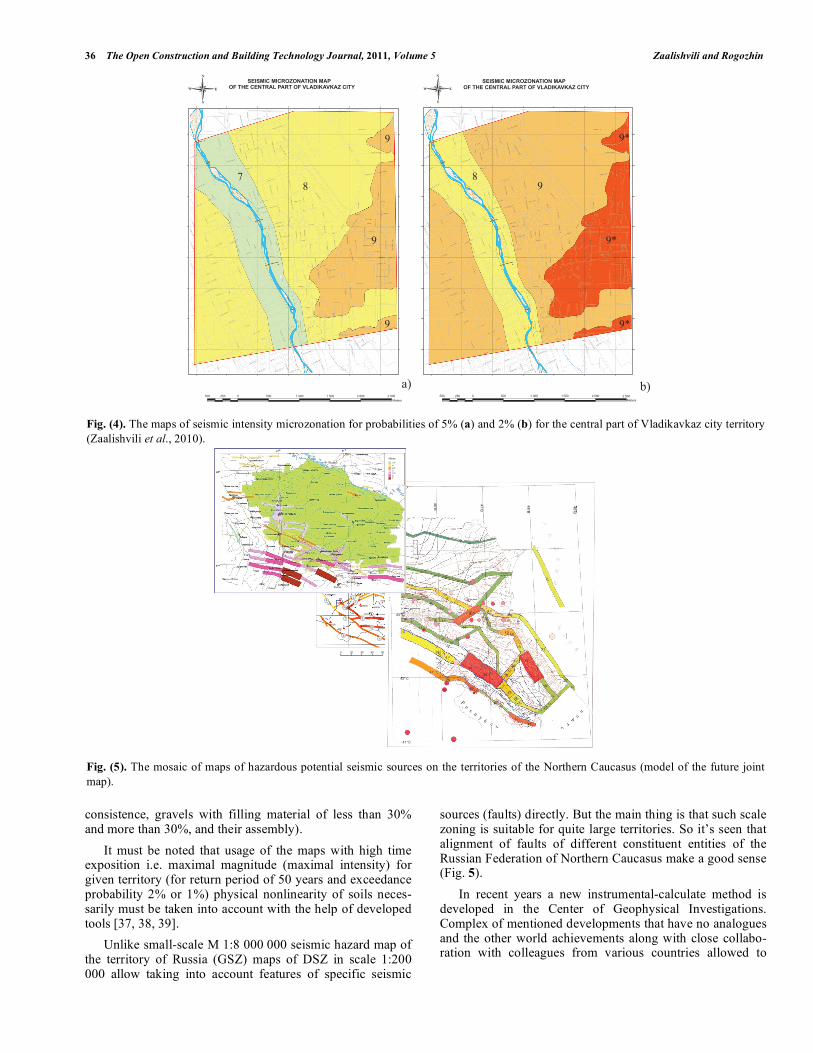
sources (faults) directly. But the main thing is that such scale zoning is suitable for quite large territories. So it’s seen that alignment of faults of different constituent entities of the Russian Federation of Northern Caucasus make a good sense (Fig. 5).
In recent years a new instrumental-calculate method is developed in the Center of Geophysical Investigations. Complex of mentioned developments that have no analogues and the other world achievements along with close collabo-ration with colleagues from various countries allowed to
Fig. (4). The maps of seismic intensity microzonation for probabilities of 5% (a) and 2% (b) for the central part of Vladikavkaz city territory
(Zaalishvili et al., 2010).
Fig. (5). The mosaic of maps of hazardous potential seismic sources on the territories of the Northern Caucasus (model of the future joint
map).
�������������������������������������� ���������� �������������D
�������������������������������������� ���������� �������������D�
�
�
�
�
�
�
�
��
�
�
� ��
��
��
��
������� ��� � ��� ����� ����� ����� �����
� � ����� ��� � ��� ����� ����� ����� �����
� � ��
���
���
���
��� ��
�
�
����
����
����
����
����
��������
����
����
� �
�
��
���
����
���
�
� ���
���
��
�����
��
����
���
��
����
��
��
��
��
��
��
��
��
��
���
���
�
���
�
������
������
���
���
���
���
���
���
���
���
���
���
�����
�����
� �� � �� ��
���
���
����
���
���
���
��� ���
��� ���
!�"�
��� ���
���� ��
�����
�
�
�
�
� �
��
�
�
�
�
���
�#$%
�����������

Assessment of Seismic Hazard of Territory on Basis The Open Construction and Building Technology Journal, 2011, Volume 5 37
enlarge range of solving tasks and physical foundation of final results.
SPECIFIED SEISMIC FAULT AND DESIGN SEISMIC MOTION
Analysis and consequent account of initial accelerograms transformation will become the basis for site effect analysis at strong seismic loadings (Fig. 6) [40].
Methods of such modeling are based on accordance of spectral properties of modeled and real earthquake. In a whole modeling accuracy depending on the purposes of total motion usage and what characteristics defining structural system behavior must be reproduced.
Earthquake source that is a region of rupture can be con-sidered as point source only for much larger distances than fault size. At close distances effects of finite fault size be-come more significant. Those phenomena are mainly con-nected with finite rupture velocity, which causes energy ra-diation of different fault parts in different times and seismic waves are interference and causes directivity effects [41, 42].
Let’s compare amplitude spectra of obtained design ac-celerograms with spectrum of real earthquake from consider-ing fault. Data analysis (Figs. 7 & 8) shows that spectra of calculated and real earthquakes in a whole are similar in their main parameters.
It must be noted that spectrum of vertical component of real earthquake is closer to design spectra. The last fact is quite obvious and is explained by proximity to earthquake source. Indeed, close earthquakes in general are character-ized by predomination of vertical component. Record of
TEA station (located in theater) was selected due to its loca-tion on dense gravel and has a minimal distortions caused by soil conditions.
Analysis of spectrum of weak earthquake shows that peaks are observed on 1.3 and 5.6 Hz (Fig. 7). In spectra of synthesize accelerograms mentioned amplitudes are also observed. At the same time medium response on strong earthquake, undoubtedly, differ from weak earthquake re-sponse (Fig. 6) [37].
Fig. (7). Spectra of design accelerograms at different source loca-
tions of earthquake =7,1: 1 – western part of fault; 2 – middle
part of fault; 3 – eastern part of fault
Usage of maps of detailed seismic zoning in units of ac-celerations at seismic microzonation level is possible only
a) b)
c) d) Fig. (6). Synthetical accelerograms for different source locations: a – western part of fault; b – middle part of fault; c – eastern part of fault;
d – scheme of sources of scenarios earthquakes
VLADIKAVKAZ
10 km
1 2
3

38 The Open Construction and Building Technology Journal, 2011, Volume 5 Zaalishvili and Rogozhin
for calculation method giving results in units of accelera-tions. Today traditional instrumental method of seismic mi-crozonation does not allow obtaining intensity increments in accelerations due to traditional orientation on macroseismic intensity indexes. The exclusion is the case of investigation of strong earthquakes accelerations when instrumental re-cords are obtained (in presence of accelerometer) [37]. At the same time investigations are conducted and the problem supposed to be solved.
On the other hand in recent years a new instrumental-calculation method was developed [38]. New method is based on selection from database (including about 5000 earthquake records) soil conditions which are the most ap-propriate to real soil conditions of the investigated site. Then the selection of seismic records with certain parameters or their intervals follows (magnitude, epicentral distance, and source depth). Then maximal amplitudes are recalculated for given epicentral distances. Absorption coefficient can be calculated by attenuation model for given region.
Thus, a new complex method of seismic hazard assess-ment providing probability maps of seismic microzonation, which are the basis of earthquake-proof construction, is in-troduced. Undoubtedly such approach significantly increases physical validity of final results.
Considered procedures on the level of possible seismic sources zones exploration, maps of detailed seismic zoning and seismic microzonation may differ from described above. So paleoseismological investigations like «trenching» [14], which allow determining more reasonable the recurrence and other features of seismic events realization are also possible when it is necessary.
Today, we have conditions for detailed seismic zoning maps development like the above mentioned but for all the territory of the Northern Caucasus on basis of the modern achievements of engineering seismology. It will give us a possibility to develop probabilistic maps of seismic micro-zonation with the help of powerful no explosive sources, methods taking into account physical soils nonlinearity [39].
CONCLUSIONS
New complex method of seismic hazard assessment pro-viding probability maps of seismic microzonation (which are the basis for earthquake-proof construction) is introduced. The approach based on the latest achievements of engineer-ing seismology, can significantly increase the adequacy of assessments and reduce inaccuracy in earthquake design and construction. Such approach is characterized by higher physical validity of final results.
On the bases of different data analysis (seismological, geological, geophysical, etc.) set of probability maps were created for return period of 50 years and exceedance prob-ability 2%, 5% and 10%. Earthquake effect is assessed on basis of two different parameters: macroseismic intensity (MSK-64) and peak ground acceleration (PGA). It is pro-posed to use the map of 5% probability for the mass, i.e. the main construction, and map of 2% probability for high re-sponsibility construction.
The approach based on physical mechanisms of source causes design of the synthesized accelerograms generated on the base of maximum magnitude value, fault length, the real epicenter of a dangerous source, is certainly the most physi-cally proved. Using as initial data of the scenario synthesized records, taking into account the characteristics of faults, takes into account the transformation of the original accel-erograms stipulated by soil properties of the territory.
Ability of realization of investigations on mapping of seismic hazards such as detailed seismic zoning (DSZ) based on the most advanced field methods of research and analysis for each of the subjects of the Northern Caucasus separately on a scale of 1:200 000 will subsequently bind together in a few achievable, at first glance, but geologically and geo-physical quite reasonable one map DSZ of entire Northern Caucasus, where equal scale source zones will be merged into a one network of source zones. Proposed approach will allow carrying out more purposeful work on seismic micro-zoning of territories (SMZ) not formally, but taking into ac-
Fig. (8). Spectra of accelerograms of weak earthquake with epicenter in the zone of Vladikavkaz fault. (25.08.2005 10:25 GMT, H = 8 km
M= 2.5).

Assessment of Seismic Hazard of Territory on Basis The Open Construction and Building Technology Journal, 2011, Volume 5 39
count the peculiarities of a particular region based on the use of some most advanced SMZ methods and techniques for creating probability SMZ maps - the immediate basis of earthquake-proof design and construction.
REFERENCES
[1] R. Musson, “Probabilistic seismic hazard maps for the North Bal-
kan region”, Anali di Geofisic, vol. 42, no. 6, pp. 1109-1124, 1999. [2] C. A. Cornell, “Engineering risk in seismic analysis”, Bull Seism
Soc Am, vol. 54, pp. 1583-1606, 1968. [3] R. McGuire, “Probabilistic Seismic hazard analysis and design
earthquakes: closing the loop”, BSSA, vol. 83, no. 5, pp.1275-1284, 1995.
[4] P. Bazzurro, and C. A. Cornell, “Disaggregation of Seismic Haz-ard”, Bull. Seism. Soc. Am., vol. 89, no. 2, pp. 501-520, 1999.
[5] R. McGuire, “FORTRAN computer program for seismic risk analysis», US Geological Survey, Open File Report 76-67, 1976,
90, [3] pages (390/M3/1977), pp. 76-67. [6] S. McClusky, S. Balassanian, A. Barka, C. Demir, S. Ergintav, I.
Georgiev, O. Gurkan, M. Hamburker, K. Hurst, H. Kahle, K. Kastens, G. Kekelidze, R. King, V. Kotev, O. Lenk, S. Mahmoud,
A. Mishin, M. Nadariya, A. Ouzounis, D. Paradissis, Y. Peter, M. Prilepin, R. Reilinger, I. Sanli, H. Seeger, A. Tealab, M. N. Toksoz,
and G. Veis, “Global Positioning System constraints on plate kinematics an dynamics in the eastern Mediterranean and Cauca-
sus”, J. Geophys. Res., vol. 105, No. B3, pp. 5695-5719, 2000. [7] “Paleoseismology of Great Caucasus”. Moscow: Nauka, 1979, 188
p. (in Russian). [8] E. A. Rogozhin, B. M. Bogachkin, and Y. V. Nechaev, “Seismotec-
tonic values of transversal zonality of of north-western part of Big Caucasus”, Modeling of seismic process development. State scien-
tific-technical program: Global changes of environment and cli-mate. Moscow: UIPE RAS, 1993, pp. 139-148. (in Russian).
[9] E. A. Rogozhin, O. M. Ostach, and R. I. Dzhibson, “Intensive landslides activation in Stavropol territory as an example of “quiet”
natural catastrophe”, Federal system of seismological observations and earthquakes prediction. Unformational-Analytical Bulletin,
vol. 1, no. 3, pp. 114-120, 1994. (in Russian). [10] E. A. Rogozhin, and Y. V. Nechaev, “Tendencies of evolution of
Caucasus and Stavropol seismogenic zones”, Explor. Prot. Subsur-face Resour., no. 2, 1998, pp. 23-28 (in Russian).
[11] Y. V. Nechaev, G. I. Reisner, E. A. Rogozhin, and B. A. Nechaev, “Geological-geophysical and seismological criteria of potencial
seismicity of Western Caspian”, Explor Protect Subsurface Resour., no. 2, 1998, pp. 13-16 (in Russian).
[12] E. A. Rogozhin, V. N. Strahov, and S. L. Unga, “New concept of earthquakes prediction”, Complexing of seismological and ground-
space geophysical methods in the purposes of medium-term and short-term forecast of earthquakes. UIPE RAS, 1999, pp.13-18 (in
Russian). [13] V. G. Trifonov, Neotectonics of Eurasia, Moscow: Nauchniy Mir,
1999, 252 p. (in Russian). [14] E. A. Rogozhin, “History of activity of seismogenic structures of
Northern Eurasia in Holocene”, Reports RAS, vol. 370, no. 3, pp. 390-392, 2000. (in Russian).
[15] E. A. Rogozhin, A. N. Ovsyuchenko, A. V. Marakhanov, S. S. Novikov, B. V. Dzeranov, and D. A. Melkov, «Research report
“Investigations of marks of possible occurrence of seismic activity in the zone of Vladikavkaz fault”, Vladikavkaz, vol. 1, book 8, pp.
33, 2008. (in Russian). [16] I. Gamkrelidze, T. Giorgobiani, S. Kuloshvili, G. Lobjanidze, and
G. Shengelaia, “Active Deep Faults Map and the Catalogue for the Territory of Georgia”, Bull. Georgian Acad. Sci., vol. 157, no.1, pp.
80-85, 1998. [17] V. Ulomov, L. Shumilina, V. Trifonov, T. Kronrod, N. Zhalk-
ovsky, V. Imaev, A. Ivastchenko, V. Smirnov, A. Gusev, S. Balas-sanian, A. Gassanov, R. Ayzberg, T. Chelidze, A. Kurskeev, A.
Turdukulov, A. Drumya, S. Negmatullaev, T. Ashirov, B. Pustovitenko, and K. Abdullabekov, “Seismic Hazard of Northern
Eurasia”, Annali di Geofisica, vol. 42, no. 6, pp. 1023-1038, 1999. [18] E. A. Rogozhin, “Seismotectonics of Central sector of the Great
Caucasus as basis for seismic monitoring and seismic hazard as-sessment”, Bull Vladikavkaz Scientific Center, vol. 9, no. 4, pp. 16-
22, 2009. (in Russian).
[19] G. I. Reisner, L. I. Ioganson, “Complex typification of earth crust
as basis for fundamental and applied tasks solution”, Bull MOIP, vol. 72, no. 3, pp. 5-13, 1997. (in Russian).
[20] E. A. Rogozhin, G. I. Reisner, and L. I. Ioganson, “Assessment of seismic potencial of Big Caucasus and Apennines by independent
methods”, Modern mathematical and geological models in applied geophysics tasks: selected scientific works. Moscow: UIPE RAS,
2001, pp. 279-300. (in Russian). [21] A. R. Arakelyan, V. B. Zaalishvili, V. D. Makiev, and D. A.
Melkov, “To the question of seismic zoning of the territory of the Republic of North Ossetia-Alania”, Procs. of Ist International con-
ference “Dangerous natural and man-caused processes on the mountaneous and foothill territories of Northern Caucasus”,
Vladikavkaz September 20-22, 2007. Vladilavkaz: VSC RAS and RNO-A, 2008, pp. 263-278 (in Russian).
[22] E. A. Rogozhin, I. P. Gabsatarova, and E. V. Pogoda, “Zones of possible eartquale sources and seismicity of the territory of North
Ossetia-Alania”, Seismicity of Northern Eurasia. Materials of in-ternational conference, dedicated to 10th anniversary of “Seismicity
of Nothern Eurasia” proceedings. Obninsk, 2008, pp. 243-249. (in Russian)
[23] T. Chelidze, and Z. Javakhishvili, “Natural and technological haz-ards of territory of Georgia: implications to disaster management”,
Journal of Georgian Geophysical Society, Issue (A) Solid Earth, vol. 8. pp. 3-18, 2008.
[24] E. I. Byus, “Seismic conditions of Transcaucasus”, Part I. Tbilisi: Academy of Sciences of USSR, 1948. (in Russian)
[25] E. I. Byus, “Seismic conditions of Transcaucasus”, Part II. Tbilisi: Academy of Sciences of USSR, 1952. (in Russian)
[26] E. I. Byus, “Seismic conditions of Transcaucasus”, Part III. Tbilisi: Academy of Sciences of USSR, 1955. (in Russian)
[27] “New Catalogue of strong Earthquakes in the USSR from Ancient times through 1977-1982”, NOAA, USA, pp. 15-21.
[28] Z. Javakhishvili, O. Varazanashvili, and N. Butikashvili, “Interpre-tation of the Macroseismic field of Georgia”, Journal of Georgian
Geophysical Society, Issue (A) Solid Earth, vol. 3, pp. 85-88, 1998. [29] S. Balassanian, T. Ashirov, T. Chelidze, A. Gassanov, N. Kondor-
skaya, G. Molchan, B. Pustovitenko, V. Trifonov, V. Ulomov, D. Giardini, M. Erdik, M. Ghafory-Ashtiany, G. Grunthal, D. Mayer-
Rosa, V. Schenk, and M. Stucchi, (1999a), “Seismic hazard as-sessment for the caucasus test area”, Anali Di Geofisica, vol. 42,
no. 6, pp. 1139-1151, 1998. [30] S. Balassanyan, S. Nazaretyan, Avanessyan, A. Arakelian, V.
Igumnov, M. Badalian, A. Martirosian, V. Ambartsumian, and A. Tovmassian, “The new seismic zoning map for the territory of Ar-
menia”, Nat. Hazards, vol. 15, pp. 231-249, 1997. [31] S. Balassanyan, A. Martirosian, S. Nazaretyan, A. Arakelian,
Avanessyan, V. Igumnov, and E. Ruttener, “Seismic Hazard as-sessment in Armenia”, Nat. Hazards, vol. 18, pp. 227-236, 1999.
[32] Z. Sh. Javahishvili, “Analysis of seismic hazard and seismicity of high-altitude Inguri dam site”, Geodynamical hazard of high-
altitude dams, Tbilisi, 2002, pp. 88-96 (in Russian). [33] Z. Javakhishvili, T. Godoladze, M. Elashvili, and T. Mukhadze,
“The Tbilisi earthquake of April 25, 2002 in the context of the seismic hazard of Tbilisi urban area”, Bolletino di geofizika: Te-
orica ed Applckata, vol. 45, No. 3, pp. 169-185, 2004. [34] A. Arakelyan, L. Asatryan, A. Melikyan, S. Margaryan, and R.
Durgaryan, “Background seismic hazard assessment for Achapnyak community of Yerevan-City”, Proceedings of the 1st
All-Russian school-seminar of young-scientists, October 19-22, 2005.
[35] P. Smit, V. Arzmanian, Z. Javakhishvili, S. Arefiev, D. Mayer-Rosa, S. Balassanian, and T. Chelidze, “The Digital Accelerograph
Network in the Caucasus”, Earthquake Hazard and Seismic Risk Reduction, Kluwer Academic Publishers, 2000, pp. 109-118.
[36] B. Bender, and D. M. Perkins, “SEISRISK III: a computer program for seismic hazard estimation”, US Geol. Surv. Bull., vol. 1772, pp.
48, 1987. [37] V. B. Zaalishvili, Physical bases of seismic micro-zoning, Moscow:
UIPE RAS, 2000, p. 367. (in Russian) [38] V. B. Zaalishvili, Basics of seismic micro-zoning, Vladikavkaz:
VSC RAS and RNO-A, 2006, p. 242. (in Russian) [39] V. B. Zaalishvili, Seismic Micro-Zoning of Urban Territories,
Settlements and Large Building Sites, Moscow: Nauka, 2009, p. 350. (in Russian)

40 The Open Construction and Building Technology Journal, 2011, Volume 5 Zaalishvili and Rogozhin
[40] V. B. Zaalishvili, D. A. Melkov, and O. G. Burdzieva, “Determina-
tion of seismic impact on the basis of specific engineering-seismological situation of region”, Earthquake Eng. Buil. Saf., vol.
1. pp. 35-39, 2010. (in Russian)
[41] I. A. Beresnev, and G. M. Atkinson, “Modeling finite fault radia-
tion from n spectrum”, Bull. Seism. Soc. Am., vol. 87, pp. 67-84, 1997.
[42] I. A. Beresnev, and G. M. Atkinson, “FINSIM – a FORTRAN program for simulating stochastic acceleration time histories from
finite faults”, Seismol. Res. Lett., vol. 69, no. 1, pp. 27-32, 1998.
Received: December 29, 2010 Revised: March 04, 2011 Accepted: March 07, 2011
© Zaalishvili and Rogozhin; Licensee Bentham Open.
This is an open access article licensed under the terms of the Creative Commons Attribution Non-Commercial License (http://creativecommons.org/-
licenses/by-nc/3.0/) which permits unrestricted, non-commercial use, distribution and reproduction in any medium, provided the work is properly cited.