opec o organization of the petroleum exporting … · tel +43 1 21112 fax +43 1 2164320 e-mail:...
TRANSCRIPT

November 2010
Feature Article:Market cushion accommodates recent refinery outages
Oil market highlights
Feature article
Crude oil price movements
Commodity markets
World economy
World oil demand
World oil supply
Product markets and refinery operations
Tanker market
Oil trade
Stock movements
Balance of supply and demand
1
3
5
10
15
23
32
40
45
48
57
62
OPECOrganization of the Petroleum Exporting Countries
Monthly Oil Market Report
Tel +43 1 21112 Fax +43 1 2164320 E-mail: [email protected] Web site: www.opec.org
Data Summary OPECOrganization of the Petroleum Exporting Countries
Monthly Oil Market Report
Tel +43 1 21112 Fax +43 1 2164320 E-mail: [email protected] Web site: www.opec.org
Data Summary
Helferstorferstrasse 17, A-1010 Vienna, Austria


_________________________________________________________________________________________________________________________________________Monthly Oil Market Report
November 2010 1
Oil Market Highlights The OPEC Reference Basket moved within a higher but narrow range of $78.50-81.50/b in
October. This resulted in a monthly average of nearly $80/b, the second highest so far this year after April’s $82.33/b. The rise in the OPEC Reference Basket was driven by bullish sentiment in the futures market, mainly attributable to the weaker US dollar following the second round of quantitative easing. The Basket continued moving higher in November to stand at $85.27/b on 10 November. The Nymex WTI front-month rose $6.43 to stand slightly below $82/b in October before going on to hit a two-year high in the first week of November. Similarly, ICE Brent gained a further $5.12 to average $83.54/b and then moved beyond $88/b in November.
Growth in the world economy was revised up to 4.1% for 2010, supported by a better-than-expected expansion in the manufacturing sector of the OECD. Growth for 2011 remains unchanged at 3.6% as it is still unclear if the current momentum can be carried over into the coming year. A relative resilient US economy is now forecast to grow at 2.7% in 2010 and 2.4% in 2011. The forecast for Japan was revised up slightly to 2.9% for 2010 and left unchanged at 1.3% for 2011. Germany’s manufacturing base has been driving the expansion in the Euro-zone to 1.4% in 2010 and 1.1% in 2011. Growth expectations for China remain at 9.5% in 2010 and 8.6% in 2011, while India’s forecast was revised up to 8.5% in 2010 and remains unchanged at 7.7% in 2011.
World oil demand growth in 2010 has been revised up by 190 tb/d to now stand at 1.3 mb/d. Oil demand has been picking up in the third quarter. Consumption in the OECD has outpaced expectations as a result of the stronger-than-expected economic activities, supported by various stimulus plans. The forecast for world oil demand growth in 2011 has been revised up by around 120 tb/d to now stand at 1.2 mb/d. The improved outlook for OECD demand is a key factor behind this adjustment. However, given the higher baseline, oil demand growth is expected to be lower than in the current year.
Non-OPEC supply growth in 2010 is projected to increase by 1.0 mb/d, a minor upward revision from the previous report, supported by growth in the US, China, Brazil, Russia, Canada, and Colombia. In 2011, non-OPEC supply is forecast to grow by 360 tb/d, in line with the previous assessment. Brazil, Canada, Ghana, Colombia, Kazakhstan, and Azerbaijan are expected to be the main contributors to next year’s growth, while Norway, UK, and Mexico are anticipated to experience the largest declines. OPEC NGLs and non-conventional oils are estimated to average 5.2 mb/d in 2011, indicating growth of 450 tb/d over the current year. In October, OPEC crude production averaged 29.30 mb/d, an increase of 144 tb/d over the previous month.
Strong distillate demand across the globe amid open arbitrage to Europe following the French strike has slightly lifted sentiment in the product markets. However, weak fuel oil demand has diminished the impact in some areas. Once the tight supply situation in Europe ends, the gasoline market is expected to move back over to the bearish side, given low seasonal demand, and the oversupply of fuel oil is likely to keep refinery margins depressed over the coming months.
The tanker market experienced mixed patterns in October. High tonnage availability combined with the seasonal drop in oil demand in some markets contrasted with active markets for other routes. VLCC spot freight rates declined 2.9%, while Suezmax jumped 24.8% and Aframax rose 11.6% m-o-m in October. Clean market freight rates also experienced a negative performance in October amid mixed patterns. East of Suez rates slumped 14.4%, while West of Suez rates rose 4.4%.
US commercial stocks declined 11.6 mb in October, despite a 7.2 mb build in crude as products dropped by a substantial 18.8 mb. Despite the draw, US stocks remained at a comfortable surplus of 107 mb over the five-year average. EU 15 plus Norway total inventories rose 8.5 mb driven by a build of 10.7 mb in crude, while products fell 2.2 mb. European stocks stood 6.3 mb above the five-year average. The most recent data for September shows commercial stocks in Japan fell by 10.6 mb. However, preliminary indications for October show a rebound of 7.9 mb.
The demand for OPEC crude in 2010 is estimated at 28.8 mb/d, following an upward adjustment of 0.3 mb/d from the previous report. This represents a decline of 0.2 mb/d compared to a year ago. In 2011, the demand from OPEC crude is expected to average 29.2 mb/d, about 0.4 mb/d higher than in the previous year, following an upward adjustment of 0.4 mb/d from the previous assessment.

Monthly Oil Market Report______________________________________________________________________
November 2010 2

_______________________________________________________________________________________________________________________________________________Monthly Oil Market Report
November 2010 3
Market cushion accommodates recent refinery outages Developments in the downstream have always had an important impact on crude oil prices. However, the recent refinery outages in France indicate just how much this relationship has changed since the economic crisis.
On 27 September, workers at the Fos-Lavera oil terminal went on strike over pension and port reforms. By the time it was resolved five weeks later, the strike had left more than 50 crude and product tankers stranded offshore and contributed to a shutdown of as much as 60% of France’s refining capacity.
France’s refining sector makes up a considerable 12% share of total Western Europe (EU 15 plus Norway). In terms of products, the closure of the country’s refining capacity represents a combined disruption of 1 mb/d of gasoline and distillates. However, the French strike only had a moderate impact on product prices, with the gasoil crack spread remaining broadly unchanged over this period despite high seasonal demand. While the structure of the gasoil market did switch to backwardation, this is likely to be only a temporary shift.
Only a few years ago such a considerable and prolonged outage would have had a strong impact both on product and crude prices. Indeed, between 2004 and the start of the economic crisis, the disruption of even one refinery could have had a considerable price impact. Given the tightness in global refining capacity at that time, refiners had to run at high utilization rates of more than 90% and so reports of almost any outages resulted in immediate upward price pressures. A number of developments have led to a very different market response this time.
The first is the expansion of crude distillation capacity. As an indicator of the tightness of the market, the difference between global refining capacity and world oil demand shows a gap of around 6 mb/d, a considerable increase over the low level of around 2 mb/d seen between 2005 and 2007 (Graph 1). This growth has occurred as several grassroots refinery projects have come onstream and, at the same time, capacity at existing refineries has also been expanded. Additionally, world oil demand has contracted in the wake of the economic crisis. In the OECD, oil demand now stands at around 4 mb/d below the level seen in 2005. This has also contributed to the increase in surplus refining capacity.
Graph 1: Refinery capacity vs. world oil demand Graph 2: OECD distillate stocks: deviation from 5-yr avg.
Moreover, the regional supply/demand balances have been changing as emerging economies, especially in Asia, expand their own refining capacities. As a result, some have become product exporters rather than importers, adding to the pool of refined products across the globe.
Another development that helped to dampen the impact of the recent refinery outages is the persistent overhang in global product inventories, with distillates alone representing a surplus of around 55 mb above the five-year average (Graph 2). In addition to high commercial product stocks, an estimated 24 mb in products was immediately available in floating storage when the strike began at the end of September.
The refinery outages in France have demonstrated that the high level of idle refining capacity, along with the overhang in product inventories both onshore and offshore, provide an ample cushion to cover such a large and prolonged disruption in the downstream. Looking ahead to the upcoming winter season, circumstances in the downstream, and for both crude and product inventories, are not expected to change considerably. As a result, the market should be well prepared even if the winter demand turns out to be stronger than expected.
Moreover, results published recently in the OPEC World Oil Outlook 2010 demonstrate that expected capacity additions will continue to outpace required crude runs, thus widening the existing surplus by more than 1 mb by 2015. Therefore, overcapacity in the refining sector is likely to persist even into the medium term.
0123456789
50556065707580859095
1990
1991
1992
1993
1994
1995
1996
1997
1998
1999
2000
2001
2002
2003
2004
2005
2006
2007
2008
2009
MbMb
World oil demand Global ref inery capacity
Dif ference: Ref inery capacity and demand (RHS)
-100
-80
-60
-40
-20
0
20
40
60
80
100
Jan 0
3
May 0
3
Sep
03
Jan 0
4
May 0
4
Sep
04
Jan 0
5
May 0
5
Sep
05
Jan 0
6
May 0
6
Sep
06
Jan 0
7
May 0
7
Sep
07
Jan 0
8
May 0
8
Sep
08
Jan 0
9
May 0
9
Sep
09
Jan 1
0
May 1
0
Sep
10
Mb

Monthly Oil Market Report__________________________________________________________________________________________________________________________________________
4 November 2010

_________________________________________________________________________________________________________________________________________Monthly Oil Market Report
November 2010 5
Crude Oil Price Movements
OPEC Reference Basket The OPEC Basket rose for the third month in a row to average almost $80/b
The OPEC Reference Basket kept its momentum in October to trade within a higher but narrow range of $78.50-$81.50/b. The upward movement came in line with the increase in the futures market where macroeconomic sentiment and financial markets continued to be the major drivers for the price of oil. The OPEC Reference Basket increased for the third consecutive month to average $79.86/b, up $5.23 or 7% from September, the second highest level so far this year after the $82.33/b of April. Compared to a year earlier, the OPEC Basket showed an increase of $7.19 or 10% in October. However, the OPEC Reference Basket increased by just $2.26 or 2.9% from the last trading day of 2009 to the last trading day of October 2010. The OPEC Reference Basket stood at $77.16/b on 31 December 2009 and at $79.42/b on 29 October 2010. All Basket components increased. Contrary to the previous months when African crudes showed higher growth than the Basket average due to the higher quality, this time, in October, African crudes, with the exception of Libyan crude Es Sider, showed lower growth than the Basket. While the OPEC Reference Basket rose by 7%, Nigerian Bonny Light rose by just 5.9%, Algerian Saharan Blend increased by 6.3% and Angolan Girassol by 6.9%. The exception came from Libyan grade Es Sider, which rose by 7.1%, slightly more than the Basket. The main reason behind lower gains of African crudes relative to other crudes is attributed to lower European crude oil demand because of the strike in the French port and refineries. Many vessels remained unloaded for weeks and 11 of 12 refineries went on strike. Middle Eastern light and heavy crudes were the main drivers for the OPEC Reference Basket thanks to the bullish sentiment on the back of strong Asian demand and a surge in crack spreads for naphtha and middle distillates in combination with the expected peak demand season for heating oil in Asia which required more storage. In mid-October, November gasoil cracks rebounded to a 3-1/2 month high premium to Dubai, and Murban was sold at a higher premium. In the last ten days of the month, a cargo of December-loading Murban was sold at the strongest differential in at least a year on the back of strong gasoil cracks. Middle Eastern grades were also lifted by the Russian ESPO blend which was sold at high premiums in October. That resulted in an increase of Basrah Light by 7.7%, followed by Iran Heavy by 7.4%, Arab Light by 7.2% and Kuwait Export by 7.1%. Only Qatar Marine and Murban witnessed lower growth compared with the Basket of 6.7% and 6.4%, respectively. Lower gains of Murban and Qatar Marine came to some extent as a correction from the high levels of the previous month when they rose by more than 1% each, higher than the Basket’s average growth of 0.6% and even higher than the remaining Middle Eastern crudes, which rose by around 5%. Latin American crudes also increase in October. Ecuador’s Oriente jumped by $5.73 or 8.1%, the largest gain among the Basket components, to average $76.42/b. The Venezuelan component recovered from the loss of the previous month to gain $4.30 or 6.4%, the lowest increase, to average $71.21/b.
65
70
75
80
85
90
65
70
75
80
85
90
02 A
ug
09 A
ug
16 A
ug
23 A
ug
30 A
ug
06 S
ep
13 S
ep
20 S
ep
27 S
ep
04 O
ct
11 O
ct
18 O
ct
25 O
ct
01 N
ov
08 N
ov
US$/bUS$/b
OPEC Basket WTI Brent Dated
Graph 1-1: Crude oil price movement

Monthly Oil Market Report_________________________________________________________________________________________________________________________________________
November 2010 6
The OPEC Reference Basket continued its upward trend in early November to stand at $85.27/b on 10 November, the highest level since the $84.36/b of 3 May 2010. The strong increase in the OPEC Reference Basket came in line with the strength in futures contracts of WTI and Brent, which also hit multi-month highs in the first week of November.
The oil futures market Crude oil futures moved beyond $80/b, supported by a weaker US dollar
Crude oil futures prices for the Nymex WTI and ICE Brent front months broke the $70-80/b range in October. Nymex WTI front-month settled below $80/b on just one day, 19 October, after falling by 4.32%, the largest one-day percentage loss since 4 February when front-month crude dropped almost 5%, as the dollar strengthened on safe-haven buying following a surprise 25-basis point increase in the one-year lending and deposit rate by China. The hike in the interest rate, the first such increase in three years, triggered worries by investors that this could dampen Chinese and global growth and slow down the country's increasing demand for commodities, including oil. The break up of the $70-80/b range lasted for more than a month this time contrary to previously when the move was short-lived and prices fell back within the range. The sustainability of prices above $80/b this time was supported mainly by the value of the US dollar and equity markets. The Nymex WTI front-month started October at $81.58/b, after having increased seven times in the previous eight sessions, supported by positive macroeconomic sentiment
Table 1-1: OPEC Reference Basket and selected crudes, US$/bChange
Sep 10 Oct 10 Oct/Sep 2009 2010OPEC Reference Basket 74.63 79.86 5.23 58.25 75.70 Arab Light 74.55 79.93 5.38 58.57 76.02 Basrah Light 73.70 79.36 5.66 57.74 75.02 Bonny Light 79.65 84.35 4.70 60.54 79.18 Es Sider 77.15 82.60 5.45 58.66 77.25 Girassol 77.25 82.55 5.30 59.04 77.61 Iran Heavy 73.58 78.99 5.41 57.65 74.98 Kuwait Export 72.92 78.10 5.18 57.77 74.60 Marine 75.26 80.31 5.05 59.54 76.48 Merey 66.91 71.21 4.30 53.21 68.54 Murban 76.93 82.20 5.27 60.96 78.19 Oriente 70.69 76.42 5.73 53.11 71.25 Saharan Blend 78.95 83.90 4.95 59.61 78.44
Other Crudes Minas 79.47 83.35 3.88 61.97 80.53 Dubai 75.13 80.22 5.09 58.90 76.33 Isthmus 74.16 79.58 5.42 58.13 76.32 T.J. Light 72.60 77.91 5.31 56.97 74.77 Brent 77.80 82.75 4.95 58.93 77.73 West Texas Intermediate 75.14 81.89 6.75 59.04 77.90 Urals 77.39 81.53 4.14 58.45 76.51
Differentials WTI/Brent -2.66 -0.86 1.80 0.11 0.17 Brent/Dubai 2.67 2.53 -0.14 0.03 1.40
Note: Arab Light and other Saudi Arabian crudes as well as Basrah Light preliminarily based on AmericanCrude Market (ACM) and sub ject to revision
Source: Platt's, Direct Communication and Secretariat's assessments
1000
1050
1100
1150
1200
1250
60
65
70
75
80
85
90
01 J
un
14 J
un
27 J
un
10 J
ul
23 J
ul
05 A
ug
18 A
ug
31 A
ug
13 S
ep
26 S
ep
09 O
ct
22 O
ct
04 N
ov
IndexUS$/b
Nymex WTI futures (LHS) S&P 500 index (RHS)
Graph 1-2: Nymex WTI futures and S&P 500 index

_________________________________________________________________________________________________________________________________________Monthly Oil Market Report
November 2010 7
after data showed new US jobless benefit claims fell more than expected and second quarter US growth was revised up to 1.7% from a previous estimate of 1.6%. Prices were also supported by speculation that the US Federal Reserve would launch a second round of quantitative easing, an action which would likely support prices as inventors would look for protection against a falling dollar by investing in commodities, including oil. Furthermore, prices were supported by the dollar hitting a six-month low versus the euro, as data showed Euro-zone banks relying less on funds from the European Central Bank. In addition, a draw in US crude oil and product inventories contributed to the bullishness of the oil market. Prices were also lifted by strong manufacturing data from China, seen as a bullish indicator for oil demand. Again, oil prices continued to move in line with equity markets as both the S&P 500 and Nasdaq witnessed their best monthly performances since April 2009. Prices continued their upward trend in the following weeks to hit $83.08/b on 18 October, supported by macroeconomic data and the value of the US dollar, as well as a strike in French refineries which lifted product prices and thus contributed to the increase in the price of crude oil futures. After the strong drop of 19 October to $79.49/b, the Nymex WTI front-month showed some recovery to move with a range of $80.5-82.50/b in the last eight trading days of the month. The move within a narrow range was attributed to mixed data over the period such as reports showing tepid US economic growth in the third quarter, fears of a glut in crude oil supplies due to the French strike and a weaker US dollar. However, the most supportive factor for prices during that period was the value of the dollar. As shown in the graph below, the price of WTI and the value of the US dollar became highly correlated again, particularly after the emergence of the idea of a second round of quantitative easing. This has been proven in the level of the price of WTI in the first week of November, especially following the approval by the Federal Reserve’s plan to buy $600 billion of Treasury bonds, which can be seen in the price movement of the first week of November when WTI front month hit its seven-month high of $86.49/b on 4 November when the US dollar touched an 11-month low against a basket of currencies. The rise in crude oil prices came in line with the rise in prices of other commodities. Prices increased further the following day to close at $86.85/b, the highest settlement since 8 October 2008, supported by a stronger-than-expected rise in US jobs.
The ICE Brent followed the same trend as the Nymex WTI, but traded in a higher range of $81-85/b in October. Similarly, Brent futures were driven by macroeconomic sentiment and the value of the US dollar. The front-month ICE Brent increased a further $5.12 or 6.5% in October to average $83.54/b, the second highest after April’s $85.75/b. The strike in the French port of Fos-Lavera and some refineries where more than 20 vessels were blocked from unloading seems to have not affected the price of oil, suggesting that futures prices were more driven by other factors rather than fundamentals. The strong increase in ICE Brent futures kept ICE Brent trading at a premium to Nymex WTI. However, the Brent premium to WTI almost halved to average $1.56/b in October from $2.87/b in September. In addition to the high levels of crude oil stocks in the US, the strength of the ICE Brent relative to the Nymex WTI is also attributed to the growing interest of trading on the exchange in London. Total trading volume of the front-month ICE Brent rose from 3.2 million contracts in September to a record high of 3.5 million contracts in October, while trading volume of the front-month WTI on Nymex remained almost unchanged at around 8 million. Total ICE Brent crude futures and options averaged more than 408,000 contracts per day in October 2010, almost 30% higher than a year ago. The same trend was observed in the volume of open interest for the respective front month
70
75
80
85
90
60
65
70
75
80
85
90
01 J
un
14 J
un
27 J
un
10 J
ul
23 J
ul
05 A
ug
18 A
ug
31 A
ug
13 S
ep
26 S
ep
09 O
ct
22 O
ct
04 N
ov
IndexUS$/b
Nymex WTI futures (LHS) USD index (RHS)
Graph 1-3: Nymex WTI futures and USD index

Monthly Oil Market Report_________________________________________________________________________________________________________________________________________
November 2010 8
of Nymex WTI and ICE Brent. Open interest of the front month of ICE crude futures rose by 32% between the end of September and the end of October to stand at more than 225,000 contracts, while for the front-month Nymex WTI, open interest increased by just 11% to around 390,000 contracts.
The impact of speculators on crude oil futures prices remained strong with money managers’ net long crude oil positions on Nymex and the price of WTI following a similar trend. Money managers raised Nymex net long crude oil positions in the week through 2 November to 177,752 contracts, the highest level since the record of 6 April, a day when the WTI front month closed at $86.84/b. The rise of money managers’ net long positions to a second record high of 177,752 contracts coincided with the WTI front month closing at almost $84/b, the highest since 13 April 2010, but 3 days later, on 5 November, the WTI front month closed at $86.85/b, the highest level since 8 October 2008. The sharp increase in money managers’ net long positions seems to be driven by the anticipation of the Federal Reserve’s plan to launch a new round of quantitative easing with implications of higher commodity prices.
The futures market structure The contango narrowed in October on the Nymex and ICE
Oil futures remained in contango in October, but calendar spreads narrowed significantly.
On the Nymex, the spread between the WTI second month and the first month averaged 74¢/b in October, down 42% from the previous month. Similarly, the spread between the sixth and first month fell 40% to average $3.25/b. The reason behind the narrowing spread is due to the fact that the front month rose more than the forward months. For instance, front month Nymex WTI rose by 8.5% in October, while the sixth month increased by just 5.5% and the twelfth month by around 4.5%. Prices at the end of the curve didn’t experience significant changes between the first of October and the first of November. The change was more pronounced at the beginning of the curve. The narrowing contango reflects the bullish sentiment for prompt prices attributed essentially to the weakness of the US dollar, not to a lack of prompt supply. The same trend was observed for ICE Brent where the spread between the third and the first month narrowed to 22¢/b on 1 November from 27¢/b on 1 October and the spread between the sixth and the first month narrowed from $1.85/b to $1.36/b for the same period. The shrinking contango will likely trigger a release of crude oil from floating storage as the current level of calendar spreads are unlikely to be profitable for holding crude oil on vessels considering the cost of storage.
0
40
80
120
160
200
64
68
72
76
80
84
88
Mar 10
Apr 10
May 1
0
Jun 1
0
Jul 1
0
Aug 1
0
Sep 1
0
Oct 1
0
Nov 1
0
Managed money net long positions (RHS) WTI (LHS)
'000 ContractsUS$/b
Graph 1-4: Nymex WTI price vs. Speculative activity
80
82
84
86
88
80
82
84
86
88
1st FM 3rd FM 5th FM 7th FM 9th FM 11th FM
US$/bUS$/b
ICE Brent 1 Nov ICE Brent 1 OctNymex WTI 1 Nov Nymex WTI 1 Oct
Graph 1-5: Nymex WTI and ICE Brent forward curve, 2010
FM = future month
_________________________________________________________________________________________________________________________________________Monthly Oil Market Report
November 2010 9
The sour/sweet crude spread Urals under pressure because of the French strike
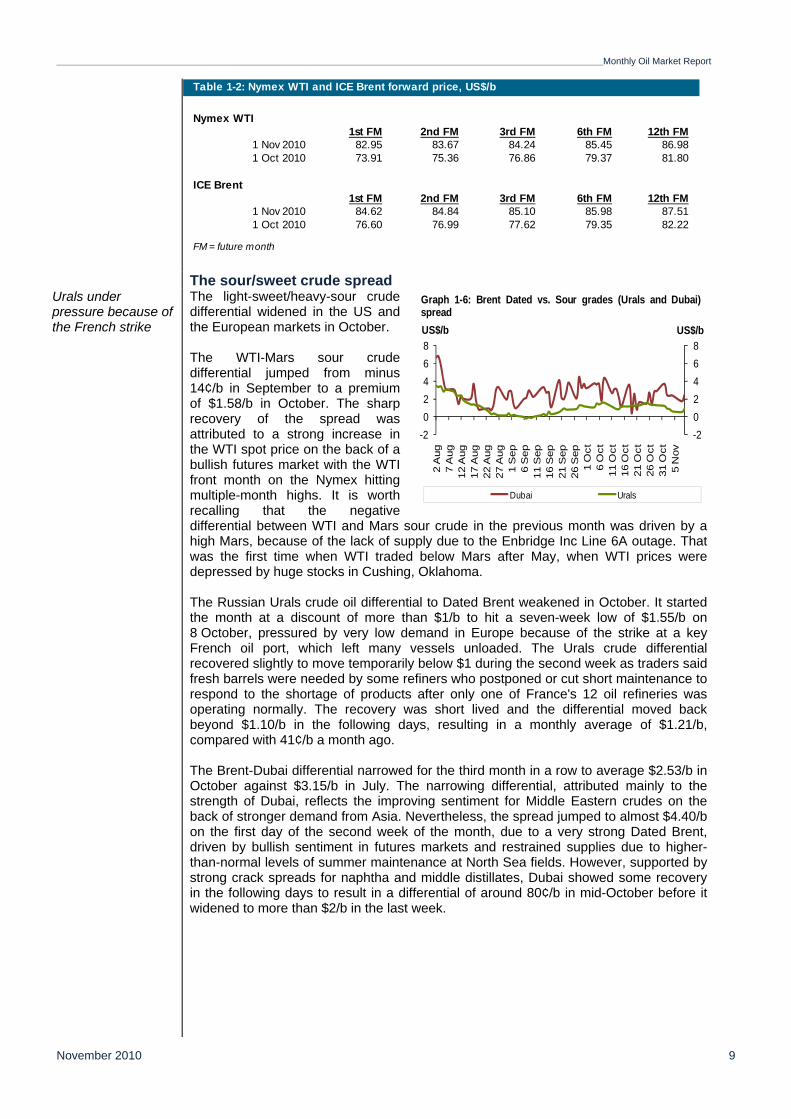
The light-sweet/heavy-sour crude differential widened in the US and the European markets in October. The WTI-Mars sour crude differential jumped from minus 14¢/b in September to a premium of $1.58/b in October. The sharp recovery of the spread was attributed to a strong increase in the WTI spot price on the back of a bullish futures market with the WTI front month on the Nymex hitting multiple-month highs. It is worth recalling that the negative differential between WTI and Mars sour crude in the previous month was driven by a high Mars, because of the lack of supply due to the Enbridge Inc Line 6A outage. That was the first time when WTI traded below Mars after May, when WTI prices were depressed by huge stocks in Cushing, Oklahoma. The Russian Urals crude oil differential to Dated Brent weakened in October. It started the month at a discount of more than $1/b to hit a seven-week low of $1.55/b on 8 October, pressured by very low demand in Europe because of the strike at a key French oil port, which left many vessels unloaded. The Urals crude differential recovered slightly to move temporarily below $1 during the second week as traders said fresh barrels were needed by some refiners who postponed or cut short maintenance to respond to the shortage of products after only one of France's 12 oil refineries was operating normally. The recovery was short lived and the differential moved back beyond $1.10/b in the following days, resulting in a monthly average of $1.21/b, compared with 41¢/b a month ago. The Brent-Dubai differential narrowed for the third month in a row to average $2.53/b in October against $3.15/b in July. The narrowing differential, attributed mainly to the strength of Dubai, reflects the improving sentiment for Middle Eastern crudes on the back of stronger demand from Asia. Nevertheless, the spread jumped to almost $4.40/b on the first day of the second week of the month, due to a very strong Dated Brent, driven by bullish sentiment in futures markets and restrained supplies due to higher-than-normal levels of summer maintenance at North Sea fields. However, supported by strong crack spreads for naphtha and middle distillates, Dubai showed some recovery in the following days to result in a differential of around 80¢/b in mid-October before it widened to more than $2/b in the last week.
Table 1-2: Nymex WTI and ICE Brent forward price, US$/b
Nymex WTI 1st FM 2nd FM 3rd FM 6th FM 12th FM
1 Nov 2010 82.95 83.67 84.24 85.45 86.981 Oct 2010 73.91 75.36 76.86 79.37 81.80
ICE Brent1st FM 2nd FM 3rd FM 6th FM 12th FM
1 Nov 2010 84.62 84.84 85.10 85.98 87.511 Oct 2010 76.60 76.99 77.62 79.35 82.22
FM = future month
-2
0
2
4
6
8
-2
0
2
4
6
8
2 A
ug
7 A
ug
12 A
ug
17 A
ug
22 A
ug
27 A
ug
1 S
ep
6 S
ep
11 S
ep
16 S
ep
21 S
ep
26 S
ep
1 O
ct
6 O
ct
11 O
ct
16 O
ct
21 O
ct
26 O
ct
31 O
ct
5 N
ov
US$/bUS$/b
Dubai Urals
Graph 1-6: Brent Dated vs. Sour grades (Urals and Dubai)spread

Monthly Oil Market Report_________________________________________________________________________________________________________________________________________
November 2010 10
Commodity Markets Trends in selected commodity markets Commodity prices rebounded in October on dollar weakness and fundamental tightness
The IMF commodity price index increased by 5.6% m-o-m in October compared to 1.4% m-o-m the previous month. The energy commodity price index increased by 6.3% m-o-m in October compared to 0.4% in the previous month. Non-energy commodities rose by 3.3% m-o-m in October compared to 4% a month earlier. A substantial price rise took place in several base metals at the LME and important increases took place in agriculture and precious metal prices.
Grain prices remained at high levels in October, but there were some corrections in these markets related to the more bearish view from the supply side for some grains like wheat. Corn markets continued the rally seen in September rising by 14.3% m-o-m in October, supported by strong demand and a lower production forecast. As pointed out, US and global corn stocks remained tight and greater imports from China and Argentina have offset the decrease in US imports. The growth in industrial metals prices improved in October, while conditions in these markets are still very dependent on the expectations of growth in the US and China. The IMF energy commodity index (crude oil, natural gas and coal) gained 6.3% in October compared to 0.8% m-o-m in September on the back of the recovery in WTI and Brent prices, which outpaced the negative performance of Henry Hub (HH) natural gas and coal prices. HH natural gas declined further by 12% m-o-m in October. This compares to 9.7% the previous month, 14% lower than the same month a year ago. The market remained pressured by high production and weak demand, amid moderate temperatures, minimal tropical storm activity and larger-than-expected injections into already considerable stocks which, according to the US Energy Information Administration, are higher than the five-year average.
% ChangeOct 10/Oct 09
Commodity 2.5 1.4 5.6 17.6Non-fuel 4.8 2.8 4.6 27.5Energy 1.1 0.4 6.3 12.0Crude oil 1.7 0.4 7.3 10.3US natural gas -6.9 -9.7 -12.0 -14.1Food 5.2 2.3 5.2 23.1Corn 6.8 17.6 14.3 41.0Wheat 25.6 10.4 -0.6 35.9Soybean oil 7.0 3.8 11.3 29.7Soybeans 1.2 -1.5 5.9 7.7Sugar 2.4 -1.7 2.9 -2.1Cotton 7.4 15.9 20.8 89.4Industrial metals 6.3 3.7 3.4 34.0Tin 13.9 9.5 15.6 74.5Aluminium 6.1 2.9 7.9 24.9Copper 8.2 5.8 7.2 31.5Nickel 9.7 5.8 4.9 28.7Zinc 10.9 5.1 10.3 14.6Iron Ore 0.0 0.0 -11.2 80.2Gold* 1.9 4.5 5.6 28.6Silver* 3.1 11.5 13.9 na
Sources: IMF; Estimations based on data provided by the IMF * World Bank, Commodity price data na Not availab le
% ChangeTable 2-1: Monthly changes in selected commodity prices, 2009-2010
Aug/Jul Sep/Aug Oct/Sep

_________________________________________________________________________________________________________________________________________Monthly Oil Market Report
November 2010 11
The IMF non-fuel commodity price index rose 4.6% m-o-m in October compared to 2.8% in September as a result of some corrections in the wheat markets, a drop in iron ore prices and some restraint in fertilizer prices which were offset by higher growth in some agricultural products, industrial metals and precious metals, silver in particular.
Industrial metal prices saw high gains in October
The IMF industrial metal price index gained 6.7% m-o-m in October. Except for nickel, all base metals considered registered a faster growth rate, led by tin. As a whole, base metals reacted positively to tight fundamentals, improved macro-economic news, the dollar devaluation against the Euro and further encouraging data from China like the higher-than-expected PMI in October.
Tin was the best performer within the base metal complex, soaring by 16% m-o-m in October compared to 9.4% in September, and up 56% on a yearly basis, an all time record price. The factors behind tin’s boosted prices were the recovery in computer and cars industries during this year, fostered by public incentive plans and it is likely that the US quantitative easing may represent an additional source of demand for the tin market. Supply constraints also have been supportive of tin prices as coming on stream of new small capacities is not expected before the first quarter of 2011. Important capacities are expected only in 2012-2013. Copper increased further by 7.2% m-o-m in October compared to 5.8% in the previous month due to the tight supply forecast published this month by the International Copper Study Group, which indicates a deficit in the copper market during January-July 2010. Demand was also healthy. Aluminum registered an increase of 7.9% m-o-m in October on increasing demand of semi-products since the beginning of the year as the production of these products remained healthy, despite the weaker final-user demand following the end of the automotive sector’s incentive measures implemented by many countries. Chinas’ production of semi-products (aluminum, used as a component of food packaging) went to record highs this year. Slower prices are expected only in 2011 due to high global inventories. Zinc prices saw a rally from 5% in September to 10% in October due to a recovery in demand from the EU and China. Nevertheless, stocks at the LME are at high levels, so price corrections are expected.
50
75
100
125
150
175
200
50
75
100
125
150
175
200
Oct 08 Jan 09 Apr 09 Jul 09 Oct 09 Jan 10 Apr 10 Jul 10 Oct 10
IndexIndex
Total Non-fuel Food Metals Fuel (energy) Crude oil
Graph 2-1: Major commodity price indexes, 2008-2010
Commodity price index, 2005 = 100Total: Includes both fuel and non-fuelNon-fuel: Includes food and beverages and industrial inputsFood: Includes cereal, vegetable oils, meat, seafood, sugar, bananas and orangesMetals: Includes copper, aluminum, iron ore, tin, nickel, zinc, lead and uraniumFuel (energy): Includes crude oil (petroleum), natural gas and coalCrude oil: Is the simple average of three spot prices: Dated Brent, West Texas Intermediate and Dubai Fateh
Source: IMF

Monthly Oil Market Report_________________________________________________________________________________________________________________________________________
November 2010 12
According to the World Bank, agricultural prices saw an increase of 5.9% m-o-m in November compared to 4.2% in October due to tight fundamentals associated with high demand from China, bad weather conditions, public intervention, and poorer-than-expected crops in the US. Likewise, the use of corn in the production of biofuel has also been an important factor.
Cotton is at a historically high price after rising 20.8%, fuelled by bad weather conditions and high demand from China together with lower inventories. Corn increased 14.5% which reacted to lower production estimates, stronger demand and increasing demand for the biofuel industry. Thus, the market is in surplus and the final stocks were revised down by 2% compared to the last month. Indeed, the demand for corn has been increasing since 1995. Corn prices are expected to continue the upward trend next year as the biofuel demand is forecast to expand. The soybean complex surged, fuelled by exports to China which is buying to increase stockpiles and due to the weaker dollar.
Gold prices rose by 5.6% m-o-m in October compared to 4.5% in September due to closing of the hedge book fostered by record prices in the later months. Furthermore, investors’ interest slowed as shown by a decline in the net length positions of the money managers at the CFTC. Silver also jumped by 13.9% m-o-m marking historic record levels owing to increased demand and the low ratio to the gold price in this year.
Investment flow into commoditiesOpen interest volume for US commodity markets increased at a slower pace in October
Open interest volume (OIV) for major US commodity markets went up 2.9% m-o-m to 8,216,690 contracts in October compared to 5% in September. Copper and WTI reported major gains while livestock saw important losses. According to the CFTC, non-commercial net length declined by 2.8% m-o-m in October to 2,670,612 contracts. A drop of 1% m-o-m in longs combined with a 2.1% rise in shorts left the net-length as percentage of OIV at 60.6% in October, down from 61.8% in September. Net length of money manager positions showed a slower pace of growth in October (1.3% vs. 17.3% in September) which reflected a drop in some markets, such as agriculture and gold. This is explained by the selling of longs in order to take advantage of high prices as in gold and corn.
100
200
300
400
500
600
700
100
200
300
400
500
600
700
Oct
08
Nov
08
Dec
08
Jan
09
Feb
09
Mar
09
Apr
09
May
09
Jun
09
Jul 0
9
Aug
09
Sep
09
Oct
09
Nov
09
Dec
09
Jan
10
Feb
10
Mar
10
Apr
10
May
10
Jun
10
Jul 1
0
Aug
10
Sep
10
Oct
10
'000 Tonnes'000 Tonnes
Graph 2-2: Inventories at the London Metal Exchange (LME)
Source: LME
5000
6000
7000
8000
9000
5000
6000
7000
8000
9000
Oct 0
7
Feb 0
8
Jun 0
8
Oct 0
8
Feb 0
9
Jun 0
9
Oct 0
9
Feb 1
0
Jun 1
0
Oct 1
0
Graph 2-3: Total open interest volume
'000Ct '000Ct
Source: CFTC

_________________________________________________________________________________________________________________________________________Monthly Oil Market Report
November 2010 13
Agricultural OIV moved up by 3.9% m-o-m to 4,500,158 contracts in October, compared to 4.9% in September. Non-commercial net length declined from 46.5% to 43.9% of the open interest. Non-commercial long positions fell by 1%. The lower strategic investment in agricultural markets in September and October followed the strong activity in the previous months as a result of the the extraordinary price boom in the grain complex. Furthermore, the still booming prices in some agricultural commodities, such as corn, has led to some non-commercial traders taking profits and closing strong positions. The same applies to wheat where the actors seem to be compensating their bullish and bearish expectations. Wheat saw corrections in October in the physical market.
OIV for precious metals decelerated in October, expanding by only 3.5% m-o-m to
771,486, compared to 11.3% the previous month. Non-commercial longs rose at a lower pace than shorts (2.7% vs. 4%). Therefore, the net length as a percentage of open interest volume saw a drop from 25% in September to 24% in October. There was a decline in net length of money managed postions in gold due to the closing of the hedge book induced by record prices seen in later months. Nymex natural gas open interest volume dropped again by 1.2% m-o-m to 800,679 contracts in October. Non-commercial longs increased by 1.6% and short positions increased 0.5%, bringing the net length as percentage of OIV to minus 1.9% from minus 2.3% a month earlier. Copper OIV rose surged 12.9% m-o-m to 160,573 contracts in October. Non-commercial net length increased by 9.3% to 64,075 contracts while net length of money positions rose by 28.1% to 32,391 contracts.
-100
0
100
200
300
400
300
700
1100
1500
1900
2300
Oct 07 Feb 08 Jun 08 Oct 08 Feb 09 Jun 09 Oct 09 Feb 10 Jun 10 Oct 10
'000 Ct'000 Ct
Agriculture (LHS) Gold WTI Natural gas Livestocks Copper
Graph 2-4: CFTC net length by commodity group
Source: CFTC
-20
-10
0
10
20
30
40
50
60
-20
-10
0
10
20
30
40
50
60
Oct 07 Feb 08 Jun 08 Oct 08 Feb 09 Jun 09 Oct 09 Feb 10 Jun 10 Oct 10
%%
Agriculture Gold WTI Livestocks Copper Natural gas
Graph 2-5: CFTC net length as % of open interest
Source: CFTC

Monthly Oil Market Report_________________________________________________________________________________________________________________________________________
November 2010 14
The dollar investment flow into commodities is estimated to increase by 17.3% m-o-m in
October, with all subsectors recording ample gains.
Openinterest
Oct 10 Oct % OIV Oct % OIV Oct % OIV Oct % OIVCrude Oil 1425 23 2 170 12 -47 -3 146 10Natural Gas 793 160 20 -141 -18 -32 -4 -13 -2Agriculture 4387 942 21 841 19 188 4 1,970 45Precious Metals 772 -114 -15 266 34 39 5 191 25Copper 156 40 25 32 21 -8 -5 64 41Livestock 578 183 32 160 28 -14 -2 329 57Total 8,111 1,234 15 1,328 16 126 2 2,687 33
OpeninterestSep 10 Sep % OIV Sep % OIV Sep % OIV Sep % OIV
Crude Oil 1335 128 10 99 7 -58 -4 169 13Natural Gas 810 161 20 -135 -17 -45 -6 -19 -2Agriculture 4331 952 22 899 21 163 4 2014 46Precious Metals 745 -109 -15 263 35 32 4 186 25Copper 142 41 29 25 18 -8 -5 59 41Livestock 621 181 29 188 30 -29 -5 340 55Total 7,985 1,354 17 1,339 17 56 1 2,749 34
positionsNon-
commercials
Table 2-2: CFTC data on non-commercial positions, '000 contracts
Net lengthSwap
positions
positions positions positions commercials
Net lengthSwap Money Other Non-
Moneypositions
Other
0
40
80
120
160
200
240
280
320
0
40
80
120
160
200
240
280
320
Oct 09 Nov 09Dec 09 Jan 10 Feb 10 Mar 10 Apr 10 May 10Jun 10 Jul 10 Aug 10 Sep 10 Oct 10
$bn$bn
Precious metals Industrial metals Natural gas Brent crude WTI crude Livestocks Agricultural
Graph 2-6: Inflow of investment into commodities
Source: CFTC

_________________________________________________________________________________________________________________________________________Monthly Oil Market Report
November 2010 15
World Economy Table 3-1: Economic growth rates 2010-2011, % World OECD USA Japan Euro-
zone China India
2010 4.1 2.4 2.7 2.9 1.4 9.5 8.5 2011 3.6 2.0 2.4 1.3 1.1 8.6 7.7
Industrialised countries USA The US economy grew by 2.0% in 3Q10; growth momentum should be expected to continue in 2011 supported by quantitative easing but it remains to be seen that the underlying economy is able to improve
The US economy has entered the 2H10 with a lower growth momentum, compared to the 1H10, but it is managing to sustain a better-than-expected dynamic. The economy seems to still be supported by the fading fiscal stimulus measures, but with renewed monetary support the economy enjoys some more assistance to potentially grow itself out of the recession. However, it remains to be seen to what extent it is able to do so as the fiscal stimulus-effects are still helping the economy. The 2Q GDP release was supportive in this respect and slightly better-than-expected at a quarterly annualized growth rate of 2.0%. An encouraging signal was the high contribution of personal consumption expenditures, which represented 1.79 percentage points or almost 80% of the growth. The recent momentum reflected in the October ISM release was also encouraging. Activities in the manufacturing sector has again picked up. The ISM manufacturing improved to 56.9 from 54.4 and remained comfortably above the 50 level. The ISM services improved again to a level of 54.3 from 53.2 in September. This is an important increase as the sector is responsible for around 80% of US GDP and the index stood at only 51.5 in August and at 54.3 in July, when it matched the current encouraging level.
The labour market showed some tentative improvements with a higher-than-expected addition of 159,000 private jobs. Even more so, the previous two months were revised upward by a total of 110,000 jobs. The work week edged up from 34.2 hours to 34.3 hours, along with a moderate increase in wages of 0.5% m-o-m. On the other side, caution should prevail, considering that the employment-to-population ratio fell from 58.5% to 58.3%, a slight drop, but certainly an indication that the labour market is still facing considerable headwind, as the unemployment rate remained at the elevated level of 9.6% in October, unchanged from September. This level compares to a 6.6% average for the period from 1999 to 2010 and it remains to be seen whether the momentum of the underlying economy is feeding through a considerable improvement of the labour market as well. This would be the major element for a sustainable recovery in private consumption. The Federal Reserve remains conservative in its view of the job-market, when in its latest statement of the Federal Open Market Committee (FOMC), the rate setting body of the Fed, it was mentioned that employers remain reluctant to add to payrolls. The weekly initial jobless claims have improved marginally, but remain at levels between 430,000 to 480,000 and just recently moved back towards the upper-band of this range.
0
10
20
30
40
50
60
70
0
10
20
30
40
50
60
70
Aug
09
Oct
09
Dec
09
Feb
10
Ap
r 10
Jun
10
Aug
10
Oct
10
0
10
20
30
40
50
60
70
0
10
20
30
40
50
60
70
Aug
09
Oct
09
Dec
09
Feb
10
Ap
r 10
Jun
10
Aug
10
Oct
10
Source: Institute for Supply Management
Graph 3-1a: ISM manufacturing index Graph 3-1b: ISM non-manufacturing index

Monthly Oil Market Report___________________________________________________________________________________________________________________________________________
November 2010 16
The most recent announcement by the Fed to re-engage in quantitative easing measures – dubbed QE2 – should support the economy in the near future. This programme is being designed to add $600 bn to the monetary system until the middle of next year at a rate of $75 bn per month. The Fed will mainly continue to reinvest early repayments from its portfolio of mortgage-based securities. While this should have a stimulating effect, some surprise occurred that the Fed did not mention any potential prolongation of the programme, when it runs out at the end of 1H11. As this package was only designed because of the sluggish economy, one could argue, that despite it being supportive for the economy, one should not overlook the fact that according to the Fed, the main reason to implement it was the still elevated unemployment level as well as the underlying inflation that is at low levels compared to what the FOMC considers healthy. The major expected consequence of QE2 exercise should be lower interest rates, feeding into support for equity markets as well as commodities and probably also weakening of the US dollar, a development that had started already, when the expectation was rising that QE2 will be implemented. Still it remains to be seen whether all those effects will materialize and that particularly inflation will rise again, unemployment decline and the effect on consumption be positive. If this renewed stimulative effect by the Fed fails to succeed and the economy does not manage to grow itself out of this recession on sustainable levels, it will face some major challenges for 2011. The US housing market, while improving from recent lows, is still and again being challenged by declining sales and stagnant prices. Pending home sales have declined further by minus 1.8% in September after an increase of 4.4% in August. Existing home sales have improved to 4.5 mn in September, after having reached a record low of 3.84 mn in July. As pending home sales, being a lead-indicator for the existing home sales, are again pointing at a slowdown, the development in the coming months in existing home sales will probably be muted at best. House prices correspondingly have been almost stagnating in August with an increase of 0.4%, which comes after a decline in July of minus 0.7% and in June of minus 1.3%. Still, the economy seems to depend on monetary and fiscal support, but considering the better-than-anticipated current momentum of the US economy and the renewed monetary stimulus package, growth for both 2010 and 2011 has been revised upwards by 0.1 percentage points to 2.7% for 2010 and to 2.4% respectively.
Japan Exports weakening and only a minor expansion in domestic demand expected in Japan in the coming quarters
While the economic situation of Japan improved significantly in the 1H10 compared to 2009, with the beginning of 2H10, it has begun to deteriorate with growth in the domestic and the foreign trade markets both decelerating. Exports dropped again in September according to the Ministry of Finance. On a value base, exports declined by 0.1% m-o-m, for the fifth consecutive month. Correspondingly, imports fell by 0.5%, the fourth month of decline. On a yearly basis, exports rose by 14.4% in September, compared to 15.5% in the previous month. The slowdown in exports is accelerated by the increasing yen, a fact that continued to pressure exports as the yen reached new highs at the beginning of November. Volume-wise, the trend is not as negative as the value-based numbers indicate. The volume increased by 16.1%, compared to 14.2% a month earlier. An interesting observation can be made by looking into the categories of those exported goods that are leading growth. While electric equipment exports – which were the major driver in the 1H10 – are slowing down, it is now the more capex-related exports, such as machinery, that are picking up considerably and compensating for the shortfalls of the other areas. With respect to the global economy, this might be a further indication that the recovery continues and that optimism by manufacturers is leading to a higher demand in capex for improving manufacturing infrastructure. It remains to be seen whether this momentum is able to continue, as these capital expenditures depend on private household consumption, which is slightly improving on a global basis, but still seems to be mostly supported by the fading stimulus packages across the globe. The capex-related category managed to increase by 39.0% y-o-y. The global trend of a continuing recovery in the major OECD regions in 4Q is also being reflected in the regional distribution of growth, with Europe and the US showing slightly better indicators on a monthly basis than emerging Asia currently. Japanese exports to Asia grew by 14.6% y-o-y at the same level than a month

_________________________________________________________________________________________________________________________________________Monthly Oil Market Report
November 2010 17
earlier, while exports to Europe were growing by 29.2% y-o-y, compared to 26.7% in the previous month and exports to the US improved from 11.5% y-o-y in August to 17% y-o-y in September. The domestic side of the economy is reflecting some slowdown as well. Retail sales decreased sharply by 3.0% m-o-m on in September, which compares to an increase of 1.4% m-o-m a month earlier, an increase of 0.7% in July and 0.4% in June. On a yearly basis, this monthly decline is being reflected in a sharp drop from the August level of 4.3% y-o-y, while in September the increase was only by 1.2% y-o-y. To a certain extent this was expected, as many government stimulus measures to support the retail sector have expired recently. Particularly the expiring incentives to buy energy-efficient cars caused a plunge in car sales translating into this sharp decline. Car sales have to be closely watched as currently it seems likely that this might push 4Q retail sales growth into negative territory. Motor vehicle sales in September plunged by 17.2% m-o-m, after having risen by 10.1% m-o-m a month earlier. The declining momentum of the retail sector is being reflected by negative trend in household spending, of which retail is an important part. Household spending in September declined by 0.4% m-o-m. The combination of slowing exports and domestic consumption is reflected in a drop in industrial production of 1.9% m-o-m, marking a fourth consecutive month of decline. Accordingly, this slow-down is reflected in the most recent composite PMI number, issued by Markit, that remains below the 50-level and is now at 47.2 for October compared to 49.3 in September. The rather muted underlying momentum is again being reflected in September’s Consumer Price Index (CPI) numbers. General CPI declined by 0.6% y-o-y in September, which compares to minus 0.9% y-o-y in August. The main factor for this slight improvement on a monthly basis came from energy prices that were up by 3.7% y-o-y. Excluding fresh food and energy, prices were stagnant on a monthly basis, which again is a slight improvement from August, when prices fell by 0.1%, and the months before when price momentum was negative. This generally stagnant domestic development is being mirrored in the unemployment numbers, which decreased this month, however only by a small margin from 5.1% to 5.0%, but the labor market is improving slightly. The slightly better-than-expected momentum of the 3Q10 has been reflected in the forecast update. The growth forecast for 2010 now moved from 2.8% to 2.9%, while the 2011 forecast remains at a level of 1.3%.
Euro-zone Euro-zone economy supported by growth in Germany Despite the continuation of slow growth, worries about sovereign debt and the weakening labour market remain
The Euro-zone recovery lost some momentum, but is still considerably stronger than many would have expected in the 1H considering the many issues the Euro-zone economy has had to deal with. Most recent data supports the expected scenario of a slowdown from the 1H10, but also indicates that, while the growth dynamic seems to decelerate, the expansion continues at a lower level. Furthermore, the recent data underscores the fact that the two-tier economy continues, with primarily Germany and, to some extent, France adding most of the growth momentum, while other economies – mostly in the southern Europea – continue to weaken. Industrial orders have increased again in August, after having declined a month earlier, just at the start of the 3Q10, moving up by a significant 5.3% m-o-m, after a decline of 1.8% in July and a rise in June of 2.4%. A major contribution in this number is coming from Germany at 3.4% m-o-m as well as Greece and Italy, both posting an increase of more than 11%, recovering from weak July numbers. Industrial production was strong at 1.0% m-o-m in August. This is a sign of a supportive development as industrial production was falling by 0.1% in July and increased only by 0.1% in June. This positive trend in manufacturing was seen in Germany, where exports in September were again moving up, rising by 3.0% m-o-m compared to the decline of 0.2% the previous month. On a yearly basis, exports increased by 22.5%, above the year-to-date average of 19%. The fact that the Euro started to increase in September and that non-EU countries were the major driver for this export-led growth can be considered positive and be taken as a supportive factor for the uniqueness of the German manufacturing base that obviously has not been that much affected by the strengthening Euro. These indicators therefore

Monthly Oil Market Report___________________________________________________________________________________________________________________________________________
November 2010 18
are showing encouraging momentum that could lead to the conclusion that the manufacturing sector in general is still supportive to economic growth in the Euro-zone. The still existent dynamic of the manufacturing sector is mirrored in the most recent Markit PMI numbers. The manufacturing PMI for the Euro-zone has risen to 54.1 in October from 53.7 a month earlier. This dynamic is in contrast to the services sector which is still in decline and reached an 8-month low at 53.2 compared to the previous level in September of 54.1. Still, both numbers are relatively comfortably above the level of 50, indicating expansion in both sectors. Most of this positive momentum is coming from Germany and France. Germany’s composite index – comprising the manufacturing and the services sector – grew to 56.0 from 54.7. This corresponds to the latest business sentiment numbers from Germany compiled by the Ifo institute. The Ifo index grew to 107.7, a three-and-a-half-year high. This low-growth momentum cannot yet be seen in the unemployment numbers, which again increased and, after six months at 10.0%, now moved to 10.1%. So, while there is usually a many-month lag for the unemployment numbers to improve, the labour market has still not been able to reflect the positive development in the underlying economy. This is mainly due to the fact that Germany, with its relative strength compared to other Euro-zone countries, has managed to reduce the unemployment rate relatively successfully, primarily in the manufacturing sector. Meanwhile, other major economies in the Euro-zone, mainly Spain, have had a bigger negative compensatory effect. Germany managed to reduce its unemployment rate in September to 6.7% from 6.8% the previous month, while Spain’s unemployment rate again worsened by 0.2% to now 20.8%, more than three times the level of Germany. This is again the highest rate that has been published by the Statistical Office of the European Community since May 1994, when it reached 19.8%. Youth unemployment in Spain again reached a new record-high of 42.5%, up by 0.2% from a month earlier. In comparison, Germany’s youth unemployment rate now is at a level of 8.5% in September, down by 0.3% from the previous month and around one fifth of the Spanish level. This again underscores the two-speeded recovery in the Euro-zone that could cause some challenges in the coming year. While the labour market is still suffering, inflation is starting to move up on a yearly basis. It touched almost 2%, the level the ECB is considering as the upper-limit for healthy inflation, in October, when it reached 1.9%. This might trigger the ECB to lift key interest rates if this growth continues to move beyond this 2% level. A potential counterbalance to this could be the emerging worries about the debt situation of the weaker Euro-zone countries. Greek’s 10-year debt has reached the levels of May now in November, a sign that the market is considering the current situation as challenging. This, along with renewed fears over the Irish, the Portuguese and the Spanish debt could again be the source for some worries, while it should be highlighted that the mechanism – the European Stability Financial System (ESFS) – put in place last May by the European Union should avoid a re-emerging debt crisis in the Euro-zone. In line with this situation, the rating agency Moody’s, has recently underscored the unlikelihood of a default by a Euro-zone country. Due to this better-than-expected performance in the 2H10, the growth forecast for the Euro-zone was increased by 0.2% to 1.4% in 2010. While it remains to be seen that this momentum will be continued in 2011, the forecast was only increased by 0.1% to 1.1%.
Former Soviet Union Russia’s services and manufacturing sectors continue to expand, while inflation remains a major concern
Russia’s economy continues its expansion on the back of higher numbers for industrial growth and capital investment. Capital investment rose by 0.9% m-o-m in September, while industrial production increased by 1.5% m-o-m. Consequently the country’s economy was reported having expanded by 0.2 percentage points in September, according to the Ministry of Economic Development. The excessive drought continues to impact consumer prices, which increased by 0.5% m-o-m in October, i.e. 7.5% on a yearly base. Food inflation is expected to remain the main factor behind an increase in consumer prices. Food price rose by 0.7% m-o-m and

_________________________________________________________________________________________________________________________________________Monthly Oil Market Report
November 2010 19
were as much as 10.0% higher y-o-y, reflecting the lingering effect of the summer drought.
The purchasing managers index (PMI) for Russia’s services sector in October showed the strongest reading since May 2010 at 55.4, up from 52.2 in September and 48.8 in August. The driving force behind this increase was the expansion of new business, whose index rose strongly to 56.6 in October from 50.9 in September. Russia’s manufacturing sector similarly showed expansion in October, rising to 51.8, from a six-month low of 51.2 in September. The survey also reflected the resumption of hiring by manufacturers after the reduction of jobs in September, which should give support to the labor market in the near future and might probably translate into some dynamic as well in domestic consumption. Taking into consideration the above challenges while at the same time acknowledging the momentum in the economy, the GDP forecast for Russia remains unchanged at 4% for 2010 and at 3.8% for 2011.
Developing Countries China’s 3Q10 GDP grew by 9.6% y-o-y, a slowdown from the first half, proving government plans to avoid overheating have been successful
China’s administration so far has managed successfully the process of decelerating the economy from the very elevated levels registered in the 1Q10. GDP in the 3Q10 in China was recorded at a level of 9.6% y-o-y, down from 10.3% in Q210. This number and its breakdown by sectors, show robust consumption growth, while at the same time growth in investments is moderating. However, the rebalancing of the country’s growth has a long way to go, but this shift towards domestic consumption can be considered as the right direction in balancing the global growth pattern. Fixed asset investments have been slowing since the beginning of the year, reflecting a gradual process of withdrawal of fiscal and monetary stimulus. Domestic consumption continues expanding, with retail sales in September up 18.8% y-o-y or 0.4% on a monthly base. Exports expanded further. October’s external trade has increased by 22.9% y-o-y from 25.1% in September. However, seasonally-adjusted data show an expansion for both months, when it September, the increase was at 3.2% m-o-m and in October at 2.9% m-o-m. This is certainly a decelerating trend, but still a strong performance, particularly when considering that in August exports declined by 1.4% m-o-m. Geographically, the major contributions were from the Asian developing countries and Japan. Imports similarly showed a stronger-than-expected performance in October, when they increased by 5.6% on a monthly basis. This compares to 7.5% m-o-m in September. In the third quarter, China’s foreign exchange reserves surged by $194 bn — to a record $2.65 trillion. The rebound in China’s trade surplus and the fall in the US dollar, which drives up the value of China’s non-dollar assets in dollar terms, were both responsible for the rise. According to official data released in October, China’s electricity usage in September decreased by 12% m-o-m to 349.8 bn kilowatt-hours, after it had risen by 14.7% m-o-m in August. While this reflects to a considerable extent mandatory power cuts administered for the purpose of managing the country’s overloaded electricity generation assets and transmission lines, it can also be an indirect indicator of the overall moderation of the country’s rate of economic expansion. While the rate of growth of industrial production in September slowed a bit to 13.3% y-o-y, following a decrease from 13.9% y-o-y in August, the seasonally-adjusted HSBC China Manufacturing Purchasing Managers’ Index increased from 52.9 to 54.8 for the month of October, a considerable month-on-month rise. China’s consumer price index (CPI) remains a challenge for the economy, hitting 23-month high of 3.6% y-o-y and 0.6% m-o-m in September. Food prices remain the highest driver for inflation, growing by 8% y-o-y. The other two drivers continue to be the housing sector and healthcare. Evidently, the rising inflation was one of the key drivers behind the Central Bank’s most recent increase of interest rates. The People’s Bank of China (PBoC) announced on 19 October that it had decided to raise the benchmark deposit and lending rates by 25 basis points to 2.31% and 5.56% respectively, sending an important signal that a policy consensus has been reached to tolerate lower GDP growth rates for the country. The government seems convinced now that negative real interest rates ought to be corrected, as they tend to exacerbate inflationary expectations,

Monthly Oil Market Report___________________________________________________________________________________________________________________________________________
November 2010 20
property bubbles and over-investment. This move also means that policymakers have become more confident about the country’s real economy, especially over the strengthening momentum in domestic demand, and would like to reduce excessive exposure of the country’s banking sector to real estate assets. Data published by the PBoC shows that continued slide in mortgage lending noticeably decreased the expansion of China’s real estate loans during the first three quarters. The key reason for the slower lending was the deceleration in personal mortgage loans, which made up around 70% of total new real estate loans this year. On October 18, the Chinese Party’s Central Committee approved a new five-year plan, which will be considered and likely endorsed by the National People’s Congress in March 2011. The new five-year plan focuses on measures that would stress domestic demand and on the promotion of seven strategic industries as a way to strengthen the nation’s new economic pillars. These industries include: carbon capture and storage technologies; new-generation IT; biopharmaceuticals; advanced infrastructure solutions for land transportation, aviation and aerospace industries; green energy for electric power generation; advanced alloy and synthetic technologies, including nanotechnology; and electric vehicles. The new 5-year plan also includes an ambitious goal to cut the country’s energy intensity — usage of energy per unit of GDP — by 17.3%, and reduce the industry’s carbon intensity by about 20% by 2015. Taking into consideration that China has successfully managed to so far avoid overheating, while at the same time continuing to grow considerably, the growth forecast for 2010 remains unchanged at 9.5% and at 8.6% for 2011.
Rising inflation, remains the main concern in the still expansionary Indian economy
India’s economy also continued to face the risk of overheating and rising inflation. Therefore a moderation of the industrial output and a stricter monetary policy remain the key highlights for the economy. The headline inflation rate in India stood at 8.6% y-o-y in September against 8.5% in the previous month. Higher food prices, which increased at 16.4% y-o-y in October, continue to be the major driver for inflation in the rest of the economy. The cost of other key economic inputs rose as well. Fuel and power prices rose by 11.1% y-o-y, the eighth consecutive month of high growth. The cost of primary articles rose by 17.5% y-o-y, up from 15.8% in August. These price increases evidently feed into wages in some sectors of the economy, and drive up prices for manufactured goods, assets and property. On the other hand, better-than-expected crops stimulated by abundant rainfall during the monsoon season are a factor contributing to the expectations of a gradual decrease in food inflation. India’s Meteorological Department reported that the country received 911 millimeters rainfall between June 1 and September 29, which is more than the 50-year average of 889.2 millimeters. But while inflation is still high, it moderated since April 2010 when it stood at 11% y-o-y. One of the reasons for the decelerating inflation is the monetary tightening of the the Reserve Bank of India (RBI), which continued its policy , when it raised the benchmark repo and reverse repo rates on 2 November by 25 basis points to 6.25% and 5.25% accordingly. The rate of tightening, however, slowed down. While RBI has concerns about high inflation, it does not want to put too much pressure on India’s rate of economic expansion. The announcement of a new round of quantitative easing by the Federal Reserve in the United States strengthened the Indian Rupee against the USD and it remains to be seen if and how the RPI will position itself in this respect as it may potentially have some impact on the rate of export growth in India. October’s purchasing managers index for India showed that the growth of the country’s manufacturing sector gained pace. The PMI stood at 57.2 in October, versus September’s reading of 55.1. This momentum transfers into a rise in the GDP forecast for 2010 to 8.5% from 8.2% previously, while the forecast for 2011 remains at the same level of 7.7%.

_________________________________________________________________________________________________________________________________________Monthly Oil Market Report
November 2010 21
Brazil continues high-level expansion, but shows first signs of moderating growth
The high level expansion continues in Brazil, but is showing the first signs of moderating growth. The activity in the manufacturing sector in the country contracted slightly in October, after a slight improvement in the month before. HSBC’s seasonally-adjusted Purchasing Managers Index for manufacturing decreased to 49.5 in October from 50.4 in the previous month. The survey also showed that employment levels in the manufacturing sector slightly dropped during the month of October. This puts a dent in Brazil’s thirteen-month period of continuous job creation. In line with this declining trend energy use in the country increased 5.8% y-o-y in October. Brazil’ national electric operator ONS reported that the extra demand came primarily from industrial consumers. That was a decrease compared with the September data, when consumption of electric power rose 7.5% on the year. Exports rose faster than imports for the first time since January. The Trade Ministry announced that Brazil’s trade surplus rose to $1.85 billion in October from $1.09 billion in September. Exports were registered at $18.4 billion in October while imports swelled to $16.5 billion. Both numbers show a roughly 30% y-o-y increase. One factor responsible for boosting imports might be the stronger real. Foreign exchange flows into the country, led by the US dollar, remain high. Brazil’s central bank reported that while the inflows decreased somewhat in October y-o-y, they stayed largely above average monthly levels seen earlier in 2010. In order to suppress incoming speculative investment in fixed-income instruments, the government therefore again raised the country’s financial transactions tax to 6%, from 4% previously. Taking into consideration Brazil’s stronger than anticipated most recent growth, the forecast for 2010 was revised upward from the earlier estimate of 6.8% to 7.0%. Due to the deceleration that can be observed currently in the economy, the forecast for 2011 remains unchanged at 4%.
OPEC Member Countries While inflation in Saudi Arabia is slowing marginally, deflation in Qatar prevails
Saudi Arabia’s seasonally adjusted headline HSBC Saudi Arabia Purchasing Managers’ Index increased in October, making up for the decline from the previous month by jumping to the high mark of 59.9. This is a positive indicator that economic activity continues the growth momentum, largely due to state-powered economic stimulus measures. The private sector expansion has slightly lagged behind, chiefly because of tight credit conditions. Meanwhile, the Saudi Arabian General Investment Authority (SAGIA) has reported that it intends to spend as much as $500 billion by 2020 on investments in industrial projects, transportation and education. That should come in addition to $400 billion that the Saudi government has already earmarked for the country in the coming years. SAGIA’s investments will target the Kingdom’s less developed provinces in order to achieve a more balanced growth across the country. Saudi Arabia’s consumer price inflation slowed marginally to 5.8% y-o-y in October from 5.9% in September, although monthly inflation remained at 0.5% m-o-m for the third consecutive month, according to the Central Department of Statistics. Food prices, which accelerated by 8.3% y-o-y and 1.6% m-o-m remained the core driver. Housing and related categories also remained high, increasing by 8.9% y-o-y, although down marginally from 9.0% in September. The latest data shows that imported inflation remains relatively muted with prices in the clothing and footwear as well as the home furnishing categories declining. However, this development might change with a further weakening of US dollar. The Qatar Statistics Authority has reported that consumer price deflation in Qatar retracted to 0.9% in September y-o-y, down from the rate of 2.1% in the previous month. Higher prices for food and many imported goods are a key factor in this dynamic. Falling rents, caused by oversupply of housing, continue to be the biggest suppressant of upward movement of consumer prices.

Monthly Oil Market Report___________________________________________________________________________________________________________________________________________
November 2010 22
Oil prices, US dollar and inflation The US dollar continued to weaken versus all major currencies in October, losing 6.8% to the euro and reaching a new record low versus the yen
The OPEC Reference Basket Price rose by 7.0% in October
The US dollar continued to weaken relatively significantly in October. Against the euro, the dollar weakened 6.8% on a monthly basis. The movements against the other major currencies were not that much better. On the average monthly basis, the US dollar fell 3.4% versus the Swiss franc, declined 3.0% against the yen and 1.3% compared to the pound sterling. Versus the euro, the dollar stabilized around slightly below the $1.40/€ level since mid August and closed in October at a monthly average of $1.3895/€. As a second round of quantitative easing had been mooted by Fed officials over the past weeks, the US dollar started to weaken already in September. Since the official announcement at the beginning of November, which was in line with expectations, the US dollar has remained at the current level of slightly below $1.40/€. The euro managed to maintain a level above $1.40/€ for four consecutive days throughout the Fed meeting, but did not manage to sustain this level. The counterbalancing weight of the euro came from re-emerging sovereign debt worries as the yields of Greek government bonds again reached almost the depressed levels of May at the end of October and the beginning of November. It remains to be seen if the level of $1.40/€ can be consistently broken, which now, for the second time in the previous three months, the euro has failed to do. The yen also appreciated to historic highs and is approaching the psychologically important $80.0/¥ level, when it fell to $80.3/¥ at the beginning of November after the announcement by the Fed of the quantitative easing measures. It remains to be seen whether the yen will hold this level, but it can be expected that the Bank of Japan (BoJ) will try to intervene to avoid a further negative impact on the economy. In October, the OPEC Reference Basket price increased by $5.23/b or 7.0% to $79.86/b from $74.63/b in September. In real terms (base June 2001=100), after accounting for inflation and currency fluctuations, the Basket price increased by $1.56/b or 3.3% to $49.50/b from $47.94/b. The dollar fell by 3.4%, as measured against the import-weighted modified Geneva I+US dollar basket*, while inflation increased slightly by 0.1%.
* The ‘modified Geneva I+US$ basket’ includes the euro, the Japanese yen, the US dollar, the pound sterling and the Swiss franc, weighted
according to the merchandise imports of OPEC Member Countries from the countries in the basket.

_________________________________________________________________________________________________________________________________________Monthly Oil Market Report
November 2010 23
World Oil Demand World oil demand in 2010 World oil demand growth for 2010 revised up by 0.19 mb/d to stand at 1.3 mb/d or 1.6%
Despite initial economic assessments that underestimated the second half of the year’s economic activities, oil demand is picking up in the third and fourth quarters. OECD oil demand beat expectations, resulting from better economic activities that have been boosted by various stimulus plans. The upward risk mentioned in our earlier assessment materialized in the third quarter. North America, Europe, and the Pacific region have shown strength in oil consumption. This has resulted not only from the summer driving season, but also from recovered industrial production activities. As a result, an additional 0.2 mb/d were added to the demand forecast of the OECD. A somewhat steady increase in OECD oil demand in the third quarter poses a signal of recovery for the economy. Another factor that will likely affect world oil demand is the weather in the fourth quarter. A swing in retail petroleum product prices could also affect consumption in the near future to some degree. Although there is a stronger-than-expected recovery in OECD oil demand that has led to an upward revision in the second half, the non-OECD region came in as expected. Still, there is a risk in US oil usage, which depends upon to what degree the economy will march ahead and how cold the winter will be. Given the positive government intervention during the year, the world oil demand growth forecast was revised up by 0.19 mb/d to settle at 1.3 mb/d or 1.6%.
2009 1Q10 2Q10 3Q10 4Q10 2010 Volume %North America 23.30 23.45 23.66 23.82 23.69 23.66 0.36 1.53Western Europe 14.52 14.17 14.13 14.56 14.37 14.31 -0.21 -1.44OECD Pacific 7.66 8.19 7.30 7.41 8.00 7.72 0.07 0.90Total OECD 45.47 45.81 45.10 45.79 46.06 45.69 0.22 0.48
Other Asia 9.83 9.95 10.13 9.88 10.11 10.02 0.19 1.92Latin America 5.88 5.78 6.04 6.22 6.17 6.06 0.18 3.02Middle East 7.09 7.18 7.16 7.48 7.24 7.26 0.18 2.51Africa 3.25 3.30 3.28 3.17 3.32 3.27 0.02 0.64Total DCs 26.04 26.21 26.60 26.75 26.84 26.60 0.56 2.17
FSU 3.97 3.96 3.78 4.18 4.22 4.04 0.06 1.55Other Europe 0.73 0.69 0.64 0.66 0.70 0.67 -0.05 -7.48China 8.25 8.23 8.94 9.18 8.76 8.78 0.53 6.38Total "Other regions" 12.95 12.88 13.37 14.02 13.67 13.49 0.53 4.12
Total world 84.46 84.90 85.06 86.56 86.58 85.78 1.32 1.56Previous estimate 84.46 85.02 84.91 85.87 86.55 85.59 1.13 1.34Revision 0.00 -0.12 0.15 0.68 0.03 0.19 0.19 0.22
Table 4-1: World oil demand forecast for 2010, mb/d
Change 2010/09
Totals may not add due to independent rounding
-2000200400600800100012001400
-2000
200400600800
100012001400
LPG
Nap
htha
Gas
olin
e
Jet/K
ero
Gas
/Die
sel o
il
Res
idua
l fue
ls
Oth
er p
rodu
cts
Tot
al p
rodu
cts
tb/dtb/d
Graph 4-1: Forecasted y-o-y growth in 2010 world oil demand
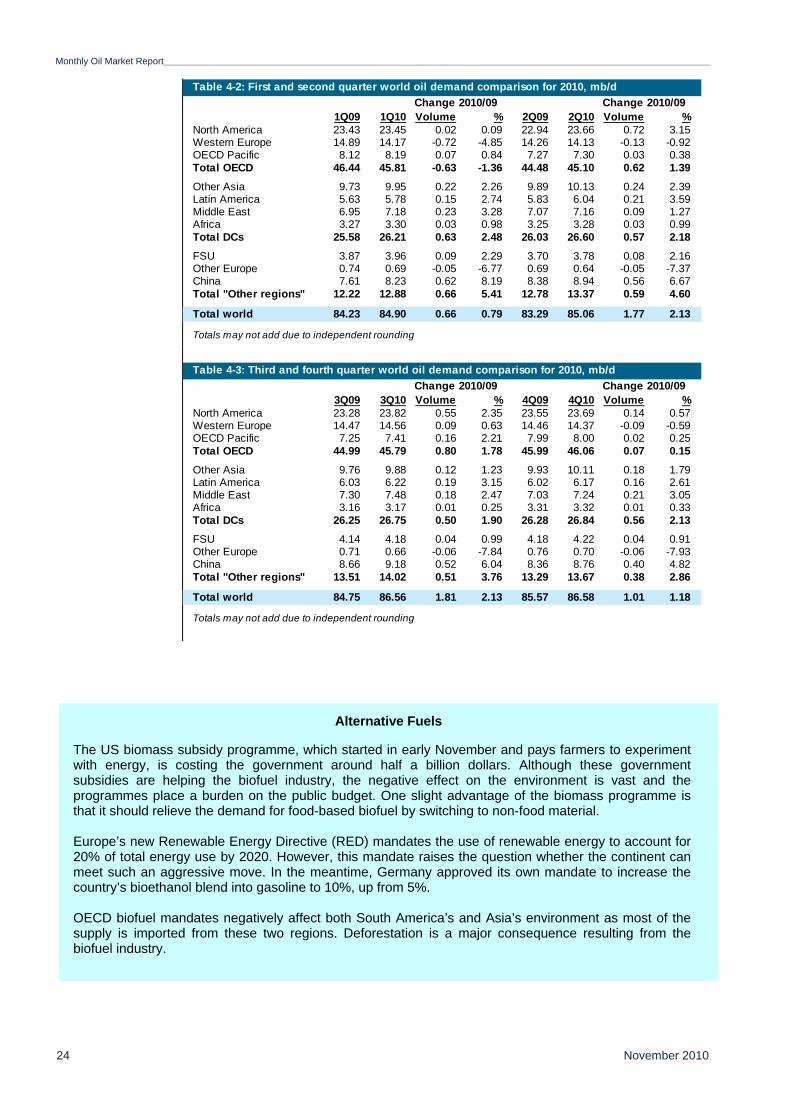
Monthly Oil Market Report_________________________________________________________________________________________________________________________________________
November 2010 24
Alternative Fuels
The US biomass subsidy programme, which started in early November and pays farmers to experiment with energy, is costing the government around half a billion dollars. Although these government subsidies are helping the biofuel industry, the negative effect on the environment is vast and the programmes place a burden on the public budget. One slight advantage of the biomass programme is that it should relieve the demand for food-based biofuel by switching to non-food material. Europe’s new Renewable Energy Directive (RED) mandates the use of renewable energy to account for 20% of total energy use by 2020. However, this mandate raises the question whether the continent can meet such an aggressive move. In the meantime, Germany approved its own mandate to increase the country’s bioethanol blend into gasoline to 10%, up from 5%. OECD biofuel mandates negatively affect both South America’s and Asia’s environment as most of the supply is imported from these two regions. Deforestation is a major consequence resulting from the biofuel industry.
1Q09 1Q10 Volume % 2Q09 2Q10 Volume %North America 23.43 23.45 0.02 0.09 22.94 23.66 0.72 3.15Western Europe 14.89 14.17 -0.72 -4.85 14.26 14.13 -0.13 -0.92OECD Pacific 8.12 8.19 0.07 0.84 7.27 7.30 0.03 0.38Total OECD 46.44 45.81 -0.63 -1.36 44.48 45.10 0.62 1.39
Other Asia 9.73 9.95 0.22 2.26 9.89 10.13 0.24 2.39Latin America 5.63 5.78 0.15 2.74 5.83 6.04 0.21 3.59Middle East 6.95 7.18 0.23 3.28 7.07 7.16 0.09 1.27Africa 3.27 3.30 0.03 0.98 3.25 3.28 0.03 0.99Total DCs 25.58 26.21 0.63 2.48 26.03 26.60 0.57 2.18
FSU 3.87 3.96 0.09 2.29 3.70 3.78 0.08 2.16Other Europe 0.74 0.69 -0.05 -6.77 0.69 0.64 -0.05 -7.37China 7.61 8.23 0.62 8.19 8.38 8.94 0.56 6.67Total "Other regions" 12.22 12.88 0.66 5.41 12.78 13.37 0.59 4.60
Total world 84.23 84.90 0.66 0.79 83.29 85.06 1.77 2.13
Totals may not add due to independent rounding
Table 4-2: First and second quarter world oil demand comparison for 2010, mb/d
Change 2010/09 Change 2010/09
3Q09 3Q10 Volume % 4Q09 4Q10 Volume %North America 23.28 23.82 0.55 2.35 23.55 23.69 0.14 0.57Western Europe 14.47 14.56 0.09 0.63 14.46 14.37 -0.09 -0.59OECD Pacific 7.25 7.41 0.16 2.21 7.99 8.00 0.02 0.25Total OECD 44.99 45.79 0.80 1.78 45.99 46.06 0.07 0.15
Other Asia 9.76 9.88 0.12 1.23 9.93 10.11 0.18 1.79Latin America 6.03 6.22 0.19 3.15 6.02 6.17 0.16 2.61Middle East 7.30 7.48 0.18 2.47 7.03 7.24 0.21 3.05Africa 3.16 3.17 0.01 0.25 3.31 3.32 0.01 0.33Total DCs 26.25 26.75 0.50 1.90 26.28 26.84 0.56 2.13
FSU 4.14 4.18 0.04 0.99 4.18 4.22 0.04 0.91Other Europe 0.71 0.66 -0.06 -7.84 0.76 0.70 -0.06 -7.93China 8.66 9.18 0.52 6.04 8.36 8.76 0.40 4.82Total "Other regions" 13.51 14.02 0.51 3.76 13.29 13.67 0.38 2.86
Total world 84.75 86.56 1.81 2.13 85.57 86.58 1.01 1.18
Totals may not add due to independent rounding
Table 4-3: Third and fourth quarter world oil demand comparison for 2010, mb/d
Change 2010/09 Change 2010/09

_________________________________________________________________________________________________________________________________________Monthly Oil Market Report
November 2010 25
OECD - North AmericaGrowth in North America expected to exceed 350 tb/d in 2010
US industrial activity put pressure on industrial fuel consumption in the third quarter. An additional 7.7% of distillate fuel was consumed in the third quarter followed by an increase in gasoline demand by 1.2% resulting from seasonal summer driving. This strong growth is partly attributed to an improved economy but also to the low base line of last year. The US has announced another new stimulus plan which will positively affect the country’s oil usage in the next six months. October weekly data indicated a slowdown in the usage of energy with contractions in some industrial fuel products such as residual fuel oil and propane/propylene; however, October has a low seasonality for energy usage. Nevertheless, October oil consumption achieved minor y-o-y growth. Hence, fourth quarter oil demand is anticipated to achieve fewer y-o-y changes than the third quarter. As in previous reports, the preliminary character of this data requires caution as to whether these indications will also remain after monthly data becomes available. Economic impulses during the year have pushed the country’s oil demand to the plus side by less than 2% and this expectation will last until the year end. Year-to-date, 2010 displayed an increasing trend for US oil consumption, following a disappointing first quarter y-o-y contraction, mainly due to declining gasoline and weak distillate demand. However, demand rebounded later, resulting mainly from a better economy and a low baseline. New government stimulus plans will further call for more oil demand in the near future. Based on almost 10 months of data from 2010, and coming from a low baseline, US oil consumption shows growth of 2% or 0.3 mb/d compared to the same period last year. Unusual signs for the period to date in 2010 are the extremely low gasoline growth of 0.3%, the relatively weak distillate expansion, shrinkage in propane/propylene usage and flat residual fuel oil use. It remains to be seen whether the effects of the newly adopted stimulus plan will stimulate the economy. New US vehicle sales in October increased sharply, while growth in industrial production is flat or declining since May of this year. New truck sales in the US increased by 23% as a sign of a recovering economy. Auto sales in October were the highest since August of last year. The US auto market experienced a devastating setback in the past two years as the financial crises hammered the country’s economy. Nevertheless, a recovery began with the help of various government stimulus plans. This new strength in the auto industry will positively affect gasoline consumption in the fourth quarter. Mexican September figures were disappointing, and declines were highest for residual fuel oil used in power plants. The country’s September oil demand declined by 90 tb/d y-o-y to average 2.0 mb/d. Due to a slow economy, Mexico’s oil demand has been on the decline since July and is expected to achieve slight growth of less than 1% for the year. In Canada, oil demand has been on a strong growth trend since February; however this trend was interrupted in August with a sharp decline in jet/kerosene, which led to minor overall growth. The country’s total oil demand growth in August managed to rise by only 19 tb/d. Given the slowdown in the US economy, North American oil demand is expected to grow by only 0.1 mb/d in the fourth quarter. Nevertheless, total yearly growth in North America is expected to exceed 350 tb/d y-o-y in 2010.
OECD – Europe Contraction in OECD Europe oil demand revised upward 0.1 mb/d to now show an annual decline of 0.2 mb/d
September European oil demand indicated the third consecutive growth in oil consumption for the first time in almost 2 years. Nevertheless, debts in several European economies and continued application of rigorous state tax policies on oil are some of the factors which are imposing additional decline on European oil consumption. The European Big Four oil demand increased in September by 0.1 mb/d, compared to 0.4 mb/d a month earlier. Stronger distillate demand in Germany and France as a result of increased industrial production was the main reason for the recovery, while transportation fuels are still on the decline. During

Monthly Oil Market Report_________________________________________________________________________________________________________________________________________
November 2010 26
September, French oil consumption was up by 2%, while Italian oil consumption was down by 1%. For France, October is expected to be weak as a result of the massive strikes in the country, which lasted for most of the month. The massive rebound in the continent’s oil demand came mainly as a result of the strong recovery in Germany’s energy consumption.
OECD Europe total contraction in oil demand is expected to be less than previously forecast; hence, an upward revision of 0.1 mb/d was added to show an annual decline of 0.2 mb/d in 2010.
OECD – Pacific OECD Pacific oil demand to show minor growth of 70 tb/d in 2010
Japanese oil demand has been on the decline for the past few years and is expected to keep the same trend despite this year’s positive growth. Hence, the country has been dismantling excess refining capacity and is embarking on cutting another 1.3 mb/d of refining capacity in the next three years. In Japan, the year 2010 seems to be developing into a recovery year showing a year-to-date increase of approximately 2.5% in oil consumption. Should this growth continue for the whole year, then it would be the first observed growth since 2005. The petrochemical industry and thus naphtha, transportation fuels, direct crude burning and residual fuel oil are contributing to this noticeable growth with the help of a low baseline. Despite this positive performance, further development of Japanese oil consumption is heavily dependent upon the implementation of an additional economic stimulus plan, which is expected to take place in the remaining months of 2010. South Korea, the second largest oil consumer in the OECD Pacific region, observed increases in the demand for all products, especially in gasoline, distillate and naphtha. South Korea’s oil demand has been fluctuating since the beginning of the year; however it stabilized to a certain degree in the beginning of the second quarter as the country’s economy has been pulling out of a prolonged stagnant period. OECD Pacific oil demand is forecast to show minor growth of 70 tb/d in 2010, averaging 7.7 mb/d following a devastating decline last year.
-30%
-20%
-10%
0%
10%
20%
30%
40%
-30%
-20%
-10%
0%
10%
20%
30%
40%
Jan
09
Feb
09
Mar
09
Apr
09
May
09
Jun
09
Jul 0
9
Aug
09
Sep
09
Oct
09
Nov
09
Dec
09
Jan
10
Feb
10
Mar
10
Apr
10
May
10
Jun
10
Jul 1
0
Aug
10
Sep
10
Motor fuel consumption New passenger car registrations
Graph 4-2: European new passenger car registrations & motor fuel consumption, y-o-y % changes
Sep 10 Sep 09 Change from Sep 09 Change from Sep 09, %LPG 368 369 0 -0.1Gasoline 1,287 1,345 -58 -4.3Jet/Kerosene 777 799 -22 -2.8Gas/Diesel oil 3,810 3,345 465 13.9Fuel oil 495 520 -25 -4.9Other products 950 1,208 -258 -21.4Total 7,686 7,585 101 1.3
* Germany, France, Italy and the UK
Table 4-4: Europe Big 4* oil demand, tb/d
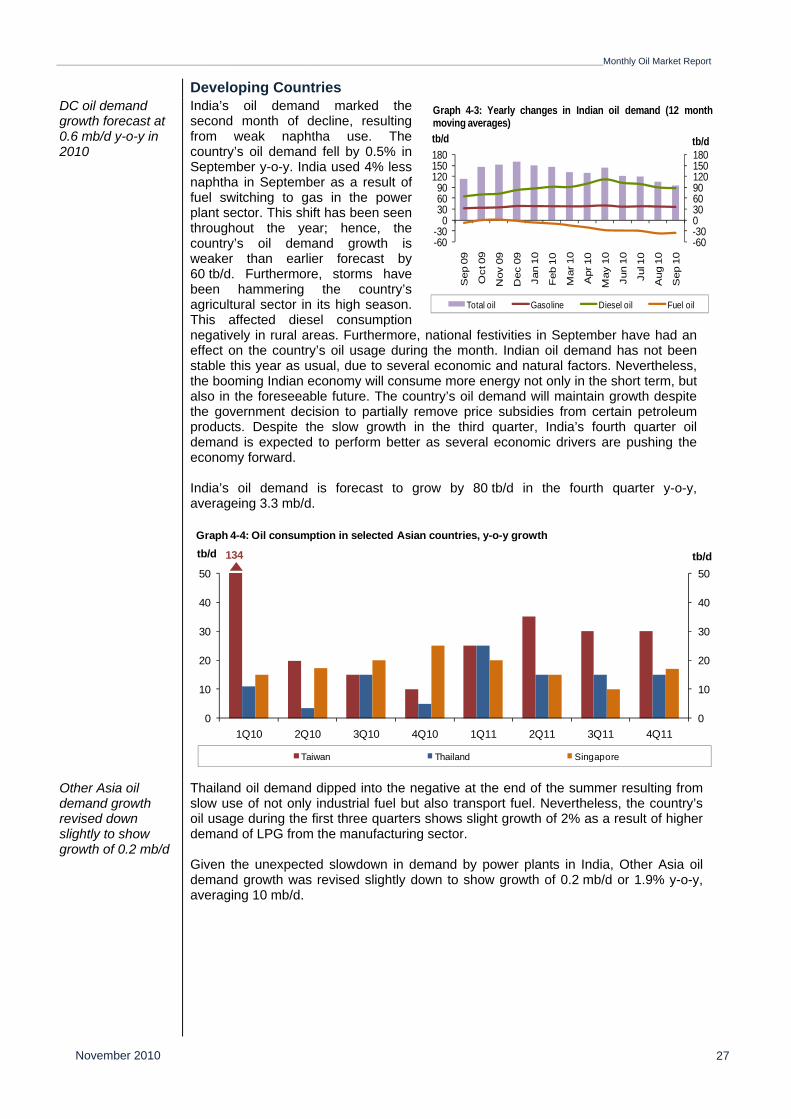
_________________________________________________________________________________________________________________________________________Monthly Oil Market Report
November 2010 27
Developing Countries DC oil demand growth forecast at 0.6 mb/d y-o-y in 2010
India’s oil demand marked the second month of decline, resulting from weak naphtha use. The country’s oil demand fell by 0.5% in September y-o-y. India used 4% less naphtha in September as a result of fuel switching to gas in the power plant sector. This shift has been seen throughout the year; hence, the country’s oil demand growth is weaker than earlier forecast by 60 tb/d. Furthermore, storms have been hammering the country’s agricultural sector in its high season. This affected diesel consumption negatively in rural areas. Furthermore, national festivities in September have had an effect on the country’s oil usage during the month. Indian oil demand has not been stable this year as usual, due to several economic and natural factors. Nevertheless, the booming Indian economy will consume more energy not only in the short term, but also in the foreseeable future. The country’s oil demand will maintain growth despite the government decision to partially remove price subsidies from certain petroleum products. Despite the slow growth in the third quarter, India’s fourth quarter oil demand is expected to perform better as several economic drivers are pushing the economy forward. India’s oil demand is forecast to grow by 80 tb/d in the fourth quarter y-o-y, averageing 3.3 mb/d.
Other Asia oil demand growth revised down slightly to show growth of 0.2 mb/d
Thailand oil demand dipped into the negative at the end of the summer resulting from slow use of not only industrial fuel but also transport fuel. Nevertheless, the country’s oil usage during the first three quarters shows slight growth of 2% as a result of higher demand of LPG from the manufacturing sector. Given the unexpected slowdown in demand by power plants in India, Other Asia oil demand growth was revised slightly down to show growth of 0.2 mb/d or 1.9% y-o-y, averaging 10 mb/d.
0
10
20
30
40
50
0
10
20
30
40
50
1Q10 2Q10 3Q10 4Q10 1Q11 2Q11 3Q11 4Q11
tb/dtb/d
Graph 4-4: Oil consumption in selected Asian countries, y-o-y growth
Taiwan Thailand Singapore
134
-60-300306090120150180
-60-30
0306090
120150180
Sep 0
9
Oct 0
9
Nov 0
9
Dec 0
9
Jan 1
0
Feb 1
0
Mar 10
Apr 10
May 1
0
Jun 1
0
Jul 1
0
Aug 1
0
Sep 1
0
tb/dtb/d
Total oil Gasoline Diesel oil Fuel oil
Graph 4-3: Yearly changes in Indian oil demand (12 monthmoving averages)
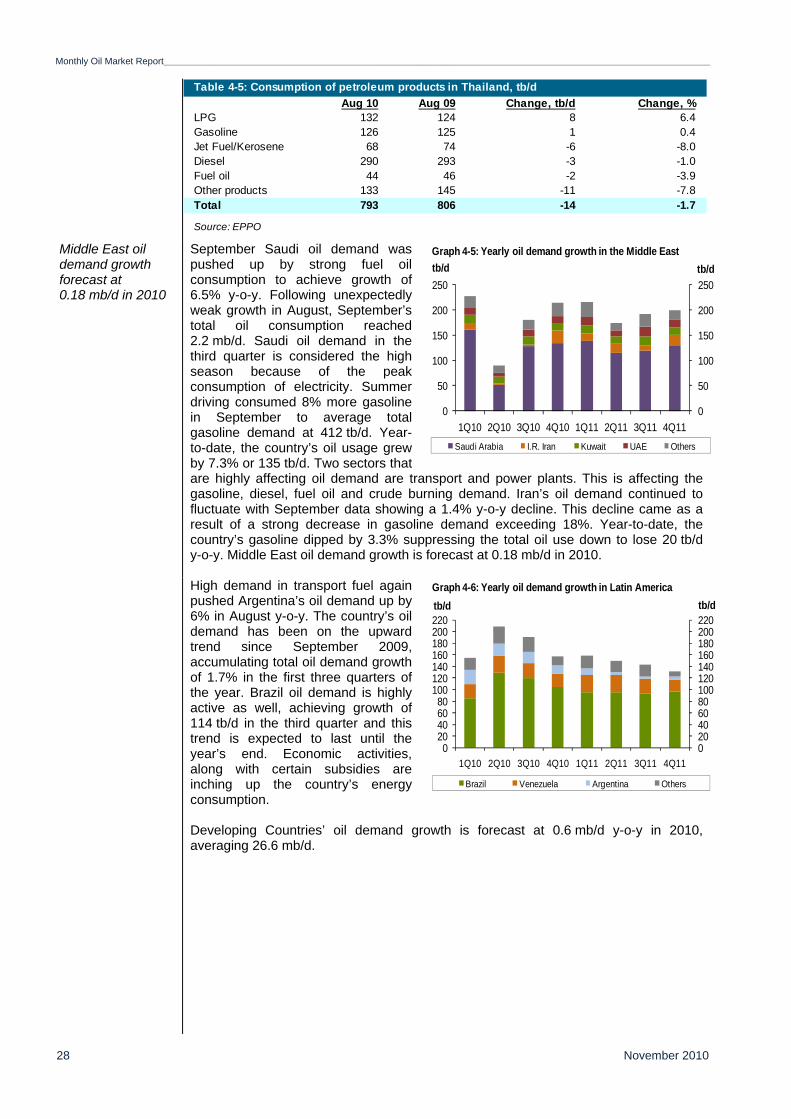
Monthly Oil Market Report_________________________________________________________________________________________________________________________________________
November 2010 28
Middle East oil demand growth forecast at 0.18 mb/d in 2010
September Saudi oil demand was pushed up by strong fuel oil consumption to achieve growth of 6.5% y-o-y. Following unexpectedly weak growth in August, September’s total oil consumption reached 2.2 mb/d. Saudi oil demand in the third quarter is considered the high season because of the peak consumption of electricity. Summer driving consumed 8% more gasoline in September to average total gasoline demand at 412 tb/d. Year-to-date, the country’s oil usage grew by 7.3% or 135 tb/d. Two sectors that are highly affecting oil demand are transport and power plants. This is affecting the gasoline, diesel, fuel oil and crude burning demand. Iran’s oil demand continued to fluctuate with September data showing a 1.4% y-o-y decline. This decline came as a result of a strong decrease in gasoline demand exceeding 18%. Year-to-date, the country’s gasoline dipped by 3.3% suppressing the total oil use down to lose 20 tb/d y-o-y. Middle East oil demand growth is forecast at 0.18 mb/d in 2010.
High demand in transport fuel again pushed Argentina’s oil demand up by 6% in August y-o-y. The country’s oil demand has been on the upward trend since September 2009, accumulating total oil demand growth of 1.7% in the first three quarters of the year. Brazil oil demand is highly active as well, achieving growth of 114 tb/d in the third quarter and this trend is expected to last until the year’s end. Economic activities, along with certain subsidies are inching up the country’s energy consumption. Developing Countries’ oil demand growth is forecast at 0.6 mb/d y-o-y in 2010, averaging 26.6 mb/d.
Table 4-5: Consumption of petroleum products in Thailand, tb/d
Aug 10 Aug 09 Change, tb/d Change, %LPG 132 124 8 6.4Gasoline 126 125 1 0.4Jet Fuel/Kerosene 68 74 -6 -8.0Diesel 290 293 -3 -1.0Fuel oil 44 46 -2 -3.9Other products 133 145 -11 -7.8Total 793 806 -14 -1.7
Source: EPPO
0
50
100
150
200
250
0
50
100
150
200
250
1Q10 2Q10 3Q10 4Q10 1Q11 2Q11 3Q11 4Q11
tb/dtb/d
Saudi Arabia I.R. Iran Kuwait UAE Others
Graph 4-5: Yearly oil demand growth in the Middle East
020406080100120140160180200220
020406080
100120140160180200220
1Q10 2Q10 3Q10 4Q10 1Q11 2Q11 3Q11 4Q11
tb/dtb/d
Brazil Venezuela Argentina Others
Graph 4-6: Yearly oil demand growth in Latin America
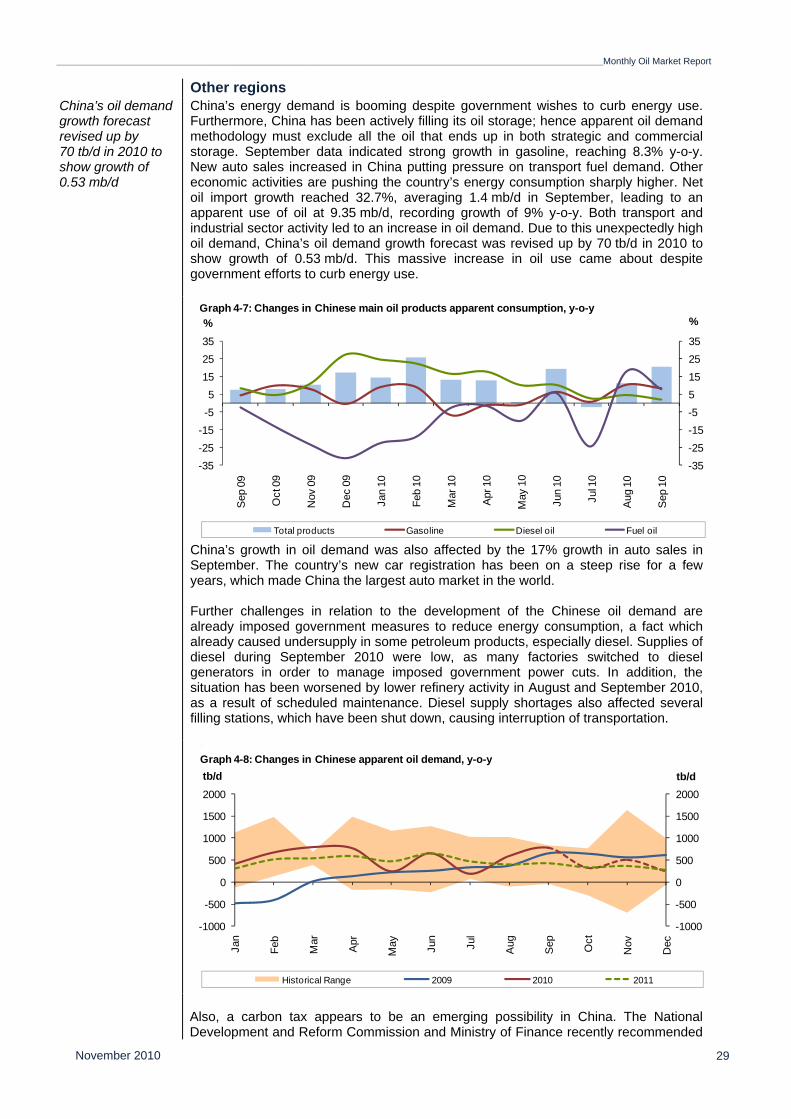
_________________________________________________________________________________________________________________________________________Monthly Oil Market Report
November 2010 29
Other regions China’s oil demand growth forecast revised up by 70 tb/d in 2010 to show growth of 0.53 mb/d
China’s energy demand is booming despite government wishes to curb energy use. Furthermore, China has been actively filling its oil storage; hence apparent oil demand methodology must exclude all the oil that ends up in both strategic and commercial storage. September data indicated strong growth in gasoline, reaching 8.3% y-o-y. New auto sales increased in China putting pressure on transport fuel demand. Other economic activities are pushing the country’s energy consumption sharply higher. Net oil import growth reached 32.7%, averaging 1.4 mb/d in September, leading to an apparent use of oil at 9.35 mb/d, recording growth of 9% y-o-y. Both transport and industrial sector activity led to an increase in oil demand. Due to this unexpectedly high oil demand, China’s oil demand growth forecast was revised up by 70 tb/d in 2010 to show growth of 0.53 mb/d. This massive increase in oil use came about despite government efforts to curb energy use.
China’s growth in oil demand was also affected by the 17% growth in auto sales in September. The country’s new car registration has been on a steep rise for a few years, which made China the largest auto market in the world. Further challenges in relation to the development of the Chinese oil demand are already imposed government measures to reduce energy consumption, a fact which already caused undersupply in some petroleum products, especially diesel. Supplies of diesel during September 2010 were low, as many factories switched to diesel generators in order to manage imposed government power cuts. In addition, the situation has been worsened by lower refinery activity in August and September 2010, as a result of scheduled maintenance. Diesel supply shortages also affected several filling stations, which have been shut down, causing interruption of transportation.
Also, a carbon tax appears to be an emerging possibility in China. The National Development and Reform Commission and Ministry of Finance recently recommended
-35
-25
-15
-5
5
15
25
35
-35
-25
-15
-5
5
15
25
35
Sep
09
Oct
09
Nov
09
Dec
09
Jan
10
Feb
10
Mar
10
Apr
10
May
10
Jun
10
Jul 1
0
Aug
10
Sep
10
%%
Total products Gasoline Diesel oil Fuel oil
Graph 4-7: Changes in Chinese main oil products apparent consumption, y-o-y
-1000
-500
0
500
1000
1500
2000
-1000
-500
0
500
1000
1500
2000
Jan
Feb
Mar
Apr
May Jun
Jul
Aug
Sep Oct
Nov
Dec
tb/dtb/d
Historical Range 2009 2010 2011
GGraph 4-8: Changes in Chinese apparent oil demand, y-o-y

Monthly Oil Market Report_________________________________________________________________________________________________________________________________________
November 2010 30
an initial low tax rate, with the main task to create a regulatory and taxation structure in the energy sector.
FSU oil demand forecast to show positive growth totaling 60 tb/d or 1.6% y-o-y.
Russian oil demand is back on track with a strong growth trend. The country’s oil demand during the first half of the year grew by 160 tb/d or 7.6% y-o-y resulting from high consumption of transport fuel, mainly gasoline. Given strong Russian oil demand, FSU oil consumption is forecast to show positive growth in 2010 totaling 60 tb/d or 1.6% y-o-y.
World oil demand in 2011 World oil demand growth forecast for 2011 at 1.2 mb/d, an upward revision of 0.12 mb/d
Optimism about the outlook for world economic activity next year is growing to some degree. However, the expected economic recovery is moving in slow motion and experiencing surprising turbulence. The forecast for world oil demand in 2011 is affected mainly by GDP estimates. Furthermore, oil demand growth will be less than the current year due to the higher baseline. Energy efficiency policies along with the use of biofuel will be affecting the use of oil worldwide. An enhanced picture of the OECD economic outlook is resulting in an upward revision for the region’s oil demand by 0.1 mb/d. Hence, world oil demand growth is now forecast at 1.2 mb/d to average 86.9 mb/d. Petrochemical and transport sectors are dominant in world oil demand growth in 2011.
The newly approved extra blend of biofuel in the US will slightly squeeze gasoline consumption once commissioned in the first quarter in 2011. The US has approved the E15 blend in gasoline for certain car models. This 15% ethanol blend was lobbied against by the auto industry for a while, as engines had never been tested to handle such a blend. The non-OECD region is expected to keep the previous year’s oil demand growth pattern led by Chinese oil demand growth of 5.1%. The region is expected to consume 1.0 mb/d more oil than this year. Other Asia and the Middle East will contribute 0.2 mb/d each, while Latin America1.5 mb/d to total world oil demand growth.
2010 1Q11 2Q11 3Q11 4Q11 2011 Volume %North America 23.66 23.75 23.83 24.00 23.99 23.89 0.24 0.99Western Europe 14.31 14.19 14.08 14.45 14.29 14.25 -0.06 -0.39OECD Pacific 7.72 8.15 7.26 7.39 7.98 7.69 -0.03 -0.41Total OECD 45.69 46.09 45.17 45.83 46.26 45.84 0.15 0.32
Other Asia 10.02 10.13 10.33 10.07 10.30 10.21 0.19 1.91Latin America 6.06 5.94 6.19 6.37 6.31 6.20 0.15 2.41Middle East 7.26 7.40 7.33 7.67 7.44 7.46 0.20 2.69Africa 3.27 3.32 3.30 3.20 3.34 3.29 0.02 0.73Total DCs 26.60 26.79 27.14 27.30 27.39 27.16 0.56 2.09
FSU 4.04 4.03 3.81 4.21 4.26 4.08 0.04 1.06Other Europe 0.67 0.67 0.61 0.63 0.66 0.64 -0.03 -4.26China 8.78 8.65 9.39 9.67 9.20 9.23 0.45 5.14Total "Other regions" 13.49 13.36 13.81 14.51 14.12 13.95 0.47 3.45
Total world 85.78 86.24 86.12 87.64 87.77 86.95 1.17 1.36Previous estimate 85.59 86.20 85.83 86.87 87.64 86.64 1.05 1.22Revision 0.19 0.04 0.29 0.77 0.13 0.31 0.12 0.14
Table 4-6: World oil demand forecast for 2011, mb/d
Change 2011/10
Totals may not add due to independent rounding
10%
10%
19%
5%26%
-11%
19%
LPG
Naphtha
Gasoline
Jet/Kero
Gas/Diesel oil
Residual fuels
Other products
Graph 4-9: Forecasted y-o-y growth in 2011 world oil demand,

_________________________________________________________________________________________________________________________________________Monthly Oil Market Report
November 2010 31
-3200-2800-2400-2000-1600-1200-800-40004008001200160020002400
-3200-2800-2400-2000-1600-1200-800-400
0400800
1200160020002400
1Q09 2Q09 3Q09 4Q09 1Q10 2Q10 3Q10 4Q10 1Q11 2Q11 3Q11 4Q11
tb/dtb/d
Non-OECD OECD Total World
Graph 4-10: Quarterly world oil demand growth
1Q10 1Q11 Volume % 2Q10 2Q11 Volume %North America 23.45 23.75 0.30 1.28 23.66 23.83 0.17 0.71Western Europe 14.17 14.19 0.02 0.16 14.13 14.08 -0.05 -0.38OECD Pacific 8.19 8.15 -0.04 -0.52 7.30 7.26 -0.04 -0.57Total OECD 45.81 46.09 0.28 0.61 45.10 45.17 0.07 0.16
Other Asia 9.95 10.13 0.19 1.90 10.13 10.33 0.20 1.94Latin America 5.78 5.94 0.16 2.75 6.04 6.19 0.15 2.48Middle East 7.18 7.40 0.22 2.99 7.16 7.33 0.17 2.43Africa 3.30 3.32 0.02 0.61 3.28 3.30 0.02 0.73Total DCs 26.21 26.79 0.58 2.22 26.60 27.14 0.54 2.05
FSU 3.96 4.03 0.08 1.90 3.78 3.81 0.03 0.79Other Europe 0.69 0.67 -0.02 -2.18 0.64 0.61 -0.04 -5.46China 8.23 8.65 0.42 5.09 8.94 9.39 0.45 5.04Total "Other regions" 12.88 13.36 0.48 3.72 13.37 13.81 0.45 3.34
Total world 84.90 86.24 1.34 1.58 85.06 86.12 1.06 1.25
Table 4-7: First and second quarter world oil demand comparison for 2011, mb/d
Change 2011/10 Change 2011/10
Totals may not add due to independent rounding
3Q10 3Q11 Volume % 4Q10 4Q11 Volume %North America 23.82 24.00 0.17 0.73 23.69 23.99 0.30 1.27Western Europe 14.56 14.45 -0.11 -0.75 14.37 14.29 -0.08 -0.57OECD Pacific 7.41 7.39 -0.02 -0.28 8.00 7.98 -0.02 -0.28Total OECD 45.79 45.83 0.04 0.10 46.06 46.26 0.20 0.42
Other Asia 9.88 10.07 0.19 1.89 10.11 10.30 0.19 1.92Latin America 6.22 6.37 0.14 2.30 6.17 6.31 0.13 2.14Middle East 7.48 7.67 0.19 2.57 7.24 7.44 0.20 2.76Africa 3.17 3.20 0.03 0.82 3.32 3.34 0.02 0.75Total DCs 26.75 27.30 0.55 2.05 26.84 27.39 0.55 2.05
FSU 4.18 4.21 0.03 0.60 4.22 4.26 0.04 0.98Other Europe 0.66 0.63 -0.03 -3.80 0.70 0.66 -0.04 -5.60China 9.18 9.67 0.49 5.37 8.76 9.20 0.44 5.05Total "Other regions" 14.02 14.51 0.49 3.52 13.67 14.12 0.44 3.25
Total world 86.56 87.64 1.09 1.25 86.58 87.77 1.19 1.37
Table 4-8: Third and fourth quarter world oil demand comparison for 2011, mb/d
Change 2011/10 Change 2011/10
Totals may not add due to independent rounding

Monthly Oil Market Report_________________________________________________________________________________________________________________________________________
November 2010 32
World Oil Supply
Non-OPEC Forecast for 2010 Non-OPEC supply forecast to grow by 1.03 mb/d in 2010
Non-OPEC oil supply is expected to increase by 1.03 mb/d in 2010 to average 52.16 mb/d. This represents a minor upward revision to the supply growth figure of 0.02 mb/d from the previous month. Despite this minor upward revision, the absolute level was revised down 70 tb/d from the previous month. Norway, Gabon, and Ivory Cost supply profiles encountered historical revisions from 2008 that drove the downward revision to total non-OPEC supply in 2010, while upward revisions within 2010 quarters slightly offset the historical revision and increased growth in 2010. Within 2010, the supply forecasts for the US, Canada, Malaysia, Argentina, Brazil, and China experienced upward revisions while the outlook for the UK, Norway, Denmark, Australia, and Kazakhstan encountered downward revisions. The upward revisions were slightly higher than the downward ones, resulting in the upward revision to non-OPEC growth in 2010. Most of the introduced revision came on the back of updated production data, with the third quarter experiencing the largest revisions as more actual production data became available. The largest upward revision was introduced to North America oil supply in the third quarter as preliminary production data suggested higher output than previously expected in the US, Canada, and Mexico. OECD Western Europe oil supply experienced the biggest downward revision in the third quarter as preliminary data indicated lower-than-previously-expected output in Norway, UK, and Denmark. According to the preliminary actual and estimated data, total non-OPEC supply increased by 0.90 mb/d during the third quarter 2010, compared to the same period a year earlier. On a quarterly basis, non-OPEC supply is expected to average 52.18 mb/d, 52.17 mb/d, 51.99 mb/d and 52.30 mb/d respectively.
Table 5-1: Non-OPEC oil supply in 2010, mb/d
Change2009 1Q10 2Q10 3Q10 4Q10 2010 10/09
North America 14.36 14.71 14.86 14.86 14.72 14.79 0.43Western Europe 4.73 4.70 4.40 4.04 4.50 4.41 -0.32OECD Pacific 0.64 0.61 0.60 0.62 0.64 0.62 -0.02Total OECD 19.72 20.03 19.86 19.52 19.86 19.81 0.09
Other Asia 3.70 3.73 3.71 3.73 3.68 3.71 0.01Latin America 4.41 4.66 4.74 4.73 4.79 4.73 0.32Middle East 1.73 1.77 1.77 1.77 1.74 1.76 0.04Africa 2.63 2.63 2.60 2.62 2.60 2.61 -0.02Total DCs 12.47 12.79 12.82 12.85 12.81 12.82 0.35
FSU 12.96 13.12 13.18 13.23 13.35 13.22 0.26Other Europe 0.14 0.14 0.14 0.15 0.14 0.14 0.00China 3.85 4.03 4.10 4.18 4.06 4.09 0.24Total "Other regions" 16.94 17.29 17.41 17.55 17.55 17.45 0.51Total Non-OPEC production 49.13 50.10 50.09 49.92 50.22 50.08 0.95Processing gains 2.00 2.08 2.08 2.08 2.08 2.08 0.08
Total Non-OPEC supply 51.13 52.18 52.17 51.99 52.30 52.16 1.03Previous estimate 51.22 52.26 52.25 52.03 52.38 52.23 1.01Revision -0.09 -0.08 -0.08 -0.04 -0.08 -0.07 0.02
-0.50
-0.25
0.00
0.25
0.50
-0.50
-0.25
0.00
0.25
0.50
North America
OECD Europe
OECD Asia
Other Asia
Latin America
Middle East
Africa FSU
mb/dmb/d
09/08 10/09 11/10
Graph 5-1: Regional non-OPEC supply growth, y-o-y

_________________________________________________________________________________________________________________________________________Monthly Oil Market Report
November 2010 33
OECD OECD supply to increase by 90 tb/d in 2010 to average 19.81 mb/d
Total OECD oil supply is foreseen to increase by 0.09 mb/d to average 19.81 mb/d in 2010, following a minor upward revision of less than 0.01 mb/d. The upward revision introduced to North America oil supply forecast offset the downward revision experienced in the production outlook of OECD Western Europe and OECD Pacific. The OECD supply profile remains steady with the strong growth of North America being offset by the relatively sharp decline in OECD Western Europe while OECD Pacific maintained a steady state in 2010. According to the preliminary actual and estimated data, OECD supply averaged 19.52 mb/d in the third quarter, a decline of 0.35 mb/d from the previous quarter and a drop of 0.06 mb/d compared to the same quarter last year. During the first three quarters of 2010, OECD oil supply indicated an average increase of 0.15 mb/d, compared to the same period a year earlier. On a quarterly basis, OECD oil supply is seen to average 20.03 mb/d, 19.86 mb/d, 19.52 mb/d, and 19.86 mb/d respectively.
North America Oil production from North America is expected to increase by 0.43 mb/d in 2010, the highest among all regions, to average 14.79 mb/d, indicating an upward revision of 0.05 mb/d compared to the previous month. The expected healthy supply growth from the US and Canada and the relatively low anticipated decline from Mexico all supported the North America supply forecast in 2010. On average, North America supply increased by 0.53 mb/d during the first three quarters of 2010 compared to the same period of 2009, according to preliminary data. On a quarterly basis, North America oil supply is expected to stand at 14.71 mb/d, 14.86 mb/d, 14.86 mb/d, and 14.72 mb/d respectively.
US US deepwater drilling moratorium lifted
The deep water drilling moratorium has been lifted in the US, yet the resumption in deep water drilling is seen to be slow as the processing of granting drilling permits is expected to be slowed by tough rules and regulations. Deep water drilling permits have been sought by major producers in the Gulf of Mexico in October and the speed by which the Bureau of Ocean Energy Management will grant their approval will provide an insight to the Macondo’s post moratorium effect on US oil supply. US oil production is forecast to increase by 0.33 mb/d in 2010 to average 8.48 mb/d, indicating an upward revision of 0.03 mb/d compared to last month’s appraisal. The upward revision came mainly in the third quarter to adjust for updated production data. The US anticipated output growth in 2010 is the highest among all non-OPEC countries. Expected growth is supported by biofuels, NGL, and Bakken shale oil production which is seen as offsetting the Gulf of Mexico. Biofuel production continues to grow strong in the US in 2010, supported by favourable economics to meet local demand as well as to export. The Environmental Protection Agency’s (EPA) decision to allow up to 15% of ethanol in the gasoline blend for car and trucks built in 2007 and later, is seen to further support growth. Additionally, the reports of a 45% increase in drilling for oil and gas in the third quarter of 2010 compared to the same period in 2009 is further supporting anticipated growth. On a quarterly basis, US oil supply is estimated to average 8.44 mb/d 8.52 mb/d, 8.53 mb/d, and 8.41 mb/d respectively.
Canada and Mexico
Canadian supply to increase by 0.11 mb/d in 2010 to average 3.35 mb/d
Despite the partial shutdown of production at Saskatchewan, updated output data indicated a continued healthy level that necessitated an upward revision, mainly in the third quarter. The completion of maintenance work at one of the oil sand upgraders at Fort McMurray further supported output in the third quarter. During the first three quarters of 2010, Canadian oil supply indicated an average increase of 0.11 mb/d
18.0
18.5
19.0
19.5
20.0
20.5
21.0
18.0
18.5
19.0
19.5
20.0
20.5
21.0
1Q
08
2Q
08
3Q
08
4Q
08
1Q
09
2Q
09
3Q
09
4Q
09
1Q
10
2Q
10
3Q
10
4Q
10
1Q
11
2Q
11
3Q
11
4Q
11
mb/dmb/dGraph 5-2: OECD's quarterly production

Monthly Oil Market Report_________________________________________________________________________________________________________________________________________
November 2010 34
compared to the same period of last year. Oil production from Canada is projected to grow by 0.11 mb/d in 2010 to average 3.35 mb/d, indicating an upward revision of 0.02 mb/d compared to last month. The Canadian supply profile remains unchanged with growth seen coming from non-conventional sources such as the oil sands, while conventional crude oil production is seen declining. According to preliminary data, Canada oil supply averaged 3.38 mb/d in the third quarter 2010, a minor increase from the second quarter and significant growth of 0.15 mb/d compared to the third quarter of 2009. On a quarterly basis, Canada’s supply is expected to average 3.27 mb/d, 3.37 mb/d, 3.38 mb/d and 3.39 mb/d respectively.
Mexico output stabilization efforts delivering the desired results so far in 2010
The ongoing gas injection and horizontal drilling at the Cantarell oilfield is reported to have helped stem the decline of Mexico’s steeply declining field. The measure is supporting the stabilization of Mexico oil supply at the 2.97 mb/d, so far experienced in 2010. During the first three quarters, Mexico oil supply remained relatively steady compared to the same period the previous year, with a minor decline of less than 0.02 mb/d on average, while in 2009 output dropped more than 0.21 mb/d during the first three quarters from the year before. Mexico oil production is expected to decline by 0.02 mb/d in 2010 to average 2.96 mb/d, flat from the previous month. September supply showed a minor increase from both August as well as the same month a year ago. On a quarterly basis, Mexico’s oil supply is seen to average 2.99 mb/d, 2.97 mb/d, 2.95 mb/d, and 2.92 mb/d respectively.
Western Europe OECD Western Europe total oil is forecast to decline 0.32 mb/d in 2010 to average
4.41 mb/d, indicating a downward revision of 0.03 mb/d compared to the previous month. While there has been a historical upward revision since 2008, however, the experienced downward revision in the third quarter 2010 more than offset the historical adjustment. Updated production data for the main producers required the downward revision mainly on the back of heavy maintenance and unexpected shutdowns. OECD Western Europe remains the region with the biggest decline among all non-OPEC regions. According to preliminary data, OECD Western Europe oil production averaged 4.04 mb/d in the third quarter, a decline of 0.36 mb/d compared to the second quarter and a drop of 0.43 mb/d compared to the same quarter in 2009. On a quarterly basis, OECD Western Europe oil supply is seen to stand at 4.70 mb/d, 4.40 mb/d, 4.04 mb/d and 4.50 mb/d respectively.
Norway supply to decline by 0.20 mb/d in 2010 and average 2.16 mb/d
Maintenance and unexpected shutdowns continued to influence production in Norway, with a power problem forcing the shutdown of the Troll B. Accordingly, the unexpected low production level in September due to maintenance, required a downward revision to Norway third quarter supply estimates. While a historical upward revision of slightly more than 0.01 mb/d from 2008 was introduced due to updated production data, the downward revision in the third quarter 2010 more than offset the historical upward revision. Norway oil production is anticipated to decline by 0.20 mb/d in 2010 and average 2.1 mb/d, representing a downward revision of 0.01 mb/d compared to the previous month. The current expected drop in Norway oil supply in 2010 is seen as the largest since 2007. Furthermore, the reported downside risk to the fourth quarter supply by a major producer in addition to announcements that supply will be at the lower range of 2010 production guidelines raised concerns that a further downward revision is possible, as the fourth quarter is expected to experience an increase in production from the previous two quarters. On a quarterly basis, Norway’s production is expected to average 2.33 mb/d, 2.12 mb/d, 1.91 mb/d and 2.27 mb/d respectively.
Burghley field started up in October 2010
During the third quarter 2010, reports indicated a drop in drilling activities in the UK by 20% compared to the same period in 2009, mainly due to economic uncertainties. The drop is seen to affect the production in the short and medium term. Additionally, preliminary production data in the third quarter indicates the heavy effect of maintenance on UK oil supply, hence requiring a downward revision. UK oil production is expected to decline by 0.09 mb/d in 2010 to average 1.39 mb/d, indicating a downward revision of 0.01 mb/d compared to the previous month. The downward revision came only in the third quarter. However, supply is expected to improve in the fourth quarter as the maintenance season comes to an end. Additionally, the startup of the Burghley project is further supporting supply in the fourth quarter. During the first three quarters of 2010, UK oil production declined by an average 0.10 mb/d compared

_________________________________________________________________________________________________________________________________________Monthly Oil Market Report
November 2010 35
to the same period last year. On a quarterly basis, UK oil output is expected to average 1.51 mb/d, 1.40 mb/d, 1.26 mb/d and 1.38 mb/d respectively.
Denmark oil production is estimated to average 0.24 mb/d in 2010, a drop of 0.02 mb/d, representing a downward revision of 0.01 mb/d compared to the previous month. The downward revision came on the back of updated production data in the third quarter, which showed lower-than-anticipated output due to maintenance.
Asia Pacific OECD Pacific total oil production is anticipated to decline by 0.02 mb/d in 2010 to
average 0.62 mb/d, indicating a downward revision of 0.02 mb/d compared to last month. The downward revision came from Australia, while the New Zealand oil supply estimate remained unchanged. On a quarterly basis, total OECD Pacific supply is seen to average 0.61 mb/d, 0.60 mb/d, 0.62 mb/d, and 0.64 mb/d respectively.
Van Gogh resumed production after a brief unplanned shutdown
The Van Gogh FPSO went through an unplanned maintenance and shut down for a week during in October; the field produced 0.05 mb/d during the second quarter. On the other hand, the Pyrenees field was reported to have had strong production during the third quarter which helped offset the decline in other areas in Australia which was affected by the typhoon season. Oil supply from Australia is predicted to decline by 0.02 mb/d in 2010 to average 0.52 mb/d, a downward revision of 0.02 mb/d compared to the previous month. On a quarterly basis, Australian oil supply is seen to stand at 0.51 mb/d, 0.50 mb/d, 0.52 mb/d and 0.54 mb/d respectively. In New Zealand, one of the wells at the Tui field restarted in October after a work-over, which is expected to slightly support production. Additionally, the Manaia field started commercial output through a long reach from the Maari field, which is further seen to support oil production.
Developing Countries DC supply forecast to grow by 0.33 mb/d in 2010 to average 12.90 mb/d
Developing Countries (DC’s) oil supply is projected to increase by 0.35 mb/d in 2010 to average 12.82 mb/d, indicating a minor upward revision of 0.02 mb/d to growth, while the absolute level experienced a downward revision of 0.08 mb/d, compared to the previous month. The downward revision was mainly due to the historical revision introduced to Gabon and Ivory Cost oil supply in 2008. The historical downward revision was more than 0.10 mb/d; however, the upward revision to the 2010 supply forecast partially offset the significant historical downward revision. In general, the DC supply profile remains unchanged from the previous month with growth expected from Latin America and the Middle East, while Other Asia is seen to remain steady and Africa to decline. Latin America, supported by Brazil and Colombia, remains the main growth driver within the DC group. Other Asia and Latin America experienced a minor upward revision of 0.01 mb/d and 0.02 mb/d respectively. The revisions came mainly in the third quarter to adjust for updated production data. On a quarterly basis, DC oil supply is expected to average 12.79 mb/d, 12.82 mb/d, 12.85 mb/d, and 12.81 mb/d respectively. According to preliminary data, during the first three quarters of 2010, DC oil supply increased by 0.40 mb/d, compared to the same period of 2009.
Other Asia output to average 3.71 mb/d in 2010, steady from 2009
A minor upward revision was introduced to Other Asia oil supply forecast, mainly in the third quarter, to adjust for updated production data that indicated slightly higher-than-expected output from India and Malaysia. The upward revision experienced in India oil supply in the third quarter did not affect the annual figure of 2010. For Malaysia, updated production data in the third quarter required a minor upward revision of 0.01 mb/d. Accordingly, Other Asia oil supply is forecast to remain relatively steady with a minor
12.00
12.25
12.50
12.75
13.00
13.25
13.50
13.75
12.00
12.25
12.50
12.75
13.00
13.25
13.50
13.75
1Q
08
2Q
08
3Q
08
4Q
08
1Q
09
2Q
09
3Q
09
4Q
09
1Q
10
2Q
10
3Q
10
4Q
10
1Q
11
2Q
11
3Q
11
4Q
11
mb/dmb/d
Graph 5-3: Developing Countries' quarterly production

Monthly Oil Market Report_________________________________________________________________________________________________________________________________________
November 2010 36
increase of 0.01 mb/d in 2010 to average 3.71 mb/d, an upward revision of 0.01 mb/d compared to previous month’s evaluation. Indonesia oil supply, the group’s largest producer is expected to remain flat in 2010 compared to the previous year. Production data indicated that Indonesia oil supply declined in September compared to the previous month mainly on unplanned outages for fields such as Duri and Sepanjang. The Duri field is assumed to have returned to full capacity after the shutdown at the end of September due to the pipeline leak. On a quarterly basis, Other Asia oil supply is seen to stand at 3.73 mb/d, 3.71 mb/d, 3.73 mb/d, and 3.68 mb/d respectively.
Tupi started up in October 2010
Argentina and Brazil oil supply forecasts encountered minor upward revisions compared to the previous month. In Brazil, updated biofuel production data, mainly during the first half of the year, required a minor upward revision. In Argentina, updated production data during the third quarter as well as some adjustment during the fourth quarter required a minor upward revision. Accordingly, Latin America oil supply is projected to increase by 0.32 mb/d in 2010 to average 4.73 mb/d, representing an upward revision of 0.02 mb/d compared to the previous month. In Argentina, the startup of the ethanol plant at the Jujuy is supporting the upward revision as well as the biodiesel plant at Iaza Huinul. In Brazil, according to recently updated data, biofuel supply increased strongly during the first three quarters of 2010 compared to the previous year, which has required the encountered revision during the first half. In October, production started at the Tupi subsalt oil field by the Cidade de Angra with output expected to reach 0.08 mb/d by the end of 2011. Additionally, Maxilhao and P-57 are expected to start up by year end, supporting the anticipated strong growth in 2010. During the first three quarters of 2010, Brazil oil supply increased by 0.21 mb/d compared to the same period a year earlier. In Colombia, oil production continued to show strong growth in the third quarter 2010, with supply indicating an increase of 0.12 mb/d compared to the same quarter in 2009. On a quarterly basis, Latin America oil production is seen to average 4.66 mb/d, 4.74 mb/d, 4.73 mb/d, and 4.79 mb/d respectively.
Middle East supply to average 1.76 mb/d
Oman remains the only country with expected oil supply growth in 2010 within the Middle East, while supply from Syria is expected to remain flat and Yemen output is seen to decline. Middle East oil production is forecast to increase by 0.04 mb/d in 2010 to average 1.76 mb/d, flat from the previous month. During the first three quarters of 2010, Middle East oil supply increased by an average 0.04 mb/d compared to the same period a year earlier. On a quarterly basis, Middle East oil supply is estimated to average 1.77 mb/d, 1.77 mb/d, 1.77 mb/d, and 1.74 mb/d respectively.
Africa supply to average 2.61 mb/d in 2010
Historical revisions were introduced to Gabon and Ivory Coast oil supply in 2008 that were carried over to 2010 and 2011. The revisions were incorporated to adjust for recently updated production data. There were no other revisions within Africa for 2010, therefore, only the total figure has changed while growth volume remained unchanged. Africa oil production is anticipated to remain relatively flat and average 2.61 mb/d in 2010. On a quarterly basis, Africa oil output is seen to average 2.63 mb/d, 2.60 mb/d, 2.62 mb/d, and 2.60 mb/d respectively.
FSU, Other Regions FSU supply to increase by 0.26 mb/d in 2010 and average 13.22 mb/d
Total FSU oil supply is forecast to increase by 0.26 mb/d in 2010 to average 13.22 mb/d, representing a minor downward revision of less than 0.02 mb/d compared to the previous month. The downward revision came mainly from Kazakhstan due to updated production data. There was a minor upward revision to Russia oil supply forecast; however, it was not enough to offset the downward revision. Growth remains expected from all major producers from the FSU in 2010, with Russia at the top of the list in terms of growth volume. During the first three
3.8
3.9
4.0
4.1
4.2
4.3
4.4
12.0
12.5
13.0
13.5
1Q
08
2Q
08
3Q
08
4Q
08
1Q
09
2Q
09
3Q
09
4Q
09
1Q
10
2Q
10
3Q
10
4Q
10
1Q
11
2Q
11
3Q
11
4Q
11
mb/dmb/d
FSU (LHS) Other regions (RHS)
Graph 5-4: FSU and other region's quarterly production

_________________________________________________________________________________________________________________________________________Monthly Oil Market Report
November 2010 37
quarters of 2010, FSU oil output increased by 0.29 mb/d on average, compared to the same period of 2009. On a quarterly basis, total oil supply in the FSU is estimated to average 13.12 mb/d, 13.18 mb/d, 13.23 mb/d, and 13.35 mb/d respectively. China oil production is expected to increase by 0.24 mb/d in 2010 to average 4.09 mb/d. Other Europe supply is estimated to remain flat from 2009 and average 0.14 mb/d in 2010.
Russia Russia output recorded another record high in October
According to preliminary data, Russia oil production registered a new record high in October exceeding the previous month’s record high by 0.10 mb/d. In 2010, Russian oil supply continued to show solid resilience with monthly output breaking the previous record high six times so far in the year. Russia oil supply is projected to grow by 0.18 mb/d in 2010 and average 10.10 mb/d, unchanged from the previous month. Despite the steady state, there was a minor upward revision in the third and fourth quarter that did not affect the annual figure. However, it is foreseen that an upward revision will be introduced in the coming months to adjust for the record-high production in October, yet it will depend on the output level in the coming months. The strong production level was supported by the startup of the Ravninnoye field, in addition to the ramp-up of the recently started projects such as the Vankor, Uvat, and Odoptu which are seen behind the impressive growth in supply. During the first three quarters of 2010, Russia oil production increased by 0.24 mb/d on average, compared to the same period in 2009. The healthy level of growth so far in 2010 can be recognized by comparing growth in the first three quarters of 0.24 mb/d to the growth in the same period of 2009 which stood at less than 0.10 mb/d. On a quarterly basis, Russian oil supply is seen to average 10.09 mb/d, 10.12 mb/d, 10.13 mb/d, and 10.07 mb/d respectively. Russia oil production averaged 10.28 mb/d in October, up by 0.10 mb/d from September.
Caspian Kazakh supply to grow by 60 tb/d in 2010 to average 1.60 mb/d
Maintenance at the Karachanganak field has affected Kazakhstan output during the late part of the third quarter and hence required the incorporation of a downward revision to the supply forecast. Kazakhstan oil production is anticipated to increase by 0.06 mb/d in 2010 to average 1.60 mb/d, indicating a downward revision of 0.02 mb/d compared to the previous month. Production is expected to increase in the fourth quarter as maintenance comes to an end. During the first three quarters of 2010, Kazakhstan oil production increased by 0.07 mb/d on average, compared to the same period of 2009. On a quarterly basis, Kazakhstan oil supply is estimated to average 1.61 mb/d, 1.56 mb/d, 1.57 mb/d, and 1.66 mb/d respectively.
Azeri supply to increase by 40 tb/d in 2010 to average 1.10 mb/d
Azerbaijan oil production is expected to increase by 0.04 mb/d in 2010 to average 1.10 mb/d, flat from the previous month. Azeri oil output is expected to increase during the fourth quarter. During the first three quarters, Azerbaijan oil supply increased by an average of 0.01 mb/d over the same period of 2009, lower than the 0.07 mb/d average achieved in the same period of 2009 over 2008. On a quarterly basis, Azerbaijan oil output is expected to stand at 1.01 mb/d, 1.09 mb/d, 1.12 mb/d, and 1.18 mb/d respectively.
China China supply reached a record high in September
According to preliminary data, China oil production reached a record high in September, with an increase of 0.08 mb/d over the previous month. Growth was supported by the startup of the BoZhong 26-3 and the LD 32-2 fields in the Bohai Bay. The increase required an upward revision to the China supply forecast. China oil production is foreseen to increase by 0.24 mb/d in 2010 to average 4.09 mb/d, indicating an upward revision of 0.02 mb/d compared to last month. Supply growth forecast in 2010 is placing China as the country with the second largest growth, next only to the US, among all non-OPEC countries. During the first three quarters of 2010, China oil supply increased by 0.25 mb/d compared to the same period in the previous year. The strong growth was supported by the startup of new fields in the Bohai Bay and other areas as well as the strong performance of the existing fields that was realized through effective technical measures. Output is forecast to decline slightly in the fourth quarter, partially, on the shutdown due to typhoon Megi. However, if production continues to remain strong in the coming months, an upward revision will be introduced. On a quarterly basis, China oil supply is estimated to average 4.03 mb/d, 4.10 mb/d, 4.18 mb/d, and 4.06 mb/d respectively.
Forecast for 2011

Monthly Oil Market Report_________________________________________________________________________________________________________________________________________
November 2010 38
Non-OPEC supply to increase by 0.36 mb/d in 2011 to average 52.52 mb/d
Non-OPEC oil production is expected to increase by 0.36 mb/d to average 52.52 mb/d in 2011. The absolute level experienced a downward revision of 70 tb/d, mainly due to historical changes in 2008, as well as the undertaken revisions in 2010. There were minor changes to the 2011 forecast, due mainly to changes in project scheduling. The overall outlook for non-OPEC supply in 2011 remains relatively unchanged with strong growth anticipated from Latin America, driven mainly by Brazil and Colombia. OECD Western Europe is seen to have the largest decline in 2011. US oil supply is expected to remain relatively flat in 2011. Russia oil supply is projected to show a minor decline in 2011; however, given the strong production level in October, the forecast might experience an upward revision over the coming period, depending on supply developments in the fourth quarter. China oil supply is anticipated to experience a minor decline, yet could encounter an upward revision in the coming period, depending on the output in the fourth quarter. Canada, India, Oman, Ghana, Kazakhstan, and Azerbaijan are expected to continue to drive growth in 2011, in addition to Brazil and Colombia. On a quarterly basis, non-OPEC supply is seen to average 52.39 mb/d, 52.29 mb/d, 52.41 mb/d, and 53.00 mb/d respectively.
Revisions to the 2011 forecast There were a few revisions to the 2011 non-OPEC supply forecast, in addition to the
historical and 2010 revisions. In Australia, changes to the startup schedule of both Kipper and Turrum required a downward revision. Australia output is now expected to increase 30 tb/d in 2011 to average 0.55 mb/d. In Canada, the startup of the Leiser oil sand project has been moved to the first quarter, necessitating an upward revision. Canada oil supply is forecast to increase by 0.10 mb/d in 2011 to average 3.46 mb/d.
OPEC natural gas liquids and non-conventional oils OPEC NGLs and non-conventional oils are forecast to grow by 0.44 mb/d in 2010 to
average 4.79 mb/d. In 2011, OPEC NGLs and nonconventional oils are expected to increase by 0.45 mb/d to average 5.24 mb/d.
Table 5-2: Non-OPEC oil supply in 2011, mb/d
Change2010 1Q11 2Q11 3Q11 4Q11 2011 11/10
North America 14.79 14.78 14.80 14.81 14.99 14.85 0.06Western Europe 4.41 4.42 4.20 4.09 4.25 4.24 -0.17OECD Pacific 0.62 0.64 0.65 0.64 0.63 0.64 0.02Total OECD 19.81 19.84 19.64 19.54 19.87 19.72 -0.09
Other Asia 3.71 3.72 3.71 3.75 3.76 3.74 0.02Latin America 4.73 4.88 4.94 5.03 5.13 5.00 0.27Middle East 1.76 1.76 1.76 1.77 1.78 1.77 0.00Africa 2.61 2.62 2.65 2.68 2.74 2.67 0.06Total DCs 12.82 12.98 13.06 13.23 13.42 13.17 0.35
FSU 13.22 13.32 13.31 13.36 13.43 13.36 0.14Other Europe 0.14 0.14 0.14 0.14 0.15 0.14 0.00China 4.09 4.04 4.06 4.06 4.06 4.05 -0.04Total "Other regions" 17.45 17.49 17.51 17.56 17.63 17.55 0.10Total Non-OPEC production 50.08 50.31 50.21 50.33 50.92 50.44 0.36Processing gains 2.08 2.08 2.08 2.08 2.08 2.08 0.00
Total Non-OPEC supply 52.16 52.39 52.29 52.41 53.00 52.52 0.36Previous estimate 52.23 52.44 52.35 52.48 53.08 52.59 0.36
Revision -0.07 -0.05 -0.06 -0.08 -0.08 -0.07 0.00
Change Change Change2008 2009 09/08 1Q10 2Q10 3Q10 4Q10 2010 10/09 2011 11/10
Total OPEC 4.14 4.35 0.21 4.60 4.77 4.81 4.98 4.79 0.44 5.24 0.45
Table 5-3: OPEC NGLs + non-conventional oils, 2008-2011

_________________________________________________________________________________________________________________________________________Monthly Oil Market Report
November 2010 39
OPEC crude oil production OPEC crude oil production increased 0.14 b/d in October
Total OPEC crude oil output averaged 29.30 mb/d in October, according to secondary sources, up 0.14 mb/d from the previous month. Crude oil production experienced a considerable increase from Nigeria and Angola, while production fell from Saudi Arabia and Iraq. According to secondary sources, OPEC crude production, not including Iraq, stood at 26.89 mb/d in October, an increase of 0.16 mb/d over the previous month.
World Oil Supply Preliminary figures indicate that global oil supply increased 0.78 mb/d in October to
average 86.76 mb/d. Non-OPEC supply experienced growth of 0.64 mb/d while OPEC crude production increased by 0.14 mb/d. The share of OPEC crude oil in global production remained steady at 34% in October. The estimate is based on preliminary data for non-OPEC supply, estimates for OPEC NGLs and OPEC crude production from secondary sources.
Table 5-4: OPEC crude oil production based on secondary sources, 1,000 b/d
2009 4Q09 1Q10 2Q10 3Q10 Aug 10 Sep 10 Oct 10 Oct/SepAlgeria 1,270 1,270 1,271 1,270 1,269 1,269 1,267 1,265 -1.7Angola 1,786 1,873 1,912 1,850 1,752 1,793 1,704 1,785 81.1Ecuador 477 474 474 471 471 469 469 465 -4.7Iran, I.R. 3,725 3,728 3,743 3,730 3,696 3,694 3,687 3,688 1.7Iraq 2,422 2,459 2,463 2,361 2,363 2,305 2,434 2,414 -19.9Kuwait 2,263 2,275 2,288 2,301 2,309 2,314 2,310 2,315 5.0Libya, S.P.A.J. 1,557 1,540 1,543 1,561 1,568 1,570 1,564 1,556 -8.3Nigeria 1,812 1,942 1,987 1,971 2,114 2,107 2,145 2,242 96.6Qatar 781 795 803 801 805 804 808 810 1.7Saudi Arabia 8,055 8,122 8,127 8,139 8,218 8,238 8,202 8,169 -33.6UAE 2,256 2,258 2,280 2,307 2,309 2,307 2,299 2,311 11.6Venezuela 2,309 2,284 2,291 2,294 2,285 2,293 2,270 2,284 14.3Total OPEC 28,712 29,019 29,181 29,057 29,159 29,163 29,160 29,304 143.7OPEC excl. Iraq 26,290 26,560 26,719 26,695 26,796 26,858 26,726 26,890 163.6
Totals may not add due to independent rounding
82
83
84
85
86
87
88
26
27
28
29
30
31
32
No
v 0
8
De
c 0
8
Jan
09
Fe
b 0
9
Ma
r 0
9
Ap
r 09
Ma
y 0
9
Jun
09
Jul 0
9
Au
g 0
9
Se
p 0
9
Oct
09
No
v 0
9
De
c 0
9
Jan
10
Fe
b 1
0
Ma
r 1
0
Ap
r 10
Ma
y 1
0
Jun
10
Jul 1
0
Au
g 1
0
Se
p 1
0
Oct
10
mb/dmb/d
OPEC crude production (LHS) World supply (RHS)
Graph 5-5: OPEC and world oil supply

Monthly Oil Market Report_________________________________________________________________________________________________________________________________________
November 2010 40
Product Markets and Refinery Operations Product market tightening in Europe lent a temporary respite to refinery margins
The strike that started in the Fos-Lavera oil terminal and continued for most of October, forced the temporary shutdown of more than 1 mb/d of refining capacity in France and created a shortage of product availability due mainly to a disruption in the distribution systems rather than a supply shortage. The open arbitrage created to Europe due to the French strike has driven the positive market sentiment this month, giving some respite to the weak gasoline market and lending support to refinery margins. However, in some areas, this support has been cancelled out by soft fuel oil demand. Looking ahead, with the approaching end of the refinery maintenance season, moderated runs in some areas will not offset the imbalance in light distillates and the oversupply of fuel oil could pressure refinery margins in the coming months. Refining margins for WTI crude oil at the US Gulf Coast kept part of the gains seen in recent months and showed only a slight drop of $1.5 to stand at around $7/b in October. In Europe, the refining industry took advantage of the tight supply situation generated by the strike in France and the maintenance season. This temporary shortage increased arbitrage from Asia and the US to Europe and the market was strong enough to allow the recovery in gasoline and distillate gains and the margin for Brent crude in Rotterdam recovered by around $1/b. Refining margins for Dubai crude oil in Singapore was supported by the gains in light and middle distillates cracks due to higher naphtha demand from the petrochemical sector and open arbitrage to Europe, and despite the bearish fuel oil sentiment created by the oversupply inflows the refinery margin rose $1/b in October.
Refinery operationsRefiners continued to proceed cautiously in October, moderating runs
North American refiners continued to keep refinery runs low in an effort to protect the margins. In October, due to the tight situation of products in Europe, gasoline and distillate stocks dropped, causing a recovery of the gasoline crack in the US, which, in combination with stronger distillate demand on both sides of the Atlantic, allowed the US to protect its refining margins. European refiners kept moderated throughputs, while Asian refiners faced an oversupplied fuel market, however taking advantage of the open arbitrage to Europe. China increased utilization rates. Refinery utilization rates in the US dropped again during this month to 83%, the lowest level in the last months, which has allowed for an additional drop in record-high stock levels. In contrast, European refiners kept moderated utilization rates, although some refineries raised throughputs to partially compensate for the shutdown in France. According to preliminary data, European refinery utilization rates have maintained a
-4
-2
0
2
4
6
8
-4
-2
0
2
4
6
8
Oct 0
9
Nov 0
9
Dec 0
9
Jan 1
0
Feb 1
0
Mar 10
Apr 10
May 1
0
Jun 1
0
Jul 1
0
Aug 1
0
Sep 1
0
Oct 1
0
US$/bUS$/b
WTI (US Gulf ) A.Heavy (US Gulf )
Brent (Rott.) Dubai (Sing.)
Graph 6-1: Refining margins, 2009-2010
6065707580859095
6065707580859095
Oct 0
9
Nov 0
9
Dec 0
9
Jan 1
0
Feb 1
0
Mar 10
Apr 10
May 1
0
Jun 1
0
Jul 1
0
Aug 1
0
Sep 1
0
Oct 1
0
%%
United States EU-16 Japan Singapore
Graph 6-2: Refinery utilization rates, 2009-2010

_________________________________________________________________________________________________________________________________________Monthly Oil Market Report
November 2010 41
similar level from the previous month of around 85%. In Asia, after the end of the seasonal refinery maintenance in China, refinery run levels have increased from 82% to around 85% while Japan continued with moderated levels of 74%. Looking ahead, the seasonal maintenance of some refineries and run cuts cannot offset the high refining spare capacity around the world and in an environment of a fuel oversupplied market and weak margins, operation levels are not expected to rise significantly during the coming months.
US market Some respite for the weak gasoline market despite lower domestic demand
In October, gasoline demand fell about 80 tb/d to reach a level of around 9 mb/d, the lowest level for the last six months. Despite the drop in demand, gasoline prices were much stronger, because of an open arbitrage from the US Gulf Coast to Europe, due to the French refinery strike, which, along with lower refinery runs, caused US gasoline inventories to drop. The short supply of gasoline cargoes from Europe resulted in the Colonial Pipeline operating at capacity and the Atlantic Coast RBOB premium strengthening, due to the shortage of gasoline components to be blended. These developments allowed the gasoline crack spread on the US Gulf Coast to keep the recovery shown last month to average $11.10/b in October, up from $10.60/b the month before. The oversupply situation in the Atlantic Basin, which has pressured margins in recent months, was offset during October by the French strike. However, after the end of this temporary situation, oversupply is again likely to weigh on market sentiment. Middle distillate demand kept increasing in the US to 3.91 mb/d in October from 3.82 mb/d the previous month, the highest for this year and 253 tb/d higher than the y-o-y average. Stronger domestic distillate demand from the industrial sector and the requirement to store heating oil for the winter season, along with open arbitrage from the US Gulf Coast to Europe, as well as additional export opportunities to Latin America (Mexico, Colombia, Peru, Paraguay) maintained the positive sentiment in the distillates market. The US gasoil crack at the Gulf Coast kept the ground gained in September and remained at an average of around $11.50/b in October, similar to a month earlier. Following these developments, on Nymex, heating oil managed money traders increased net long positions to 52,926 lots in October from 32,824 the previous month. Low activity in the high sulphur fuel oil market and limited arbitrage from the US Gulf Coast to Singapore pressured margins, despite some export opportunities to Latin America.
-10-505101520
-10-505
101520
Jul 0
9
Jul 1
6
Jul 2
3
Jul 3
0
Aug 6
Aug 1
3
Aug 2
0
Aug 2
7
Sep 0
3
Sep 1
0
Sep 1
7
Sep 2
4
Oct 0
1
Oct 0
8
Oct 1
5
Oct 2
2
Oct 2
9
US$/bUS$/b
Prem.Gasoline Unl.93 Jet/Kero
Gasoil/Diesel (0.05%S) Fuel oil (1.0%S)
Graph 6-3: US Gulf crack spread vs. WTI, 2010

Monthly Oil Market Report_________________________________________________________________________________________________________________________________________
November 2010 42
European market Refinery outages in France lent temporary support to the product market
The requirement to meet the French supply gap amid moderated refinery runs in Europe, due in part to the heavy refinery maintenance schedule, caused tight supply in the region, which lent a short respite to weak gasoline margins. Additional support came from the demand side due to export opportunities to West Africa, although some unloading delays in the port of Lagos limited the level of exports to this region. Syrian imports in October also were 30% higher than typical, boosting exports to the Middle East region. The gasoline crack spread against Brent crude oil at Rotterdam rose to average $12.70/b in October from an average of $11.80/b in the previous month. The crack spread dropped at the end of October following news about the end of the strike in France. The European naphtha market became stronger due to higher runs in naphtha crackers to counter the limited production in France, at a time when naphtha was very competitive in the petrochemical sector due to higher prices of propane and butane. Strong demand for middle distillates ahead of the winter season, amid supply tightening by European refiners during the French strike caused middle distillate cracks in Europe to rise to the strongest level in the last five months despite higher inflows from the US and Asia as arbitrage opened. The gasoil crack spread against Brent crude at Rotterdam increased from $12.50/b in September to $14/b in October. Expectations of some refinery maintenance and lower exports from Russia kept the gasoil market momentum positive. The European fuel oil market continued losing ground gained over the last months due to limited arbitrage opportunities, with low and occasional flows to Asia-Pacific and the US and with high discounts. Low sulphur fuel oil cracks have dropped on the back of low utility demand due to the end of the season, reduced power generation requirements and abundant supply. The low sulfur fuel oil crack spread against Brent dropped sharply from minus $7/b in September to minus $8/b in October, the lowest value in the last five months.
Asian market Distillates supported margins despite a weak fuel oil market
Asian naphtha market sentiment became bullish due to lower inflows from India and Middle East producers amid steady demand from Korean Petrochemical producers on the back of better ethylene margins which have encouraged an increase in runs. Asian gasoline market sentiment during October changed from depressed to bullish and prices rose despite a slowdown in Indian and Indonesian demand, supported by the open arbitrage to the West due to the tightened European supply.
-10-505101520
-10-505
101520
Jul 0
9
Jul 1
6
Jul 2
3
Jul 3
0
Aug 6
Aug 1
3
Aug 2
0
Aug 2
7
Sep 0
3
Sep 1
0
Sep 1
7
Sep 2
4
Oct 0
1
Oct 0
8
Oct 1
5
Oct 2
2
Oct 2
9
US$/bUS$/b
Prem.Gasoline Unl.50 ppm Jet/Kero
Gasoil 50 ppm Fuel oil (1.0%S)
Graph 6-4: Rotterdam crack spreads vs. Brent, 2010
-10-505101520
-10-505
101520
Jul 0
9
Jul 1
6
Jul 2
3
Jul 3
0
Aug 6
Aug 1
3
Aug 2
0
Aug 2
7
Sep 0
3
Sep 1
0
Sep 1
7
Sep 2
4
Oct 0
1
Oct 0
8
Oct 1
5
Oct 2
2
Oct 2
9
US$/bUS$/b
Prem.Gasoline Unl.92 Jet/Kero
Gasoil 50 ppm Fuel oil 180 CST (2.0%S)
Graph 6-5: Singapore crack spreads vs. Dubai, 2010

_________________________________________________________________________________________________________________________________________Monthly Oil Market Report
November 2010 43
The gasoline crack spread against Dubai crude oil in Singapore increased from an average $5.50/b in September to $7.20/b in October. Once the tight supply situation in Europe ends, the gasoline market will be back on the bearish side. Additionally, East to West middle distillate arbitrage opportunities have emerged in October as lower product supplies in Europe allowed for volumes from Asia to fill the gap, lifting Singapore gasoil. Middle East demand for low sulphur gasoil was also strong, while Vietnam has reduced imports due to high stocks. The gasoil crack spread in Singapore against Dubai gained ground to reach $15/b in mid-October, the highest level in five months and averaged around $14.60/b, increasing more than $1 compared to the previous month. Considering that the main support came from the impact of the French strike on supplies instead of demand fundamentals and as this support has ceased with the end of the strike, there are concerns that market sentiment could became negative unless it can gain some support from the supply side as Chinese gasoil exports are expected to be reduced because of higher demand from the agriculture and fishing sectors as well as maintenance schedules in Japan. The Asian fuel oil market continued losing ground gained during previous months due to a supply glut caused by arbitrage arrivals of HSFO, which are capping price gains and keeping pressure on the market . Following these developments, the high sulfur fuel oil crack spread in the Singapore market against Dubai crude fell $1/b in the last month to stand around minus $6/b on average in October. Higher inflows from the West will keep weighing on Asian fuel oil market sentiment.

Monthly Oil Market Report_________________________________________________________________________________________________________________________________________
November 2010 44
Table 6-1: Refined product prices, US$/b
ChangeAug 10 Sep 10 Oct 10 Oct/Sep
US Gulf (Cargoes):Naphtha 78.01 80.89 86.39 5.51Premium gasoline (unleaded 93) 86.20 85.64 93.35 7.71Regular gasoline (unleaded 87) 83.76 82.98 87.79 4.82Jet/Kerosene 87.99 88.86 94.49 5.64Gasoil (0.05% S) 84.98 87.05 93.36 6.31Fuel oil (1.0% S) 69.15 69.80 74.91 5.11Fuel oil (3.0% S) 66.63 67.12 71.51 4.39Rotterdam (Barges FoB):Naphtha 73.29 75.12 83.47 8.35Premium gasoline (unleaded 10 ppm) 86.77 89.26 96.08 6.83Premium gasoline (unleaded 95) 85.88 86.77 93.41 6.64Jet/Kerosene 89.01 90.19 96.35 6.16Gasoil/Diesel (10 ppm) 88.21 90.47 96.88 6.41Fuel oil (1.0% S) 72.50 70.23 73.78 3.56Fuel oil (3.5% S) 68.62 67.81 71.94 4.13Mediterranean Naphtha 71.39 73.69 81.71 8.02Premium gasoline (50 ppm) 88.63 90.86 97.81 6.95Jet/Kerosene 87.02 88.41 94.45 6.04Gasoil/Diesel (50 ppm) 88.26 90.47 96.65 6.18Fuel oil (1.0% S) 71.80 70.21 72.92 2.71Fuel oil (3.5% S) 68.87 66.78 71.75 4.97Singapore (Cargoes):Naphtha 73.31 74.52 82.97 8.44Premium gasoline (unleaded 95) 82.52 82.55 89.71 7.15Regular gasoline (unleaded 92) 80.83 80.58 87.66 7.09Jet/Kerosene 87.15 87.81 94.30 6.49Gasoil/Diesel (50 ppm) 88.10 88.53 94.97 6.44Fuel oil (180 cst 2.0% S) 71.32 70.07 74.42 4.35Fuel oil (380 cst 3.5% S) 69.58 68.92 73.05 4.13
Table 6-2: Refinery operations in selected OECD countries
Aug 10 Sep 10 Oct 10 Oct/Sep Aug 10 Sep 10 Oct 10 Oct/SepUSA 15.64 14.91 14.02 -0.89 88.9 87.4 82.6 -4.75France 1.48 1.47 0.68 -0.79 83.3 82.7 38.0 -44.70Germany 2.00 2.00 1.99 -0.01 83.1 83.2 83.6 0.43Italy 1.67 1.78 1.77 -0.01 77.7 78.7 78.5 -0.22UK 1.41 1.42 1.41 -0.01 78.7 78.8 78.7 -0.10Euro16 11.24 11.14 11.13 -0.01 85.8 85.1 85.0 -0.10Japan 3.73 3.56 3.43 -0.13 80.4 76.5 73.9 -2.60
Sources: OPEC statistics; Argus; Euroilstock Inventory Report; IEA; EIA/DoE; METI; PAJ
Refinery throughputmb/d
Refinery utilization%
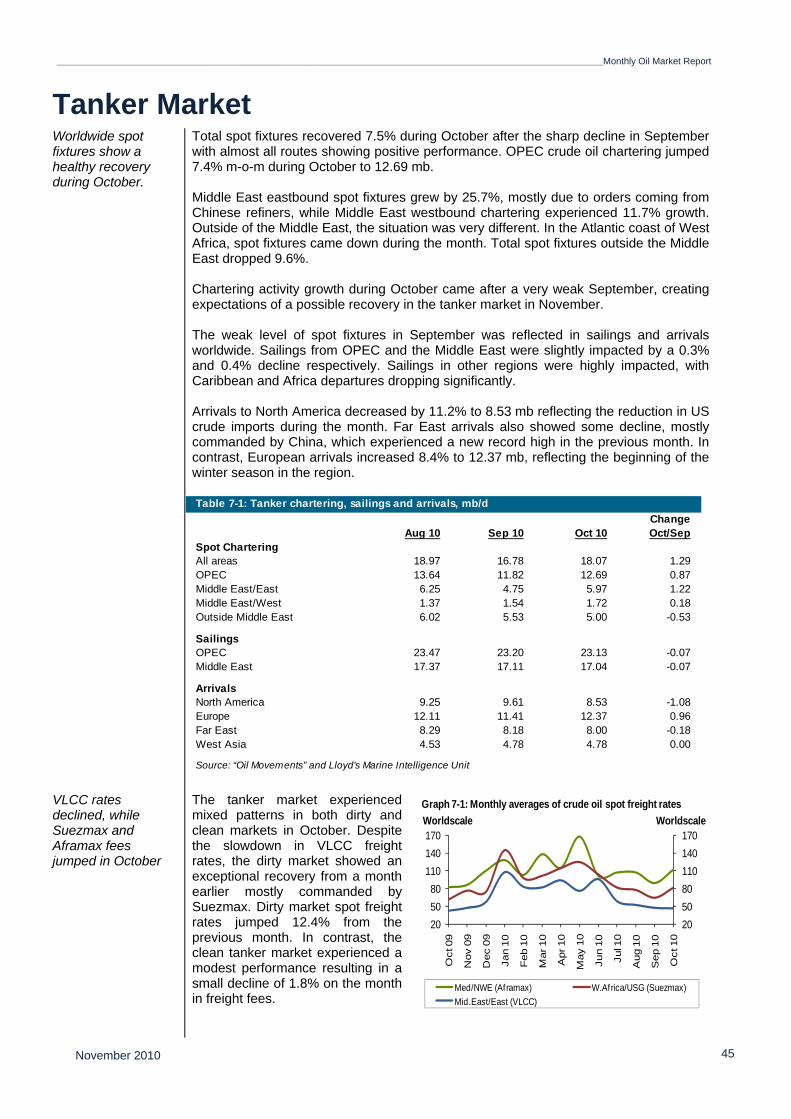
_________________________________________________________________________________________________________________________________________Monthly Oil Market Report
November 2010 45
Tanker Market
Worldwide spot fixtures show a healthy recovery during October.
Total spot fixtures recovered 7.5% during October after the sharp decline in September with almost all routes showing positive performance. OPEC crude oil chartering jumped 7.4% m-o-m during October to 12.69 mb. Middle East eastbound spot fixtures grew by 25.7%, mostly due to orders coming from Chinese refiners, while Middle East westbound chartering experienced 11.7% growth. Outside of the Middle East, the situation was very different. In the Atlantic coast of West Africa, spot fixtures came down during the month. Total spot fixtures outside the Middle East dropped 9.6%. Chartering activity growth during October came after a very weak September, creating expectations of a possible recovery in the tanker market in November. The weak level of spot fixtures in September was reflected in sailings and arrivals worldwide. Sailings from OPEC and the Middle East were slightly impacted by a 0.3% and 0.4% decline respectively. Sailings in other regions were highly impacted, with Caribbean and Africa departures dropping significantly. Arrivals to North America decreased by 11.2% to 8.53 mb reflecting the reduction in US crude imports during the month. Far East arrivals also showed some decline, mostly commanded by China, which experienced a new record high in the previous month. In contrast, European arrivals increased 8.4% to 12.37 mb, reflecting the beginning of the winter season in the region.
VLCC rates declined, while Suezmax and Aframax fees jumped in October
The tanker market experienced mixed patterns in both dirty and clean markets in October. Despite the slowdown in VLCC freight rates, the dirty market showed an exceptional recovery from a month earlier mostly commanded by Suezmax. Dirty market spot freight rates jumped 12.4% from the previous month. In contrast, the clean tanker market experienced a modest performance resulting in a small decline of 1.8% on the month in freight fees.
ChangeAug 10 Sep 10 Oct 10 Oct/Sep
Spot CharteringAll areas 18.97 16.78 18.07 1.29OPEC 13.64 11.82 12.69 0.87Middle East/East 6.25 4.75 5.97 1.22Middle East/West 1.37 1.54 1.72 0.18Outside Middle East 6.02 5.53 5.00 -0.53
SailingsOPEC 23.47 23.20 23.13 -0.07Middle East 17.37 17.11 17.04 -0.07
ArrivalsNorth America 9.25 9.61 8.53 -1.08Europe 12.11 11.41 12.37 0.96Far East 8.29 8.18 8.00 -0.18West Asia 4.53 4.78 4.78 0.00
Table 7-1: Tanker chartering, sailings and arrivals, mb/d
Source: “Oil Movements” and Lloyd's Marine Intelligence Unit
20
50
80
110
140
170
20
50
80
110
140
170
Oct 0
9
Nov 0
9
Dec 0
9
Jan 1
0
Feb 1
0
Mar 10
Apr 10
May 1
0
Jun 1
0
Jul 1
0
Aug 1
0
Sep 1
0
Oct 1
0
WorldscaleWorldscale
Med/NWE (Aframax) W.Africa/USG (Suezmax)
Mid.East/East (VLCC)
Graph 7-1: Monthly averages of crude oil spot freight rates

Monthly Oil Market Report_________________________________________________________________________________________________________________________________________
November 2010 46
In the dirty market, VLCC spot freight rates came down 2.9% in October from the previous month to 44WS, the lowest since November 2009. The decrease in floating storage liberated a significant amount of tonnage that was added to the oversupply of tonnage already available in the market the previous month causing a drop in rates. Owners were moving to different routes looking for better options, nevertheless over-tonnage kept freight fees at low levels during the three first weeks of the month, while a slight recovery was experienced in the last week. Middle East eastbound rates drifted sideways for most of October, but rose sharply at the month’s end. The route rate averaged 46WS, the lowest since October 2009. An oversupply of vessels resulted in modest fees. After the first week, tanker owners decided to look for other options and moved to Atlantic routes, but the Atlantic market was saturated immediately, requiring the owners to return to their habitual routes. Middle East westbound VLCC routes also showed negative performance, the rates being 5.6% lower than the previous month. Similar conditions were experienced on the Middle East eastbound route with some decrease recorded at the end of the month. West Africa eastbound rates dropped 1.9% from September. Despite the significant increase showed on Suezmax routes, this route did not show much improvement during the month and the upward sentiment seen after the first week was offset by the down during the following weeks. Suezmax market rates showed a sharp increase of 24.8% to 78WS. During the first and second week positive sentiment pushed the market up as limited tonnage availability, decent cargo interest and a bullish sentiment by owners contributed to rate increases. West Africa to US Gulf Coast and Northwest Europe to US rates showed similar behavior. During the first two weeks, a significant increase was experienced, but then the rates curved downward partly due to a decline in cargo inquiries. US crude imports fell during October reflecting this phenomenon. West Africa to US Gulf Coast route rates increased 26.6% on the month to 81WS and Northwest Europe to US Gulf Coast rates grew by 23% to 75WS. The Aframax market also showed some positive performance with freight rates growing 11.6% m-o-m in October to 104WS. Despite the general increase, the Aframax market showed mixed patterns during the month, with some increases on European routes and decreases in other regions. Indonesia eastbound rates experienced a decline of 3.2% and a similar reaction was recorded on the Caribbean to US East Coast route with a 6.8% decline on rates. High tonnage available and modest cargo requirements were the core reasons for the drop. On the other hand, inter-Mediterranean freight rates grew 34.5% m-o-m in October and Mediterranean to Northwest Europe grew 25.8%. In both cases the increase experienced during the first half of the month was partly attributed to the French Mediterranean port strike during the first days of the month, as many ships were stuck in Fos Lavera obligating the owners to push for extra points for their vessels with “safe” positions. High activity in the Mediterranean also contributed to pushing up freight rates.

_________________________________________________________________________________________________________________________________________Monthly Oil Market Report
November 2010 47
Clean spot freight experienced mixed patterns with drops in East of Suez routes and increases in West of Suez
Clean market spot freight rates also showed mixed patterns with eastbound rates dropping and Mediterranean rates rising. On average, the clean tanker rates came down by 1.8% to 139WS – the 4.4% increase seen on rates in the West of Suez were not enough to offset the 14.4% decline in rates East of Suez. Middle East eastbound rates fell 21.3% m-o-m in October as a result of the increase in refining activities in China, Singapore eastbound rates also experienced a decline of 7.3%. Increasing activity in Chinese and Indian refineries are impacting freight rates and the product market in general in East of Suez. This is also reflected on the Middle East eastbound rates, which were the only route with y-o-y decline. In October, freight rates on this route were 4% lower than in the same month last year. Product vessel rates from the Caribbean to US Gulf Coast increased 4.9%, helping to offset the domestic slowdown in refining activities, nevertheless freight rates from Northwest Europe to the US decreased by 2.2% m-o-m in October reflecting high tonnage availability on the route. Inter-Mediterranean freight rates grew 7.8% m-o-m in October and Mediterranean routes to Northwest Europe increased by 7.2%. As in the dirty market, in both cases the increase experienced during the first half of the month was partly attributed to the French Mediterranean port strike during the first days of the month. High activity in the region was also seen.
Size Change1,000 DWT Aug 10 Sep 10 Oct 10 Oct/Sep
CrudeMiddle East/East 230-280 52 47 46 -1Middle East/West 270-285 41 36 34 -2West Africa/East 260 56 53 52 -1West Africa/US Gulf Coast 130-135 77 64 81 17NW Europe/USEC-USGC 130-135 77 61 75 14Indonesia/US West Coast 80-85 101 93 90 -3Caribbean/US East Coast 80-85 115 103 96 -7Mediterranean/Mediterranean 80-85 108 87 117 30Mediterranean/North-West Europe 80-85 107 89 112 23
Table 7-2: Spot tanker crude freight rates, Worldscale
Source: Galbraith’s Tanker Market Report and Platt's
Size Change1,000 DWT Aug 10 Sep 10 Oct 10 Oct/Sep
ProductsMiddle East/East 30-35 162 141 111 -30Singapore/East 30-35 145 137 127 -10Caribbean/US Gulf Coast 38-40 168 163 171 8NW Europe/USEC-USGC 33-37 148 139 136 -3Mediterranean/Mediterranean 30-35 160 128 138 10Mediterranean/North-West Europe 30-35 170 138 148 10
Source: Galbraith’s Tanker Market Report and Platt's
Table 7-3: Spot tanker product freight rates, Worldscale
50
100
150
200
250
50
100
150
200
250
Oct 0
9
Nov 0
9
Dec 0
9
Jan 1
0
Feb 1
0
Mar 10
Apr 10
May 1
0
Jun 1
0
Jul 1
0
Aug 1
0
Sep 1
0
Oct 1
0
WorldscaleWorldscale
Mid.East/East Caribs/USG
NWE./USEC-USG Med/Med
Graph 7-2: Monthly averages of clean spot freight rates

Monthly Oil Market Report_________________________________________________________________________________________________________________________________________
November 2010 48
Oil Trade USA US crude oil imports fell in October due to low refining runs
According to preliminary data, US crude oil imports dropped 3.9% m-o-m in October to 8.7 mb/d, but increased 1.6% compared to same month last year. The monthly decline was partly occasioned by the stop of operations on the line 6A of the Enbridge pipeline due to a defect found during the planned integrity inspection. The slowdown in domestic demand and the cut in refining runs also contributed to the drop in US crude oil imports. In the period January-October, US crude oil imports averaged 9.28 mb/d, up 1.7% from the same period last year. Crude oil imports in the US have experienced mixed patterns in 2010 with y-o-y drops during January–March and also in September resulting in an annual moderate increase which reflects the modest economic recovery. US product imports in October remained almost at the same level from September, only 1 tb/d higher; nevertheless, compared to the same month last year, product imports jumped 6.3% to 2.46 mb/d. Gasoline imports declined 4% or 33.7 tb/d on the month to 814 tb/d, reflecting the natural seasonal decline before the beginning of winter. Jet fuel imports declined sharply by 50.1% m-o-m to 56.6 tb/d, reflecting a slowdown in national and international flights. Fuel oil imports dropped 6% to 497 tb/d, mostly due to lower refining runs. On the other hand, propane imports jumped 67.2% and other products increased 7.9% offsetting the decrease in imports shown in gasoline, jet fuel and fuel oil. Year-to-date, US product imports averaged 2.58 mb/d or 6.1% less than in the same period last year.
Despite the slowdown in refining runs, US product exports increased by just 0.5% m-o-m in October to 2.15 mb/d, reflecting reduced domestic demand. Fuel oil exports remained almost at the same level as in September, recording 1.14 mb/d or just 0.2% less than the previous month. Gasoline exports dropped 2% in October to 204 tb/d from a month earlier. Propane and propylene exports also dropped by 1.3% to 78 tb/d. In contrast, jet fuel exports increased 5.6%, while imports of the Other Products category grew by 2.2%. The increase of these products exports offset the decrease in exports of propane, fuel oil and gasoline. From January to October in the current year, product exports averaged 2.19 mb/d or 10.1% more than during the same period last year, mostly due to higher refining run rates as well as global oil demand recovery
0
2
4
6
8
10
12
0.0
1.0
2.0
3.0
4.0
5.0
Oct
09
Nov
09
Dec
09
Jan
10
Feb
10
Mar
10
Apr
10
May
10
Jun
10
Jul 1
0
Aug
10
Sep
10
Oct
10
mb/dmb/d
Others* Propane/Propylene Gasoline Jet fuel/Kerosene Fuel oil Crude (RHS)
Graph 8-1: US imports of crude and petroleum products
*Others: Contains natural gas liquids, liquefied refinery gases (LRG's), other liquids and all finished petroleum productsexcept gasoline, jet fuel/kerosene, fuel oil and propane/propylene

_________________________________________________________________________________________________________________________________________Monthly Oil Market Report
November 2010 49
As a result, US net crude imports fell 356 tb/d m-o-m to 8.67 mb/d and net products imports dropped 3% to 303 tb/d. Together, US net crude oil and product imports averaged 8.97 mb/d in October, down 3.92% compared to a month earlier.
According to official data, US crude oil imports from OPEC recorded 4.69 mb/d in August or 2.3% lower than the previous month, but 10.9% more than the same month a year earlier. OPEC crude supply shared 49.46% of total crude imports during the month. Canada remained the top supplier of crude to the US in August with 1.93 mb/d or 5.9% less than the previous month, followed by Mexico, the second top supplier, with 1.16 mb/d or 1.4% down on the month. US crude imports from Saudi Arabia recorded 1.08 mb/d, as a result, the Kingdom was the third top crude supplier to the US, but the number one among OPEC Members. Crude imports from Saudi Arabia grew 4.5% m-o-m in October, but were not enough to overtake Mexico. Venezuela is next on the list with 974 tb/d or 4.1% down from September, just followed by Nigeria which recorded a 17.6% cut on its exports to US to 942 tb/d, Angola and Algeria were next with 472 tb/d and 374 tb/d. Russia exports to the US experienced a decline for the second month in a row, 9% down m-o-m in October to 334 tb/d. US crude oil imports from Iraq, Kuwait, Ecuador and Libya were also recorded during October. US product exports to OPEC Members reached 156 tb/d from a total of 2.33 mb/d in October, up 25.8% compared to the previous month. Ecuador imported 106 tb/d or 39.5% more than the previous month, while Venezuela imported 46 tb/d. US product imports from OPEC averaged 390 tb/d or 13.7% of total product imports. Canada was the top supplier of products during August with 550 tb/d, followed by Russia with 453 tb/d. Among OPEC Member Countries, Algeria was the top supplier of products to US with 191 tb/d in August.
Japan Japanese crude imports from Russia in September jumped three-fold from a year ago.
According to preliminary official data, Japan imported 3.45 mb/d of crude oil in September, down 4.1% from August, but 5.2% higher than a year ago, becoming the third consecutive month with a y-o-y gain. The monthly decrease reflects lower refining runs on the month. From January to September this year, Japanese crude oil imports averaged 3.66 mb/d or 1.6% up from the same period last year. Crude imports in February and June offset the yearly growth during other months.
0
50
100
150
200
0
500
1000
1500
2000
2500
Oct
09
Nov
09
Dec
09
Jan
10
Feb
10
Mar
10
Apr
10
May
10
Jun
10
Jul 1
0
Aug
10
Sep
10
Oct
10
tb/dtb/d
Others* Propane/Propylene Gasoline Jet fuel/Kerosene Fuel oil Crude (RHS)
*Others: Contains natural gas liquids, liquefied refinery gases (LRG's), other liquids and all finished petroleum productsexcept gasoline, jet fuel/kerosene, fuel oil and propane/propylene
Graph 8-2: US exports of crude and petroleum products
ChangeAug 10 Sep 10 Oct 10 Oct/Sep
Crude oil 9,450 9,023 8,667 -356Total products 523 313 303 -9Total crude and products 9,973 9,336 8,970 -366
Table 8-1: US crude and product net imports, tb/d

Monthly Oil Market Report_________________________________________________________________________________________________________________________________________
November 2010 50
OPEC crude oil exports to Japan dropped 1.0% in September y-o-y to 2.76 mb/d and constituted 80.1% of total oil imports in Japan. Crude imports from OPEC were 7% down from August. Saudi Arabia remained the top crude supplier, accounting for 28.5% of Japan’s total imports in September. The Kingdom exported 0.1% less crude to Japan from the same month last year at 981 tb/d. Imports from the UAE retained second place despite the 1.8% drop from a year earlier reaching 707 tb/d, while Iran jumped 17% y-o-y to 367 tb/d as the third-largest crude supplier to Japan for that month. Russia crude exports to Japan during September grew to almost three times the amount exported during the same month last year, reaching 327 tb/d. As a result, Russia remained the fourth-largest crude oil supplier; Russia is the only non-OPEC country among the seven most important suppliers of crude for Japan in the month, followed by Qatar, Kuwait and Iraq. Japan’s appetite for the ESPO crude increased 55% in September, compared to the previous month, reaching 149 tb/d, the highest ever recorded.
Japan’s product imports decreased 4% y-o-y in September to 494 tb/d, declining significantly by 15.4% from a month earlier. The sharp drop of product imports is partly attributed to a slowdown in demand due to the end of the summer season as well as higher runs in Japanese refineries. Product exports were also down by 9.9% m-o-m in September and down 3.3% from the same month last year, reaching 625 tb/d. The increase in refining activity and the decrease in domestic demand were not enough to offset the seasonal decline in exports.
0
1
2
3
4
5
-100
100
300
500
700
900
1100
Sep
09
Oct
09
Nov
09
Dec
09
Jan
10
Feb
10
Mar
10
Apr
10
May
10
Jun
10
Jul 1
0
Aug
10
Sep
10
mb/dtb/d
Others* LPG Naphtha Fuel oil Crude (RHS)
Graph 8-3: Japan's imports of crude and petroleum products
*Others: Contains gasoline, jet fuel, kerosene, gasoil, asphalt and paraffin wax
0100200300400500600700800
0100200300400500600700800
Sep
09
Oct
09
Nov
09
Dec
09
Jan
10
Feb
10
Mar
10
Apr
10
May
10
Jun
10
Jul 1
0
Aug
10
Sep
10
tb/dtb/d
Fuel oil Gasoil Jet fuel Others*
Graph 8-4: Japan's exports of petroleum products
*Others: Contains LPG, gasoline, naphtha, kerosene, lubricating oil, asphalt and paraffin wax
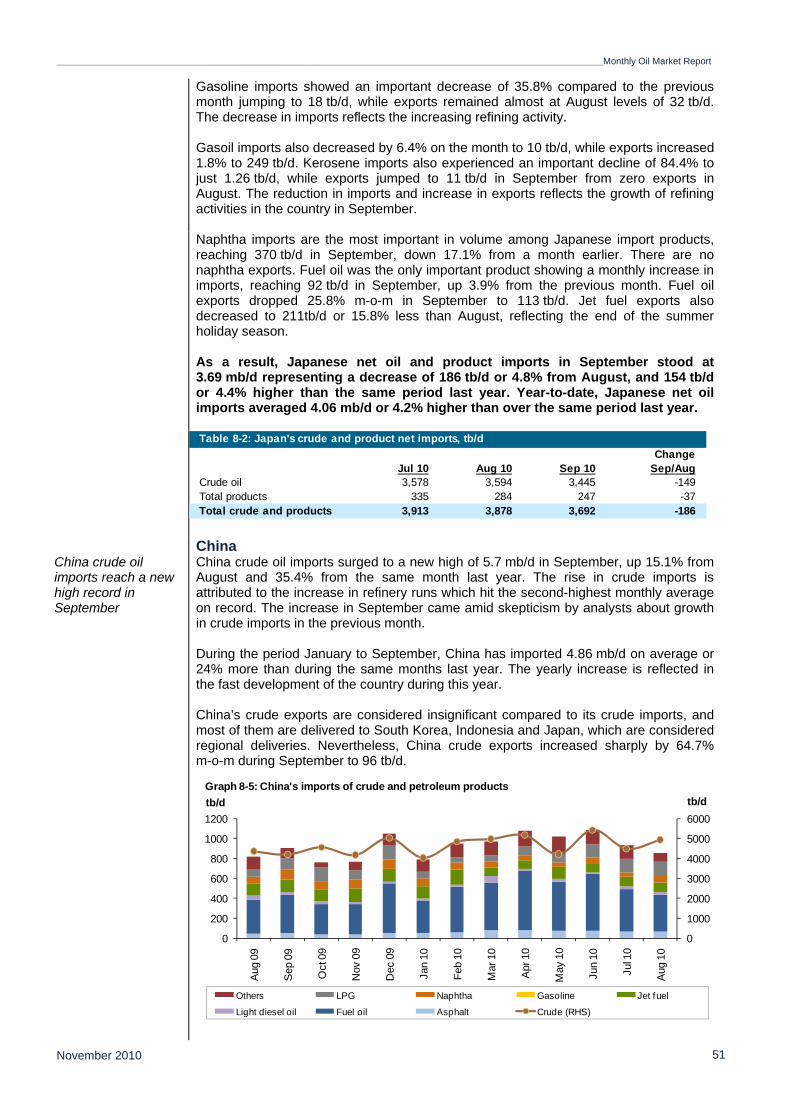
_________________________________________________________________________________________________________________________________________Monthly Oil Market Report
November 2010 51
Gasoline imports showed an important decrease of 35.8% compared to the previous month jumping to 18 tb/d, while exports remained almost at August levels of 32 tb/d. The decrease in imports reflects the increasing refining activity. Gasoil imports also decreased by 6.4% on the month to 10 tb/d, while exports increased 1.8% to 249 tb/d. Kerosene imports also experienced an important decline of 84.4% to just 1.26 tb/d, while exports jumped to 11 tb/d in September from zero exports in August. The reduction in imports and increase in exports reflects the growth of refining activities in the country in September.
Naphtha imports are the most important in volume among Japanese import products, reaching 370 tb/d in September, down 17.1% from a month earlier. There are no naphtha exports. Fuel oil was the only important product showing a monthly increase in imports, reaching 92 tb/d in September, up 3.9% from the previous month. Fuel oil exports dropped 25.8% m-o-m in September to 113 tb/d. Jet fuel exports also decreased to 211tb/d or 15.8% less than August, reflecting the end of the summer holiday season. As a result, Japanese net oil and product imports in September stood at 3.69 mb/d representing a decrease of 186 tb/d or 4.8% from August, and 154 tb/d or 4.4% higher than the same period last year. Year-to-date, Japanese net oil imports averaged 4.06 mb/d or 4.2% higher than over the same period last year.
ChinaChina crude oil imports reach a new high record in September
China crude oil imports surged to a new high of 5.7 mb/d in September, up 15.1% from August and 35.4% from the same month last year. The rise in crude imports is attributed to the increase in refinery runs which hit the second-highest monthly average on record. The increase in September came amid skepticism by analysts about growth in crude imports in the previous month. During the period January to September, China has imported 4.86 mb/d on average or 24% more than during the same months last year. The yearly increase is reflected in the fast development of the country during this year. China’s crude exports are considered insignificant compared to its crude imports, and most of them are delivered to South Korea, Indonesia and Japan, which are considered regional deliveries. Nevertheless, China crude exports increased sharply by 64.7% m-o-m during September to 96 tb/d.
ChangeJul 10 Aug 10 Sep 10 Sep/Aug
Crude oil 3,578 3,594 3,445 -149Total products 335 284 247 -37Total crude and products 3,913 3,878 3,692 -186
Table 8-2: Japan's crude and product net imports, tb/d
0
1000
2000
3000
4000
5000
6000
0
200
400
600
800
1000
1200
Aug
09
Sep
09
Oct
09
Nov
09
Dec
09
Jan
10
Feb
10
Mar
10
Apr
10
May
10
Jun
10
Jul 1
0
Aug
10
tb/dtb/d
Others LPG Naphtha Gasoline Jet fuel
Light diesel oil Fuel oil Asphalt Crude (RHS)
Graph 8-5: China's imports of crude and petroleum products
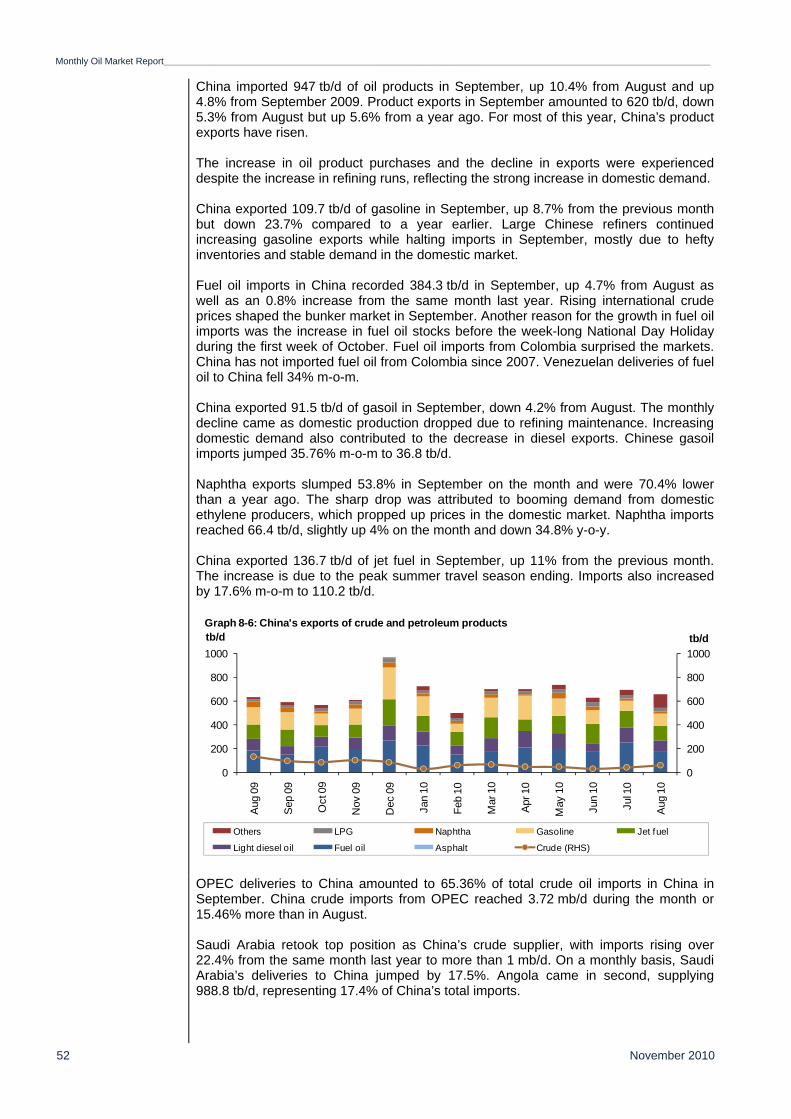
Monthly Oil Market Report_________________________________________________________________________________________________________________________________________
November 2010 52
China imported 947 tb/d of oil products in September, up 10.4% from August and up 4.8% from September 2009. Product exports in September amounted to 620 tb/d, down 5.3% from August but up 5.6% from a year ago. For most of this year, China’s product exports have risen. The increase in oil product purchases and the decline in exports were experienced despite the increase in refining runs, reflecting the strong increase in domestic demand. China exported 109.7 tb/d of gasoline in September, up 8.7% from the previous month but down 23.7% compared to a year earlier. Large Chinese refiners continued increasing gasoline exports while halting imports in September, mostly due to hefty inventories and stable demand in the domestic market. Fuel oil imports in China recorded 384.3 tb/d in September, up 4.7% from August as well as an 0.8% increase from the same month last year. Rising international crude prices shaped the bunker market in September. Another reason for the growth in fuel oil imports was the increase in fuel oil stocks before the week-long National Day Holiday during the first week of October. Fuel oil imports from Colombia surprised the markets. China has not imported fuel oil from Colombia since 2007. Venezuelan deliveries of fuel oil to China fell 34% m-o-m. China exported 91.5 tb/d of gasoil in September, down 4.2% from August. The monthly decline came as domestic production dropped due to refining maintenance. Increasing domestic demand also contributed to the decrease in diesel exports. Chinese gasoil imports jumped 35.76% m-o-m to 36.8 tb/d. Naphtha exports slumped 53.8% in September on the month and were 70.4% lower than a year ago. The sharp drop was attributed to booming demand from domestic ethylene producers, which propped up prices in the domestic market. Naphtha imports reached 66.4 tb/d, slightly up 4% on the month and down 34.8% y-o-y. China exported 136.7 tb/d of jet fuel in September, up 11% from the previous month. The increase is due to the peak summer travel season ending. Imports also increased by 17.6% m-o-m to 110.2 tb/d.
OPEC deliveries to China amounted to 65.36% of total crude oil imports in China in September. China crude imports from OPEC reached 3.72 mb/d during the month or 15.46% more than in August. Saudi Arabia retook top position as China’s crude supplier, with imports rising over 22.4% from the same month last year to more than 1 mb/d. On a monthly basis, Saudi Arabia’s deliveries to China jumped by 17.5%. Angola came in second, supplying 988.8 tb/d, representing 17.4% of China’s total imports.
0
200
400
600
800
1000
0
200
400
600
800
1000
Aug
09
Sep
09
Oct
09
Nov
09
Dec
09
Jan
10
Feb
10
Mar
10
Apr
10
May
10
Jun
10
Jul 1
0
Aug
10
tb/dtb/d
Others LPG Naphtha Gasoline Jet fuel
Light diesel oil Fuel oil Asphalt Crude (RHS)
Graph 8-6: China's exports of crude and petroleum products

_________________________________________________________________________________________________________________________________________Monthly Oil Market Report
November 2010 53
China crude imports from Iran jumped by 29.96% to 597.8 tb/d while imports from Iraq grew 42.49% m-o-m to 344.78 tb/d. Other significant increases came from Sudan, Kazakhstan and Congo. Russian shipments moved up 4.8% m-o-m and imports from Venezuela were down 27.2% to 81.5 tb/d. Libyan deliveries of crude oil to China also declined by 18.3% on the month to 129.4 tb/d. China’s net oil imports reached 5.9 mb/d in September, up 16.4% from August and 33.8% higher than the same month in 2009. The year-to-date average for net oil imports currently stands at 5.1 mb/d, 18.6% higher than the same period last year.
India India’s crude oil imports fell 3.5% y-o-y in September amid weak domestic demand
India’s crude oil imports fell 3.5% in September from the same month last year, according to preliminary data. On a monthly basis, Indian crude oil imports were boosted by 8.6% m-o-m to 2.67 mb/d. The monthly growth came despite the drop in domestic product sales, resulting in higher crude stocks in the country and reflecting the interest of market players to store crude due to expectations of higher prices during the third quarter of the year. From January to September during this year, India’s crude oil imports averaged 2.93 mb/d or 8.5% up from the same period last year. The increase is partly attributed to the expansion of domestic refining activities as well as to stronger domestic demand for products. Product imports increased 31.6% during September compared to the same month last year, reaching 321 tb/d on the month. Indian product imports experienced growth of 5%. In contrast, product exports dropped 7.3% y-o-y in September to 548 tb/d and decreased by 7.4% compared to August. The drop experienced in product exports and the increase in imports were the result of the refining maintenance season in India. Indian product exports year-to-date have averaged 819 tb/d or up 36.8% compared to the same period last year. Product imports have also increased 8.3% during the same period to 347 tb/d. Increasing refining capacity as well as strong domestic demand have driven the increase in both imports and exports of products.
ChangeJul 10 Aug 10 Sep 10 Sep/Aug
Crude oil 4,452 4,884 5,594 710Total products 246 203 327 124Total crude and products 4,698 5,087 5,921 834
Table 8-3: China's crude and product net imports, tb/d
0
500
1,000
1,500
2,000
2,500
3,000
3,500
4,000
0
100
200
300
400
500
600
700
Sep
09
Oct
09
Nov
09
Dec
09
Jan
10
Feb
10
Mar
10
Apr
10
May
10
Jun
10
Jul 1
0
Aug
10
Sep
10
tb/dtb/d
Others LPG Naphtha Gasoline Kerosene Gasoil Fuel oil Crude (RHS)
Graph 8-7: India's imports of crude and petroleum products

Monthly Oil Market Report_________________________________________________________________________________________________________________________________________
November 2010 54
Diesel imports continued the downward trend, down 85.2% in September compared to August, partly due to poor power outages and seasonal rainfall cutting demand for the fuel from farms and industrial sectors; but compared to the same month last year, diesel imports remained at the same level, reflecting a normal seasonal cut in imports. On the other hand, diesel exports grew 27.6% on the month to 104.4 tb/d; nevertheless, y-o-y gasoil exports slumped 77.4%. Indian imports of gasoline were 3.3% up in September from the previous month to 34.8 tb/d, while exports decreased 25.6% to 101.6 tb/d. The decrease in gasoline exports reflects the end of the driving season in the northern hemisphere. Compared to the same month last year, gasoline exports dropped 47.1% as a consequence of increasing domestic consumption. Gasoline imports in September 2009 were almost zero.
LPG imports dropped 12.8% m-o-m to 67.12 tb/d, and naphtha imports decreased 25.6% to 44.75 tb/d. Kerosene imports jumped up to 44.75 tb/d after no imports a month earlier, while naphtha exports slumped 14.5% m-o-m to 139.8 tb/d. Indian fuel oil imports increased slightly by 3.3% to 17.4 tb/d, and exports dropped 20.9% to 106.0 tb/d. India’s net oil and product imports reached 2.45 mb/d in September, up 12.4% from August and just 0.9% over the average a year earlier. During the period January-September this year the average net oil and product imports was 2.45 mb/d, or 1.5% more than in the same period last year.
FSU FSU crude oil exports in September slipped to the lowest level since 2008.
FSU crude exports slipped 6.8% on the month in September to 6.36 mb/d, the lowest level since November 2008. Compared to the same month last year, the decline was 4.9%. The slump reflects reduced Russian Pipeline (Transneft) exports resulting from higher export duty as well as the halt in Tengiz loadings at Odessa. Year-to-date crude exports from the FSU region reached an average of 7.57 mb/d, an increase of 14.4% from the same period last year. Russian pipeline exports fell to 3.79 mb/d in September from 4.07 mb/d in August, the lowest level since February. Producers used up the bulk of their export quota during July and August because of a lower export duty rate, which increased in September reducing the incentive to export.
0
200
400
600
800
1000
1200
1400
0
200
400
600
800
1000
1200
1400
Sep
09
Oct
09
Nov
09
Dec
09
Jan
10
Feb
10
Mar
10
Apr
10
May
10
Jun
10
Jul 1
0
Aug
10
Sep
10
tb/dtb/d
Fuel oil Gasoil Jet fuel Gasoline Naphtha Others
Graph 8-8: India's exports of petroleum products
ChangeJul 10 Aug 10 Sep 10 Sep/Aug
Crude oil 3,128 2,461 2,673 212Total products -776 -286 -228 59Total crude and products 2,352 2,175 2,445 270
Table 8-4: India's crude and product net imports, tb/d

_________________________________________________________________________________________________________________________________________Monthly Oil Market Report
November 2010 55
Exports of Urals crude from the Black Sea ports fell considerably, triggering record-high differentials in the Mediterranean and 14-year highs in Northwest Europe. From the Ukraine port of Pivdenne, crude oil exports declined by 94.8% compared to August reaching 4,800 b/d. Exports at Novorossiysk port in the Ukraine also fell, although less dramatically. In the Mediterranean region, Urals exports to the Black Sea Refineries were delivered normally, but smaller volumes went to Morocco and Israel. In the Baltic region, Urals exports to North America fell significantly; just one cargo was delivered in September down from five in August. Exports shipped to Italy also declined; nevertheless, new routes to Northwest Europe offset the decline. Tengiz exports from Odessa slumped, commanded by maintenance at the Kazakh field. Nevertheless, larger volumes of Tengiz went into the CPC Blend, also showing reduced exports despite the additional Tengiz supplies. Kazakh exports to Gdansk also slumped from the previous month. Crude exports through the Druzhba pipeline increased considerably, partially offsetting the decline in Urals exports. Shipments to Poland increased by 13.3% on the month reflecting the high prices for seaborne Urals. Exports to other destinations along the Druzhba also rose. BTC blend exports dropped in September from August. BTC blend was shipped as far as Thailand, Morocco, Indonesia and Korea, but most of the crude remained in Europe. FSU product exports declined by 5.1% in September to 2.68 mb/d from a month earlier. Only gasoline and vacuum gasoil (VGO) experienced some increase, while naphtha remained at similar levels and other product exports declined. The decline is attributed to refinery maintenance in Russia as well as the fact that sellers were holding products until October when the country’s product export duty was reduced. Product exports by river were also impacted by bad weather conditions. Northbound shipments along the Volga-Baltic route through St. Petersburg were impacted by storms in the Gulf of Finland, which disrupted the transfer of products from river tankers to floating storage vessels. Shipments to the Black Sea were also down after the maximum permissible tanker draught was reduced because of rainfall and difficult wind conditions. Fuel oil exports dropped by 8.3% to 1.27 mb/d, due to higher domestic demand, and utilities are starting to stock-up ahead of the heating season. Supplies to Estonia’s Tallinn slumped 6% after the Kirishi refinery, which started maintenance at the primary crude distillation unit in the beginning of September. Fuel oil exports along St. Petersburg fell by 7.5%. The Nizhnekamsk refinery cut supplies to the port after starting maintenance season. Gasoil and diesel exports declined in September to the lowest level in 2 years. Moscow refinery recorded the sharpest reduction with around 240 tb/d cut in response to maintenance. Diesel and gasoil exports through the Transnefteprodukt (TNP) pipeline are expected to increase during October. During the first nine months of the year, product exports from the FSU averaged 2.85 mb/d, a decrease of 1.2% compared to the same period last year. The small decline reflects the impact of the last month on the yearly average.

Monthly Oil Market Report_________________________________________________________________________________________________________________________________________
November 2010 56
2008 2009 1Q10 2Q10 3Q10 Aug 10 Sep 10*Crude
Russian pipeline Black Sea 1,248 1,201 1,027 976 1,038 1,084 842 Baltic 1,559 1,577 1,526 1,629 1,530 1,593 1,450 Druzhba 1,077 1,112 1,123 1,091 1,155 1,087 1,185 Kozmino n.a. n.a. 0 323 320 307 320Total 3,905 3,922 3,932 4,019 4,043 4,071 3,797
Other routes Russian rail 283 280 364 324 331 394 282 Russian-Far East 220 283 293 296 204 157 233 Kazakh rail 17 18 18 18 6 0 0 Vadandey 20 155 163 167 150 138 142 Kaliningrad 0 0 21 22 24 26 16 CPC 675 736 736 732 755 782 732 BTC 648 805 679 809 812 842 779 Kenkiyak-Alashankou 121 157 205 200 205 208 208 Caspian 185 281 296 271 195 205 177
6,089 6,653 6,711 6,858 6,726 6,826 6,364
ProductsGasoline 210 229 215 155 127 100 145Naphtha 217 273 273 270 289 277 278Jet 37 52 27 31 23 32 17Gasoil 810 949 976 892 822 850 743Fuel oil 1,069 1,114 1,445 1,312 1,331 1,382 1,267VGO 196 233 238 287 232 179 228Total 2,539 2,850 2,790 2,947 2,824 2,820 2,677
8,628 9,503 9,493 9,805 9,542 9,642 9,041
Table 8-5: Recent FSU exports of crude and products by source, tb/d
Total crude exports
Total oil exports
* PreliminaryTotals may not add due to independent rounding
Source:Nefte Transport, Global Markets, Argus Fundamentals,Argus FSU and OPEC

_________________________________________________________________________________________________________________________________________Monthly Oil Market Report
November 2010 57
Stock Movements
USA US commercial stocks fell by 11.6 mb in October, but remained 107 mb above the five-year average
US commercial inventories at the end of October declined 11.6 mb reversing the revised build of 8.2 mb the month before. Crude and product stocks moved in opposite directions as crude oil stocks built 7.2 mb, while products saw a substantial drop of 18.8 mb. Despite this drop, US commercial inventories stood at 27.2 mb or 2.5% above a year ago and remained at a comfortable level, representing a surplus of 107 mb or 10.5% with the five-year average. With the revised monthly data, US commercial inventories in October showed the first drop since the 2.8 mb decline in February 2010. At the end of October, US crude stocks rose by 7.2 mb for the third consecutive month to stand at the highest level since May 2009. The build was driven by lower utilization rates as US crude oil refinery input declined by 210 tb/d to 13.9 mb/d, but remained at almost the same level as a year ago. This level corresponds to a refinery utilization rate of 81.8%, 1.3 percentage points lower than the previous month. Refiners are operating at their lowest level in just over eight months, but with refinery turnaround in the US coming to end and units coming on stream, refiners are expected to increase runs and US crude stocks may begin to ease. However, the build in October was limited by a sharp drop in crude oil imports, which fell over 600 tb/d to average 8.7 mb/d, but still remained above a year ago. Cushing inventories continued to slide, falling 1.6 mb mb to 33.5 mb. Despite the continued build in US crude oil stocks, crude oil prices recently rose to a two-year high, indicating that factors outside fundamentals are behind the recent increase in crude oil prices.
In contrast to the continued build in crude, total product stocks fell to 759.2 mb for the first time in six consecutive months of builds. This draw was driven by the fall in gasoline and distillates and to a lesser extent to jet fuel. Despite this draw, total product stocks remained healthy at 53 mb or 7.4% above the five-year average, but stood slightly 1.1% below a year ago at the same time. US gasoline stocks fell 7.7 mb to 212.3 mb as refineries cut crude runs and gasoline production declined. US gasoline demand remained relatively strong. Although falling back from the strong spike of 9.3 mb/d seen in the week ending 22 October, gasoline consumption stabilized at a level consistent with the seasonal trend at 9.0 mb/d. Despite this draw, US gasoline stocks remained at 12 mb or 6% above the seasonal norm and are slightly above a year earlier. The drop of 7.6 mb in middle distillate stocks could be attributed to higher exports. In fact, middle distillate stocks arbitrage from the US Gulf Coast to Latin America and Europe is one main factor adding momentum to the drawdown as US distillate production remained higher at 4.2 mb/d, almost 100 tb/d more than the previous month. Improvement in distillate demand averaging 4.0 mb/d also provided some support to the decline in distillate stocks.
260
280
300
320
340
360
380
260
280
300
320
340
360
380
1 4 7 10 13 16 19 22 25 28 31 34 37 40 43 46 49 52
mbmb
Average 04-08 2008 2009 2010
Graph 9-1: US weekly commercial crude oil inventories
Max/Min 04-08
100
110
120
130
140
150
160
170
180
100
110
120
130
140
150
160
170
180
1 4 7 10 13 16 19 22 25 28 31 34 37 40 43 46 49 52
mbmb
Average 04-08 2008 2009 2010
Graph 9-2: US weekly distillate stocks
Max/Min 04-08

Monthly Oil Market Report_________________________________________________________________________________________________________________________________________
November 2010 58
This improvement is not only supported by increasing heating oil consumption, but also by some bullish news of economic growth. Recent economic reports indicate stronger durable goods orders, which would support demand for transportation fuel. At 164.9 mb, total distillate inventories remained at a very comfortable level of 35 mb or 27% above the five-year average. Jet fuel oil stocks also dropped by 1.4 mb to 45.8 mb, while residual fuel oil inventories rose 1.0 mb to 40.6 mb, reflecting lower demand. Both products indicate a surplus of 5.8% and 14% respectively with the five-year average.
Europe Total inventories in Europe rose in October, 6.3 mb above the five-year average
In October, European total oil inventories (EU plus Norway) rose 8.5 mb, reversing the substantial drop in the previous month driven by the build of 10.7 mb in crude, while products abated this build and declined by 2.2 mb. At 1128.4 mb, European inventories stood at 6.3 mb or around 1% above the five-year average, however still remained at 2.8 mb below a year ago at the same time. Crude oil stocks stood at 470.9 mb in October, up from the previous month, but still 5.4 mb or 1.1% below the seasonal norm. However, they remained almost at the same level as a year ago. This build was mainly on the back of weakening refinery runs which declined by nearly 1.0 mb/d to average 10.16 mb/d from a month earlier, and almost 500 tb/d down from October 2009. Strikes in France, which shut down most of the country’s refining system, combined with large scale refinery maintenance in Europe cut crude runs in the EU countries. The weak supply environment in the North Sea also contributed to the decline in the demand for crude. On the product side, gasoline stocks rose just 0.8 mb to stand at 112.7 mb despite supply disruptions. Gasoline inventories remained at 15.8 mb or 12.3% below the five-year average and 6 mb or 5.1% below year earlier. However as French refiners emerge from the strike leading to higher gasoline output combined with weak demand, this should result in a gasoline inventory build in coming weeks. Middle distillates saw the bulk of the drop declining by 1.4 mb to 400.0 mb, but remained at a very comfortable level with a surplus of 25.7 mb or 7% compared to the five-year average, but still 8.9 mb or 2.2% below a year ago at the same period. France alone reported a decline of 2.3 mb in distillate stocks in October, while Germany and other European countries showed a small increase. The improvement of heating oil demand in Europe due to the winter season will result in a further draw in middle distillate stocks. This development may happen even despite the expectation of a strong rebound in refinery output. Residual fuel oil fell by a slight 0.3 mb in October to 117.4 mb, reversing the build occurred last month. This build came despite weak bunker demand in European countries. Fuel oil stocks stood at 6.2 mb above a year ago, but 4.0 mb lower than the historical norm.
ChangeAug 10 Sep 10 Oct 10 Oct 10/Sep 10 Oct 09 05 Nov 10 *
Crude oil 355.4 360.9 368.2 7.2 332.5 364.9
Gasoline 220.8 219.9 212.3 -7.7 211.1 210.3
Distillate fuel 170.4 172.5 164.9 -7.6 171.2 159.9
Residual fuel oil 38.7 39.6 40.6 1.0 35.1 40.4
Jet fuel 47.1 47.2 45.8 -1.4 43.8 45.9
Total 1130.7 1138.9 1127.3 -11.6 1100.1 1115.5
SPR 726.6 726.4 726.6 0.2 725.1 726.6
Table 9-1: US onland commercial petroleum stocks, mb
Source: US Department of Energy’s Energy Information Administration
1060
1080
1100
1120
1140
1160
1180
1060
1080
1100
1120
1140
1160
1180
Jan Feb Mar Apr May Jun Jul Aug Sep Oct Nov Dec
mbmb
Avg. 04-08 2008 2009 2010
Graph 9-3: EU-15 plus Norway's total oil stocks
Max/Min 04-08

_________________________________________________________________________________________________________________________________________Monthly Oil Market Report
November 2010 59
Japan Commercial oil stocks in Japan fell in September, but preliminary data shows a build
In September, commercial oil inventories in Japan fell by 10.6 mb for the second consecutive month to stand at 160.9 mb, a level not seen since March 2010. With this draw, the deficit with the seasonal norm has widened to 20% from 11% a month earlier, while the gap with a year ago remained almost at the same deficit of around 3.5%. The draw in September came from both crude and products which decreased by 8.1 mb and 2.5 mb respectively. At 89.1 mb, crude oil stocks stood at the lowest level since February and decline for the second consecutive month. This strong draw came as result of a decline of 4.1% in crude imports to average 3.45 mb/d, but remained 5.2% above a year ago at the same time. This draw came despite lower refinery runs by 3.9% to 76.5%. With this draw, the deficit with the five-year average increased to 21.5% from 11.2% a month ago; however, crude oil stocks in September remained 3.7% above a year ago. On the product side, Japanese inventories in September also fell 2.5 mb to 71.8 mb, reversing the build occurred over the last two months. The draw could be attributed to the increase of 0.2% in Japanese total oil products sales or 7.3% over a year ago. This represents the third straight month of gains. The rise in total product sales came from the backdrop of relatively low levels a year earlier, when slow recovery from the global financial crisis put a break on demand from the industry sector. Total product stocks ended September at 11.8% below a year ago and 18.4% lower than the five-year average.
Within products, with the exception of fuel oil stocks, all other products saw a decline with the bulk of the draw coming from naphtha stocks declining by 2.2 mb. In fact, the decline in naphtha stocks came from lower output and imports as they fell by 2.4% and 9.7% respectively. At 11.2 mb, naphtha inventories stood at 2.4% above a year ago. Gasoline stocks saw a decline of 0.3 mb to 12.4 mb, reversing the y-o-y surplus seen last month to stand at 8.6% below a year ago. Gasoline stocks remained 1.6% lower than the seasonal norm. The draw in gasoline stocks could be attributed to the decline of 1.3% in production combined with a significance decrease in imports. Gasoline sales, which made up almost a third of total final consumption rose by 6.3% versus a year ago, driven by warmer weather pushing the use of car air-conditioning. Total distillate stocks declined 0.6 mb to 32.3 mb after two consecutive months of a build. Distillate stocks remained 16.3% below a year ago and 36.8% lower than the seasonal norm.
ChangeAug 10 Sep 10 Oct 10 Oct 10/Sep 10 Oct 09
Crude oil 477.3 460.1 470.9 10.7 469.9Mogas 110.8 111.9 112.7 0.8 118.7Naphtha 33.9 34.8 33.4 -1.3 28.6Middle distillates 410.6 401.4 400.0 -1.4 408.9Fuel oils 108.2 111.7 111.4 -0.3 105.2Total products 663.4 659.8 657.5 -2.2 661.4Total 1,140.7 1,119.9 1,128.4 8.5 1,131.2
Table 9-2: Western Europe's oil stocks, mb
Source: Argus, Euroilstock
150
165
180
195
210
225
150
165
180
195
210
225
Jan Feb Mar Apr May Jun Jul Aug Sep Oct Nov Dec
mbmb
Avg. 04-08 2008 2009 2010
Graph 9-4: Japan's commercial oil stocks
Max/Min 04-08
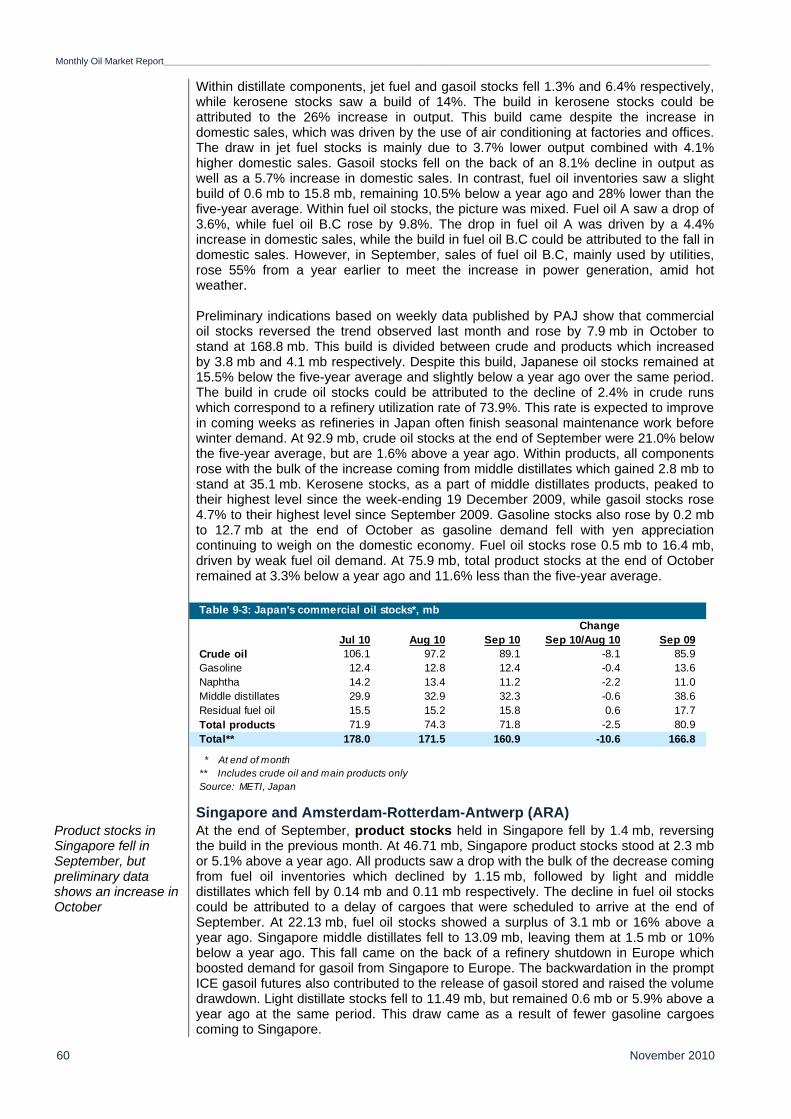
Monthly Oil Market Report_________________________________________________________________________________________________________________________________________
November 2010 60
Within distillate components, jet fuel and gasoil stocks fell 1.3% and 6.4% respectively, while kerosene stocks saw a build of 14%. The build in kerosene stocks could be attributed to the 26% increase in output. This build came despite the increase in domestic sales, which was driven by the use of air conditioning at factories and offices. The draw in jet fuel stocks is mainly due to 3.7% lower output combined with 4.1% higher domestic sales. Gasoil stocks fell on the back of an 8.1% decline in output as well as a 5.7% increase in domestic sales. In contrast, fuel oil inventories saw a slight build of 0.6 mb to 15.8 mb, remaining 10.5% below a year ago and 28% lower than the five-year average. Within fuel oil stocks, the picture was mixed. Fuel oil A saw a drop of 3.6%, while fuel oil B.C rose by 9.8%. The drop in fuel oil A was driven by a 4.4% increase in domestic sales, while the build in fuel oil B.C could be attributed to the fall in domestic sales. However, in September, sales of fuel oil B.C, mainly used by utilities, rose 55% from a year earlier to meet the increase in power generation, amid hot weather. Preliminary indications based on weekly data published by PAJ show that commercial oil stocks reversed the trend observed last month and rose by 7.9 mb in October to stand at 168.8 mb. This build is divided between crude and products which increased by 3.8 mb and 4.1 mb respectively. Despite this build, Japanese oil stocks remained at 15.5% below the five-year average and slightly below a year ago over the same period. The build in crude oil stocks could be attributed to the decline of 2.4% in crude runs which correspond to a refinery utilization rate of 73.9%. This rate is expected to improve in coming weeks as refineries in Japan often finish seasonal maintenance work before winter demand. At 92.9 mb, crude oil stocks at the end of September were 21.0% below the five-year average, but are 1.6% above a year ago. Within products, all components rose with the bulk of the increase coming from middle distillates which gained 2.8 mb to stand at 35.1 mb. Kerosene stocks, as a part of middle distillates products, peaked to their highest level since the week-ending 19 December 2009, while gasoil stocks rose 4.7% to their highest level since September 2009. Gasoline stocks also rose by 0.2 mb to 12.7 mb at the end of October as gasoline demand fell with yen appreciation continuing to weigh on the domestic economy. Fuel oil stocks rose 0.5 mb to 16.4 mb, driven by weak fuel oil demand. At 75.9 mb, total product stocks at the end of October remained at 3.3% below a year ago and 11.6% less than the five-year average.
Singapore and Amsterdam-Rotterdam-Antwerp (ARA) Product stocks in Singapore fell in September, but preliminary data shows an increase in October
At the end of September, product stocks held in Singapore fell by 1.4 mb, reversing the build in the previous month. At 46.71 mb, Singapore product stocks stood at 2.3 mb or 5.1% above a year ago. All products saw a drop with the bulk of the decrease coming from fuel oil inventories which declined by 1.15 mb, followed by light and middle distillates which fell by 0.14 mb and 0.11 mb respectively. The decline in fuel oil stocks could be attributed to a delay of cargoes that were scheduled to arrive at the end of September. At 22.13 mb, fuel oil stocks showed a surplus of 3.1 mb or 16% above a year ago. Singapore middle distillates fell to 13.09 mb, leaving them at 1.5 mb or 10% below a year ago. This fall came on the back of a refinery shutdown in Europe which boosted demand for gasoil from Singapore to Europe. The backwardation in the prompt ICE gasoil futures also contributed to the release of gasoil stored and raised the volume drawdown. Light distillate stocks fell to 11.49 mb, but remained 0.6 mb or 5.9% above a year ago at the same period. This draw came as a result of fewer gasoline cargoes coming to Singapore.
ChangeJul 10 Aug 10 Sep 10 Sep 10/Aug 10 Sep 09
Crude oil 106.1 97.2 89.1 -8.1 85.9Gasoline 12.4 12.8 12.4 -0.4 13.6Naphtha 14.2 13.4 11.2 -2.2 11.0Middle distillates 29.9 32.9 32.3 -0.6 38.6Residual fuel oil 15.5 15.2 15.8 0.6 17.7Total products 71.9 74.3 71.8 -2.5 80.9Total** 178.0 171.5 160.9 -10.6 166.8
Table 9-3: Japan's commercial oil stocks*, mb
Source: METI, Japan
* At end of month** Includes crude oil and main products only

_________________________________________________________________________________________________________________________________________Monthly Oil Market Report
November 2010 61
Preliminary data for the end of October, based on weekly information showed that product inventories in Singapore rose 0.43 mb to 47.14 mb leaving them 1.7 mb or 3.8% above a year ago. Within products, the picture was mixed, light distillates and fuel oil stocks fell 0.7 mb and 0.8 mb respectively, while middle distillates mainly rose strongly by 2 mb. The build in middle distillates was mainly attributed to limited East-West arbitrage trades. However, distillate stocks is expected to fall further in coming months as Chinese plants turned to diesel for power generation. At 15.02 mb, middle distillates stood at 1.4 mb or 10.6% above the previous year at the same period. Light distillates stood at 10.83 mb at the end of October represent a surplus of 5.5% when compared to year earlier, while fuel oil stocks stood at 21.29 mb, 1.3% above a year ago at the same period.
ARA stocks fell slightly in September and preliminary data shows a further decline in October
Product stocks in ARA at the end of September reversed the trend observed last month and fell by 0.3 mb to 38.28 mb. With this draw, products stocks in ARA stood lower than a year ago, showing a deficit of 1.5 mb or 3.8%. The picture was mixed with gasoline, fuel oil and jet fuel seeing a build, while naphtha and gasoil indicated a draw. Gasoil stocks saw a large drop of 2.8 mb to stand at 18.0 mb, representing a deficit of 3.8 mb and 17% versus a year ago. The draw in gasoil stocks came on the back of higher gasoil exports which outpaced imports coming from Norway and Russia. This drop came as the backwardation structure of ICE gasoil futures encouraged more draws from gasoil inventories. Fuel oil stocks rose 1.6 mb to 6.19 mb indicating a surplus of 1.8 mb or 39% versus a year ago. This build could be due to reduced fuel oil exports to ARA. Gasoline inventories rose 0.8 mb to 7.81 mb in the transition to winter grades. Gasoline stocks stood at 1.8 mb or 29% above a year ago. Jet fuel oil stocks also increased 0.34 mb to 5.91 mb as imports coming from France, Norway and UK outpaced exports, mainly to the US. Preliminary data for the end of November based on weekly information shows product stocks in ARA continued to fall for the second consecutive month and declined by nearly 3 mb to stand at 35.3 mb. This draw has widened the deficit with a year ago to 5.4% from 3.8% a month earlier. With the exception of naphtha, all other products experienced draws. The bulk of this drop came from gasoline which declined by 1.6 mb to 6.23 mb, but remained at the same level as a year ago. The draw in gasoline stocks to a year low was influenced by the strike at France’s main oil port of Fos-Lavera. Gasoil stocks also fell 0.9 mb to 17.1 mb, leaving them at 2.9 mb or 13.6% below a year ago over the same period. Jet fuel oil stocks dropped 0.53 mb to 5.7 mb, but remained 0.6 mb or 11.2% above a year ago. On the upside, naphtha rose 0.1 mb to 0.45 mb showing a surplus of 3% compared to a year ago.

Monthly Oil Market Report_________________________________________________________________________________________________________________________________________
November 2010 62
Balance of Supply and Demand Estimate for 2010 Required OPEC crude for 2010 estimated at 28.8 mb/d, down 0.2 mb/d from 2009
Demand for OPEC crude for 2010 has been revised up by 0.3 mb/d to stand at 28.8 mb/d. This revision reflects mainly the upward adjustment in world oil demand as non-OPEC supply figures remained broadly unchanged. The main revision occurred in the third quarter due to actual data. Demand for OPEC crude represents a decline of 0.2 mb/d from the previous year. The first quarter of the year is still showing a drop of 1.0 mb/d while the second quarter is estimated to remain flat. The third quarter is estimated to see a positive growth of 0.7 mb/d while the fourth quarter remained flat.
Forecast for 2011 Demand for OPEC crude in 2011 forecast at 29.2 mb/d, an increase of 0.4 mb/d over the current year
The demand for OPEC for next year is projected to average 29.2 mb/d, showing an upward revision of 0.4 mb/d from the previous assessment. All the quarters saw an upward revision with the bulk of the revision coming in the third quarter, followed by the second. Required OPEC crude is forecasted to increase by 0.4 mb/d following three consecutive annual declines. The bulk of the growth is expected to be seen in the first half of the year indicating an increase of 0.7 mb/d and 0.5 mb/d in the first and second quarters respectively, while the second half is forecast to see average growth of 0.1 mb/d compared to a year ago.
2009 1Q10 2Q10 3Q10 4Q10 2010(a) World oil demand 84.46 84.90 85.06 86.56 86.58 85.78 Non-OPEC supply 51.13 52.18 52.17 51.99 52.30 52.16 OPEC NGLs and non-conventionals 4.35 4.60 4.77 4.81 4.98 4.79(b) Total supply excluding OPEC crude 55.48 56.78 56.94 56.80 57.28 56.95
Difference (a-b) 28.98 28.12 28.12 29.75 29.30 28.83OPEC crude oil production 28.71 29.18 29.06 29.16Balance -0.27 1.06 0.94 -0.60
Totals may not add due to independent rounding
Table 10-1: Summarized supply/demand balance for 2010, mb/d
2010 1Q11 2Q11 3Q11 4Q11 2011(a) World oil demand 85.78 86.24 86.12 87.64 87.77 86.95
Non-OPEC supply 52.16 52.39 52.29 52.41 53.00 52.52 OPEC NGLs and non-conventionals 4.79 5.07 5.21 5.32 5.37 5.24(b) Total supply excluding OPEC crude 56.95 57.45 57.50 57.72 58.37 57.76
Difference (a-b) 28.83 28.79 28.63 29.92 29.40 29.19
Totals may not add due to independent rounding
Table 10-2: Summarized supply/demand balance for 2011, mb/d
25
26
27
28
29
30
25
26
27
28
29
30
1Q10 2Q10 3Q10 4Q10 1Q11 2Q11 3Q11 4Q11
mb/dmb/d
OPEC crude production Required OPEC crude
Graph 10-1: Balance of supply and demand

_________________________________________________________________________________________________________________________________________Monthly Oil Market Report
November 2010 63
T
ab
le 1
0-3
: W
orl
d o
il d
em
an
d/s
up
ply
ba
lan
ce
, mb
/d
2005
2006
2007
2008
2009
1Q10
2Q10
3Q10
4Q10
2010
1Q11
2Q11
3Q11
4Q11
2011
Wor
ld d
eman
d
OEC
D49
.949
.649
.347
.645
.545
.845
.145
.846
.145
.746
.145
.245
.846
.345
.8
Nor
th A
mer
ica
25.6
25.4
25.5
24.2
23.3
23.5
23.7
23.8
23.7
23.7
23.8
23.8
24.0
24.0
23.9
Wes
tern
Eur
ope
15.7
15.7
15.5
15.4
14.5
14.2
14.1
14.6
14.4
14.3
14.2
14.1
14.5
14.3
14.3
Paci
fic8.
68.
58.
48.
07.
78.
27.
37.
48.
07.
78.
17.
37.
48.
07.
7
DC
s22
.723
.524
.625
.526
.026
.226
.626
.726
.826
.626
.827
.127
.327
.427
.2
FSU
3.9
4.0
4.0
4.1
4.0
4.0
3.8
4.2
4.2
4.0
4.0
3.8
4.2
4.3
4.1
Oth
er E
urop
e0.
80.
90.
80.
80.
70.
70.
60.
70.
70.
70.
70.
60.
60.
70.
6
Chi
na6.
77.
27.
68.
08.
38.
28.
99.
28.
88.
88.
79.
49.
79.
29.
2
(a) T
otal
wor
ld d
eman
d84
.185
.286
.485
.984
.584
.985
.186
.686
.685
.886
.286
.187
.687
.886
.9
Non
-OPE
C s
uppl
y
OEC
D20
.420
.120
.019
.519
.720
.019
.919
.519
.919
.819
.819
.619
.519
.919
.7
Nor
th A
mer
ica
14.1
14.2
14.3
13.9
14.4
14.7
14.9
14.9
14.7
14.8
14.8
14.8
14.8
15.0
14.8
Wes
tern
Eur
ope
5.7
5.3
5.2
5.0
4.7
4.7
4.4
4.0
4.5
4.4
4.4
4.2
4.1
4.3
4.2
Paci
fic0.
60.
60.
60.
60.
60.
60.
60.
60.
60.
60.
60.
60.
60.
60.
6
DC
s11
.912
.012
.012
.212
.512
.812
.812
.912
.812
.813
.013
.113
.213
.413
.2
FSU
11.5
12.0
12.5
12.6
13.0
13.1
13.2
13.2
13.3
13.2
13.3
13.3
13.4
13.4
13.4
Oth
er E
urop
e0.
20.
20.
20.
10.
10.
10.
10.
10.
10.
10.
10.
10.
10.
10.
1
Chi
na3.
63.
73.
83.
83.
94.
04.
14.
24.
14.
14.
04.
14.
14.
14.
1
Proc
essi
ng g
ains
1.9
2.0
2.0
2.0
2.0
2.1
2.1
2.1
2.1
2.1
2.1
2.1
2.1
2.1
2.1
Tota
l non
-OPE
C s
uppl
y49
.649
.950
.450
.351
.152
.252
.252
.052
.352
.252
.452
.352
.453
.052
.5
OPE
C N
GLs
+ n
on-c
onve
ntio
nal o
ils3.
93.
93.
94.
14.
34.
64.
84.
85.
04.
85.
15.
25.
35.
45.
2
(b) T
otal
non
-OPE
C s
uppl
y an
d O
PEC
NG
Ls53
.553
.854
.454
.555
.556
.856
.956
.857
.356
.957
.557
.557
.758
.457
.8
OPE
C c
rude
oil
prod
uctio
n (s
econ
dary
sou
rces
)30
.730
.530
.231
.228
.729
.229
.129
.2
Tota
l sup
ply
84.2
84.4
84.6
85.7
84.2
86.0
86.0
86.0
Bal
ance
(sto
ck c
hang
e an
d m
isce
llane
ous)
0.1
-0.8
-1.8
-0.2
-0.3
1.1
0.9
-0.6
OEC
D c
losi
ng s
tock
leve
ls (m
b)
C
omm
erci
al25
8726
6825
7226
9726
7626
7627
6127
71
S
PR14
8714
9915
2415
2715
6715
6715
6315
63
T
otal
4073
4167
4096
4224
4242
4242
4324
4334
Oil-
on-w
ater
954
919
948
969
873
873
876
905
Day
s of
forw
ard
cons
umpt
ion
in O
ECD
Com
mer
cial
onl
and
stoc
ks52
5454
5959
5960
60
SPR
3030
3234
3435
3434
Tot
al82
8486
9393
9494
94
Mem
o ite
ms
FSU
net
exp
orts
7.7
8.0
8.5
8.5
9.0
9.2
9.4
9.0
9.1
9.2
9.3
9.5
9.2
9.2
9.3
(a) -
(b)
30.6
31.4
32.0
31.4
29.0
28.1
28.1
29.8
29.3
28.8
28.8
28.6
29.9
29.4
29.2
Not
e: T
otal
s m
ay n
ot a
dd u
p du
e to
inde
pend
ent r
ound
ing

Monthly Oil Market Report_________________________________________________________________________________________________________________________________________
November 2010 64
Ta
ble
10
-4:
Wo
rld
oil d
em
an
d/s
up
ply
ba
lan
ce
: c
ha
ng
es
fro
m la
st
mo
nth
's t
ab
le †
, m
b/d
2005
2006
2007
2008
2009
1Q10
2Q10
3Q10
4Q10
2010
1Q11
2Q11
3Q11
4Q11
2011
Wo
rld
dem
and
OE
CD
--
--
--0
.1-
0.6
0.1
0.1
--
--
-
Nor
th A
mer
ica
--
--
--0
.1-
0.1
-0.1
--
--
--
Wes
tern
Eur
ope
--
--
--
-0.
30.
10.
1-
--
--
Paci
fic-
--
--
--
0.2
0.1
0.1
--
0.2
0.1
0.1
DC
s-
--
--
--
--
--
--
--
FSU
--
--
--
--
--
--
--
-
Oth
er E
uro
pe-
--
--
--
--
--
--
--
Chi
na-
--
--
-0.
10.
1-
0.1
-0.
20.
2-
0.1
(a) T
ota
l wo
rld
dem
and
--
--
--0
.10.
20.
7-
0.2
-0.
30.
80.
10.
3W
orld
dem
and
gro
wth
-0.0
5-
--
--0
.13
0.15
0.68
0.03
0.19
0.17
0.14
0.09
0.10
0.12
Non
-OP
EC s
upp
ly
OE
CD
--
--
--
--
--
--
--
-
Nor
th A
mer
ica
--
--
--
-0.
2-
--
--
--
Wes
tern
Eur
ope
--
--
--
--0
.1-
--
--
--
Paci
fic-
--
--
--
--
--
--
--
DC
s-
--0
.1-0
.1-0
.1-0
.1-0
.1-
-0.1
-0.1
-0.1
-0.1
-0.1
-0.1
-0.1
FSU
--
--
--
--
--
--
--
-
Oth
er E
uro
pe-
--
--
--
--
--
--
--
Chi
na-
--
--
--
--
--
--
--
Proc
essi
ng g
ains
--
--
--
--
--
--
--
-To
tal n
on-
OPE
C s
upp
ly-
--0
.1-0
.1-0
.1-0
.1-0
.1-
-0.1
-0.1
--0
.1-0
.1-0
.1-0
.1To
tal n
on-
OPE
C s
upp
ly g
row
th-0
.02
-0.0
1-0
.03
-0.0
1-0
.02
-0.
010.
050.
010.
020.
030.
02-0
.03
--
OP
EC N
GL
s +
non
-co
nven
tion
als
--
--
--
--
--
--
--
-
(b) T
otal
no
n-O
PEC
su
pply
an
d O
PEC
NG
Ls-
--0
.1-0
.1-0
.1-0
.1-0
.1-
-0.1
-0.1
--0
.1-0
.1-0
.1-0
.1
OP
EC c
rud
e o
il p
rodu
ctio
n (s
econ
dary
sou
rces
)-
--
--
--
-
Tota
l sup
ply
--
-0.1
-0.1
-0.1
-0.1
-0.1
-
Bal
ance
(sto
ck c
han
ge a
nd m
isce
llan
eou
s)-
--0
.1-0
.1-0
.1-
-0.2
-0.7
OE
CD
clo
sing
sto
ck le
vels
(mb
)
C
omm
erci
al-
--
-11
-1-5
-
S
PR
--
--
3-
--
T
otal
--
--
13-1
-5-
Oil-
on-w
ater
--
--
-33
--
-
Day
s o
f fo
rwar
d c
ons
um
ptio
n in
OEC
D
Com
mer
cial
onl
and
stoc
ks-
--
--
--0
.9-
SPR
--
--
--
--
Tot
al-
--
--
--1
.4-
Mem
o it
ems
FSU
net
exp
orts
--
--
--
--
--
--
--
-
(a) -
(b)
--
0.1
0.1
0.1
-0.
20.
70.
10.
30.
10.
40.
80.
20.
4
† This
com
pare
s Ta
ble
10-3
in th
is is
sue
of th
e M
OM
R w
ith T
able
31
in th
e O
ctob
er 2
010
issu
e
Th
is ta
ble
show
s on
ly w
here
cha
nges
hav
e oc
curre
d
n.a.
Not
ava
ilabl
e.

_________________________________________________________________________________________________________________________________________Monthly Oil Market Report
November 2010 65
2003
2004
2005
2006
2007
2008
2Q06
3Q06
4Q06
1Q07
2Q07
3Q07
4Q07
1Q08
2Q08
3Q08
4Q08
1Q09
2Q09
3Q09
4Q09
1Q10
2Q10
3Q10
Clos
ing
stoc
k le
vels
mb
OEC
D on
land
com
mer
cial
2,511
2,53
82,5
872,
668
2,572
2,697
2,64
92,7
612,6
682,
601
2,661
2,64
62,5
722,5
722,
602
2,664
2,69
72,7
502,7
582,
778
2,664
2,67
62,7
612,7
71
North
Amer
ica
1,161
1,19
31,2
571,
277
1,229
1,301
1,27
71,3
511,2
771,
238
1,294
1,28
51,2
291,2
161,
240
1,282
1,30
11,3
551,3
881,
390
1,309
1,31
81,3
771,4
27
Wes
tern
Eur
ope
915
915
935
963
937
989
936
949
963
943
940
929
937
961
953
951
989
988
969
968
972
972
979
949
OEC
D Pa
cific
435
430
394
429
407
407
436
461
429
420
428
432
407
394
409
431
407
408
401
419
383
386
405
395
OEC
D SP
R1,4
111,
450
1,487
1,49
91,5
241,5
271,
493
1,495
1,499
1,50
71,5
061,
520
1,524
1,529
1,52
61,5
221,
527
1,547
1,561
1,56
41,5
641,
567
1,563
1,563
North
Amer
ica64
067
868
769
169
970
469
069
069
169
169
269
569
970
270
870
470
471
572
672
772
972
972
972
8
Wes
tern
Eur
ope
374
377
407
412
421
416
411
412
412
415
413
423
421
423
414
414
416
424
427
429
426
429
424
424
OEC
D Pa
cific
396
396
393
396
404
406
393
393
396
401
401
403
404
404
404
403
406
408
408
408
409
409
411
411
OEC
D to
tal
3,922
3,98
84,0
734,
167
4,096
4,224
4,14
24,2
564,1
674,
108
4,168
4,16
64,0
964,1
014,
128
4,186
4,22
44,2
974,3
194,
342
4,228
4,24
24,3
244,
334
Oil-o
n-wa
ter88
290
595
491
994
896
997
597
491
991
689
191
794
893
592
588
596
989
989
986
990
687
387
690
5
Days
of f
orwa
rd co
nsum
ptio
n in
OEC
D
OEC
D on
land
com
mer
cial
5151
5254
5459
5455
5454
5453
5254
5656
5862
6160
5859
6060
North
Amer
ica46
4749
5051
5650
5350
4951
5050
5053
5456
5960
5956
5658
60
Wes
tern
Eur
ope
5958
6062
6168
6060
6362
6059
6164
6162
6669
6767
6969
6766
OEC
D Pa
cific
5150
4751
5153
5553
4853
5449
4650
5454
5056
5552
4753
5549
OEC
D SP
R28
2930
3032
3430
3030
3131
3031
3233
3233
3535
3434
3534
34
North
Amer
ica25
2627
2729
3027
2727
2727
2728
2930
2930
3131
3131
3131
31
Wes
tern
Eur
ope
2424
2627
2729
2626
2727
2627
2728
2727
2830
2930
3030
2930
OEC
D Pa
cific
4646
4647
5053
5045
4451
5146
4552
5451
5056
5651
5056
5551
OEC
D to
tal
7980
8284
8693
8485
8485
8583
8487
8889
9197
9694
9294
9494
Tab
le 1
0-5:
OE
CD
oil
stoc
ks a
nd o
il on
wat
er a
t the
end
of p
erio
d
n.a.
not a
vaila
ble

Monthly Oil Market Report_________________________________________________________________________________________________________________________________________
November 2010 66
Ch
ang
eC
han
ge
Ch
ang
eC
han
ge
2005
2006
2007
2008
08/0
71Q
092Q
093Q
094Q
0920
0909
/08
1Q10
2Q10
3Q10
4Q10
2010
10/0
91Q
112Q
113Q
114Q
1120
1111
/10
US
A7.
347.
367.
477.
500.
037.
848.
088.
298.
368.
140.
648.
448.
528.
538.
418.
480.
338.
478.
478.
508.
568.
500.
02C
anad
a3.
033.
203.
313.
27-0
.04
3.32
3.13
3.23
3.27
3.24
-0.0
33.
273.
373.
383.
393.
350.
113.
413.
433.
443.
543.
460.
10M
exic
o3.
773.
693.
493.
17-0
.31
3.04
2.97
2.94
2.96
2.98
-0.1
92.
992.
972.
952.
922.
96-0
.02
2.90
2.89
2.87
2.90
2.89
-0.0
7N
ort
h A
mer
ica
14.1
414
.24
14.2
613
.94
-0.3
314
.21
14.1
814
.46
14.5
914
.36
0.42
14.7
114
.86
14.8
614
.72
14.7
90.
4314
.78
14.8
014
.81
14.9
914
.85
0.06
Nor
way
2.97
2.78
2.56
2.47
-0.0
92.
532.
212.
292.
392.
36-0
.11
2.33
2.12
1.91
2.27
2.16
-0.2
02.
212.
031.
982.
082.
08-0
.08
UK
1.89
1.71
1.69
1.58
-0.1
11.
631.
571.
271.
461.
48-0
.10
1.51
1.40
1.26
1.38
1.39
-0.0
91.
351.
311.
291.
331.
32-0
.07
Den
mar
k0.
380.
340.
310.
28-0
.03
0.28
0.27
0.27
0.24
0.26
-0.0
20.
250.
250.
220.
240.
24-0
.02
0.23
0.23
0.20
0.21
0.22
-0.0
2O
ther
Wes
tern
Eur
ope
0.49
0.51
0.62
0.64
0.03
0.62
0.62
0.64
0.63
0.63
-0.0
20.
610.
630.
650.
610.
630.
000.
630.
630.
620.
620.
620.
00W
este
rn E
uro
pe
5.72
5.34
5.17
4.97
-0.2
05.
074.
674.
474.
714.
73-0
.24
4.70
4.40
4.04
4.50
4.41
-0.3
24.
424.
204.
094.
254.
24-0
.17
Aus
tralia
0.53
0.51
0.53
0.53
0.01
0.55
0.53
0.55
0.53
0.54
0.01
0.51
0.50
0.52
0.54
0.52
-0.0
20.
540.
550.
550.
550.
550.
03O
ther
Pac
ific
0.05
0.05
0.08
0.10
0.02
0.09
0.09
0.10
0.10
0.10
0.00
0.10
0.10
0.10
0.10
0.10
0.00
0.09
0.09
0.08
0.08
0.09
-0.0
1O
EC
D P
acif
ic0.
580.
560.
600.
630.
030.
640.
620.
650.
630.
640.
010.
610.
600.
620.
640.
62-0
.02
0.64
0.65
0.64
0.63
0.64
0.02
To
tal
OE
CD
20.4
420
.14
20.0
419
.54
-0.5
019
.91
19.4
719
.58
19.9
419
.72
0.19
20.0
319
.86
19.5
219
.86
19.8
10.
0919
.84
19.6
419
.54
19.8
719
.72
-0.0
9B
rune
i0.
210.
220.
190.
17-0
.01
0.17
0.15
0.16
0.19
0.17
0.00
0.18
0.16
0.17
0.17
0.17
0.00
0.17
0.17
0.17
0.16
0.17
0.00
Indi
a0.
760.
780.
800.
800.
000.
770.
780.
790.
800.
79-0
.01
0.82
0.83
0.88
0.89
0.85
0.07
0.90
0.88
0.90
0.91
0.90
0.05
Indo
nesi
a1.
121.
071.
021.
040.
021.
031.
021.
021.
031.
03-0
.01
1.03
1.04
1.03
1.01
1.03
0.00
1.02
1.01
1.00
0.99
1.01
-0.0
2M
alay
sia
0.77
0.76
0.76
0.76
0.00
0.74
0.72
0.73
0.71
0.73
-0.0
30.
730.
700.
680.
650.
69-0
.04
0.65
0.64
0.63
0.63
0.63
-0.0
6Th
aila
nd0.
290.
320.
330.
360.
020.
370.
370.
360.
370.
370.
010.
350.
350.
360.
350.
35-0
.02
0.35
0.35
0.35
0.35
0.35
0.00
Vie
tnam
0.39
0.37
0.35
0.33
-0.0
10.
340.
360.
380.
410.
370.
040.
400.
390.
400.
370.
390.
010.
400.
410.
440.
460.
430.
04A
sia
othe
rs0.
260.
260.
260.
260.
000.
250.
260.
250.
250.
25-0
.01
0.22
0.24
0.23
0.24
0.23
-0.0
20.
240.
250.
250.
260.
250.
02O
ther
Asi
a3.
793.
783.
703.
720.
023.
683.
683.
693.
763.
70-0
.02
3.73
3.71
3.73
3.68
3.71
0.01
3.72
3.71
3.75
3.76
3.74
0.02
Arg
entin
a0.
780.
770.
770.
780.
010.
780.
770.
740.
760.
76-0
.02
0.77
0.76
0.76
0.75
0.76
0.00
0.75
0.75
0.75
0.75
0.75
-0.0
1B
razi
l1.
982.
112.
222.
380.
162.
472.
492.
512.
552.
510.
122.
672.
732.
712.
782.
720.
222.
852.
882.
943.
002.
920.
20C
olom
bia
0.53
0.54
0.54
0.60
0.06
0.65
0.67
0.68
0.73
0.68
0.09
0.77
0.79
0.80
0.81
0.79
0.11
0.84
0.86
0.88
0.91
0.87
0.08
Trin
idad
& T
obag
o0.
180.
180.
160.
16-0
.01
0.15
0.15
0.15
0.15
0.15
0.00
0.15
0.15
0.15
0.14
0.15
0.00
0.13
0.13
0.13
0.14
0.13
-0.0
2L.
Am
eric
a ot
hers
0.30
0.26
0.28
0.28
0.01
0.31
0.30
0.31
0.30
0.30
0.02
0.30
0.31
0.31
0.30
0.31
0.00
0.31
0.32
0.33
0.34
0.32
0.02
Lat
in A
mer
ica
3.77
3.87
3.97
4.20
0.23
4.36
4.38
4.39
4.50
4.41
0.21
4.66
4.74
4.73
4.79
4.73
0.32
4.88
4.94
5.03
5.13
5.00
0.27
Bah
rain
0.21
0.21
0.21
0.21
0.00
0.21
0.21
0.21
0.21
0.21
0.00
0.21
0.21
0.21
0.21
0.21
0.00
0.21
0.21
0.21
0.21
0.21
0.00
Om
an0.
780.
750.
710.
760.
050.
790.
800.
830.
830.
810.
060.
860.
860.
870.
870.
860.
050.
890.
910.
920.
940.
910.
05S
yria
0.45
0.44
0.42
0.41
0.00
0.41
0.41
0.41
0.41
0.41
0.00
0.42
0.43
0.42
0.40
0.41
0.00
0.40
0.39
0.39
0.38
0.39
-0.0
2Y
emen
0.41
0.37
0.33
0.30
-0.0
30.
300.
300.
300.
290.
30-0
.01
0.29
0.29
0.29
0.27
0.28
-0.0
20.
270.
260.
260.
260.
26-0
.02
Mid
dle
Eas
t1.
851.
761.
661.
680.
021.
711.
721.
751.
741.
730.
051.
771.
771.
771.
741.
760.
041.
761.
761.
771.
781.
770.
00C
had
0.18
0.15
0.15
0.15
0.00
0.14
0.14
0.14
0.14
0.14
-0.0
10.
140.
140.
140.
120.
130.
000.
120.
120.
120.
120.
12-0
.01
Con
go0.
240.
250.
240.
260.
020.
270.
270.
270.
290.
270.
020.
300.
300.
300.
300.
300.
020.
300.
310.
310.
320.
310.
01E
gypt
0.70
0.66
0.66
0.69
0.04
0.72
0.72
0.69
0.71
0.71
0.01
0.71
0.72
0.73
0.71
0.72
0.01
0.72
0.72
0.71
0.70
0.71
0.00
Equ
ator
ial G
uine
a0.
360.
370.
370.
380.
010.
370.
360.
350.
340.
36-0
.02
0.33
0.33
0.32
0.32
0.32
-0.0
30.
320.
310.
320.
330.
32-0
.01
Gab
on0.
250.
250.
250.
24-0
.01
0.23
0.23
0.24
0.25
0.24
0.00
0.25
0.23
0.25
0.24
0.24
0.00
0.23
0.24
0.24
0.24
0.24
0.00
Sou
th A
frica
0.19
0.19
0.18
0.18
0.00
0.18
0.18
0.17
0.16
0.17
-0.0
10.
180.
180.
180.
180.
180.
010.
180.
180.
180.
180.
180.
00S
udan
0.34
0.40
0.50
0.48
-0.0
20.
470.
480.
480.
480.
480.
000.
470.
460.
460.
450.
46-0
.02
0.44
0.45
0.45
0.44
0.45
-0.0
1A
frica
oth
er0.
230.
290.
280.
280.
000.
280.
270.
270.
260.
27-0
.01
0.26
0.25
0.25
0.30
0.27
0.00
0.31
0.33
0.35
0.41
0.35
0.09
Afr
ica
2.49
2.55
2.62
2.65
0.03
2.64
2.64
2.62
2.62
2.63
-0.0
22.
632.
602.
622.
602.
61-0
.02
2.62
2.65
2.68
2.74
2.67
0.06
To
tal
DC
s11
.90
11.9
611
.96
12.2
50.
2912
.38
12.4
112
.44
12.6
212
.47
0.22
12.7
912
.82
12.8
512
.81
12.8
20.
3512
.98
13.0
613
.23
13.4
213
.17
0.35
FS
U11
.55
12.0
212
.53
12.6
00.
0612
.67
12.9
313
.05
13.1
612
.96
0.36
13.1
213
.18
13.2
313
.35
13.2
20.
2613
.32
13.3
113
.36
13.4
313
.36
0.14
R
ussi
a9.
449.
659.
879.
78-0
.08
9.78
9.87
9.97
10.0
79.
920.
1410
.09
10.1
210
.13
10.0
710
.10
0.18
10.0
610
.06
10.0
810
.13
10.0
8-0
.02
K
azak
hsta
n1.
231.
301.
351.
410.
061.
481.
511.
541.
611.
540.
121.
611.
561.
571.
661.
600.
061.
651.
661.
701.
711.
680.
08
Aze
rbai
jan
0.44
0.65
0.87
0.94
0.07
0.97
1.11
1.09
1.06
1.06
0.12
1.01
1.09
1.12
1.18
1.10
0.04
1.18
1.17
1.17
1.17
1.17
0.07
F
SU
oth
ers
0.44
0.42
0.44
0.46
0.01
0.45
0.44
0.44
0.42
0.44
-0.0
20.
420.
420.
410.
440.
42-0
.02
0.42
0.42
0.42
0.42
0.42
0.00
Oth
er E
urop
e0.
160.
150.
150.
15-0
.01
0.14
0.13
0.14
0.14
0.14
-0.0
10.
140.
140.
150.
140.
140.
000.
140.
140.
140.
150.
140.
00C
hina
3.64
3.69
3.77
3.84
0.07
3.80
3.86
3.88
3.87
3.85
0.01
4.03
4.10
4.18
4.06
4.09
0.24
4.04
4.06
4.06
4.06
4.05
-0.0
4N
on
-OP
EC
pro
du
ctio
n47
.69
47.9
748
.45
48.3
7-0
.08
48.9
148
.81
49.0
949
.72
49.1
30.
7750
.10
50.0
949
.92
50.2
250
.08
0.95
50.3
150
.21
50.3
350
.92
50.4
40.
36
Pro
cess
ing
gain
s1.
911.
961.
991.
97-0
.02
2.00
2.00
2.00
2.00
2.00
0.03
2.08
2.08
2.08
2.08
2.08
0.08
2.08
2.08
2.08
2.08
2.08
0.00
No
n-O
PE
C s
up
ply
49.6
049
.93
50.4
450
.33
-0.1
050
.91
50.8
151
.09
51.7
251
.13
0.80
52.1
852
.17
51.9
952
.30
52.1
61.
0352
.39
52.2
952
.41
53.0
052
.52
0.36
OP
EC
NG
L3.
743.
763.
864.
040.
183.
994.
194.
414.
374.
240.
214.
494.
674.
714.
874.
680.
444.
945.
055.
145.
195.
080.
40O
PE
C N
on-c
onv
entio
nal
0.16
0.14
0.09
0.11
0.02
0.11
0.11
0.11
0.11
0.11
0.00
0.10
0.10
0.10
0.11
0.11
0.00
0.13
0.16
0.18
0.18
0.16
0.06
OP
EC
(N
GL
+N
CF
)3.
893.
893.
954.
140.
194.
104.
304.
524.
484.
350.
214.
604.
774.
814.
984.
790.
445.
075.
215.
325.
375.
240.
45
No
n-O
PE
C &
OP
EC
(N
GL
+N
CF
)53
.49
53.8
254
.39
54.4
70.
0955
.01
55.1
155
.61
56.2
055
.48
1.01
56.7
856
.94
56.8
057
.28
56.9
51.
4757
.45
57.5
057
.72
58.3
757
.76
0.81
Not
e:
Tota
ls m
ay n
ot a
dd u
p du
e to
inde
pend
ent r
ound
ing.
Ind
ones
ia h
as b
een
incl
uded
in n
on-O
PE
C s
uppl
y fo
r pu
rpos
e of
com
paris
on
Ta
ble
10
-6:
No
n-O
PE
C s
up
ply
an
d O
PE
C n
atu
ral g
as
liq
uid
s, m
b/d

_________________________________________________________________________________________________________________________________________Monthly Oil Market Report
November 2010 67
Chan
geCh
ange
Chan
geCh
ange
2005
2006
06/0
52Q
073Q
074Q
0720
0707
/06
1Q08
2Q08
3Q08
4Q08
2008
08/0
71Q
092Q
093Q
094Q
0920
0909
/08
1Q10
2Q10
3Q10
Sep
10 O
ct10
Oct
/Sep
USA
1,38
11,
647
267
1,75
61,
788
1,79
01,
767
119
1,77
01,
864
1,97
81,
898
1,87
711
11,
326
936
956
1,10
81,
081
-796
1,34
51,
508
1,62
216
5516
6813
Cana
da45
847
012
139
348
356
344
-126
507
169
432
408
379
3532
891
177
277
218
-161
470
166
364
346
348
2
Mex
ico
107
83-2
488
9693
929
9610
610
310
610
311
128
128
135
123
128
2611
810
684
7774
-3
North
Am
eric
a1,
945
2,20
025
51,
983
2,23
12,
240
2,20
22
2,37
32,
139
2,51
32,
411
2,35
915
71,
782
1,15
41,
267
1,50
81,
428
-931
1,93
31,
780
2,07
020
7820
9012
Norw
ay17
170
1918
1718
117
2121
2120
225
1818
2020
021
1813
1420
6
UK21
275
2927
2226
-119
2124
2422
-422
1916
1518
-415
2021
2220
-2
Wes
tern
Eur
ope
7077
780
7977
780
9197
101
103
9820
9082
7685
83-1
587
9692
9495
1
OEC
D Pa
cific
2526
230
3230
292
3239
3934
367
2725
2623
25-1
122
1823
2424
0
Tota
l OEC
D2,
078
2,34
726
92,
141
2,38
72,
385
2,35
24
2,53
22,
317
2,69
82,
593
2,53
518
31,
945
1,29
91,
368
1,61
61,
557
-978
2,04
21,
893
2,18
521
9622
0913
Oth
er A
sia20
020
22
213
212
216
212
1021
322
021
821
221
64
212
212
213
233
217
123
524
925
325
725
0-7
Latin
Am
eric
a12
914
919
177
171
179
175
2718
718
419
519
719
116
164
147
149
169
157
-34
183
203
220
222
209
-13
Mid
dle
East
131
132
114
615
415
414
918
158
165
175
171
167
1816
215
113
914
715
0-1
815
215
016
316
515
7-8
Afric
a8
102
1214
1414
410
1314
1112
-28
119
1210
-220
1919
1918
-1
Tota
l DCs
468
493
2554
955
056
355
158
569
583
602
591
586
3654
652
051
056
153
4-5
258
962
165
566
363
4-2
9
Non-
OPE
C Ri
g Co
unt
2,54
62,
840
294
2,69
02,
937
2,94
82,
903
623,
101
2,90
03,
300
3,18
33,
121
219
2,49
11,
819
1,87
82,
177
2,09
1-1
,030
2,63
22,
514
2,84
028
5928
43-1
6
Alge
ria21
244
2628
2827
226
2724
2626
-124
3027
2727
123
2824
2425
1
Ango
la3
41
43
54
15
65
55
15
33
44
-110
89
106
-4
Ecua
dor
1211
010
1110
11-1
79
1213
10-1
1010
1010
100
1111
1111
121
Iran
4044
451
5150
506
5050
5051
500
5152
5252
522
5252
5252
520
Iraq
00
00
00
00
2929
2929
2929
2929
2929
290
2929
2929
290
Kuwa
it12
141
1313
1112
-112
1112
1212
012
1114
1313
019
1821
2123
2
Liby
a9
101
1214
1413
314
1515
1515
215
1314
1514
-117
1714
1415
1
Nige
ria9
101
78
108
-19
86
67
-17
66
76
-111
1318
2119
-2
Qat
ar12
11-1
1213
1413
211
1211
1111
-19
99
99
-28
89
98
-1
Saud
i Ara
bia
3765
2876
7877
7711
7877
7676
770
7267
6766
68-9
6867
6768
680
UAE
1616
015
1514
15-2
1212
1312
12-2
1312
1312
120
1313
1313
141
Vene
zuel
a68
8113
8077
7176
-582
8177
8180
469
6454
5460
-20
6664
7071
8211
OPE
C Ri
g Co
unt
238
290
5130
531
130
230
516
336
337
330
336
335
2931
530
729
529
830
4-3
132
732
833
734
335
310
Wor
ldwi
de R
ig C
ount
*2,
785
3,13
034
52,
995
3,24
93,
250
3,20
878
3,43
83,
237
3,63
03,
519
3,45
624
82,
806
2,12
62,
173
2,47
62,
395
-1,0
612,
958
2,84
23,
177
3202
3196
-6
of w
hich
:
Oil
980
1,12
414
41,
167
1,25
41,
285
1,24
211
91,
408
1,35
11,
479
1,49
01,
432
190
1276
1,06
211
7513
4912
15-2
171,
583
1,52
71,
776
1800
1834
34
Gas
1,74
61,
947
201
1,76
41,
931
1,90
41,
903
-44
1,96
91,
814
2,07
01,
948
1,95
047
1450
993
965
1092
1125
-825
1,33
31,
276
1,35
613
5713
19-3
8
Oth
ers
21
17-4
1720
2520
426
3236
3733
1235
3534
3735
343
4042
4543
-2
Tab
le 1
0-7:
Wo
rld
Rig
Co
un
t
*/
Ex
clude
s Chi
na an
d FSU
na:
Not
ava
ilabl
eNo
te:
Tota
ls m
ay n
ot a
dd u
p du
e to
inde
pend
ent ro
undi
ngSo
urce
: Ba
ker H
ughe
s Int
erna
tiona
l & S
ecre
taria
t's E
stim
ates
Monthly Oil Market Report_________________________________________________________________________________________________________________________________________
November 2010 68
Contributors to the OPEC Monthly Oil Market Report
Editor-in-Chief Hasan M. Qabazard, Director, Research Division email: [email protected]
Editor Hojatollah Ghanimi Fard, Head, Petroleum Studies Department email: [email protected] Analysts Crude Oil Price Movements
Brahim Aklil email: [email protected]
Commodity Markets Odalis López-Gonzalez e-mail:[email protected]
World Economy Joerg Spitzy email: [email protected]
Vahan Kotanjyan email: [email protected]
World Oil Demand Esam Al-Khalifa email: [email protected]
World Oil Supply Haidar Khadadeh email: [email protected]
Product Markets and Refinery Operations
Elio Rodriguez email: [email protected]
Tanker Market and Oil Trade Julio Arboleda email: [email protected]
Stock Movements Aziz Yahyai email: [email protected]
Technical and editorial team Aziz Yahyai email: [email protected] Douglas Linton email: [email protected]
Data services Fuad Al-Zayer, Head Data Services Department ([email protected])
Puguh Irawan ([email protected]), Ramadan Janan ([email protected])
Pantelis Christodoulides (World Oil Demand, Stock Movements), Hannes Windholz
(Oil Trade, Product & Refinery), Mouhamad Moudassir (Tanker Market),
Klaus Stoeger (World Oil Supply), Harvir Kalirai (Economics), Sheela Kriz (Crude Oil Prices)
Production, design and circulation Viveca Hameder, Hataichanok Leimlehner, Evelyn Oduro-Kwateng, Andrea Birnbach Unless separately credited, material may be reproduced without permission, but kindly mention OPEC as source


November 2010
OPEC Basket average priceUS$ per barrel
up $5.23 in October October 2010 79.86 September 2010 74.63 Year-to-date 75.70
up 0.14 in October October 2010 29.30 September 2010 29.16
October OPEC productionin million barrels per day, according to secondary sources
Supply and demandin million barrels per day
2010 2011World demand 85.8 World demand 86.9Non-OPEC supply 52.2 Non-OPEC supply 52.5OPEC NGLs 4.8 OPEC NGLs 5.2Difference 28.8 Difference 29.2
Totals may not add due to independent rounding
StocksUS commercial inventories declined 11.6 mb in October, with crude and product stocks moving in opposite directions. Despite this drop, US commercial inventories remained with a comfortable surplus of 107 mb over the five-year average. EU 15 plus Nor-way total inventories rose 8.5 mb, driven by a build in crude, while products declined. European inventories stood at 6.3 mb above the five-year average. Preliminary indica-tions show commercial oil stocks in Japan reversing the previous month’s declining trend with a build of 7.9 mb in October.
World economyGlobal growth in 2010 was revised up from 3.9% to 4.1%, while 2011 remains unchanged at 3.6%. OECD growth was increased from 2.2% to 2.4% for 2010 and from 1.9% to 2.0% for 2011. China’s growth level remains at 9.5% and 8.6% in 2010 and 2011 respectively. India’s expansion in 2010 was raised from 8.2% to 8.5%, while growth for 2011 was left unchanged at 7.7%.
Issued 11 November 2010 Data covered up to the end of October 2010 unless otherwise statedNext report to be issued on 10 December 2010
OPECOrganization of the Petroleum Exporting Countries
Monthly Oil Market Report
Tel +43 1 21112 Fax +43 1 2164320 E-mail: [email protected] Web site: www.opec.org
Data Summary