online video ads within a changing media landscape · 2019. 7. 8. · online video ads within a...
TRANSCRIPT

Online video ads within a changing media landscape
July 2019
Giovanni Frasca, Media & Digital Expert

The world’s leading experts in helping clients navigate media decisions to
grow great brands
2
Extensive sample
& data partnerships
Vertical market
expertise
Global scale
& capabilities
22 Years
experience
CrossMediacampaigns
Connect touchpoint planning studies
Context Lab digital pilot studies
Digitalcampaigns

What does the future
of marketing look like?

Marketers around the world still struggle with marketing performance
Source: Kantar, Getting Media Right 2018
facing marketers today
Measuring
and proving
ROI
01Understanding
omni-channel
behavior
02Optimising
media
investment
03

Technological revolutions drive marketing: the ERA OF MASS MEDIA was all
about reaching a mass audience
1948Era of mass-
media
Gibbs
toothpaste:
first TV ad

Technological revolutions drive marketing:
The jungle of channels in the
ERA OF ENGAGEMENT
6
Radio
Cinema
Sponsorship
Outdoor
Search
Audio
Voice
Events Experiential
Influencers
Branded contentNative ads
Linear TV
Addressable TV/VOD
Online ads (trackable)
Google, Facebook, etc. Point of Sale
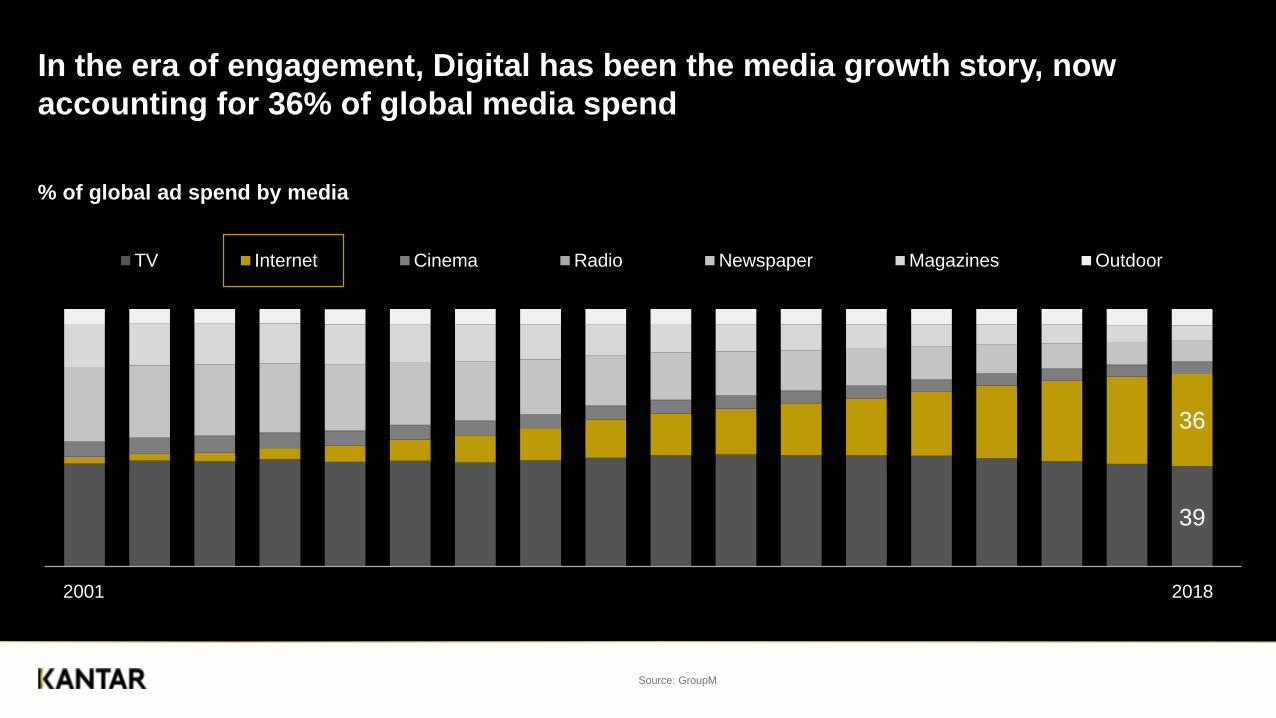
% of global ad spend by media
In the era of engagement, Digital has been the media growth story, now
accounting for 36% of global media spend
Source: GroupM
39
36
TV Internet Cinema Radio Newspaper Magazines Outdoor
2001 2018

It’s been a long time since we proved that online video ads work better than
display formats in building brand favourability and purchase intent
Source: Dynamic Logic Global Marketnorm data, Q2 2011 8
1,2
0,91,0
Online video (N=291) Rich media (N=1016) Simple flash (N=1027)
BRAND FAVOURABILITY
1,1
0,80,7
Online video (N=291) Rich media (N=1016) Simple flash (N=1027)
PURCHASE INTENT
Average Impact on brand metrics (% uplift)

And indeed investment for digital video ads is growing at a much faster pace
than overall digital advertising and non-video displays across Europe
Source: IAB Europe Conference, June 2019
13,9
6,6
27,9
TOTAL DIGITAL NON-VIDEO DISPLAY DIGITAL VIDEO
% of digital advertising market growth, H1 2018 – across 28 European countries

Source: global CrossMedia database (500 campaigns up 2014, 801 campaigns since 2015)
Share of spend
We too observed an increased share of spend in online videos within Kantar
CrossMedia database when looking at more recent campaigns
36% 33%
Up to 2014 2015-2018
5% 6%
Up to 2014 2015-2018
TV share of ad spend decreased by 8% Online videos share of ad spend increased by 19%

The increase in ad spend for online videos translated at first in higher reach
Source: global CrossMedia database (500 campaigns up 2014, 801 campaigns since 2015) 11
Average Reach (%)
70% 65%
Up to 2014 2015-2018
24% 31%
Up to 2014 2015-2018
TV reach decreased by 7% Online videos reach increased by 31%

At the same time, online videos improved their average brand contribution
Source: global CrossMedia database (500 campaigns up 2014, 801 campaigns since 2015) 12
Average brand contributions (across all brand KPIs)
1,27%
1,08%
2015-2018 >2014
TV average brand contribution
decreased by 15%
0,26%
0,40%
2015-2018 >2014
Online videos average brand contribution
increased by 54%

Finally, the increase in share of spend for Online videos did not impact their
efficiencies, showing that there is still room for further investment
Source: global CrossMedia database (500 campaigns up 2014, 801 campaigns since 2015) 13
Average cost effectiveness indices (across all brand KPIs): 100 = average
76
67
2015-2018 >2014
TV average cost effectiveness
decreased by 13%
125
133
2015-2018 >2014
Online videos average cost effectiveness
increased by 6%

remains the most impactful
ad channel for now, but the
crown is slipping…
Change in KPIs comparing campaigns up to
2014 vs. campaigns 2015-2018TV Online videos
Share of spend Down 8% Up 19%
Average reach Down 7% Up 31%
Contributions to brand KPIs Down 15% Up 54%
Relative cost effectiveness index (100 = average) Down 13% Up 6%
Source: global CrossMedia database (500 campaigns up 2014, 801 campaigns since 2015)

START WITH AN IDEA,
NOT A TV AD
15
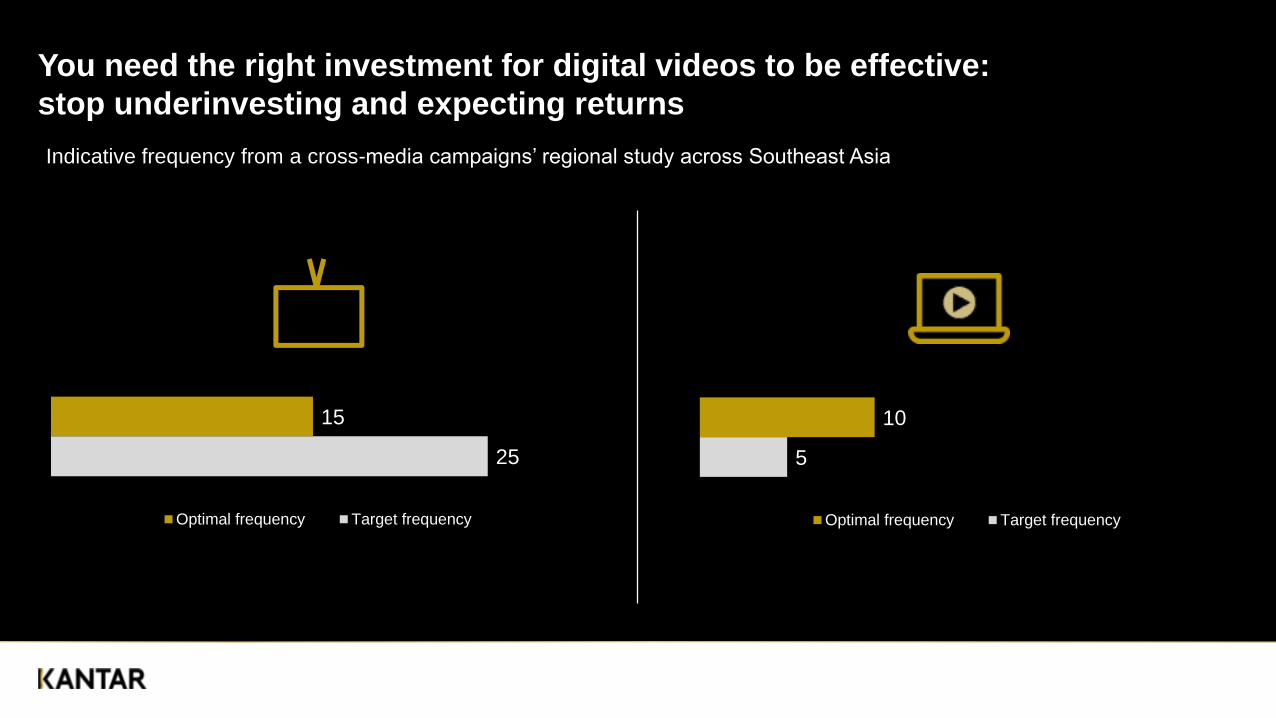
You need the right investment for digital videos to be effective:
stop underinvesting and expecting returns
Indicative frequency from a cross-media campaigns’ regional study across Southeast Asia
25
15
Optimal frequency Target frequency
5
10
Optimal frequency Target frequency

Indeed frequencies of online videos are still among the lowest we record in our
studies – only print & cinema have lower frequencies
Source: global CrossMedia database (801 campaigns since 2015) 17
2
3
5
5
6
8
8
9
15
16
0 2 4 6 8 10 12 14 16 18
Cinema
Magazines
Newspapers
Online Video
Online Display
POS
Outdoor
TV
Radio
Average Frequency

Avoid to get sucked into the TV black hole: you can win the share of voice
battle with a better integration of digital channels
189
44
47
8
14
7
44
16
26
19
28
23 26
74
6
Share of total
spendAwareness Association Motivation
TV
YouTube
Other online
OOH
Radio
Give each channel a
role: create a reason
for being for each
touchpoint in the
ecosystem
Source: Kantar CrossMedia campaign - Indonesia

Indeed, integrated and customised campaigns are most effective… but are not
the majority!
Data Source: Kantar CrossMedia studies, 2015-2017, (223 studies).
Categories: Food & Bev, Household, Retail, Travel, Personal care, Financial services, Technology, Automobiles
Overall Campaign Contribution is a measure of campaign impact on a combination of all brand KPIs (awareness, associations, motivation) 19
Base: (57) (64) (102)
100
131
157
Not well integrated Integrated – similar ads, but NOT well customised to
individual media
Integrated AND most mediawere customised well
Overall campaign contribution
by campaign type
Nature of multimedia campaigns
26%
29%
46%
Integrated AND
most media were
customised wellNot very well
integrated
Integrated – similar
ads, but NOT well
customised to
individual media

We have seen that
17%of campaign
performance comes
from synergy effects*
There are three conditions required for
synergy to occur between channels:
OVERLAPS IN REACH
SYNCHRONOUS OR
OVERLAPPING PHASING
CREATIVE INTEGRATION
01
02
03
*Source: Kantar CrossMedia average – Europe studies only 20

With Online videos we can target audiences that TV struggles to
reach
Source: Kantar Millward Brown and Collective Europe R&F studies 2013-2015 N=12 studies
Average incremental reach of online video
among light TV viewers:
Average incremental reach of online
video among total audience:
5%2%
21

3 creative
assumptions
to avoid
22
I can use
my TV ad online
and get double
the impact
01Editing
my TV ad
for different
channels will be
most efficient way to
spend my
media budget
02I can take
a completely
different approach
on each channel
03

The poorest digital creative can even make people less favourable towards the brand,
and confuse people as to the brand’s meaning.
But digital ads, when not developed & deployed properly, can be harmful
23
% impacted
11
7 7
3
1 1
-3
-5 -5
MESSAGE ASSOCIATION BRAND FAVORABILITY PURCHASE INTENT
Top 20% performing ads Average Bottom 20% performing ads
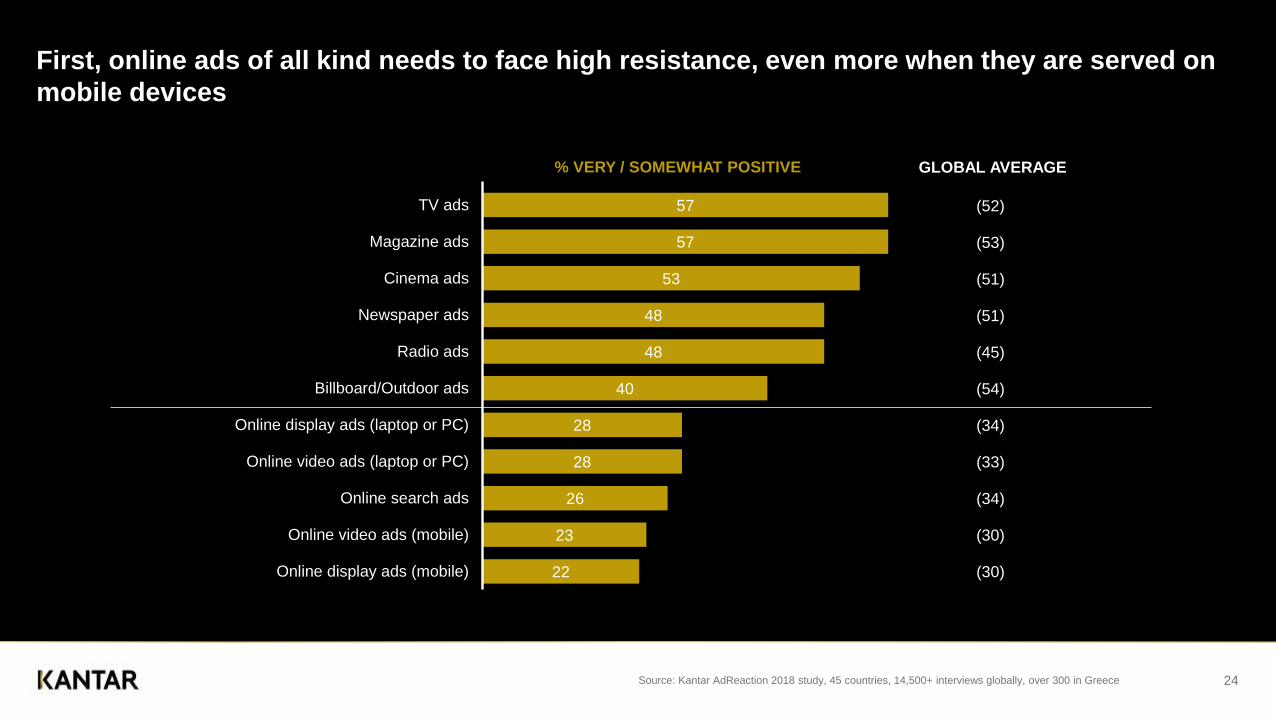
First, online ads of all kind needs to face high resistance, even more when they are served on
mobile devices
Source: Kantar AdReaction 2018 study, 45 countries, 14,500+ interviews globally, over 300 in Greece 24
57
57
53
48
48
40
28
28
26
23
22
TV ads
Magazine ads
Cinema ads
Newspaper ads
Radio ads
Billboard/Outdoor ads
Online display ads (laptop or PC)
Online video ads (laptop or PC)
Online search ads
Online video ads (mobile)
Online display ads (mobile)
GLOBAL AVERAGE
(52)
(53)
(51)
(51)
(45)
(54)
(34)
(33)
(34)
(30)
(30)
% VERY / SOMEWHAT POSITIVE

Formats that give control to viewers are the first step to win this resistance
25Source: Kantar AdReaction 2016 study, 42 countries, 13,000+ interviews globally, over 300 in Greece

But to win in a skippable video context you need to positively engage the audience with
enjoyable content in order to delay the skip
Source: Kantar 26
Smart For Four
“Reverse Parking”
UK Pre Roll
Context
Social
Context
Impact
(Percentile)77 57
Played whole ad 63% 24%
Average of ad
viewed
73%
23 sec
32%
10sec

Generate emotion, try to appeal to all senses, brand early…
27
Generate
an
emotional
response
01Use music
and audio to
engage
02Brand early
and utilise
companion
banners
03If long-form,
keep your
canvas clean
04If short-form,
keep it simple
but not
simplistic
05

And always have in mind your target audience…
28Source: Kantar IAB Tremor Video Cross Screen Study
a/b indicates statistically higher performance at the 90% confidence level
9,510,9
12,6
16-19 y.o. 20-34 y.o. 35-49 y.o.
Observed Skip time among skippers (in seconds)
Based on 12 YouTube ads
635554 52
Brand appeal Persuasion
18-34 Smartphone video ad (T2B %)
10-second (a) 30-second (b)
685961
51
Brand appeal Persuasion
18-34 Tablet video ad (T2B %)
10-second (a) 30-second (b)
49 4360 56
Brand appeal Persuasion
35-54 Smartphone video ad (T2B %)
10-second (a) 30-second (b)
63 6072
64
Brand appeal Persuasion
35-54 Tablet video ad (T2B %)
10-second (a) 30-second (b)

But if you get your YouTube creative right, there are good returns to be enjoyed
Source: Kantar Global MarketNorms Database 2019, n=16,075 studies 29
0%
1%
2%
3%
4%
5%
6%
7%
Online Ad Awareness Message Association Brand Favorability Purchase Intent
YouTube
Average
Average improvement generated in brand KPIs (%)

Kantar and Google joined forces in the YouTube Works Awards to highlight
effective advertising content and campaigns on YouTube
Source: YouTube Works awards 2019 30

Forget about this guy

32
The future of marketing
can look a lot more like this

Thank you!
Giovanni FrascaMedia & Digital Expert