online in-situ interleaved evaluation of real-time push...
TRANSCRIPT

Online In-Situ Interleaved Evaluation ofReal-Time Push Notification Systems
Adam Roegiest, Luchen Tan, and Jimmy LinDavid R. Cheriton School of Computer Science
University of Waterloo, Ontario, Canada{aroegies,luchen.tan,jimmylin}@uwaterloo.ca
ABSTRACTReal-time push noti�cation systems monitor continuous documentstreams such as social media posts and alert users to relevant con-tent directly on their mobile devices. We describe a user study ofsuch systems in the context of the TREC 2016 Real-Time Summa-rization Track, where system updates are immediately deliveredas push noti�cations to the mobile devices of a cohort of users.Our study represents, to our knowledge, the �rst deployment ofan interleaved evaluation framework for prospective informationneeds, and also provides an opportunity to examine user behaviorin a realistic se�ing. Results of our online in-situ evaluation arecorrelated against the results a more traditional post-hoc batchevaluation. We observe substantial correlations between many on-line and batch evaluation metrics, especially for those that sharethe same basic design (e.g., are utility-based). For some metrics,we observe li�le correlation, but are able to identify the volume ofmessages that a system pushes as one major source of di�erences.
1 INTRODUCTION�ere is growing interest in systems that address prospective infor-mation needs against continuous document streams, exempli�edby social media services such as Twi�er. We might imagine a userhaving some number of “interest pro�les” representing prospec-tive information needs, and the system’s task is to automaticallymonitor the stream of documents to keep the user up to date ontopics of interest. For example, a journalist might be interestedin collisions involving autonomous vehicles and wishes to receiveupdates whenever such an event occurs. Although there are a num-ber of ways such updates can be delivered, we consider the casewhere they are immediately pushed to the user’s mobile deviceas noti�cations. At a high level, these push noti�cations must berelevant, novel, and timely.
To date, there have been two formal evaluations of the pushnoti�cation problem, at the TREC 2015 Microblog Track [15] andthe TREC 2016 Real-Time Summarization (RTS) Track [16]. Despitethe obvious real-time nature of this problem, systems have beenassessed with a post-hoc batch evaluation methodology. It seems
Permission to make digital or hard copies of all or part of this work for personal orclassroom use is granted without fee provided that copies are not made or distributedfor pro�t or commercial advantage and that copies bear this notice and the full citationon the �rst page. Copyrights for components of this work owned by others than theauthor(s) must be honored. Abstracting with credit is permi�ed. To copy otherwise, orrepublish, to post on servers or to redistribute to lists, requires prior speci�c permissionand/or a fee. Request permissions from [email protected]’17, August 7–11, 2017, Shinjuku, Tokyo, Japan© 2017 Copyright held by the owner/author(s). Publication rights licensed to ACM.978-1-4503-5022-8/17/08. . .$15.00DOI: h�p://dx.doi.org/10.1145/3077136.3080808
obvious that the push noti�cation task should be evaluated in anonline manner that be�er matches how content is actually deliveredin operational se�ings.
We describe a user study of real-time push noti�cation systemsin the context of the TREC 2016 RTS Track, in which systems’noti�cations are delivered to users’ mobile devices as soon as theyare generated. �is evaluation is online, in contrast to post-hocbatch evaluations, and in-situ, in that the users are going abouttheir daily activities and are interrupted by the systems’ output.Since the RTS Track deployed both this online in-situ methodologyand a more traditional batch methodology, the setup provided uswith an opportunity to compare the results of both.
Contributions. We view our work as having two main contribu-tions: First, we describe, to our knowledge, the �rst user study andactual deployment of an interleaved evaluation for prospective noti-�cations. Our work is based on a previously-proposed interleavingframework [18] that has only been examined in simulation. Wepresent an analysis of user behavior in such an evaluation method-ology and demonstrate that it is workable in practice.
Second, we compare results of our online methodology to a moretraditional batch methodology in the same evaluation. A number ofmetrics for assessing push noti�cation systems have been proposed:we observe substantial correlations between many online and batchmetrics, particularly those that share the same basic design (e.g., areutility-based). �is is a non-obvious �nding, since all judgments inour online methodology are sparse and made locally, with respectto one tweet at a time, whereas the batch evaluation methodologytakes into account all relevant tweets via a global clustering process.�ere are two interpretations of this �nding:
• If one believes in the primacy of user-centered evaluations, ourresults suggest that established batch evaluation metrics are ableto capture user preferences.
• On the other hand, our online evaluation methodology is lessmature than the batch evaluation methodology, which has beenextensively examined over the past several years; its core ideasdate back at least a decade. If one takes this perspective andbelieves in the primacy of the established approach, then ourresults suggest a cheaper way to conduct evaluation of pushnoti�cations systems that yield similar conclusions.
Despite substantial correlations between many online and batchmetrics, there are some metrics that exhibit no meaningful cor-relation. We observe that systems vary widely in the volume ofmessages they push, and that this is the biggest source of metricdisagreement. We do not believe that the proper role of messagevolume in evaluating push noti�cation systems is fully understood,but this paper elucidates key issues as an important �rst step.
Session 4A: Evaluation 2 SIGIR’17, August 7-11, 2017, Shinjuku, Tokyo, Japan
415

2 BACKGROUND AND RELATEDWORKWork on prospective information needs against document streamsdates back at least a few decades and is closely related to ad hoc doc-ument retrieval [6]. Major initiatives in the 1990s include the TRECFiltering Tracks, which ran from 1995 [13] to 2002 [21], and theresearch program commonly known as topic detection and tracking(TDT) [2]. �e TREC Filtering Tracks are best understood as binaryclassi�cation on every document in the collection with respect tostanding queries, and TDT is similarly concerned with identifyingall documents related to a particular event—with an intelligenceanalyst in mind. In contrast, we are focused on identifying a smallset of the most relevant updates to deliver to users—any more thana handful of noti�cations per day would surely be annoying. Fur-thermore, in both TREC Filtering and TDT, systems must makeonline decisions as soon as documents arrive. In the case of pushnoti�cations, systems can choose to push older content, thus givingrise to the possibility of algorithms operating on bounded bu�ers.Latency is one aspect of the evaluation, allowing systems to tradeo� output quality with timeliness.
More recently, Guo et al. [8] introduced the temporal summariza-tion task, whose goal is to generate concise update summaries fromnews sources about unexpected events as they develop. �is hasbeen operationalized in the TREC Temporal Summarization (TS)Tracks from 2013 to 2015 [4]. �e task is closely related to the pushnoti�cation problem that we study, and in fact the TREC Real-TimeSummarization Track, which provides the context for our work,represents a merger of the TS and Microblog Tracks. However,nearly all previous evaluations, including TDT, TREC Filtering, andTemporal Summarization, merely simulated the streaming natureof the document collection, whereas in RTS the participants wererequired to build working systems that operated on tweets postedin real time (more details in Section 3).
Our online in-situ evaluation framework builds on growing in-terest in so-called Living Labs [22, 24] and related Evaluation-as-a-Service (EaaS) [9] approaches that a�empt to be�er align evaluationmethodologies with user task models and real-world constraints toincrease the �delity of research experiments. In this respect, ourcomparison between user-oriented and batch evaluations ties intoa long history of research that examines the correlation betweene�ectiveness metrics from system-oriented evaluations and metricsfrom user-oriented evaluations [1, 3, 10, 23, 26, 29–31]. �ere is,however, one important di�erence: all of these cited papers, withone exception [31], focus on ad hoc retrieval, which has receivedmuch a�ention over the years. Although there have been previ-ous user studies on push noti�cations from the HCI perspective(e.g., [17]), there is relatively li�le empirical work on prospectiveinformation needs that we can draw from.
�e �nal thread of relevant work concerns interleaved evalu-ations [7, 11, 19, 20, 25], which have emerged as the preferredapproach to evaluating web search engines over traditional A/Btesting [12]. Our work departs from this large body of literaturebecause these papers all focus on web search ranking, whereas wetackle the push noti�cation problem: in our task, systems musttake into account temporality and redundancy, both of which areless important in web search. �e length of system output (i.e.,volume of pushed messages) is another major di�erence between
our task and web ranking. �ese issues were explored in a recentpaper by Qian et al. [18], who extended the interleaved evaluationmethodology to retrospective and prospective information needson document streams. However, their proposed approach was onlyvalidated in simulation. We take the next step by deploying anadapted version of their proposed technique in a live user study.
3 EVALUATION METHODOLOGYAlthough the push noti�cation problem is applicable to documentstreams in general, we focus on social media posts: the public natureof Twi�er makes tweets the ideal source for shared evaluations. Inparticular, Twi�er provides a streaming API through which clientscan obtain a sample (approximately 1%) of public tweets—this levelof access is available to anyone who signs up for an account. Inorder to evaluate push noti�cation systems in a realistic se�ing,the TREC 2016 RTS Track de�ned an o�cial evaluation periodduring which all participants “listened” to the tweet sample streamto identify relevant and novel tweets with respect to users’ interestpro�les in a timely manner. �e evaluation period began Tuesday,August 2, 2016 00:00:00 UTC and lasted until �ursday, August 11,2016 23:59:59 UTC.
Interest pro�les, which represent users’ information needs, fol-lowed the standard TREC ad hoc topic format of “title”, “description”,and “narrative”. �ese were made available to all participants afew weeks prior to the beginning of the evaluation period. Giventhe prospective nature of the pro�les, it is di�cult to anticipatewhat topics will be discussed during the evaluation period and whatevents will be “interesting”. Instead, the organizers adopted thestrategy of “overgenerate and cull”: in total, 203 interest pro�leswere provided to the participants, more than there were resourcesavailable for assessment, with the anticipation of le�ing users de-cide what pro�les should be assessed (more details below).
3.1 Online Evaluation Setup�e TREC 2016 RTS Track contained two separate tasks: pushnoti�cations (so-called “Scenario A”) and email digests (so-called“Scenario B”). In this paper we are only concerned with push no-ti�cations, but for more details we refer the reader to the trackoverview [16].
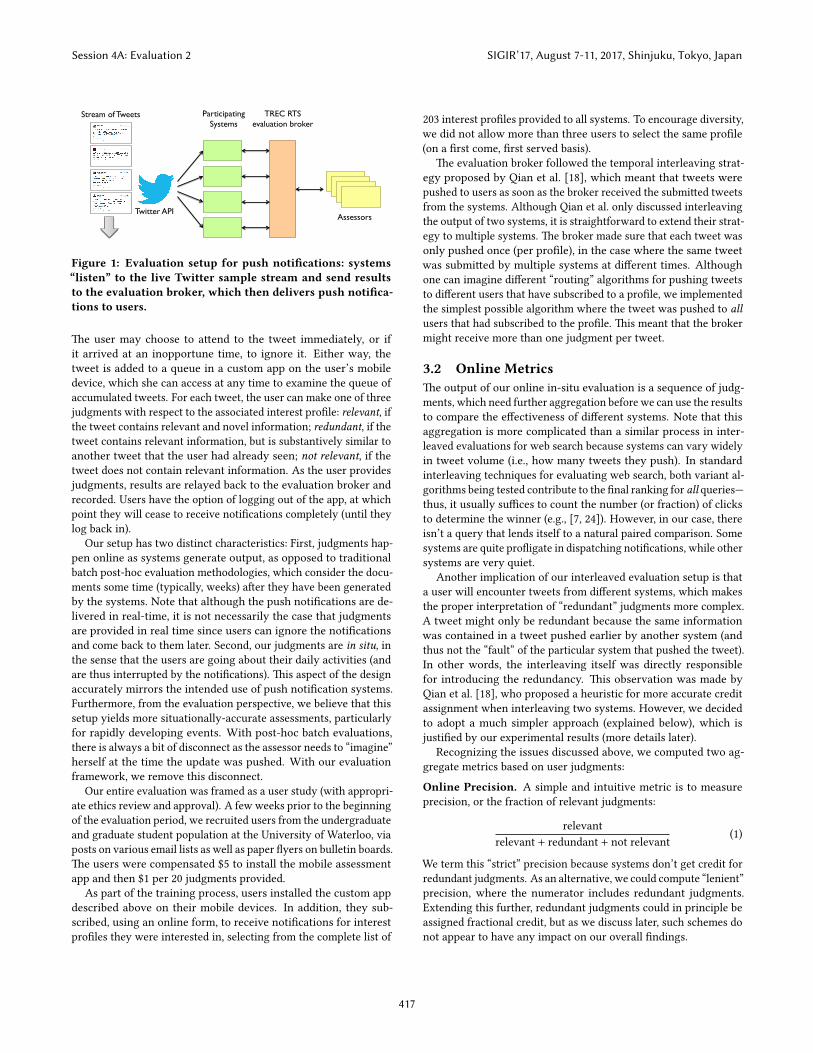
�e overall evaluation framework is shown in Figure 1. Beforethe evaluation period, participants “registered” their systems withthe evaluation broker to request unique tokens (via a REST API),which are used in subsequent requests to associate submi�ed tweetswith speci�c systems.1 During the evaluation period, whenever asystem identi�ed a relevant tweet with respect to an interest pro�le,the system submi�ed the tweet id to the evaluation broker (alsovia a REST API), which recorded the submission time. Each systemwas allowed to push at most ten tweets per interest pro�le per day;this limit represents an a�empt to model user fatigue.
Once the evaluation broker recorded a system’s submission, thetweet was immediately delivered to the mobile devices of a groupof users, where it was rendered as a push noti�cation containingboth the text of the tweet and the corresponding interest pro�le.
1As is standard in TREC, each participant was permi�ed to submit multiple“runs” (usually system variants), but for the purposes of this discussion werefer to them as di�erent systems.
Session 4A: Evaluation 2 SIGIR’17, August 7-11, 2017, Shinjuku, Tokyo, Japan
416
Stream of Tweets Participating Systems
TREC RTS evaluation broker
Twitter APIAssessors
Figure 1: Evaluation setup for push noti�cations: systems“listen” to the live Twitter sample stream and send resultsto the evaluation broker, which then delivers push noti�ca-tions to users.
�e user may choose to a�end to the tweet immediately, or ifit arrived at an inopportune time, to ignore it. Either way, thetweet is added to a queue in a custom app on the user’s mobiledevice, which she can access at any time to examine the queue ofaccumulated tweets. For each tweet, the user can make one of threejudgments with respect to the associated interest pro�le: relevant, ifthe tweet contains relevant and novel information; redundant, if thetweet contains relevant information, but is substantively similar toanother tweet that the user had already seen; not relevant, if thetweet does not contain relevant information. As the user providesjudgments, results are relayed back to the evaluation broker andrecorded. Users have the option of logging out of the app, at whichpoint they will cease to receive noti�cations completely (until theylog back in).
Our setup has two distinct characteristics: First, judgments hap-pen online as systems generate output, as opposed to traditionalbatch post-hoc evaluation methodologies, which consider the docu-ments some time (typically, weeks) a�er they have been generatedby the systems. Note that although the push noti�cations are de-livered in real-time, it is not necessarily the case that judgmentsare provided in real time since users can ignore the noti�cationsand come back to them later. Second, our judgments are in situ, inthe sense that the users are going about their daily activities (andare thus interrupted by the noti�cations). �is aspect of the designaccurately mirrors the intended use of push noti�cation systems.Furthermore, from the evaluation perspective, we believe that thissetup yields more situationally-accurate assessments, particularlyfor rapidly developing events. With post-hoc batch evaluations,there is always a bit of disconnect as the assessor needs to “imagine”herself at the time the update was pushed. With our evaluationframework, we remove this disconnect.
Our entire evaluation was framed as a user study (with appropri-ate ethics review and approval). A few weeks prior to the beginningof the evaluation period, we recruited users from the undergraduateand graduate student population at the University of Waterloo, viaposts on various email lists as well as paper �yers on bulletin boards.�e users were compensated $5 to install the mobile assessmentapp and then $1 per 20 judgments provided.
As part of the training process, users installed the custom appdescribed above on their mobile devices. In addition, they sub-scribed, using an online form, to receive noti�cations for interestpro�les they were interested in, selecting from the complete list of
203 interest pro�les provided to all systems. To encourage diversity,we did not allow more than three users to select the same pro�le(on a �rst come, �rst served basis).
�e evaluation broker followed the temporal interleaving strat-egy proposed by Qian et al. [18], which meant that tweets werepushed to users as soon as the broker received the submi�ed tweetsfrom the systems. Although Qian et al. only discussed interleavingthe output of two systems, it is straightforward to extend their strat-egy to multiple systems. �e broker made sure that each tweet wasonly pushed once (per pro�le), in the case where the same tweetwas submi�ed by multiple systems at di�erent times. Althoughone can imagine di�erent “routing” algorithms for pushing tweetsto di�erent users that have subscribed to a pro�le, we implementedthe simplest possible algorithm where the tweet was pushed to allusers that had subscribed to the pro�le. �is meant that the brokermight receive more than one judgment per tweet.
3.2 Online Metrics�e output of our online in-situ evaluation is a sequence of judg-ments, which need further aggregation before we can use the resultsto compare the e�ectiveness of di�erent systems. Note that thisaggregation is more complicated than a similar process in inter-leaved evaluations for web search because systems can vary widelyin tweet volume (i.e., how many tweets they push). In standardinterleaving techniques for evaluating web search, both variant al-gorithms being tested contribute to the �nal ranking for all queries—thus, it usually su�ces to count the number (or fraction) of clicksto determine the winner (e.g., [7, 24]). However, in our case, thereisn’t a query that lends itself to a natural paired comparison. Somesystems are quite pro�igate in dispatching noti�cations, while othersystems are very quiet.
Another implication of our interleaved evaluation setup is thata user will encounter tweets from di�erent systems, which makesthe proper interpretation of “redundant” judgments more complex.A tweet might only be redundant because the same informationwas contained in a tweet pushed earlier by another system (andthus not the “fault” of the particular system that pushed the tweet).In other words, the interleaving itself was directly responsiblefor introducing the redundancy. �is observation was made byQian et al. [18], who proposed a heuristic for more accurate creditassignment when interleaving two systems. However, we decidedto adopt a much simpler approach (explained below), which isjusti�ed by our experimental results (more details later).
Recognizing the issues discussed above, we computed two ag-gregate metrics based on user judgments:Online Precision. A simple and intuitive metric is to measureprecision, or the fraction of relevant judgments:
relevantrelevant + redundant + not relevant (1)
We term this “strict” precision because systems don’t get credit forredundant judgments. As an alternative, we could compute “lenient”precision, where the numerator includes redundant judgments.Extending this further, redundant judgments could in principle beassigned fractional credit, but as we discuss later, such schemes donot appear to have any impact on our overall �ndings.
Session 4A: Evaluation 2 SIGIR’17, August 7-11, 2017, Shinjuku, Tokyo, Japan
417
Two minor details are worth mentioning for the proper inter-pretation of this metric: First, tweets may be judged multiple timessince a tweet is pushed to all users who had subscribed to the pro-�le. For simplicity, all judgments are included in our calculation.Second, our precision computation represents a micro-average (andnot an average across per-pro�le precision). �is choice was madedue to the sparsity of judgments: macro-averaging would magnifythe e�ects of pro�les with few judgments.Online Utility. As an alternative to online precision, we could takea utility-based perspective and measure the total gain received bythe user. �e simplest method would be to compute the following:
relevant − redundant − not relevant (2)
which we refer to as the “strict” variant of online utility. Parallelingthe precision variants above, we de�ne a “lenient” version of themetric as follows:
(relevant + redundant) − not relevant (3)
Of course, we could further generalize with weights for each typeof judgment. However, we lack the empirical basis for se�ingthe weights. Furthermore, experimental analyses show that our�ndings are insensitive to weight se�ings.To summarize: from user judgments, we compute two aggregatemetrics—online precision and online utility. Note that there is nogood way to compute a recall-oriented metric since we have nocontrol over when and how frequently user judgments are provided.�is is a fundamental limitation of this type of user study.
3.3 Batch Evaluation SetupIn order to mitigate the risk inherent in any new evaluation method-ology, the TREC 2016 RTS Track also deployed a more traditionalpost-hoc batch evaluation methodology—speci�cally, the approachdeveloped for the Tweet Timeline Generation (TTG) task at theTREC 2014 Microblog Track [14], which was also used in 2015 [15].�e methodology has been externally validated [31] and can beconsidered mature due to its deployment in multiple formal evalu-ations. �e assessment work�ow proceeded in two major stages:relevance assessment and semantic clustering. Here we provideonly a brief overview, referring the reader to the cited papers abovefor additional details.
Tweets returned by participating systems were judged for rele-vance by NIST assessors via pooling. Note that this occurred a�erthe live evaluation period ended, so it was possible to gather alltweets pushed by all participating systems. NIST assessors began afew days a�er the end of the evaluation period to minimize the “stal-eness” of tweets. Each tweet was assigned one of three judgments:not relevant, relevant, or highly-relevant. A�er the relevance assess-ment process, the NIST assessors proceeded to perform semanticclustering on only the relevant and highly-relevant tweets. Using acustom interface, they grouped tweets into clusters in which tweetsshare substantively similar content, or more colloquially, “say thesame thing”. �e interpretation of what this means operationallywas le� to the discretion of the assessor. In particular, they were notgiven a particular target number of clusters to form; rather, theywere asked to use their judgment, considering both the interestpro�le and the actual tweets. �e output of the cluster annotation
process is a list of tweet clusters; each cluster contains tweets thatare assumed to convey the same information.
3.4 Batch Evaluation MetricsAs previously discussed, push noti�cations should be relevant, non-redundant, and timely. One challenge, however, is that there isli�le empirical work on how users perceive timeliness. �erefore,instead of devising a single-point metric that tries to combine allthree characteristics, the organizers decided to separately captureoutput quality (relevance and redundancy) and timeliness (latency).In this paper, we only focus on output quality metrics. In short,RTS batch evaluation metrics a�empt to capture precision, recall,and overall utility. We elaborate below:Expected Gain (EG) for an interest pro�le on a particular day isde�ned as 1
N∑G(t ), where N is the number of tweets returned and
G(t ) is the gain of each tweet: not relevant tweets receive a gain of 0;relevant tweets receive a gain of 0.5; highly-relevant tweets receivea gain of 1.0. Once a tweet from a cluster is retrieved, all other tweetsfrom the same cluster automatically become not relevant. �ispenalizes systems for returning redundant information. Expectedgain can be interpreted as a precision metric.Normalized Cumulative Gain (nCG) for an interest pro�le ona particular day is de�ned as 1
Z
∑G(t ), whereZ is the maximumpossible gain (given the ten tweet per day limit). �e gain of eachindividual tweet is computed in the same way as above. Note thatgain is not discounted (as in nDCG) because the notion of documentranks is not meaningful in this context. We can interpret nCG as arecall-like metric.�e score for a run is the average over scores for each day overall interest pro�les. An interesting question is how scores shouldbe computed for days in which there are no relevant tweets: forrhetorical convenience, we call days in which there are no relevanttweets for a particular interest pro�le (in the pool) “silent days”,in contrast to “eventful days” (when there are relevant tweets). Inthe EG-1 and nCG-1 variants of the metrics, on a silent day, thesystem receives a score of one (i.e., a perfect score) if it does notpush any tweets, or a score of zero otherwise. In the EG-0 andnCG-0 variants of the metrics, for a silent day, all systems receive again of zero no ma�er what they do. For more details about thisdistinction, see Tan et al. [28].
�erefore, under EG-1 and nCG-1, systems are rewarded forrecognizing that there are no relevant tweets for an interest pro�leon a particular day and remaining silent (i.e., the system does notpush any tweets). �e EG-0 and nCG-0 variants of the metrics donot reward recognizing silent days: that is, it never hurts to pushtweets. We show later in our analyses that EG-0 and nCG-0 arepoorly-formulated metrics.Gain Minus Pain (GMP) is de�ned as α ·∑G − (1−α ) · P , whereG (gain) is computed in the same manner as above, pain P is thenumber of non-relevant tweets that the system pushed, and αcontrols the balance of weights between the two. We investigatedthreeα se�ings: 0.33, 0.50, and 0.66. Note that this metric is the sameas the linear utility metrics used in the TREC Filtering [13, 21] andMicroblog [27] Tracks, although our formulation takes a slightlydi�erent mathematical form.
Session 4A: Evaluation 2 SIGIR’17, August 7-11, 2017, Shinjuku, Tokyo, Japan
418
�
���
���
���
���
����
����
����
����
����
� � �� �� �� �� �� �� �� �� �� �� ��
���
��������
�� �
�������
����������� � ��� ���� ������ ������
�
����
����
����
����
����
����
� � � � � � � � ��
���
��������
�� �
�������
����������� � ��� ���� ������ �� �������
�
����
����
����
����
����
����
����
���
���
� �� �� �� �� �� ��
���
��������
�� �
�������
����������� � ��� ���� ������ �����
�
����
����
����
����
�����
�����
� � � � � � � � �� �� �� ��
���
��������
�� �
�����
����������� � ��� ���� �����
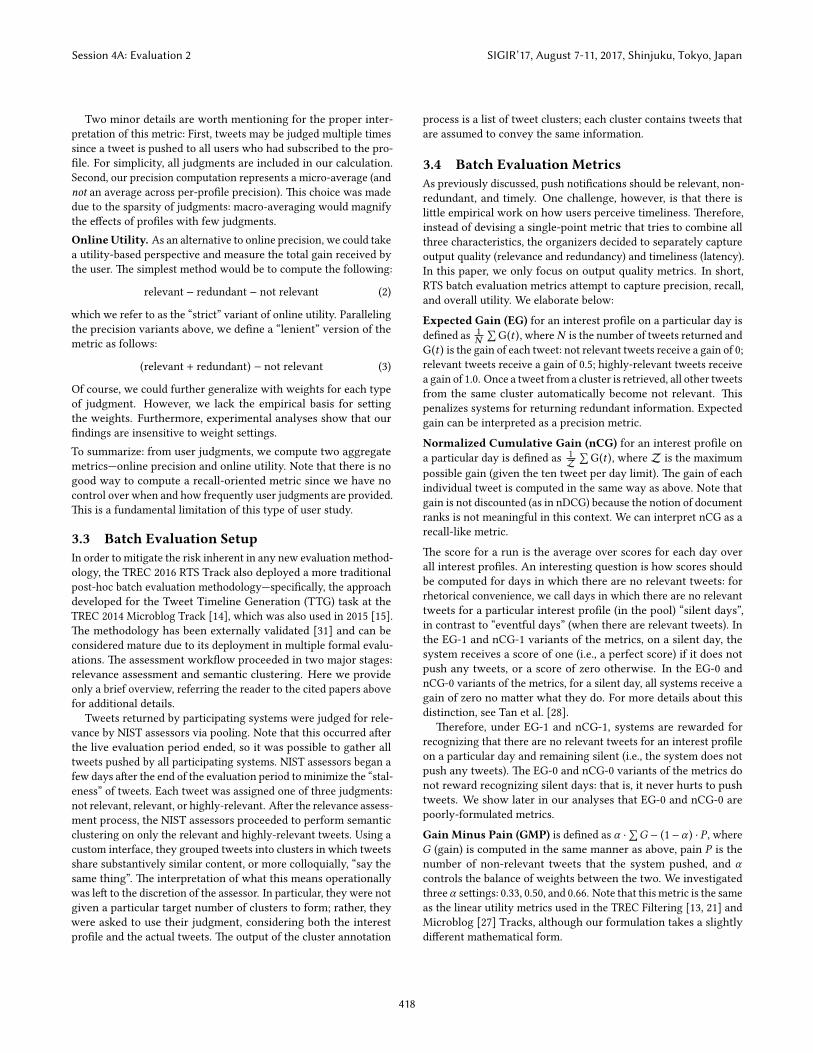
Figure 2: Distribution of response times over the �rst minute (14.3%), �rst tenminutes (44.9%), �rst hour (71.3%), and across theentire evaluation period. Percentages in parentheses show how many judgments were received in the corresponding period.
User Judgments Pro�les Messages Response1 53 4 1619 3.27%2 3305 10 7141 46.28%3 136 10 5860 2.32%4 327 8 3795 8.62%5 949 12 6330 14.99%6 28 12 7211 0.39%7 281 10 4162 6.75%8 1908 15 7754 24.61%9 3791 33 16654 22.76%
10 680 16 7257 9.37%11 107 43 22676 0.47%12 324 2 938 34.54%13 226 12 7058 3.20%
Table 1: User statistics. For each user, columns show thenumber of judgments provided, the number of interest pro-�les subscribed to, the maximum number of push noti�ca-tions received, and the response rate.
To summarize: we have multiple batch metrics for evaluating pushnoti�cation systems: EG-1 and EG-0 (both of which measure preci-sion), nCG-1 and nCG-0 (both of which measure recall), and GMPwith α = {0.33, 0.50, 0.66} (which capture utility).
4 USER BEHAVIOR�e evaluation methodology for push noti�cations detailed abovewas deployed in the TREC 2016 Real-Time Summarization Track.In total, 18 groups from around the world participated, submi�inga total of 41 systems (runs). Over the evaluation period, theseruns pushed a total of 161,726 tweets, or 95,113 unique tweets a�erde-duplicating within pro�les.
To simplify app development, we only targeted users of Androiddevices. For our evaluation, we recruited a total of 18 users, 13of whom ultimately provided judgments. Of these, 11 were eithergraduates or undergraduate students at the University of Waterloo.In total, we received 12,115 judgments over the assessment period,with a minimum of 28 and a maximum of 3,791 by an individualuser. Overall, 122 interest pro�les received at least one judgment;93 received at least 10 judgments; 67 received at least 50 judgments;44 received at least 100 judgments.
We begin with descriptive characterizations of user behavior: abreakdown is shown in Table 1. �e second column lists the num-ber of judgments each user provided and the third column shows
00 01 02 03 04 05 06 07 08 09 10 11 12 13 14 15 16 17 18 19 20 21 22 23Hour
8/02
8/03
8/04
8/05
8/06
8/07
8/08
8/09
8/10
8/11
Day
Distribution of Notifications and Judgments
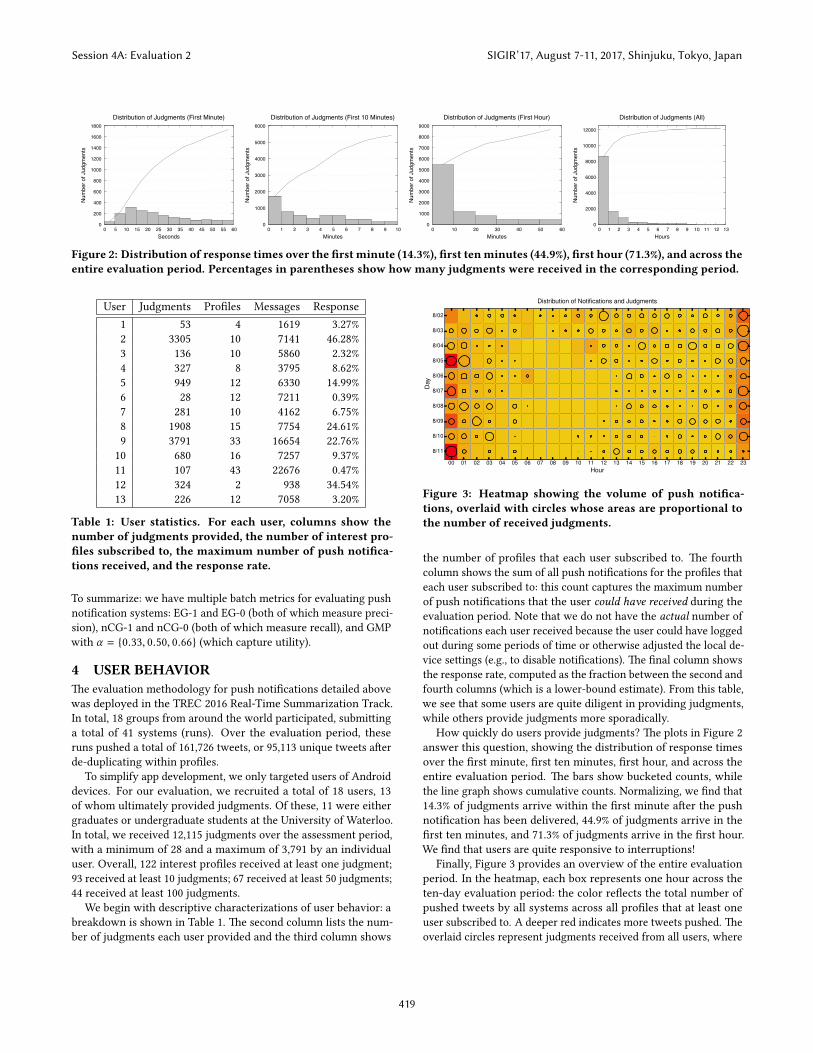
Figure 3: Heatmap showing the volume of push noti�ca-tions, overlaid with circles whose areas are proportional tothe number of received judgments.
the number of pro�les that each user subscribed to. �e fourthcolumn shows the sum of all push noti�cations for the pro�les thateach user subscribed to: this count captures the maximum numberof push noti�cations that the user could have received during theevaluation period. Note that we do not have the actual number ofnoti�cations each user received because the user could have loggedout during some periods of time or otherwise adjusted the local de-vice se�ings (e.g., to disable noti�cations). �e �nal column showsthe response rate, computed as the fraction between the second andfourth columns (which is a lower-bound estimate). From this table,we see that some users are quite diligent in providing judgments,while others provide judgments more sporadically.
How quickly do users provide judgments? �e plots in Figure 2answer this question, showing the distribution of response timesover the �rst minute, �rst ten minutes, �rst hour, and across theentire evaluation period. �e bars show bucketed counts, whilethe line graph shows cumulative counts. Normalizing, we �nd that14.3% of judgments arrive within the �rst minute a�er the pushnoti�cation has been delivered, 44.9% of judgments arrive in the�rst ten minutes, and 71.3% of judgments arrive in the �rst hour.We �nd that users are quite responsive to interruptions!
Finally, Figure 3 provides an overview of the entire evaluationperiod. In the heatmap, each box represents one hour across theten-day evaluation period: the color re�ects the total number ofpushed tweets by all systems across all pro�les that at least oneuser subscribed to. A deeper red indicates more tweets pushed. �eoverlaid circles represent judgments received from all users, where
Session 4A: Evaluation 2 SIGIR’17, August 7-11, 2017, Shinjuku, Tokyo, Japan
419

�
���
���
���
���
���
���
� ���� ���� ���� ��� ����� �����
�������������
����� �����
�����
�����
�����
����
����
����
����
�
���
� ���� ���� ���� ���� ����� �����
�������������
����� �����
�����
�����
�����
����
����
����
����
�
���
� ��� ��� �� ��� �� ���
�������������
������ �������
Figure 4: Analyses of online metrics. �e le� and middle plots show tweet volume vs. online precision and online utility. �eright plot shows almost no correlation between online precision and online utility because systems with roughly the sameonline precision can vary widely in push volume.
the area is proportional to the number of judgments. Note thattime is given in UTC; for reference, 00:00:00 UTC translates into20:00:00 in the local time zone of the users.
A few interesting observations follow: we �nd that relativelymore tweets are pushed by systems in the �rst and �nal hoursof each day. We believe that this is mostly an evaluation artifact:recall that each system receives a quota of ten tweets per day perpro�le. At the beginning of each day (hour 00), the quota resets—thus allowing systems that have used up their quota the previousday to start pushing noti�cations again. At the end of each day(hour 23), we believe that the rise in tweets corresponds to systems“using up” the remainder of their quota.
Looking at the circles, which represent the volume of judgments,we see that they mostly line up with the push volume. �at is, darkerred cells generally have larger circles—the more tweets systemspush, the more judgments we receive. However, there are somedeviations, which represent delayed judgments—for example, aburst of tweets that wasn’t examined until some time later. It isalso interesting to note that with the exception of night time whenusers are asleep, there does not appear to be a consistent diurnalcycle across our population of users. �e users are exposed to apre�y constant stream of push noti�cations throughout the day(and indeed during sleeping hours also), but there doesn’t appear tobe a time of the day when we consistently receive more judgments.
5 ANALYSISBy design, the TREC 2016 RTS Track employed both the onlinein-situ interleaved evaluation methodology as well as the moretraditional post-hoc batch evaluation methodology. �is means thatfor the same systems and interest pro�les, we have independently-derived metrics from two very di�erent approaches. For the batchmetrics, NIST assessors fully judged 56 interest pro�les (relevancejudgments and clusters). Section 3.3 and Section 3.4 provide anoverview, but since this is not the focus of our work, we refer thereader to details provided in the track overview [16].
We begin by presenting separate analyses of online and batchmetrics, and then describe results of correlation analyses betweenthem. In particular, comparing online and batch metrics allows usto explore two questions: From the perspective of the user, do userpreferences correlate with batch metrics? From the perspectiveof system-centered evaluations, can unreliable online judgmentsreplace high-quality NIST assessors?
In considering the online metrics, there is a question regardingwhich metric to use—the “strict” or “lenient” variant of online pre-cision and online utility (see Section 3.2). We performed analyseswith both: All plots look very similar, except for systematic shi�sdue to the metric variants; for example, all the absolute precisionvalues increase from “strict” to “lenient” precision, but the overallrelationships between the points remain largely unchanged. �ere-fore, we only report the “strict” variants here for brevity. �is alsosuggests that the credit assignment heuristic of Qian et al. [18],which lies somewhere between the strict and lenient variants, isalso unlikely to alter our �ndings.
5.1 Online Metrics�ree di�erent analyses of the online metrics are shown in Figure 4.We organize our �ndings around two themes:Precision is an intrinsic metric of push noti�cation quality, whileutility is a convenient composite metric. Online precision computesthe fraction of relevant user judgments, but does not factor in thevolume of tweets that a system pushes. Online utility implies aparticular precision target with volume as a scaling factor, and thusserves as a convenient composite metric. To see why this is so,consider a system that achieves a precision of 0.5: se�ing asiderelevance grades for now, the expected utility per tweet is zero (forα = 0.5) and the overall expected utility is also zero, regardlessof how many tweets the system pushes. A system with lowerprecision has a negative expected utility per tweet, and the totalexpected utility is simply that value multiplied by the volume oftweets. Since the precision of most systems in the evaluation fallsbelow 0.5, we observe a strong negative correlation between tweetvolume and utility: this can be clearly seen in the middle plot inFigure 4, which shows tweet volume against online utility. Here,volume is measured as the number of tweets pushed by the systemfor all interest pro�les that received at least one judgment.
Our argument can be generalized to other ways of computingutility. Of course, one could assign di�erent weights to non-relevanttweets, but for every weighting scheme, there is an implied preci-sion at which the expected utility per tweet is zero. Only systemsthat have higher precision can provide positive utility; otherwise,negative utility is directly proportional to push volume. �e sameidea can be straightforwardly extended to relevance grades: allutility-based metrics encode (at least implicitly) a breakeven pointbetween “good” results and “bad” results.
Session 4A: Evaluation 2 SIGIR’17, August 7-11, 2017, Shinjuku, Tokyo, Japan
420

�
����
����
����
����
����
����
� ��� ���� ���� ���� ���� ���� ���� ����
����
����� �����
�
����
���
����
���
����
� ��� ���� ���� ���� ���� ���� ���� ����
�����
����� �����
�
����
���
����
���
����
���
� ���� ��� ���� ��� ���� ���
�����
����
Figure 5: Analyses of batchmetrics. �e le� andmiddle plots show tweet volume vs. EG-0 and nCG-0, illustrating the dominante�ect of tweet volume, which is a major �aw in those metrics. �e right plot shows a strong correlation between EG-1 andnCG-1 (with the exception of a few outliers).
Tweet volume is an independent and important measure of systemoutput. Building on the previous observation, the independence oftweet volume and precision can be clearly seen in the right plot ofFigure 4, where we observe almost no relationship between onlineprecision and online utility. �is is further reinforced in the le�plot, which shows tweet volume vs. online precision. Although weobserve a negative correlation overall, the e�ect is primarily dueto outliers. If we focus only on systems with tweet volume under2000, there is li�le correlation between online precision and volume.In particular, in the band from 0.3 to 0.4 precision, systems varywidely in volume. �is leads to the wide spread of precision valuesfor systems that have similar utility in the right plot. �us, fromthe user perspective, we believe that online precision and tweetvolume are the two fundamental inputs to metrics for measuringsystem e�ectiveness.
5.2 Batch MetricsAnalyses of batch metrics are shown in Figure 5. Our two main�ndings are as follows:EG-0 and nCG-0 are �awed metrics. Recall that these variants do notreward systems for recognizing that there is no relevant informationand staying silent, and thus it never hurts to push noti�cations.As a result, these two metrics reward systems that push a largevolume of tweets without necessarily di�erentiating the quality ofthose tweets. �is is most evident in the middle plot in Figure 5,which shows tweet volume against nCG-0. Tweet volume here ismeasured as the total number of tweets pushed across the interestpro�les that were evaluated by NIST assessors. Due to the muchmore involved batch evaluation methodology, the NIST assessorsconsidered a smaller set of interest pro�les than users in the onlineevaluation, and thus the plots report smaller tweet volumes. Whileit is possible to push a large number of non-relevant tweets (bo�omright corner of the middle plot), in general, the more tweets a systempushes, the higher its nCG-0 score.
We note a similar e�ect for EG-0, although less pronounced,from the le� plot in Figure 5, which shows tweet volume againstEG-0. Once again, disregarding the outliers in the bo�om rightcorner, higher tweet volumes correlate with higher EG-0 scores.Since under EG-0 all systems receive EG scores of zero for silentdays when there are no relevant tweets, it never hurts to “guess” bypushing tweets. �us, we believe that EG-0 and nCG-0 are �awedmetrics since it is unlikely that users desire high-volume systems
that push tweets of questionable quality. We advocate that thesemetrics be dropped in future evaluations, and we remove EG-0 andnCG-0 from subsequent analyses in this paper.EG-1 and nCG-1 are highly correlated. �is correlation can be seenin the right plot in Figure 5. In contrast to EG-0 and nCG-0, thesemetrics reward systems for remaining silent on days when there isno relevant content. �e plot shows that systems with higher gain(utility) also tend to achieve higher precision.
It is interesting to observe that such a strong correlation existsbetween EG-1 and nCG-1, since EG is quite similar to precisionand nCG is recall-like: in principle, systems could make tradeo�salong these two dimensions independently. However, this mightsimply be a statement about the current state of push noti�cationtechniques. Nevertheless, we do observe some outliers: the groupof runs around 0.06 in EG-1 and around 0.2 in nCG-1 are those thatpush a high volume of tweets. What they lack in the overall qualityof individual tweets, they make up in volume, leading to highernCG-1 than their EG-1 scores would otherwise suggest (i.e., thepoints lie above the trend).
5.3 Online vs. Batch MetricsSca�er plots correlating various batch metrics against online utilityand online precision are shown in Figure 6. In the top row weshow correlations between EG-1, nCG-1, and GMP (α = 0.50)against online utility; in the bo�om row, the same metrics againstonline precision. Note that we removed EG-0 and nCG-0 fromconsideration given the discussion above. For GMP, the choice ofα does not change the shape of the plots and does not a�ect ourconclusions, so for brevity we omit GMP with α = {0.33, 0.66}.
When performing correlational studies on retrieval experiments,outlier runs may have a disproportional in�uence on the results.For example, poor performing systems are easy to distinguish, andmost metrics can easily identify poor systems. �erefore, includingsuch systems tends to increase correlations in ways that are notparticularly helpful in discriminating systems that are not outliers.�e outliers in our case are systems that push a large volume oftweets and those that push very few tweets. From Figure 4 andFigure 5 we can identify the outliers as those runs that push morethan 4000 tweets in the online evaluation and more than 1500tweets in the batch evaluation. �ere are eight such systems andboth criteria identify exactly the same systems. On the whole,these are systems that perform poorly. In the plots, we identify
Session 4A: Evaluation 2 SIGIR’17, August 7-11, 2017, Shinjuku, Tokyo, Japan
421
�����
�
����
���
����
���
����
���
����� ����� ����� ��� ��� ���� ���� � ���
����
������ ������� ������� �������� ��� ��������
� � ������ ��������� � � ������ � ��� �� ��������� � � ��!�"
�����
�
����
���
����
���
����
���
����� ����� ����� ��� ��� ���� ���� � ���
�����
������ ������� ������� �������� ��� ��������
� � ������ ��������� � � ������ � �� ��� ��������� � � �����
����
��
����
��
����
��
����
�
���
����� ����� ����� ��� ��� ���� ���� � ���
���������
������ ������� ������� �������� ��� ��������
� � ������ ��������� � � ������ � ������ ��������� � � ��� !
�
����
���
����
���
����
���
� ��� ��� ��� ��� ��� ���
����
������ ������� ����� ��� � ����
�� � ������ �������� � � ������� � ������ �������� � � �����
�
����
���
����
���
����
���
� ��� ��� ��� ��� ��� ���
�����
������ ������� ����� ��� � ����
�� � ������ �������� � � ������� � ��� !� �������� � � �����
����
��
����
��
����
��
����
�
���
� ��� ��� ��� ��� ��� ��
���������
������ ������� ����� ��� � ����
�� � ������ �������� � � ������� � �� � � �������� � � �����
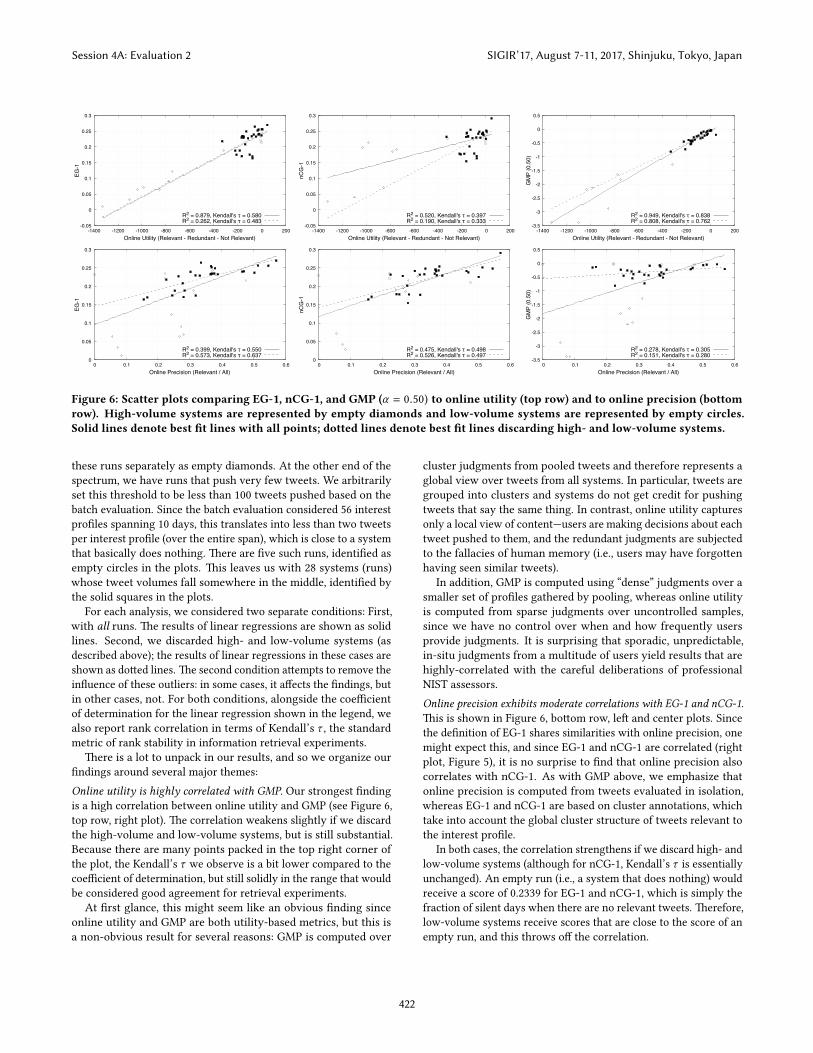
Figure 6: Scatter plots comparing EG-1, nCG-1, and GMP (α = 0.50) to online utility (top row) and to online precision (bottomrow). High-volume systems are represented by empty diamonds and low-volume systems are represented by empty circles.Solid lines denote best �t lines with all points; dotted lines denote best �t lines discarding high- and low-volume systems.
these runs separately as empty diamonds. At the other end of thespectrum, we have runs that push very few tweets. We arbitrarilyset this threshold to be less than 100 tweets pushed based on thebatch evaluation. Since the batch evaluation considered 56 interestpro�les spanning 10 days, this translates into less than two tweetsper interest pro�le (over the entire span), which is close to a systemthat basically does nothing. �ere are �ve such runs, identi�ed asempty circles in the plots. �is leaves us with 28 systems (runs)whose tweet volumes fall somewhere in the middle, identi�ed bythe solid squares in the plots.
For each analysis, we considered two separate conditions: First,with all runs. �e results of linear regressions are shown as solidlines. Second, we discarded high- and low-volume systems (asdescribed above); the results of linear regressions in these cases areshown as do�ed lines. �e second condition a�empts to remove thein�uence of these outliers: in some cases, it a�ects the �ndings, butin other cases, not. For both conditions, alongside the coe�cientof determination for the linear regression shown in the legend, wealso report rank correlation in terms of Kendall’s τ , the standardmetric of rank stability in information retrieval experiments.
�ere is a lot to unpack in our results, and so we organize our�ndings around several major themes:Online utility is highly correlated with GMP. Our strongest �ndingis a high correlation between online utility and GMP (see Figure 6,top row, right plot). �e correlation weakens slightly if we discardthe high-volume and low-volume systems, but is still substantial.Because there are many points packed in the top right corner ofthe plot, the Kendall’s τ we observe is a bit lower compared to thecoe�cient of determination, but still solidly in the range that wouldbe considered good agreement for retrieval experiments.
At �rst glance, this might seem like an obvious �nding sinceonline utility and GMP are both utility-based metrics, but this isa non-obvious result for several reasons: GMP is computed over
cluster judgments from pooled tweets and therefore represents aglobal view over tweets from all systems. In particular, tweets aregrouped into clusters and systems do not get credit for pushingtweets that say the same thing. In contrast, online utility capturesonly a local view of content—users are making decisions about eachtweet pushed to them, and the redundant judgments are subjectedto the fallacies of human memory (i.e., users may have forgo�enhaving seen similar tweets).
In addition, GMP is computed using “dense” judgments over asmaller set of pro�les gathered by pooling, whereas online utilityis computed from sparse judgments over uncontrolled samples,since we have no control over when and how frequently usersprovide judgments. It is surprising that sporadic, unpredictable,in-situ judgments from a multitude of users yield results that arehighly-correlated with the careful deliberations of professionalNIST assessors.Online precision exhibits moderate correlations with EG-1 and nCG-1.�is is shown in Figure 6, bo�om row, le� and center plots. Sincethe de�nition of EG-1 shares similarities with online precision, onemight expect this, and since EG-1 and nCG-1 are correlated (rightplot, Figure 5), it is no surprise to �nd that online precision alsocorrelates with nCG-1. As with GMP above, we emphasize thatonline precision is computed from tweets evaluated in isolation,whereas EG-1 and nCG-1 are based on cluster annotations, whichtake into account the global cluster structure of tweets relevant tothe interest pro�le.
In both cases, the correlation strengthens if we discard high- andlow-volume systems (although for nCG-1, Kendall’s τ is essentiallyunchanged). An empty run (i.e., a system that does nothing) wouldreceive a score of 0.2339 for EG-1 and nCG-1, which is simply thefraction of silent days when there are no relevant tweets. �erefore,low-volume systems receive scores that are close to the score of anempty run, and this throws o� the correlation.
Session 4A: Evaluation 2 SIGIR’17, August 7-11, 2017, Shinjuku, Tokyo, Japan
422
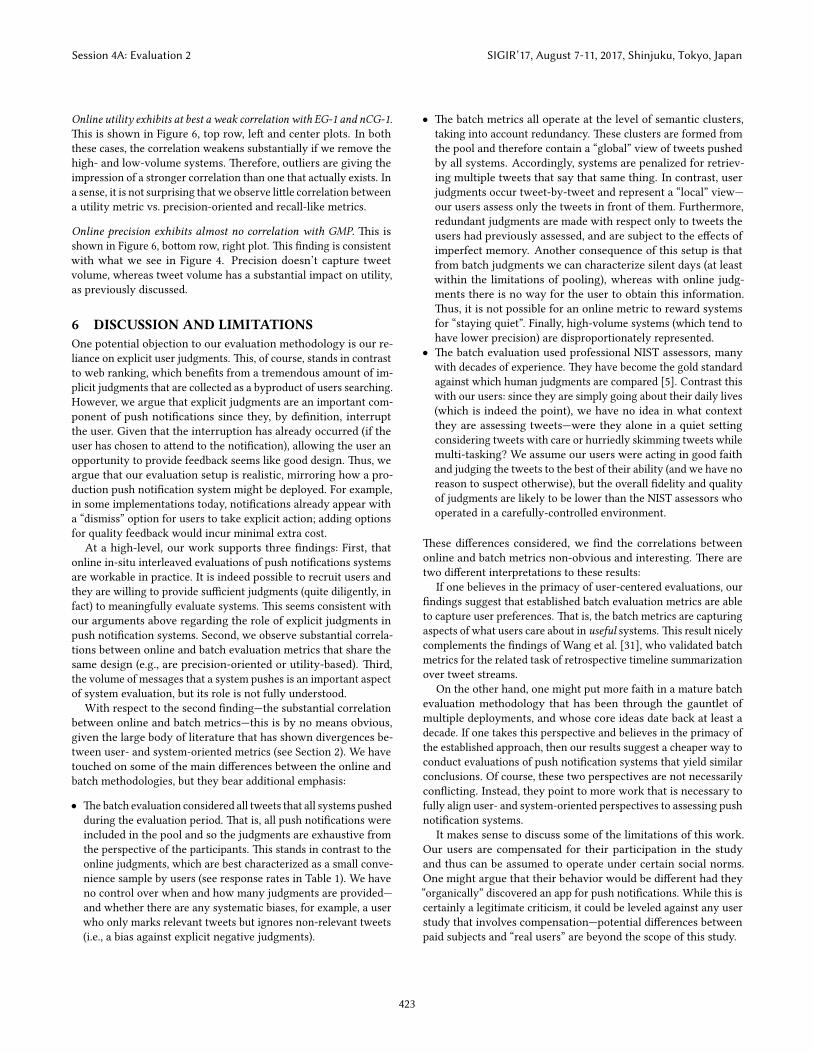
Online utility exhibits at best a weak correlation with EG-1 and nCG-1.�is is shown in Figure 6, top row, le� and center plots. In boththese cases, the correlation weakens substantially if we remove thehigh- and low-volume systems. �erefore, outliers are giving theimpression of a stronger correlation than one that actually exists. Ina sense, it is not surprising that we observe li�le correlation betweena utility metric vs. precision-oriented and recall-like metrics.
Online precision exhibits almost no correlation with GMP. �is isshown in Figure 6, bo�om row, right plot. �is �nding is consistentwith what we see in Figure 4. Precision doesn’t capture tweetvolume, whereas tweet volume has a substantial impact on utility,as previously discussed.
6 DISCUSSION AND LIMITATIONSOne potential objection to our evaluation methodology is our re-liance on explicit user judgments. �is, of course, stands in contrastto web ranking, which bene�ts from a tremendous amount of im-plicit judgments that are collected as a byproduct of users searching.However, we argue that explicit judgments are an important com-ponent of push noti�cations since they, by de�nition, interruptthe user. Given that the interruption has already occurred (if theuser has chosen to a�end to the noti�cation), allowing the user anopportunity to provide feedback seems like good design. �us, weargue that our evaluation setup is realistic, mirroring how a pro-duction push noti�cation system might be deployed. For example,in some implementations today, noti�cations already appear witha “dismiss” option for users to take explicit action; adding optionsfor quality feedback would incur minimal extra cost.
At a high-level, our work supports three �ndings: First, thatonline in-situ interleaved evaluations of push noti�cations systemsare workable in practice. It is indeed possible to recruit users andthey are willing to provide su�cient judgments (quite diligently, infact) to meaningfully evaluate systems. �is seems consistent withour arguments above regarding the role of explicit judgments inpush noti�cation systems. Second, we observe substantial correla-tions between online and batch evaluation metrics that share thesame design (e.g., are precision-oriented or utility-based). �ird,the volume of messages that a system pushes is an important aspectof system evaluation, but its role is not fully understood.
With respect to the second �nding—the substantial correlationbetween online and batch metrics—this is by no means obvious,given the large body of literature that has shown divergences be-tween user- and system-oriented metrics (see Section 2). We havetouched on some of the main di�erences between the online andbatch methodologies, but they bear additional emphasis:
• �e batch evaluation considered all tweets that all systems pushedduring the evaluation period. �at is, all push noti�cations wereincluded in the pool and so the judgments are exhaustive fromthe perspective of the participants. �is stands in contrast to theonline judgments, which are best characterized as a small conve-nience sample by users (see response rates in Table 1). We haveno control over when and how many judgments are provided—and whether there are any systematic biases, for example, a userwho only marks relevant tweets but ignores non-relevant tweets(i.e., a bias against explicit negative judgments).
• �e batch metrics all operate at the level of semantic clusters,taking into account redundancy. �ese clusters are formed fromthe pool and therefore contain a “global” view of tweets pushedby all systems. Accordingly, systems are penalized for retriev-ing multiple tweets that say that same thing. In contrast, userjudgments occur tweet-by-tweet and represent a “local” view—our users assess only the tweets in front of them. Furthermore,redundant judgments are made with respect only to tweets theusers had previously assessed, and are subject to the e�ects ofimperfect memory. Another consequence of this setup is thatfrom batch judgments we can characterize silent days (at leastwithin the limitations of pooling), whereas with online judg-ments there is no way for the user to obtain this information.�us, it is not possible for an online metric to reward systemsfor “staying quiet”. Finally, high-volume systems (which tend tohave lower precision) are disproportionately represented.
• �e batch evaluation used professional NIST assessors, manywith decades of experience. �ey have become the gold standardagainst which human judgments are compared [5]. Contrast thiswith our users: since they are simply going about their daily lives(which is indeed the point), we have no idea in what contextthey are assessing tweets—were they alone in a quiet se�ingconsidering tweets with care or hurriedly skimming tweets whilemulti-tasking? We assume our users were acting in good faithand judging the tweets to the best of their ability (and we have noreason to suspect otherwise), but the overall �delity and qualityof judgments are likely to be lower than the NIST assessors whooperated in a carefully-controlled environment.
�ese di�erences considered, we �nd the correlations betweenonline and batch metrics non-obvious and interesting. �ere aretwo di�erent interpretations to these results:
If one believes in the primacy of user-centered evaluations, our�ndings suggest that established batch evaluation metrics are ableto capture user preferences. �at is, the batch metrics are capturingaspects of what users care about in useful systems. �is result nicelycomplements the �ndings of Wang et al. [31], who validated batchmetrics for the related task of retrospective timeline summarizationover tweet streams.
On the other hand, one might put more faith in a mature batchevaluation methodology that has been through the gauntlet ofmultiple deployments, and whose core ideas date back at least adecade. If one takes this perspective and believes in the primacy ofthe established approach, then our results suggest a cheaper way toconduct evaluations of push noti�cation systems that yield similarconclusions. Of course, these two perspectives are not necessarilycon�icting. Instead, they point to more work that is necessary tofully align user- and system-oriented perspectives to assessing pushnoti�cation systems.
It makes sense to discuss some of the limitations of this work.Our users are compensated for their participation in the studyand thus can be assumed to operate under certain social norms.One might argue that their behavior would be di�erent had they“organically” discovered an app for push noti�cations. While this iscertainly a legitimate criticism, it could be leveled against any userstudy that involves compensation—potential di�erences betweenpaid subjects and “real users” are beyond the scope of this study.
Session 4A: Evaluation 2 SIGIR’17, August 7-11, 2017, Shinjuku, Tokyo, Japan
423
A closely-related issue is the fact that our users subscribed tointerest pro�les that were not “their own”, i.e., they did not comeup with the information needs themselves. �is concern, however,is mitigated by having users select from a broad range of pro�les (acouple hundred) to match their interests. �erefore, our evaluationis less likely to have su�ered from user indi�erence.
Another limitation of our study is that it captures only a snapshotof current technology. �is, of course, is an implicit quali�cation ofany evaluation, not just our work. For example, consider a�emptsto control the volume of push noti�cations and to recognize whenthere is no relevant content: such techniques are nascent at best,since the community is just beginning to understand the nuancesof systems “learning when to shut up”. We have found that theseissues are confounding variables when trying to correlate onlineand batch metrics, but as the technology evolves and matures,the nature of the confound might change. As another example,we empirically observe that EG-1 and nCG-1 are correlated, eventhough in principle systems can operate in a tradeo� space in whichthe measures are not correlated. Nevertheless, we are unable tospeculate on future developments that have yet to happen—we canonly draw conclusions based on the data at hand. �e only way toaddress this limitation is a follow-up study that considers systemsonce push noti�cation techniques have substantially progressed.
7 CONCLUSIONS�is paper describes a formal user study of push noti�cation sys-tems with two distinct characteristics: tweets are assessed onlineand in-situ. As the infrastructure for conducting our evaluationcan be reused (all so�ware deployed in this study is open source),future iterations will take less e�ort. �erefore, we hope to seemore of these evaluations as the methodology becomes “just an-other hammer” in the toolbox of information retrieval researchersand practitioners.
As an outstanding issue, we believe that the proper role of noti-�cation volume in evaluating systems is not yet fully understood.As we have empirically observed, systems with the same precisioncan vary widely in the volume of noti�cations they push. However,the question remains: how much content should a system actuallypush? Even assuming that systems can achieve high precision—let’ssay, 90% or greater—are more noti�cations really be�er? Intuitively,one would expect that, at some point, user fatigue sets in, evenfor a stream of high-quality tweets. We might imagine the userhaving access to a “volume dial” to provide feedback: “yes, theseare all good tweets, but too many!” As we have shown, tweet vol-ume is not directly captured in existing metrics, but the problemlies deeper: our understanding of how users perceive noti�cationsin response to prospective information needs remains quite poor,especially when factoring in the cost of interruptions. More workon fundamental issues along these lines is needed.
8 ACKNOWLEDGMENTS�is work was supported by the Natural Sciences and EngineeringResearch Council (NSERC) of Canada, with additional contributionsfrom the U.S. National Science Foundation under IIS-1218043 andCNS-1405688. Any �ndings, conclusions, or recommendationsexpressed do not necessarily re�ect the views of the sponsors.
REFERENCES[1] Azzah Al-Maskari, Mark Sanderson, Paul Clough, and Eija Airio. 2008. �e Good
and the Bad System: Does the Test Collection Predict Users’ E�ectiveness? InSIGIR. 59–66.
[2] James Allan. 2002. Topic Detection and Tracking: Event-Based Information Orga-nization. Kluwer Academic Publishers, Dordrecht, �e Netherlands.
[3] James Allan, Ben Cartere�e, and Joshua Lewis. 2005. When Will InformationRetrieval Be “Good Enough”? User E�ectiveness as a Function of RetrievalAccuracy. In SIGIR. 433–440.
[4] Javed Aslam, Fernando Diaz, Ma�hew Ekstrand-Abueg, Richard McCreadie,Virgil Pavlu, and Tetsuya Sakai. 2015. TREC 2015 Temporal SummarizationTrack Overview. In TREC.
[5] Peter Bailey, Nick Craswell, Ian Soboro�, Paul �omas, Arjen P. de Vries, andEmine Yilmaz. 2008. Relevance Assessment: Are Judges Exchangeable and Doesit Ma�er? In SIGIR. 667–674.
[6] Nicholas J. Belkin and W. Bruce Cro�. 1992. Information Filtering and Informa-tion Retrieval: Two Sides of the Same Coin? CACM 35, 12 (1992), 29–38.
[7] Olivier Chapelle, �orsten Joachims, Filip Radlinski, and Yisong Yue. 2012. Large-Scale Validation and Analysis of Interleaved Search Evaluation. ACM TOIS 30, 1(2012), Article 6.
[8] Qi Guo, Fernando Diaz, and Elad Yom-Tov. 2013. Updating Users about TimeCritical Events. In ECIR. 483–494.
[9] Allan Hanbury, Henning Muller, Krisztian Balog, Torben Brodt, Gordon V. Cor-mack, Ivan Eggel, Tim Gollub, Frank Hopfgartner, Jayashree Kalpathy-Cramer,Noriko Kando, Anastasia Krithara, Jimmy Lin, Simon Mercer, and Martin Pot-thast. 2015. Evaluation-as-a-Service: Overview and Outlook. arXiv:1512.07454.
[10] William Hersh, Andrew Turpin, Susan Price, Benjamin Chan, Dale Kramer,Lyne�a Sacherek, and Daniel Olson. 2000. Do Batch and User Evaluations Givethe Same Results? In SIGIR. 17–24.
[11] Katja Hofmann, Shimon Whiteson, and Maarten de Rijke. 2011. A ProbabilisticMethod for Inferring Preferences from Clicks. In CIKM. 249–258.
[12] Ron Kohavi, Randal M. Henne, and Dan Sommer�eld. 2007. Practical Guide toControlled Experiments on the Web: Listen to Your Customers not to the HiPPO.In KDD. 959–967.
[13] David D. Lewis. 1995. �e TREC-4 Filtering Track. In TREC. 165–180.[14] Jimmy Lin, Miles Efron, Yulu Wang, and Garrick Sherman. 2014. Overview of
the TREC-2014 Microblog Track. In TREC.[15] Jimmy Lin, Miles Efron, Yulu Wang, Garrick Sherman, and Ellen Voorhees. 2015.
Overview of the TREC-2015 Microblog Track. In TREC.[16] Jimmy Lin, Adam Roegiest, Luchen Tan, Richard McCreadie, Ellen Voorhees,
and Fernando Diaz. 2016. Overview of the TREC 2016 Real-Time SummarizationTrack. In TREC.
[17] Abhinav Mehrotra, Veljko Pejovic, Jo Vermeulen, Robert Hendley, and MircoMusolesi. 2016. My Phone and Me: Understanding People’s Receptivity to MobileNoti�cations. In CHI. 1021–1032.
[18] Xin Qian, Jimmy Lin, and Adam Roegiest. 2016. Interleaved Evaluation forRetrospective Summarization and Prospective Noti�cation on Document Streams.In SIGIR. 175–184.
[19] Filip Radlinski and Nick Craswell. 2010. Comparing the Sensitivity of InformationRetrieval Metrics. In SIGIR. 667–674.
[20] Filip Radlinski and Nick Craswell. 2013. Optimized Interleaving for OnlineRetrieval Evaluation. In WSDM. 245–254.
[21] Stephen Robertson and Ian Soboro�. 2002. �e TREC 2002 Filtering Track Report.In TREC.
[22] Alan Said, Jimmy Lin, Alejandro Bellogın, and Arjen P. de Vries. 2013. A Monthin the Life of a Production News Recommender System. In CIKM Workshop onLiving Labs for Information Retrieval Evaluation. 7–10.
[23] Mark Sanderson, Monica Paramita, Paul Clough, and Evangelos Kanoulas. 2010.Do User Preferences and Evaluation Measures Line Up? In SIGIR. 555–562.
[24] Anne Schuth, Krisztian Balog, and Liadh Kelly. 2015. Overview of the LivingLabs for Information Retrieval Evaluation (LL4IR) CLEF Lab 2015. In CLEF.
[25] Anne Schuth, Katja Hofmann, and Filip Radlinski. 2015. Predicting SearchSatisfaction Metrics with Interleaved Comparisons. In SIGIR. 463–472.
[26] Mark Smucker and Chandra Jethani. 2010. Human Performance and RetrievalPrecision Revisited. In SIGIR. 595–602.
[27] Ian Soboro�, Iadh Ounis, Craig Macdonald, and Jimmy Lin. 2012. Overview ofthe TREC-2012 Microblog Track. In TREC.
[28] Luchen Tan, Adam Roegiest, Jimmy Lin, and Charles L. A. Clarke. 2016. AnExploration of Evaluation Metrics for Mobile Push Noti�cations. In SIGIR. 741–744.
[29] Andrew Turpin and William R. Hersh. 2001. Why Batch and User EvaluationsDo Not Give the Same Results. In SIGIR. 225–231.
[30] Andrew Turpin and Falk Scholer. 2006. User Performance versus PrecisionMeasures for Simple Search Tasks. In SIGIR. 11–18.
[31] Yulu Wang, Garrick Sherman, Jimmy Lin, and Miles Efron. 2015. AssessorDi�erences and User Preferences in Tweet Timeline Generation. In SIGIR. 615–624.
Session 4A: Evaluation 2 SIGIR’17, August 7-11, 2017, Shinjuku, Tokyo, Japan
424