online appendix to asset price spillovers from ... · 2 international journal of central banking...
TRANSCRIPT

Online Appendix to Asset Price Spilloversfrom Unconventional Monetary Policy:
A Global Empirical Perspective
Domenico Lombardi,a Pierre L. Siklos,a,b andSamantha St. Amanda
aCenter for International Governance InnovationbWilfrid Laurier University
Appendix A. Monetary Policy Communication Content
The dictionaries used in the algorithm to capture variation in contentof central bank communications combine dictionaries constructedby DICTION 6.0 and Loughran and McDonald (2011), and areaugmented with words frequently used by central bankers. Eachdictionary has a unique set of words. Capitalizations and punctu-ations are disregarded in the processing of texts. The dictionariesinclude inflections rather than stemming to be more precise aboutexpressions. For example, “stabilize” and “stabilizing” are includedin the optimism dictionary, but not “stability,” as it is used moreambiguously in the context of central bank communication; usingits stemmed form “stabil-” would not achieve this end. Words thatare ambiguous in the context of central bank communications wereremoved from the dictionaries (for example, crisis, unemployment,risk, stability, dampen, depress, downward, surprise, protection, andso on).
A1. Certainty
The certainty dictionary combines two dictionaries: one that includeswords that capture sentiments of disagreement and uncertainty,which is subtracted from another dictionary that includes words thatexpress agreement and certainty in decisionmaking or expectations.
The agreement/certainty dictionary contains 725 words. It com-bines three DICTION “bags of words”: leveling term, centrality, and
1

2 International Journal of Central Banking June 2019
rapport, which express words used to ignore individual differences,denote institutional regularities and/or substantive agreement oncore values, and describe attitudinal similarities among groups ofpeople (for example, continuous, reliable, steady, warrant, confirm,majority, normalities). The dictionary was augmented with wordsfrequently used by central banks to express agreement or certainty indecisionmaking or expectations, such as accommodative, anticipate,expect, confident, judge, prepared, and so on.
The uncertainty/disagreement dictionary contains 377 words. Itmostly relies on the Loughran and McDonald uncertainty dictio-nary which includes words like appear, believe, cautious, contin-gent, might, preliminary, roughly, somewhat, uncertain, and so on.The list was augmented with words such as argue, broadly, careful,disorderly, mixed, monitor, and so on.
A.2 Pessimism
The pessimism dictionary captures words that express unfavorableconditions or bad outcomes. It contains a total of 2,746 words andcombines the blame and hardship dictionaries of DICTION withthe Loughran and McDonald negative dictionary. Terms includethreaten, vulnerable, weak, alarming, unstable, adverse, deteriorate,panic, disruption, distort, fail, hinder, impede, lack, jeopardize, over-valued, setback, stagnate, and so on. The dictionary was augmentedwith terms like downside, constrain, sharp, slack, soft, tight, andso on.
A.3 Optimism
Opposite to the pessimism dictionary, the optimism dictionary cap-tures words that express favorable conditions or good outcomes. Itcontains a total of 825 words and combines the praise and satisfac-tion dictionaries of DICTION with the Loughran and McDonaldpositive dictionary. Terms include stimulate, satisfy, encourage,enhance, better, boost, desirable, effective, improve, outperform,strengthen, successful, and so on. The dictionary was augmentedwith terms like balanced, ease, expand, returning, stabilize, support,and well-anchored.

Vol. 15 No. 2 Asset Price Spillovers 3
Appendix B. Summary Statistics: Dependent Variables
Table B1 shows the summary statistics for the dependent variables(see table 1 in text) for the United States, systemically importantadvanced economies (SIAEs), and small open economies (SOAEs)over three samples: full sample period, FOMC non-meeting days,and FOMC meeting days.

4 International Journal of Central Banking June 2019
Table B1. Summary Statistics: Dependent Variables
StandardN Mean Deviation Kurtosis
A. One-Year OIS
Full Sample 1,978 −0.38 6.27 11.87FOMC Non-meeting Days US 1,914 −0.33 6.15 12.07FOMC Meeting Days 64 −1.82 8.99 7.41
Full Sample 4,988 −0.26 15.07 109.97FOMC Non-meeting Days SIOA 4,825 −0.23 14.92 112.00FOMC Meeting Days 163 −1.17 18.99 72.97
Full Sample 9,540 −0.11 3.15 27.10FOMC Non-meeting Days SOAE 9.229 −0.09 3.14 27.66FOMC Meeting Days 311 −0.50 3.28 13.13
B. Sovereign Bond Spread
Full Sample 1,822 0.17 11.67 11.37FOMC Non-meeting Days US 1,759 −0.01 11.16 10.72FOMC Meeting Days 63 4.97 21.15 5.93
Full Sample 7,098 0.09 8.58 17.54FOMC Non-meeting Days SIOA 6,859 0.12 8.52 17.60FOMC Meeting Days 239 −0.93 10.03 14.99
Full Sample 8,425 0.16 9.68 22.99FOMC Non-meeting Days SOAE 8,149 0.12 9.54 23.51FOMC Meeting Days 276 1.52 13.08 14.08
C. Ten-Year Sovereign Bond Yield
Full Sample 1,824 −0.10 3.17 5.48FOMC Non-meeting Days US 1,761 −0.09 3.09 5.25FOMC Meeting Days 63 −0.35 4.99 4.44
Full Sample 7,704 −0.08 3.01 11.36FOMC Non-meeting Days SIOA 7,449 −0.07 3.00 11.53FOMC Meeting Days 255 −0.35 3.32 7.91
Full Sample 9.597 −0.04 2.29 10.43FOMC Non-meeting Days SOAE 9.283 −0.04 2.28 10.60FOMC Meeting Days 314 −0.07 2.58 6.84

Vol. 15 No. 2 Asset Price Spillovers 5
Appendix C. Daily and Intradaily Data Comparisons:An Illustration
Table C1 shows the log returns of U.S. sovereign bond futures atthe two-, five-, and ten-year yield to maturity for FOMC policyannouncement days between December 2016 and November 2017.(Datastream and Bloomberg only permit six months to one year ofintradaily data downloading; additional historical data would haveto be purchased.) The data are calculated for three windows: thefull trading day, a wide window (one hour before and two hoursafter an FOMC press statement), and a narrow window (thirty min-utes before and one hour after an FOMC press statement). The yel-low highlights statistically significant differences between daily andintradaily yield changes. In June 2017 CPI and retail sales surpriseswere significant (on the strong side). Both of these announcementsare controlled for in the study. In February 2017 the Fed did notraise rates, as originally expected, but did so in March. Our contentvariables are, for example, designed to pick up these subtleties whilethe impact of the delay in the federal funds rate increase may wellhave affected other announcements. All of the important ones arecontrolled for in our study.

6 International Journal of Central Banking June 2019
Table C1. Daily and Intradaily Data Comparisons:An Illustration
FOMC Announcement Trading Wide NarrowDate Day Window Window
A. Two-Year Yield
December 14, 2016 −0.14 −0.17 —February 1, 2017 — 0.06 0.08March 15, 2017 0.11 0.14 —May 2, 2017 0.04 −0.01 0.00June 14, 2017 0.04 — −0.05July 26, 2107 0.09 0.07 0.07September 20, 2017 −0.06 — —November 1, 2017 −0.04 −0.01 −0.04
B. Five-Year Yield
December 14, 2016 −0.36 −0.66 −0.45February 1, 2017 −0.07 0.16 0.18March 15, 2017 0.43 0.39 0.37May 2, 2017 0.15 0.04 0.03June 14, 2017 0.20 −0.20 −0.12July 26, 2017 0.28 0.21 0.21September 20, 2017 −0.19 — −0.28November 1, 2017 −0.05 −0.03 −0.09
C. Ten-Year Yield
December 14, 2016 −0.41 −0.98 −0.66February 1, 2017 −0.11 0.18 0.20March 15, 2017 0.67 0.60 0.60May 2, 2017 0.19 0.10 0.04June 14, 2017 0.39 −0.21 −0.21July 26, 2017 0.35 0.30 0.29September 20, 2017 0.05 — —November 1, 2017 −0.03 −0.06 −0.14

Vol. 15 No. 2 Asset Price Spillovers 7
Appendix D. Full Regression Results fromSpecification (2)
In table D1, estimates for model (2) with standard errors are shownin parentheses. U.S. estimation uses robust least squares; estima-tion for systemically important advanced economies (SIAEs) andsmall open advanced economies (SOAEs) use fixed effects with clus-tered standard errors. U.S. surprise macroeconomic news variablesinclude gross domestic product growth (GDP), existing home sales(EHS), unemployment rate (UNM), non-farm payroll (NFP), retailsales (RTS), housing starts (HGS), consumer credit (CCR), man-ufacturing index (MFI), jobless claims (JBC), and durable goodsorders (DGO). *, **, and *** indicate statistical significance at the10 percent, 5 percent, and 1 percent level, respectively.

8 International Journal of Central Banking June 2019
Table D1. Full Regression Results from Specification (2):United States
Three-Month Sovereign Ten-YearLIBOR-OIS One-Year Bond Sovereign
Spread OIS Spread Bond Yield
FOMC Press Release −0.02 −0.01 −0.49∗∗∗ −0.12∗∗∗
(0.07) (0.05) (0.10) (0.03)FOMC UMP −0.06 −0.03 0.13 −0.01Announcement (0.09) (0.06) (0.12) (0.04)
FOMC Minutes Release 0.06 0.04 −0.29∗∗ −0.12∗∗∗
(0.10) (0.06) (0.14) (0.04)U.S. GDP −0.14 0.46 1.69∗ 0.63∗∗
(0.70) (0.52) (0.95) (0.30)U.S. EHS −1.04 0.22 1.05 0.43
(0.68) (0.51) (0.93) (0.30)U.S. UNM −1.09 0.39 0.80 0.33
(0.69) (0.50) (0.96) (0.31)U.S. NFP 0.65 0.60 1.42 0.76∗∗∗
(0.66) (0.47) (0.90) (0.29)U.S. RTS 0.03 0.98∗∗ 2.99∗∗∗ 1.13∗∗∗
(0.68) (0.49) (0.91) (0.29)U.S. HGS −0.47 0.01 0.30 0.42
(0.66) (0.49) (0.95) (0.30)U.S. CCR −0.11 0.64 0.33 0.29
(0.70) (0.50) (1.03) (0.33)U.S. MFI 0.66 0.51 −1.83 0.72∗
(0.89) (0.56) (1.16) (0.37)U.S. JBC 0.68∗∗ −0.56∗∗∗ −1.13∗∗∗ −0.25∗
(0.30) (0.22) (0.41) (1.13)U.S. DGO −0.96 −0.06 0.26 −0.30
(0.70) (0.49) (0.95) (0.30)FOMC PR: Certainty 0.67 −0.20 −2.36∗∗∗ −0.20
(0.62) (0.47) (0.89) (0.28)FOMC PR: Optimism 0.48 0.44 −0.71 −0.14
(1.45) (1.09) (2.02) (0.64)FOMC PR: Pessimism 0.14 0.68 2.51∗ −0.12
(0.91) (0.68) (1.29) (0.41)FOMC Minutes: 1.99 −0.47 1.21 0.46Certainty (1.73) (0.91) (2.21) (0.71)
FOMC Minutes: −2.03 0.90 6.40 1.05Optimism (2.91) (1.77) (4.24) (1.36)
FOMC Minutes: 0.28 0.53 1.57 1.15Pessimism (2.72) (1.67) (3.64) (1.16)
U.S. Fed Purdah −0.50 0.20 0.58 0.10(0.35) (0.25) (0.48) (0.15)
Lag Dependent Variable 0.37∗∗∗ 0.41∗∗∗ 0.43∗∗∗ 0.41∗∗∗
(0.02) (0.02) (0.02) (0.02)Constant −0.07 −0.25∗∗ 0.36 −0.06
(0.17) (0.12) (0.24) (0.08)N 1,389 1,572 1,335 1,338R2-Adjusted 0.29 0.29 0.36 0.29

Vol. 15 No. 2 Asset Price Spillovers 9
Tab
leD
2.Full
Reg
ress
ion
Res
ults
from
Spec
ifica
tion
(2):
SIA
Es
and
SO
AEs
SIA
Es
SO
AEs
Thre
e-M
onth
Sover
eign
Ten
-Yea
rT
hre
e-M
onth
Sover
eign
Ten
-Yea
rLIB
OR
-OIS
One-
Yea
rB
ond
Sover
eign
LIB
OR
-OIS
One-
Yea
rB
ond
Sover
eign
Spre
ad
OIS
Spre
ad
Bond
Yie
ldSpre
ad
OIS
Spre
ad
Bond
Yie
ld
FO
MC
Pre
ssR
elea
se−
0.07
−0.
15−
0.13
−0.
06∗
∗∗
−0.
16∗
∗−
0.01
−0.
19−
0.06
∗∗
∗
(0.0
6)(0
.08)
(0.1
3)(0
.01)
(0.0
3)(0
.01)
(0.1
0)(0
.01)
FO
MC
UM
P0.
19−
0.07
−0.
09−
0.04
∗∗
∗0.
11−
0.02
−0.
03−
0.04
∗
Annou
nce
men
t(0
.11)
(0.0
6)(0
.09)
(0.0
1)(0
.07)
(0.0
3)(0
.06)
(0.0
2)FO
MC
Min
ute
s−
0.12
−0.
22−
0.12
−0.
06∗
0.06
−0.
06−
0.26
∗∗
∗−
0.06
∗∗
∗
Rel
ease
(0.0
6)(0
.11)
(0.1
7)(0
.02)
(0.0
6)(0
.03)
(0.0
3)(0
.01)
U.S
.G
DP
2.83
1.02
0.15
0.17
0.73
∗−
0.01
0.55
0.24
(3.5
9)(0
.36)
(0.5
3)(0
.07)
(0.3
0)(0
.16)
(0.7
9)(0
.12)
U.S
.E
HS
0.47
0.92
0.57
0.45
∗∗
∗−
1.06
0.17
0.25
0.28
∗
(1.0
4)(0
.40)
(0.6
2)(0
.07)
(0.5
3)(0
.11)
(0.7
1)(0
.12)
U.S
.U
NM
−0.
14−
0.78
−0.
740.
091.
120.
23−
0.19
0.15
∗∗
(0.2
1)(0
.56)
(0.7
8)(0
.08)
(1.1
8)(0
.16)
(0.2
8)(0
.04)
U.S
.N
FP
1.52
1.29
0.92
0.24
−1.
050.
311.
10∗
0.27
∗
(1.1
3)(0
.95)
(0.5
5)(0
.13)
(0.9
1)(0
.18)
(0.4
8)(0
.11)
U.S
.RT
S0.
750.
470.
690.
43∗
∗0.
820.
55∗
∗1.
72∗
∗∗
0.57
∗∗
∗
(1.0
6)(0
.18)
(0.3
0)(0
.10)
(1.3
2)(0
.18)
(0.1
7)(0
.08)
U.S
.H
GS
−0.
990.
10−
0.56
∗0.
010.
110.
230.
760.
21(0
.54)
(0.5
1)(0
.23)
(0.0
7)(0
.38)
(0.1
3)(0
.63)
(0.1
1)U
.S.C
CR
0.90
−0.
68∗
∗−
1.18
−0.
02−
0.49
−0.
110.
140.
07(0
.58)
(0.1
5)(0
.88)
(0.1
1)(0
.83)
(0.0
8)(0
.81)
(0.0
9)U
.S.M
FI
2.93
−0.
190.
40−
0.01
−2.
010.
240.
640.
15(1
.69)
(0.8
4)(0
.74)
(0.3
3)(1
.05)
(0.1
7)(0
.39)
(0.0
8)U
.S.JB
C0.
90−
0.11
−0.
74−
0.22
∗∗
0.31
∗∗
−0.
17−
0.48
∗∗
−0.
17∗
∗∗
(0.5
7)(0
.15)
(0.3
3)(0
.06)
(0.0
8)(0
.14)
(0.1
4)(0
.03)
U.S
.D
GO
1.31
0.10
−0.
55−
0.16
−1.
31∗
−0.
22∗
−0.
61−
0.05
(1.2
6)(0
.92)
(0.4
9)(0
.17)
(0.5
5)(0
.08)
(0.6
1)(0
.08)
FO
MC
PR
:C
erta
inty
0.12
0.56
0.29
0.14
∗∗
0.73
−0.
42−
0.11
0.03
(1.5
6)(1
.01)
(0.5
0)(0
.04)
(0.7
8)(0
.37)
(0.7
3)(0
.08)
FO
MC
PR
:O
pti
mis
m1.
90−
0.49
−1.
75−
0.49
∗∗
4.50
∗−
0.91
∗−
0.29
−0.
33∗
∗
(2.4
3)(1
.34)
(1.0
0)(0
.14)
(1.6
6)(0
.37)
(0.5
3)(0
.10)
FO
MC
PR
:Pes
sim
ism
2.67
0.80
∗−
0.41
−0.
29∗
2.83
0.33
0.44
0.06
(2.7
8)(0
.22)
(0.2
5)(0
.09)
(1.8
8)(0
.27)
(1.0
5)(0
.06)
(con
tinu
ed)

10 International Journal of Central Banking June 2019
Tab
leD
2.(C
ontinued
)
SIA
Es
SO
AEs
Thre
e-M
onth
Sover
eign
Ten
-Yea
rT
hre
e-M
onth
Sover
eign
Ten
-Yea
rLIB
OR
-OIS
One-
Yea
rB
ond
Sover
eign
LIB
OR
-OIS
One-
Yea
rB
ond
Sover
eign
Spre
ad
OIS
Spre
ad
Bond
Yie
ldSpre
ad
OIS
Spre
ad
Bond
Yie
ld
FO
MC
Min
ute
s:3.
75−
1.58
−1.
06−
0.57
0.57
−0.
23−
1.52
−0.
16C
erta
inty
(7.2
7)(1
.02)
(1.3
2)(0
.43)
(1.1
3)(0
.12)
(1.3
9)(0
.18)
FO
MC
Min
ute
s:−
2.72
−4.
96−
3.87
−1.
27∗
1.91
−0.
06−
2.67
−0.
24O
pti
mis
m(8
.83)
(3.3
0)(3
.66)
(0.4
9)(2
.63)
(0.5
1)(1
.83)
(0.2
9)FO
MC
Min
ute
s:5.
60−
2.21
1.32
−0.
250.
80−
1.16
∗∗
0.20
−0.
05Pes
sim
ism
(10.
18)
(1.6
0)(2
.03)
(0.4
6)(1
.82)
(0.2
6)(0
.61)
(0.2
5)U
.S.Fed
Purd
ah0.
22−
1.00
∗0.
020.
02−
0.62
−0.
030.
98∗
∗0.
19∗
∗∗
(0.5
1)(0
.28)
(0.3
5)(0
.06)
(0.4
3)(0
.06)
(0.2
7)(0
.03)
Dom
esti
cM
onet
ary
−3.
01∗
∗∗
1.03
0.20
0.04
−1.
00−
0.08
0.79
0.06
Pol
icy
Pre
ssR
elea
se(0
.34)
(0.8
8)(0
.33)
(0.0
4)(1
.03)
(0.2
4)(0
.48)
(0.1
3)D
omes
tic
PR
:0.
700.
49−
0.37
0.02
−0.
23−
0.12
0.23
−0.
03C
erta
inty
(0.6
1)(0
.88)
(0.5
3)(0
.06)
(0.9
3)(0
.14)
(0.3
0)(0
.03)
Dom
esti
cP
R:
−3.
12∗
2.92
−0.
340.
01−
2.86
−0.
21∗
∗∗
−0.
55−
0.17
Opti
mis
m(1
.09)
(1.1
6)(1
.59)
(0.1
3)(2
.11)
(0.0
3)(0
.46)
(0.1
8)D
omes
tic
PR
:3.
38−
1.59
−0.
61−
0.06
2.77
∗0.
34−
0.77
−0.
04Pes
sim
ism
(1.5
0)(0
.93)
(2.2
4)(0
.22)
(1.0
3)(0
.28)
(0.4
8)(0
.09)
Lag
Dep
enden
t0.
23∗
∗0.
32∗
∗0.
34∗
0.50
∗∗
∗0.
31∗
∗∗
0.53
∗∗
∗0.
48∗
∗∗
0.55
∗∗
∗
Var
iable
(0.0
4)(0
.04)
(0.1
1)(0
.02)
(0.0
2)(0
.01)
(0.0
4)(0
.03)
Con
stan
t0.
10−
0.10
0.01
−0.
06∗
∗0.
29−
0.04
∗∗
∗0.
01−
0.05
∗∗
∗
(0.1
4)(0
.05)
(0.0
9)(0
.02)
(0.1
4)(0
.01)
(0.0
7)(0
.01)
N4,
906
3,94
25,
460
6,03
65,
122
7,51
56,
522
7,47
9R
2-A
dju
sted
0.05
0.13
0.12
0.26
0.10
0.31
0.25
0.32

Vol. 15 No. 2 Asset Price Spillovers 11
Appendix E. Regression Results from Specification (2) forIndividual Countries
In tables E1–E9, estimates for model (2) using robust least squareswith standard errors are shown in parentheses. U.S. surprise macro-economic news variables include gross domestic product growth(GDP), existing home sales (EHS), unemployment rate (UNM),non-farm payroll (NFP), retail sales (RTS), housing starts (HGS),consumer credit (CCR), manufacturing index (MFI), jobless claims(JBC), and durable goods orders (DGO). U.K. macroeconomic sur-prises include consumer price index (CPI), gross domestic productgrowth (GDP), producer price index (PPI), and retail sales (RTS).Euro-area macroeconomic surprises include gross domestic productgrowth (GDP), harmonized index of consumer prices (HICP), indus-trial production (IPR), Economic Sentiment Index (ESI) and unem-ployment rate (UNP). *, **, and *** indicate statistical significanceat the 10 percent, 5 percent, and 1 percent level, respectively.

12 International Journal of Central Banking June 2019
Table E1. Regression Results from Specification (2):Euro Zone
Ten-YearOne-Year Sovereign Sovereign
OIS Bond Spread Bond Yield
FOMC Press Release −0.02 −0.18∗∗ −0.04∗∗
(0.05) (0.07) (0.02)FOMC UMP Announcement 0.02 −0.08 −0.04
(0.05) (0.08) (0.02)FOMC Minutes Release −0.06 −0.22∗∗ −0.06∗∗
(0.05) (0.09) (0.02)U.S. GDP 0.52 0.81 0.30
(0.46) (0.70) (0.19)U.S. EHS −0.10 1.44∗∗ 0.50∗∗∗
(0.45) (0.66) (0.19)U.S. UNM −0.24 0.21 0.28
(0.45) (0.68) (0.19)U.S. NFP 0.24 −0.42 −0.04
(0.42) (0.65) (0.18)U.S. RTS 0.62 0.52 0.28
(0.43) (0.69) (0.18)U.S. HGS 0.21 −0.10 0.13
(0.43) (0.71) (0.18)U.S. CCR 0.77∗ 0.38 0.14
(0.44) (0.68) (0.19)U.S. MFI 1.13∗∗ 0.28 0.14
(0.51) (0.83) (0.23)U.S. JBC 0.13 −0.32 −0.08
(0.19) (0.30) (0.08)U.S. DGO −0.67 0.00 −0.20
(0.44) (0.70) (0.19)FOMC PR: Certainty −0.12 1.03 0.12
(0.41) (0.69) (0.17)FOMC PR: Optimism −0.94 −0.16 −0.31
(0.97) (1.53) (0.40)FOMC PR: Pessimism 0.66 −0.31 0.00
(0.60) (0.89) (0.25)FOMC Minutes: Certainty −1.07 0.74 −0.07
(0.83) (1.43) (0.35)FOMC Minutes: Optimism −3.28∗∗ 2.54 −0.09
(1.57) (2.63) (0.72)FOMC Minutes: Pessimism −0.95 3.47 0.30
(1.49) (2.48) (0.66)
(continued)

Vol. 15 No. 2 Asset Price Spillovers 13
Table E1. (Continued)
Ten-YearOne-Year Sovereign Sovereign
OIS Bond Spread Bond Yield
U.S. Fed Purdah −0.49∗∗ 0.46 0.00(0.23) (0.35) (0.10)
DOM Press Release −0.17 −0.35 0.01(0.43) (0.65) (0.18)
DOM UMP Announcements 5.07∗∗∗ 2.32 0.85(1.60) (2.16) (0.61)
DOM PR: Certainty −1.79∗∗∗ 0.18 −0.09(0.43) (0.64) (0.18)
DOM PR: Optimism 2.64∗∗∗ 0.13 0.43∗
(0.61) (0.93) (0.25)DOM PR: Pessimism −2.33∗∗ −0.69 −0.92∗∗
(0.96) (1.44) (0.40)DOM GDP 5.12 −0.29 0.35
(3.71) (5.46) (1.53)DOM HICP 3.34 −1.54 0.39
(2.61) (4.36) (1.10)DOM IPR −0.37 −1.57∗ −0.37
(0.61) (0.90) (0.25)DOM ESI 0.23 0.97∗∗ 0.32∗∗∗
(0.28) (0.43) (0.12)DOM UNM −4.88 −3.68 −1.52
(4.27) (6.55) (1.81)DOM Purdah −0.17 −0.61∗ −0.12
(0.23) (0.36) (0.10)Lag Dependent Variable 0.50∗∗∗ 0.54∗∗∗ 0.54∗∗∗
(0.01) (0.02) (0.02)Constant −0.10 −0.12 −0.03
(0.13) (0.20) (0.05)N 1,564 1,372 1,488R2-Adjusted 0.69 0.34 0.38

14 International Journal of Central Banking June 2019
Table E2. Regression Results from Specification (2):Japan
Ten-YearOne-Year Sovereign Sovereign
OIS Bond Spread Bond Yield
FOMC Release — 0.03 −0.04(0.04) (0.03)
FOMC UMP Announcement — −0.08 −0.04(0.05) (0.03)
FOMC Minutes Release — −0.03 −0.05(0.05) (0.03)
U.S. GDP — −0.29 0.00(0.44) (0.28)
U.S. EHS — 0.86∗∗ 0.48∗
(0.43) (0.28)U.S. UNM — 0.22 0.20
(0.43) (0.27)U.S. NFP — 0.78∗∗ 0.65∗∗
(0.37) (0.25)U.S. RTS — 0.61 0.38
(0.37) (0.26)U.S. HGS — −0.25 0.24
(0.39) (0.27)U.S. CCR — 0.13 0.05
(0.44) (0.28)U.S. MFI — 0.46 0.10
(0.44) (0.30)U.S. JBC — −0.36∗∗ −0.37∗∗∗
(0.18) (0.12)U.S. DGO — 0.10 −0.01
(0.38) (0.26)FOMC PR: Certainty — −0.05 0.05
(0.39) (0.25)FOMC PR: Optimism — −1.03 −0.86
(0.85) (0.59)FOMC PR: Pessimism — −1.15∗∗ −0.54
(0.51) (0.36)FOMC Minutes: Certainty — −0.48 −0.12
(0.73) (0.49)FOMC Minutes: Optimism — −0.83 −1.34
(1.53) (0.96)FOMC Minutes: Pessimism — 0.17 0.74
(1.34) (0.90)
(continued)

Vol. 15 No. 2 Asset Price Spillovers 15
Table E2. (Continued)
Ten-YearOne-Year Sovereign Sovereign
OIS Bond Spread Bond Yield
U.S. Fed Purdah — −0.41∗ −0.16(0.22) (0.14)
DOM Press Release — 0.31 0.41(0.47) (0.30)
DOM Minutes Release — −0.31 −0.10(0.39) (0.26)
DOM UMP Announcements — 1.20 −0.09(1.21) (0.66)
DOM PR: Certainty — −0.15 −0.01(0.19) (0.11)
DOM PR: Optimism — 1.16∗∗ 0.38(0.49) (0.29)
DOM PR: Pessimism — −0.76∗ 0.02(0.45) (0.27)
DOM Minutes: Certainty — 0.46 −0.06(0.63) (0.39)
DOM Minutes: Optimism — 2.21 0.43(1.88) (1.18)
DOM Minutes: Pessimism — −0.70 −0.75(1.33) (0.79)
DOM Purdah — −0.41 −0.34∗
(0.30) (0.19)Lag Dependent Variable — 0.50∗∗∗ 0.50∗∗∗
(0.02) (0.02)Constant — 0.07 −0.07
(0.11) (0.07)N — 1,192 1,551R2-Adjusted — 0.27 0.30

16 International Journal of Central Banking June 2019
Table E3. Regression Results from Specification (2):United Kingdom
Ten-YearOne-Year Sovereign Sovereign
OIS Bond Spread Bond Yield
FOMC Press Release −0.02 −0.10 −0.05∗
(0.05) (0.09) (0.03)FOMC UMP Announcement −0.09 −0.24∗∗ −0.16∗∗∗
(0.06) (0.11) (0.03)FOMC Minutes Release −0.06 −0.31∗∗ −0.14∗∗∗
(0.06) (0.12) (0.04)U.S. GDP 1.53∗∗∗ 0.89 0.24
(0.50) (0.85) (0.25)U.S. EHS 0.41 1.27 0.32
(0.51) (0.83) (0.25)U.S. UNM −0.16 −0.06 −0.13
(0.49) (0.85) (0.25)U.S. NFP 0.62 0.55 0.21
(0.47) (0.82) (0.24)U.S. RTS −0.54 1.85∗∗ 0.59∗∗
(0.49) (0.86) (0.25)U.S. HGS −0.32 −1.11 −0.10
(0.56) (0.88) (0.24)U.S. CCR 0.60 1.78∗∗ 0.22
(0.49) (0.87) (0.26)U.S. MFI 0.72 0.48 0.14
(0.56) (1.10) (0.32)U.S. JBC −0.19 −0.43 −0.13
(0.21) (0.36) (0.11)U.S. DGO −0.16 −1.23 −0.53∗∗
(0.53) (0.86) (0.26)FOMC PR: Certainty −0.47 1.23 0.06
(0.49) (0.80) (0.23)FOMC PR: Optimism −2.31∗ −1.11 −0.57
(1.20) (1.84) (0.53)FOMC PR: Pessimism 0.26 −0.72 −0.26
(0.78) (1.10) (0.33)FOMC Minutes: Certainty −3.20∗∗∗ −0.42 −0.06
(1.21) (2.12) (0.61)FOMC Minutes: Optimism −2.58 −2.71 −1.14
(1.97) (3.54) (1.05)FOMC Minutes: Pessimism −1.97 −2.41 −0.28
(1.77) (3.37) (1.00)
(continued)

Vol. 15 No. 2 Asset Price Spillovers 17
Table E3. (Continued)
Ten-YearOne-Year Sovereign Sovereign
OIS Bond Spread Bond Yield
U.S. Fed Purdah −0.07 0.03 −0.02(0.27) (0.44) (0.13)
DOM Press Release −0.20 0.22 0.11(0.53) (0.87) (0.25)
DOM Minutes Release 0.27 −0.15 −0.13(0.48) (0.80) (0.23)
DOM UMP Announcements 0.75 −0.29 0.59(1.51) (2.55) (0.76)
DOM PR: Certainty −0.22 −0.37 −0.24(0.38) (0.61) (0.17)
DOM PR: Optimism 0.62 −5.51∗∗∗ −0.73(1.13) (1.65) (0.48)
DOM PR: Pessimism −1.41∗ 2.43∗ −0.50(0.85) (1.28) (0.37)
DOM Minutes: Certainty 1.22∗ 0.35 −0.16(0.65) (1.05) (0.27)
DOM Minutes: Optimism 1.63 −1.10 −0.98(1.47) (2.43) (0.72)
DOM Minutes: Pessimism −2.69∗ −2.53 −0.96(1.41) (2.35) (0.68)
DOM CPI 3.84 0.15 0.20(2.59) (4.29) (1.26)
DOM GDP 3.54 −2.16 −0.27(2.27) (3.88) (1.17)
DOM PPI 1.84∗ 1.21 0.48(1.05) (1.81) (0.55)
DOM RTS 0.30 0.40 0.22(0.51) (0.88) (0.26)
DOM Purdah −0.02 0.05 0.06(0.25) (0.43) (0.13)
Lag Dependent Variable 0.26∗∗∗ 0.50∗∗∗ 0.50∗∗∗
(0.02) (0.02) (0.02)Constant −0.14 −0.20 −0.14∗
(0.16) (0.27) (0.08)N 1,285 1,316 1,417R2-Adjusted 0.17 0.30 0.34

18 International Journal of Central Banking June 2019
Table E4. Regression Results from Specification (2):Australia
Ten-YearOne-Year Sovereign Sovereign
OIS Bond Spread Bond Yield
FOMC Press Release −0.02 −0.80∗∗∗ −0.09∗∗∗
(0.02) (0.14) (0.02)FOMC UMP Announcement 0.01 −0.25 −0.04
(0.02) (0.16) (0.02)FOMC Minutes Release −0.03 −0.42∗∗ −0.08∗∗∗
(0.02) (0.17) (0.03)U.S. GDP −0.09 0.31 −0.02
(0.15) (1.56) (0.22)U.S. EHS 0.26∗ 0.75 0.48∗∗
(0.15) (0.89) (0.20)U.S. UNM 0.12 −0.61 0.17
(0.15) (1.01) (0.20)U.S. NFP 0.18 3.64∗∗∗ 0.80∗∗∗
(0.14) (1.26) (0.19)U.S. RTS 0.31∗∗ 4.10∗ 0.52∗∗
(0.14) (2.26) (0.21)U.S. HGS −0.08 2.53∗∗ 0.35∗
(0.15) (1.20) (0.19)U.S. CCR −0.12 −0.67 0.09
(0.15) (1.25) (0.20)U.S. MFI 0.15 2.82∗∗ 0.39∗
(0.17) (1.20) (0.23)U.S. JBC 0.01 −0.41 −0.19∗∗
(0.06) (0.49) (0.09)U.S. DGO −0.10 0.45 0.13
(0.15) (1.18) (0.21)FOMC PR: Certainty −0.07 2.66∗∗ −0.03
(0.14) (1.20) (0.19)FOMC PR: Optimism 0.18 1.13 −0.41
(0.32) (3.02) (0.44)FOMC PR: Pessimism −0.03 −2.75 0.01
(0.20) (3.49) (0.27)FOMC Minutes: Certainty 0.02 −3.30 −0.54
(0.27) (2.35) (0.38)FOMC Minutes: Optimism −0.33 −5.65 −0.01
(0.53) (4.68) (0.77)FOMC Minutes: Pessimism 0.34 −4.24 −0.72
(0.50) (4.62) (0.70)
(continued)

Vol. 15 No. 2 Asset Price Spillovers 19
Table E4. (Continued)
Ten-YearOne-Year Sovereign Sovereign
OIS Bond Spread Bond Yield
U.S. Fed Purdah 0.11 0.21 0.14(0.08) (0.56) (0.10)
DOM Press Release −0.22 1.08 −0.05(0.14) (1.02) (0.19)
DOM PR: Certainty −0.10 0.89 0.05(0.09) (0.68) (0.11)
DOM PR: Optimism 0.05 −0.55 −0.50∗∗
(0.18) (1.79) (0.23)DOM PR: Pessimism 0.09 −4.66∗∗∗ 0.00
(0.20) (1.71) (0.26)Lag Dependent Variable 0.47∗∗∗ 0.56∗∗∗ 0.47∗∗∗
(0.01) (0.03) (0.02)Constant −0.05 0.16 −0.01
(0.04) (0.26) (0.05)N 1,569 656 1,424R2-Adjusted 0.42 0.41 0.28

20 International Journal of Central Banking June 2019
Table E5. Regression Results from Specification (2):Canada
Ten-YearOne-Year Sovereign Sovereign
OIS Bond Spread Bond Yield
FOMC Press Release 0.00 −0.25∗∗∗ −0.05∗∗
(0.04) (0.08) (0.02)FOMC UMP Announcement −0.04 0.03 −0.05∗
(0.04) (0.10) (0.03)FOMC Minutes Release −0.16∗∗∗ −0.19 −0.05
(0.05) (0.12) (0.03)U.S. GDP 0.20 1.64∗∗ 0.34
(0.37) (0.80) (0.23)U.S. EHS 0.49 1.25 0.32
(0.35) (0.82) (0.22)U.S. UNM 0.39 0.08 0.16
(0.35) (0.84) (0.24)U.S. NFP 0.46 1.62∗∗ 0.37∗
(0.34) (0.77) (0.22)U.S. RTS 0.84∗∗ 1.66∗∗ 0.55∗∗
(0.36) (0.78) (0.23)U.S. HGS 0.28 0.87 0.12
(0.38) (0.80) (0.22)U.S. CCR 0.86∗∗ 1.49 0.33
(0.35) (0.92) (0.26)U.S. MFI 0.20 −0.35 0.31
(0.41) (0.98) (0.28)U.S. JBC −0.28∗ −0.36 −0.15
(0.15) (0.33) (0.10)U.S. DGO −0.11 −1.01 −0.28
(0.36) (0.78) (0.22)FOMC PR: Certainty −1.28∗∗∗ −1.37∗ −0.18
(0.35) (0.77) (0.22)FOMC PR: Optimism 0.22 −1.40 −0.09
(0.87) (1.77) (0.52)FOMC PR: Pessimism 1.92∗∗∗ −0.37 −0.19
(0.60) (1.06) (0.31)FOMC Minutes: Certainty −0.12 0.48 0.73
(0.77) (1.64) (0.47)FOMC Minutes: Optimism 0.55 5.34 1.28
(1.26) (3.84) (1.02)FOMC Minutes: Pessimism −0.51 3.57 1.28
(1.21) (3.34) (0.95)
(continued)

Vol. 15 No. 2 Asset Price Spillovers 21
Table E5. (Continued)
Ten-YearOne-Year Sovereign Sovereign
OIS Bond Spread Bond Yield
U.S. Fed Purdah 0.01 −0.06 0.18(0.19) (0.43) (0.12)
DOM Press Release 0.35 1.77∗ 0.55∗
(0.45) (1.07) (0.29)DOM PR: Certainty 0.03 0.75 0.09
(0.28) (0.68) (0.18)DOM PR: Optimism −0.14 0.84 0.14
(0.51) (1.08) (0.29)DOM PR: Pessimism −0.08 −0.28 0.06
(0.65) (1.59) (0.39)DOM Purdah −0.24 −0.29 −0.05
(0.23) (0.54) (0.15)Lag Dependent Variable 0.54∗∗∗ 0.42∗∗∗ 0.45∗∗∗
(0.02) (0.02) (0.02)Constant −0.01 0.38 −0.13∗∗
(0.10) (0.23) (0.06)N 1,386 1,166 1,355R2-Adjusted 0.50 0.26 0.29

22 International Journal of Central Banking June 2019
Table E6. Regression Results from Specification (2):New Zealand
Ten-YearOne-Year Sovereign Sovereign
OIS Bond Spread Bond Yield
FOMC Press Release −0.01 −0.26∗∗∗ −0.04∗∗∗
(0.01) (0.07) (0.01)FOMC UMP Announcement 0.00 0.05 −0.02
(0.01) (0.09) (0.01)FOMC Minutes Release −0.01 −0.14 −0.05∗∗∗
(0.01) (0.09) (0.01)U.S. GDP 0.00 2.22∗∗∗ 0.27∗∗
(0.10) (0.77) (0.13)U.S. EHS 0.02 0.42 0.10
(0.10) (0.72) (0.12)U.S. UNM 0.07 0.25 0.17
(0.10) (0.71) (0.12)U.S. NFP 0.05 1.85∗∗∗ 0.15
(0.10) (0.66) (0.11)U.S. RTS 0.17∗ 2.05∗∗∗ 0.32∗∗∗
(0.10) (0.68) (0.12)U.S. HGS 0.08 0.22 0.28∗∗
(0.10) (0.69) (0.12)U.S. CCR −0.21∗∗ −0.55 −0.02
(0.10) (0.70) (0.12)U.S. MFI 0.07 1.56∗∗ 0.17
(0.11) (0.79) (0.13)U.S. JBC −0.04 −0.60∗∗ −0.09∗
(0.04) (0.30) (0.05)U.S. DGO 0.08 0.67 0.12
(0.10) (0.70) (0.12)FOMC PR: Certainty 0.15 −0.19 0.03
(0.09) (0.66) (0.11)FOMC PR: Optimism −0.15 0.03 −0.47∗
(0.22) (1.54) (0.26)FOMC PR: Pessimism −0.02 1.89∗∗ 0.01
(0.14) (0.96) (0.16)FOMC Minutes: Certainty 0.09 −1.08 −0.10
(0.18) (1.28) (0.22)FOMC Minutes: Optimism −0.57 −3.81 −0.33
(0.36) (2.49) (0.42)FOMC Minutes: Pessimism 0.25 3.66 0.38
(0.34) (2.35) (0.40)
(continued)

Vol. 15 No. 2 Asset Price Spillovers 23
Table E6. (Continued)
Ten-YearOne-Year Sovereign Sovereign
OIS Bond Spread Bond Yield
U.S. Fed Purdah 0.04 0.87∗∗ 0.06(0.05) (0.36) (0.06)
DOM Press Release −0.11 −0.41 −0.05(0.11) (0.79) (0.13)
DOM PR: Certainty 0.01 −0.15 −0.05(0.05) (0.36) (0.06)
DOM PR: Optimism −0.26∗∗ −0.98 −0.04(0.12) (0.82) (0.14)
DOM PR: Pessimism 0.19∗∗ −0.51 −0.08(0.08) (0.55) (0.09)
Lag Dependent Variable 0.43∗∗∗ 0.56∗∗∗ 0.63∗∗∗
(0.01) (0.02) (0.02)Constant 0.00 −0.10 −0.03
(0.02) (0.17) (0.03)N 1,566 1,556 1,556R2-Adjusted 0.44 0.49 0.48

24 International Journal of Central Banking June 2019
Table E7. Regression Results from Specification (2):Norway
Ten-YearOne-Year Sovereign Sovereign
OIS Bond Spread Bond Yield
FOMC Press Release −0.04∗∗ 0.02 −0.02(0.01) (0.08) (0.02)
FOMC UMP Announcement −0.04∗∗ −0.11 −0.05∗∗
(0.02) (0.10) (0.02)FOMC Minutes Release −0.03∗ −0.25∗∗∗ −0.05∗∗∗
(0.02) (0.10) (0.02)U.S. GDP −0.33∗∗ −0.59 0.06
(0.14) (0.83) (0.17)U.S. EHS 0.20 0.50 −0.20
(0.14) (0.82) (0.16)U.S. UNM −0.03 −0.06 0.01
(0.14) (0.80) (0.16)U.S. NFP 0.28∗∗ 1.12 0.02
(0.13) (0.75) (0.15)U.S. RTS 0.39∗∗∗ 1.62∗∗ 0.34∗∗
(0.13) (0.78) (0.15)U.S. HGS 0.18 0.15 0.46∗∗∗
(0.14) (0.79) (0.16)U.S. CCR 0.00 1.24 0.20
(0.14) (0.80) (0.16)U.S. MFI −0.11 0.53 −0.02
(0.15) (0.89) (0.18)U.S. JBC −0.03 −0.40 −0.05
(0.06) (0.34) (0.07)U.S. DGO 0.01 −1.05 −0.13
(0.14) (0.79) (0.16)FOMC PR: Certainty −0.13 1.04 0.13
(0.13) (0.75) (0.15)FOMC PR: Optimism −0.64∗∗ 1.56 −0.38
(0.30) (1.76) (0.35)FOMC PR: Pessimism 0.19 −1.69 0.25
(0.19) (1.09) (0.22)FOMC Minutes: Certainty 0.04 1.03 −0.14
(0.25) (1.46) (0.29)FOMC Minutes: Optimism 0.29 −2.66 −0.56
(0.49) (2.83) (0.56)FOMC Minutes: Pessimism 0.18 2.98 −0.40
(0.46) (2.67) (0.53)
(continued)

Vol. 15 No. 2 Asset Price Spillovers 25
Table E7. (Continued)
Ten-YearOne-Year Sovereign Sovereign
OIS Bond Spread Bond Yield
U.S. Fed Purdah 0.01 0.51 0.12(0.07) (0.41) (0.08)
DOM Press Release −0.06 0.57 −0.01(0.15) (0.90) (0.18)
DOM PR: Certainty −0.23 −0.41 −0.16(0.16) (0.93) (0.18)
DOM PR: Optimism −1.12∗ 5.93 0.57(0.65) (3.78) (0.75)
DOM PR: Pessimism −0.05 −1.15 −0.41(0.26) (1.49) (0.30)
Lag Dependent Variable 0.51∗∗∗ 0.51∗∗∗ 0.58∗∗∗
(0.02) (0.01) (0.01)Constant 0.01 −0.56∗∗∗ −0.10∗∗∗
(0.03) (0.19) (0.04)N 1,571 1,572 1,572R2-Adjusted 0.42 0.49 0.54

26 International Journal of Central Banking June 2019
Table E8. Regression Results from Specification (2):Sweden
Ten-YearOne-Year Sovereign Sovereign
OIS Bond Spread Bond Yield
FOMC Press Release −0.08∗∗∗ −0.08 −0.06∗∗∗
(0.03) (0.07) (0.02)FOMC UMP Announcement 0.09∗∗∗ −0.22∗∗ −0.15∗∗∗
(0.03) (0.09) (0.03)FOMC Minutes Release −0.05 −0.16∗ −0.01
(0.04) (0.09) (0.03)U.S. GDP 0.25 −0.66 −0.15
(0.28) (0.73) (0.23)U.S. EHS 0.30 2.32∗∗∗ 0.67∗∗∗
(0.27) (0.71) (0.23)U.S. UNM −0.14 −0.55 0.06
(0.28) (0.70) (0.23)U.S. NFP 0.07 1.17∗ 0.33
(0.26) (0.66) (0.21)U.S. RTS 0.31 1.76∗∗∗ 0.87∗∗∗
(0.26) (0.68) (0.22)U.S. HGS 0.11 0.22 −0.04
(0.28) (0.69) (0.22)U.S. CCR 0.64∗∗ 0.05 0.22
(0.27) (0.70) (0.22)U.S. MFI 0.59∗ 0.59 0.30
(0.34) (0.79) (0.25)U.S. JBC 0.01 −0.73∗∗ −0.18∗
(0.12) (0.30) (0.10)U.S. DGO −0.12 −0.08 −0.17
(0.28) (0.69) (0.22)FOMC PR: Certainty −0.65∗∗∗ 0.17 0.00
(0.25) (0.66) (0.21)FOMC PR: Optimism −1.73∗∗∗ −0.16 −0.20
(0.59) (1.53) (0.49)FOMC PR: Pessimism −0.02 1.36 0.14
(0.37) (0.95) (0.31)FOMC Minutes: Certainty −0.70 −0.92 −0.32
(0.57) (1.27) (0.41)FOMC Minutes: Optimism −2.38∗∗ −2.44 −0.95
(1.09) (2.48) (0.79)FOMC Minutes: Pessimism −0.76 −0.74 −0.68
(0.95) (2.34) (0.75)
(continued)

Vol. 15 No. 2 Asset Price Spillovers 27
Table E8. (Continued)
Ten-YearOne-Year Sovereign Sovereign
OIS Bond Spread Bond Yield
U.S. Fed Purdah −0.10 0.37 0.01(0.14) (0.36) (0.11)
DOM Press Release 0.25 0.04 0.12(0.35) (0.89) (0.29)
DOM Minutes Release −0.39 −0.91 −0.06(0.42) (1.02) (0.33)
DOM PR: Certainty 0.36 0.11 0.20(0.42) (1.10) (0.35)
DOM PR: Optimism 0.40 −0.70 0.19(0.71) (1.77) (0.57)
DOM PR: Pessimism −2.31∗∗∗ 1.11 1.02∗
(0.64) (1.68) (0.54)DOM Minutes: Certainty −0.74 0.82 0.19
(0.84) (1.60) (0.51)DOM Minutes: Optimism −1.20 −4.72 −1.71
(1.57) (3.89) (1.25)DOM Minutes: Pessimism −0.56 −1.23 −0.72
(1.09) (2.60) (0.83)DOM Purdah 0.11 −0.22 0.09
(0.18) (0.46) (0.15)Lag Dependent Variable 0.52∗∗∗ 0.52∗∗∗ 0.58∗∗∗
(0.01) (0.02) (0.02)Constant −0.06 −0.19 −0.05
(0.07) (0.18) (0.06)N 1,422 1,572 1,572R2-Adjusted 0.48 0.34 0.48

28 International Journal of Central Banking June 2019
Table E9. Regression Results from Specification (2):Switzerland
Ten-YearOne-Year Sovereign Sovereign
OIS Bond Spread Bond Yield
FOMC Press Release −0.20∗∗∗ −0.30∗∗∗ −0.03(0.07) (0.09) (0.03)
FOMC UMP Announcement −0.09 0.14 −0.05(0.09) (0.11) (0.04)
FOMC Minutes Release −0.08 −0.31∗∗∗ −0.07∗
(0.09) (0.11) (0.04)U.S. GDP 1.06 −1.31 −0.03
(0.75) (0.91) (0.33)U.S. EHS 0.43 −0.63 0.57∗
(0.76) (0.89) (0.33)U.S. UNM 0.56 −0.76 0.38
(0.76) (0.88) (0.32)U.S. NFP 0.52 1.45∗ 0.23
(0.66) (0.82) (0.30)U.S. RTS 2.91∗∗∗ 0.64 0.67∗∗
(0.66) (0.85) (0.31)U.S. HGS 0.81 0.04 0.01
(0.73) (0.86) (0.31)U.S. CCR −0.57 −0.63 −0.64∗∗
(0.75) (0.87) (0.32)U.S. MFI 1.02 −1.37 −0.12
(0.78) (0.98) (0.36)U.S. JBC −1.18∗∗∗ −0.75∗∗ −0.17
(0.32) (0.38) (0.14)U.S. DGO 0.45 −0.54 0.08
(0.76) (0.86) (0.31)FOMC PR: Certainty 0.07 0.89 −0.19
(0.69) (0.82) (0.30)FOMC PR: Optimism −1.69 −2.46 −0.28
(1.52) (1.92) (0.70)FOMC PR: Pessimism 0.36 −3.27∗∗∗ −0.28
(0.90) (1.19) (0.43)FOMC Minutes: Certainty 0.05 −0.89 −0.03
(1.50) (1.59) (0.58)FOMC Minutes: Optimism −1.29 −1.02 −0.22
(2.81) (3.10) (1.13)FOMC Minutes: Pessimism −1.23 −1.67 0.12
(2.46) (2.92) (1.06)
(continued)

Vol. 15 No. 2 Asset Price Spillovers 29
Table E9. (Continued)
Ten-YearOne-Year Sovereign Sovereign
OIS Bond Spread Bond Yield
U.S. Fed Purdah 0.20 −0.84∗ −0.14(0.40) (0.45) (0.16)
DOM Press Release −0.98 3.20∗∗ 0.12(1.13) (1.31) (0.48)
DOM PR: Certainty 1.51∗ 0.42 0.37(0.79) (0.78) (0.29)
DOM PR: Optimism 0.84 −1.78 0.03(1.50) (1.90) (0.69)
DOM PR: Pessimism 4.18∗∗ −2.60 −0.59(1.66) (1.83) (0.67)
Lag Dependent Variable 0.41∗∗∗ 0.18∗∗∗ 0.47∗∗∗
(0.01) (0.02) (0.02)Constant 0.00 −0.36∗ −0.06
(0.19) (0.21) (0.08)N 1,092 1,572 1,572R2-Adjusted 0.71 0.10 0.34

30 International Journal of Central Banking June 2019
Appendix F. U.S. Regression Results from Specification(2) Using Lewbel Model
Table F1 shows estimates for model (2) using Lewbel’s (2012)method for identification via heteroskedasticity. FOMC pressreleases, meeting minutes releases, and unconventional monetarypolicy (UMP) announcements are instrumented using a functionof the remaining variables in the model. U.S. surprise macroeco-nomic news variables include gross domestic product growth (GDP),existing home sales (EHS), unemployment rate (UNM), non-farmpayroll (NFP), retail sales (RTS), housing starts (HGS), consumercredit (CCR), manufacturing index (MFI), jobless claims (JBC),and durable goods orders (DGO). *, **, and *** indicate statisti-cal significance at the 10 percent, 5 percent, and 1 percent level,respectively.
Table F1. U.S. Regressions Results from Specification (2)Using Lewbel Model
Three-Month Sovereign Ten-YearLIBOR-OIS One-Year Bond Sovereign
Spread OIS Spread Bond Yield
FOMC Press Release 0.15 −0.05 −0.63∗∗∗ −0.11∗∗∗
(0.12) (0.07) (0.14) (0.04)FOMC UMP −0.23 −0.11 0.06 −0.09∗∗
Announcement (0.15) (0.09) (0.17) (0.05)FOMC Minutes Release −0.04 −0.10 −0.04 −0.14∗∗∗
(0.15) (0.08) (0.18) (0.05)U.S. GDP −0.47 1.11 0.35 0.31
(1.11) (0.69) (1.24) (0.34)U.S. EHS −1.51 0.49 0.77 0.22
(1.07) (0.68) (1.22) (0.34)U.S. UNM −0.84 0.29 0.93 0.34
(1.09) (0.67) (1.26) (0.35)U.S. NFP 0.23 1.47∗∗ 0.43 0.25
(1.04) (0.63) (1.18) (0.33)U.S. RTS −0.69 1.73∗∗∗ 1.68 1.27∗∗∗
(1.07) (0.65) (1.19) (0.33)U.S. HGS −0.78 −0.23 −1.31 −0.23
(1.04) (0.66) (1.24) (0.34)
(continued)

Vol. 15 No. 2 Asset Price Spillovers 31
Table F1. (Continued)
Three-Month Sovereign Ten-YearLIBOR-OIS One-Year Bond Sovereign
Spread OIS Spread Bond Yield
U.S. CCR −0.63 0.19 0.22 0.22(1.11) (0.67) (1.34) (0.37)
U.S. MFI 0.64 1.93∗∗∗ −2.14 0.54(1.41) (0.75) (1.51) (0.42)
U.S. JBC 0.55 −0.57∗∗ −1.62∗∗∗ −0.31∗∗
(0.47) (0.29) (0.54) (0.15)U.S. DGO −0.79 −0.21 −0.39 −0.26
(1.12) (0.66) (1.25) (0.34)FOMC PR: Certainty 0.08 0.77 0.73 −0.20
(0.99) (0.63) (1.17) (0.32)FOMC PR: Optimism 0.53 1.69 −2.94 0.07
(2.29) (1.46) (2.65) (0.73)FOMC PR: Pessimism −0.05 0.50 3.53∗∗ 0.14
(1.44) (0.91) (1.69) (0.47)FOMC Minutes: 2.01 −0.85 6.99∗∗ 0.46Certainty (2.74) (1.21) (2.89) (0.80)
FOMC Minutes: 0.16 −0.46 14.85∗∗∗ 2.20Optimism (4.61) (2.37) (5.56) (1.53)
FOMC Minutes: −0.35 −0.54 8.11∗ 0.69Pessimism (4.31) (2.23) (4.77) (1.32)
U.S. Fed Purdah −0.82 −0.28 1.59∗∗ 0.08(0.55) (0.34) (0.63) (0.17)
Lag Dependent 0.39∗∗∗ 0.45∗∗∗ 0.50∗∗∗ 0.40∗∗∗
Variable (0.03) (0.02) (0.02) (0.02)Constant 0.43 0.00 0.24 −0.01
(0.27) (0.16) (0.32) (0.09)N 1,389 1,572 1,335 1,338R2-Adjusted 0.15 0.22 0.30 0.25Cragg-Donald F-Stat 130.02 316.41 163.68 145.68(Stock-Yogo Critical (20.73) (20.73) (20.73) (20.73)Value at 5% MaximalIV Relative Bias)

32 International Journal of Central Banking June 2019
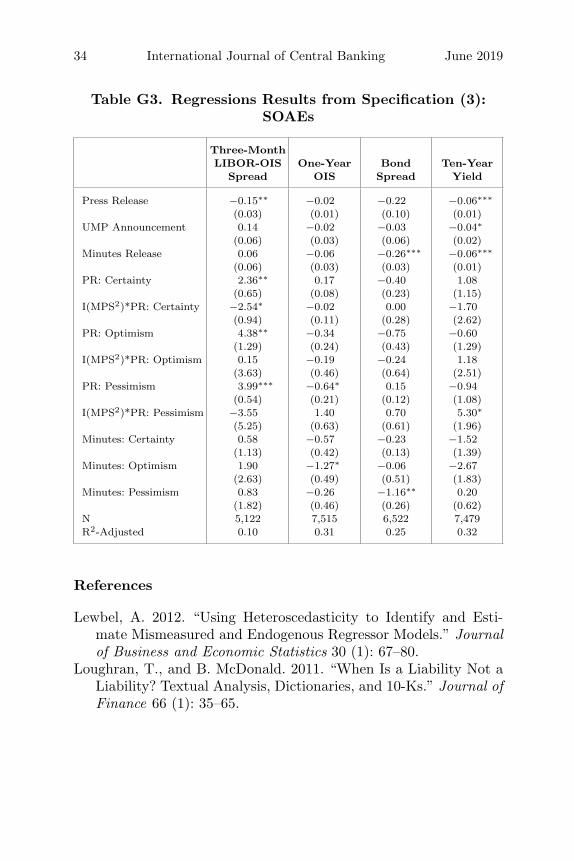
Appendix G: Regressions Results from Specification (3)
In tables G1–G3, estimates for model (3) with standard errors areshown in parentheses. U.S. estimation uses robust least squares; esti-mation for systemically important advanced economies (SIAEs) andsmall open advanced economies (SOAEs) use fixed effects with clus-tered standard errors. Only the coefficient estimates on the monetarypolicy surprises in the U.S. (MPSUS) and U.S. FOMC communica-tions content (CUS) are reported; see appendix C for a full list ofcontrol variables included in the regressions. I(MPS2) is a Heavisidevariable equal to one when the policy surprise variable (second prin-cipal component of U.S. MPS) is positive, and zero otherwise. *, **,and *** indicate statistical significance at the 10 percent, 5 percent,and 1 percent level, respectively.
Table G1. Regressions Results from Specification (3):United States
Three-MonthLIBOR-OIS One-Year Bond Ten-Year
Spread OIS Spread Yield
Press Release −0.06 −0.05 −0.53∗∗∗ −0.14∗∗∗
(0.07) (0.05) (0.10) (0.03)UMP Announcement −0.03 −0.06 0.10 −0.02
(0.09) (0.06) (0.12) (0.04)Minutes Release 0.06 0.04 −0.29∗∗ −0.12∗∗∗
(0.10) (0.06) (0.14) (0.04)PR: Certainty 0.37 0.43 −1.23 −0.21
(1.00) (0.74) (1.37) (0.44)I(MPS2)*PR: Certainty 0.53 −0.72 −0.98 0.03
(1.26) (0.93) (1.74) (0.56)PR: Optimism −0.84 1.12 −8.12∗∗∗ −1.09
(2.12) (1.58) (2.90) (0.93)I(MPS2)*PR: Optimism 1.83 −3.89∗ 11.40∗∗∗ 2.31∗
(2.91) (2.16) (3.97) (1.27)PR: Pessimism −2.40∗∗ −0.14 −6.46∗∗∗ −0.70
(1.09) (0.80) (1.48) (0.47)I(MPS2)*PR: Pessimism 3.47∗ 4.29∗∗∗ 16.00∗∗∗ 2.96∗∗∗
(2.10) (1.56) (2.98) (0.95)Minutes: Certainty 2.00 −0.47 1.19 0.45
(1.74) (0.90) (2.20) (0.70)Minutes: Optimism −2.07 0.90 6.46 1.03
(2.93) (1.75) (4.23) (1.35)Minutes: Pessimism 0.30 0.47 1.41 1.14
(2.73) (1.65) (3.63) (1.16)N 1,389 1,572 1,335 1,338R2-Adjusted 0.28 0.30 0.36 0.30

Vol. 15 No. 2 Asset Price Spillovers 33
Table G2. Regressions Results from Specification (3):SIAEs
Three-MonthLIBOR-OIS One-Year Bond Ten-Year
Spread OIS Spread Yield
Press Release −0.05 −0.15 −0.16 −0.07∗∗
(0.07) (0.07) (0.14) (0.01)UMP Announcement 0.20 −0.05 −0.11 −0.05∗∗∗
(0.13) (0.04) (0.09) (0.01)Minutes Release −0.12 −0.22 −0.12 −0.06∗
(0.06) (0.11) (0.17) (0.02)PR: Certainty 0.69 2.74 0.11 0.17
(4.01) (2.85) (0.93) (0.08)I(MPS2)*PR: Certainty −0.90 −3.29 0.43 −0.02
(3.74) (2.86) (1.53) (0.11)PR: Optimism 2.32 −1.66∗∗∗ −1.75 −0.34
(6.04) (0.13) (1.62) (0.24)I(MPS2)*PR: Optimism −0.92 2.59 0.17 −0.19
(7.13) (2.48) (1.09) (0.46)PR: Pessimism 4.29 0.33 −1.55∗ −0.64∗
(3.57) (0.56) (0.50) (0.21)I(MPS2)*PR: Pessimism −4.87 2.69 4.26∗ 1.40
(4.15) (0.98) (1.53) (0.63)Minutes: Certainty 3.76 −1.58 −1.06 −0.57
(7.29) (1.02) (1.33) (0.42)Minutes: Optimism −2.72 −4.97 −3.86 −1.27∗
(8.82) (3.31) (3.66) (0.49)Minutes: Pessimism 5.61 −2.19 1.31 −0.26
(10.23) (1.62) (2.03) (0.46)N 4,906 3,942 5,460 6,036R2-Adjusted 0.05 0.13 0.12 0.26
34 International Journal of Central Banking June 2019
Table G3. Regressions Results from Specification (3):SOAEs
Three-MonthLIBOR-OIS One-Year Bond Ten-Year
Spread OIS Spread Yield
Press Release −0.15∗∗ −0.02 −0.22 −0.06∗∗∗
(0.03) (0.01) (0.10) (0.01)UMP Announcement 0.14 −0.02 −0.03 −0.04∗
(0.06) (0.03) (0.06) (0.02)Minutes Release 0.06 −0.06 −0.26∗∗∗ −0.06∗∗∗
(0.06) (0.03) (0.03) (0.01)PR: Certainty 2.36∗∗ 0.17 −0.40 1.08
(0.65) (0.08) (0.23) (1.15)I(MPS2)*PR: Certainty −2.54∗ −0.02 0.00 −1.70
(0.94) (0.11) (0.28) (2.62)PR: Optimism 4.38∗∗ −0.34 −0.75 −0.60
(1.29) (0.24) (0.43) (1.29)I(MPS2)*PR: Optimism 0.15 −0.19 −0.24 1.18
(3.63) (0.46) (0.64) (2.51)PR: Pessimism 3.99∗∗∗ −0.64∗ 0.15 −0.94
(0.54) (0.21) (0.12) (1.08)I(MPS2)*PR: Pessimism −3.55 1.40 0.70 5.30∗
(5.25) (0.63) (0.61) (1.96)Minutes: Certainty 0.58 −0.57 −0.23 −1.52
(1.13) (0.42) (0.13) (1.39)Minutes: Optimism 1.90 −1.27∗ −0.06 −2.67
(2.63) (0.49) (0.51) (1.83)Minutes: Pessimism 0.83 −0.26 −1.16∗∗ 0.20
(1.82) (0.46) (0.26) (0.62)N 5,122 7,515 6,522 7,479R2-Adjusted 0.10 0.31 0.25 0.32
References
Lewbel, A. 2012. “Using Heteroscedasticity to Identify and Esti-mate Mismeasured and Endogenous Regressor Models.” Journalof Business and Economic Statistics 30 (1): 67–80.
Loughran, T., and B. McDonald. 2011. “When Is a Liability Not aLiability? Textual Analysis, Dictionaries, and 10-Ks.” Journal ofFinance 66 (1): 35–65.