online appendix - s3.amazonaws.com · commonwealth of independent states 21 10 23 ... egypt, iran,...
TRANSCRIPT

Online Appendix
Hendriks, Burger, Ray, and Esipova (2018) - Do international migrants increase
their happiness and that of their families by migrating?
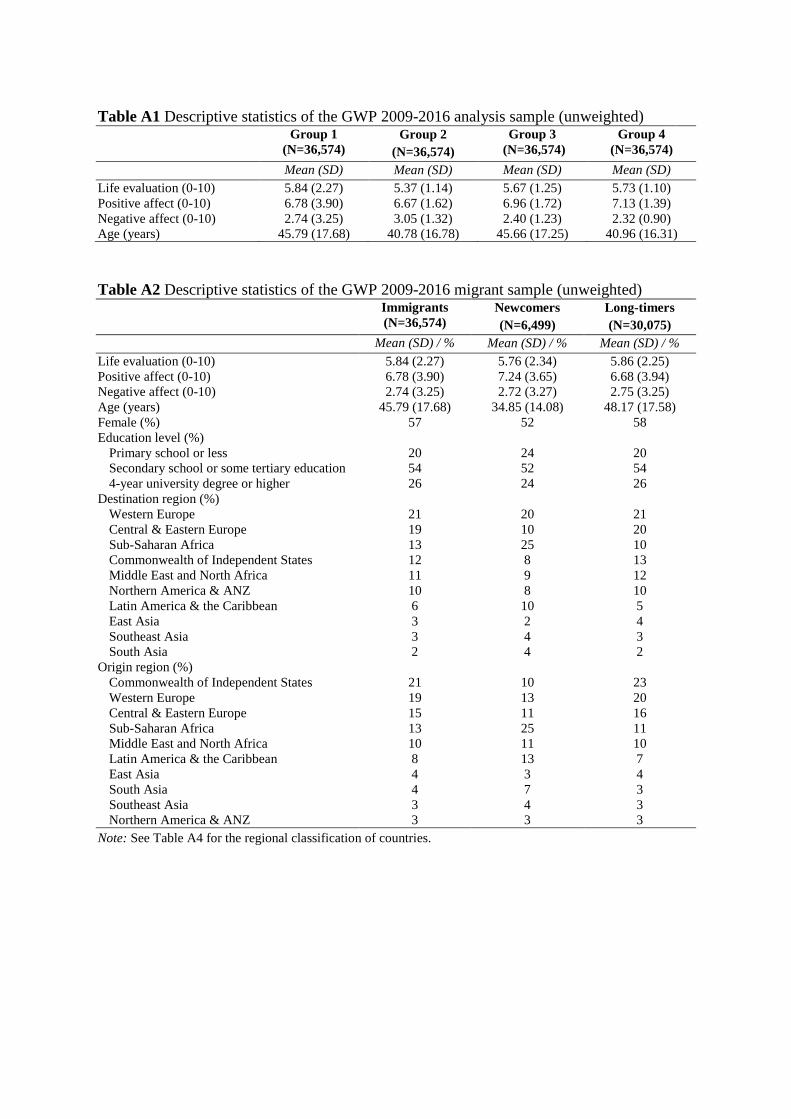
Table A1 Descriptive statistics of the GWP 2009-2016 analysis sample (unweighted)
Group 1
(N=36,574)
Group 2
(N=36,574)
Group 3
(N=36,574)
Group 4
(N=36,574)
Mean (SD) Mean (SD) Mean (SD) Mean (SD)
Life evaluation (0-10) 5.84 (2.27) 5.37 (1.14) 5.67 (1.25) 5.73 (1.10)
Positive affect (0-10) 6.78 (3.90) 6.67 (1.62) 6.96 (1.72) 7.13 (1.39)
Negative affect (0-10) 2.74 (3.25) 3.05 (1.32) 2.40 (1.23) 2.32 (0.90)
Age (years) 45.79 (17.68) 40.78 (16.78) 45.66 (17.25) 40.96 (16.31)
Table A2 Descriptive statistics of the GWP 2009-2016 migrant sample (unweighted)
Immigrants
(N=36,574)
Newcomers
(N=6,499)
Long-timers
(N=30,075)
Mean (SD) / % Mean (SD) / % Mean (SD) / %
Life evaluation (0-10) 5.84 (2.27) 5.76 (2.34) 5.86 (2.25)
Positive affect (0-10) 6.78 (3.90) 7.24 (3.65) 6.68 (3.94)
Negative affect (0-10) 2.74 (3.25) 2.72 (3.27) 2.75 (3.25)
Age (years) 45.79 (17.68) 34.85 (14.08) 48.17 (17.58)
Female (%) 57 52 58
Education level (%)
Primary school or less 20 24 20
Secondary school or some tertiary education 54 52 54
4-year university degree or higher 26 24 26
Destination region (%)
Western Europe 21 20 21
Central & Eastern Europe 19 10 20
Sub-Saharan Africa 13 25 10
Commonwealth of Independent States 12 8 13
Middle East and North Africa 11 9 12
Northern America & ANZ 10 8 10
Latin America & the Caribbean 6 10 5
East Asia 3 2 4
Southeast Asia 3 4 3
South Asia 2 4 2
Origin region (%)
Commonwealth of Independent States 21 10 23
Western Europe 19 13 20
Central & Eastern Europe 15 11 16
Sub-Saharan Africa 13 25 11
Middle East and North Africa 10 11 10
Latin America & the Caribbean 8 13 7
East Asia 4 3 4
South Asia 4 7 3
Southeast Asia 3 4 3
Northern America & ANZ 3 3 3
Note: See Table A4 for the regional classification of countries.
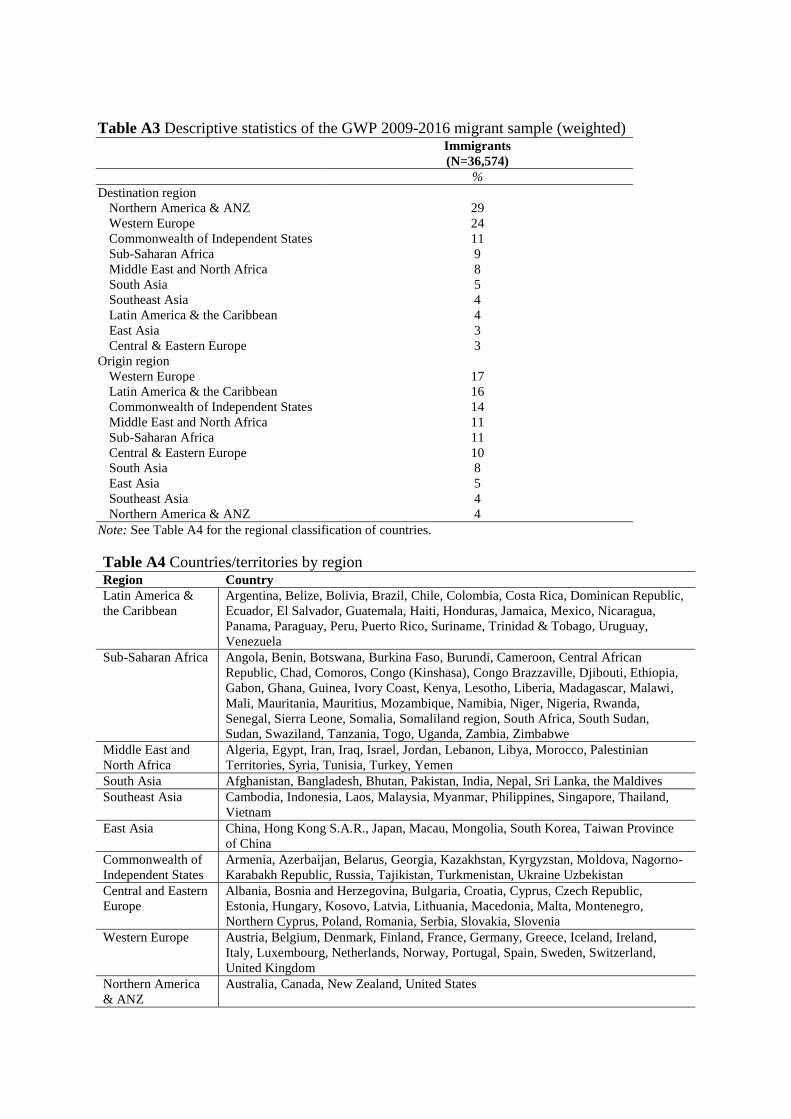
Table A3 Descriptive statistics of the GWP 2009-2016 migrant sample (weighted)
Immigrants
(N=36,574)
%
Destination region
Northern America & ANZ 29
Western Europe 24
Commonwealth of Independent States 11
Sub-Saharan Africa 9
Middle East and North Africa 8
South Asia 5
Southeast Asia 4
Latin America & the Caribbean 4
East Asia 3
Central & Eastern Europe 3
Origin region
Western Europe 17
Latin America & the Caribbean 16
Commonwealth of Independent States 14
Middle East and North Africa 11
Sub-Saharan Africa 11
Central & Eastern Europe 10
South Asia 8
East Asia 5
Southeast Asia 4
Northern America & ANZ 4
Note: See Table A4 for the regional classification of countries.
Table A4 Countries/territories by region Region Country
Latin America &
the Caribbean
Argentina, Belize, Bolivia, Brazil, Chile, Colombia, Costa Rica, Dominican Republic,
Ecuador, El Salvador, Guatemala, Haiti, Honduras, Jamaica, Mexico, Nicaragua,
Panama, Paraguay, Peru, Puerto Rico, Suriname, Trinidad & Tobago, Uruguay,
Venezuela
Sub-Saharan Africa Angola, Benin, Botswana, Burkina Faso, Burundi, Cameroon, Central African
Republic, Chad, Comoros, Congo (Kinshasa), Congo Brazzaville, Djibouti, Ethiopia,
Gabon, Ghana, Guinea, Ivory Coast, Kenya, Lesotho, Liberia, Madagascar, Malawi,
Mali, Mauritania, Mauritius, Mozambique, Namibia, Niger, Nigeria, Rwanda,
Senegal, Sierra Leone, Somalia, Somaliland region, South Africa, South Sudan,
Sudan, Swaziland, Tanzania, Togo, Uganda, Zambia, Zimbabwe
Middle East and
North Africa
Algeria, Egypt, Iran, Iraq, Israel, Jordan, Lebanon, Libya, Morocco, Palestinian
Territories, Syria, Tunisia, Turkey, Yemen
South Asia Afghanistan, Bangladesh, Bhutan, Pakistan, India, Nepal, Sri Lanka, the Maldives
Southeast Asia Cambodia, Indonesia, Laos, Malaysia, Myanmar, Philippines, Singapore, Thailand,
Vietnam
East Asia China, Hong Kong S.A.R., Japan, Macau, Mongolia, South Korea, Taiwan Province
of China
Commonwealth of
Independent States
Armenia, Azerbaijan, Belarus, Georgia, Kazakhstan, Kyrgyzstan, Moldova, Nagorno-
Karabakh Republic, Russia, Tajikistan, Turkmenistan, Ukraine Uzbekistan
Central and Eastern
Europe
Albania, Bosnia and Herzegovina, Bulgaria, Croatia, Cyprus, Czech Republic,
Estonia, Hungary, Kosovo, Latvia, Lithuania, Macedonia, Malta, Montenegro,
Northern Cyprus, Poland, Romania, Serbia, Slovakia, Slovenia
Western Europe Austria, Belgium, Denmark, Finland, France, Germany, Greece, Iceland, Ireland,
Italy, Luxembourg, Netherlands, Norway, Portugal, Spain, Sweden, Switzerland,
United Kingdom
Northern America
& ANZ
Australia, Canada, New Zealand, United States
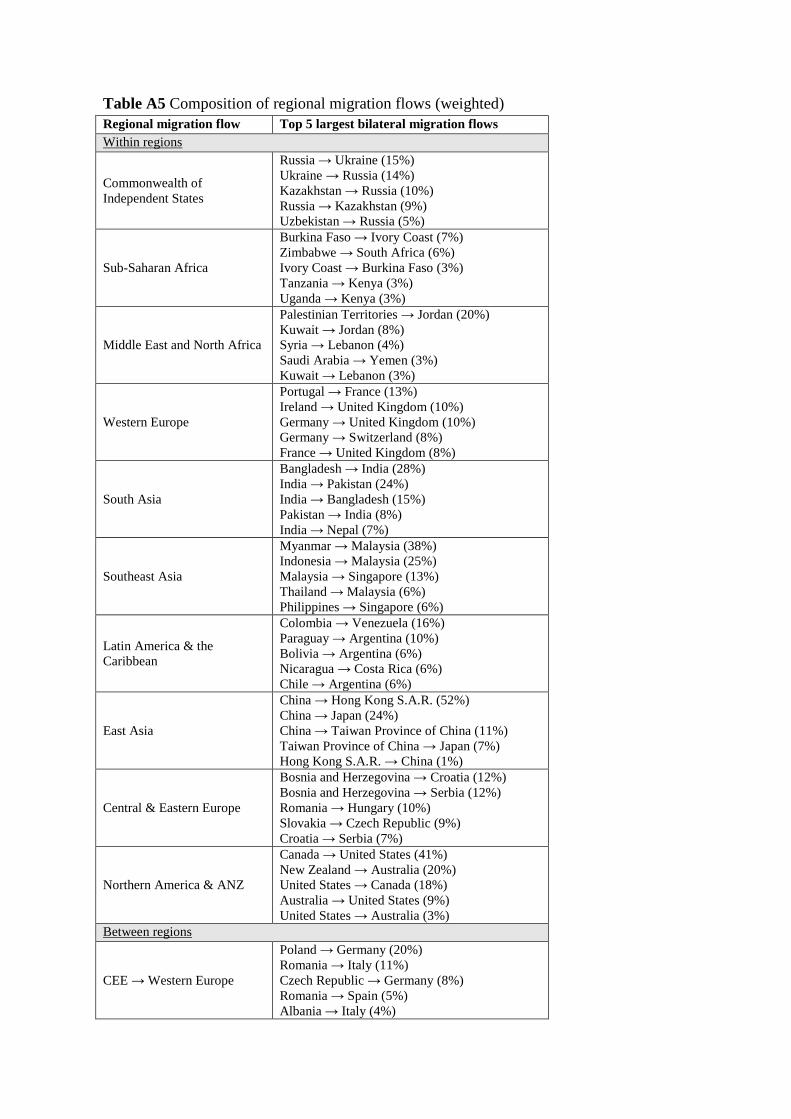
Table A5 Composition of regional migration flows (weighted)
Regional migration flow Top 5 largest bilateral migration flows
Within regions
Commonwealth of
Independent States
Russia → Ukraine (15%)
Ukraine → Russia (14%)
Kazakhstan → Russia (10%)
Russia → Kazakhstan (9%)
Uzbekistan → Russia (5%)
Sub-Saharan Africa
Burkina Faso → Ivory Coast (7%)
Zimbabwe → South Africa (6%)
Ivory Coast → Burkina Faso (3%)
Tanzania → Kenya (3%)
Uganda → Kenya (3%)
Middle East and North Africa
Palestinian Territories → Jordan (20%)
Kuwait → Jordan (8%)
Syria → Lebanon (4%)
Saudi Arabia → Yemen (3%)
Kuwait → Lebanon (3%)
Western Europe
Portugal → France (13%)
Ireland → United Kingdom (10%)
Germany → United Kingdom (10%)
Germany → Switzerland (8%)
France → United Kingdom (8%)
South Asia
Bangladesh → India (28%)
India → Pakistan (24%)
India → Bangladesh (15%)
Pakistan → India (8%)
India → Nepal (7%)
Southeast Asia
Myanmar → Malaysia (38%)
Indonesia → Malaysia (25%)
Malaysia → Singapore (13%)
Thailand → Malaysia (6%)
Philippines → Singapore (6%)
Latin America & the
Caribbean
Colombia → Venezuela (16%)
Paraguay → Argentina (10%)
Bolivia → Argentina (6%)
Nicaragua → Costa Rica (6%)
Chile → Argentina (6%)
East Asia
China → Hong Kong S.A.R. (52%)
China → Japan (24%)
China → Taiwan Province of China (11%)
Taiwan Province of China → Japan (7%)
Hong Kong S.A.R. → China (1%)
Central & Eastern Europe
Bosnia and Herzegovina → Croatia (12%)
Bosnia and Herzegovina → Serbia (12%)
Romania → Hungary (10%)
Slovakia → Czech Republic (9%)
Croatia → Serbia (7%)
Northern America & ANZ
Canada → United States (41%)
New Zealand → Australia (20%)
United States → Canada (18%)
Australia → United States (9%)
United States → Australia (3%)
Between regions
CEE → Western Europe
Poland → Germany (20%)
Romania → Italy (11%)
Czech Republic → Germany (8%)
Romania → Spain (5%)
Albania → Italy (4%)
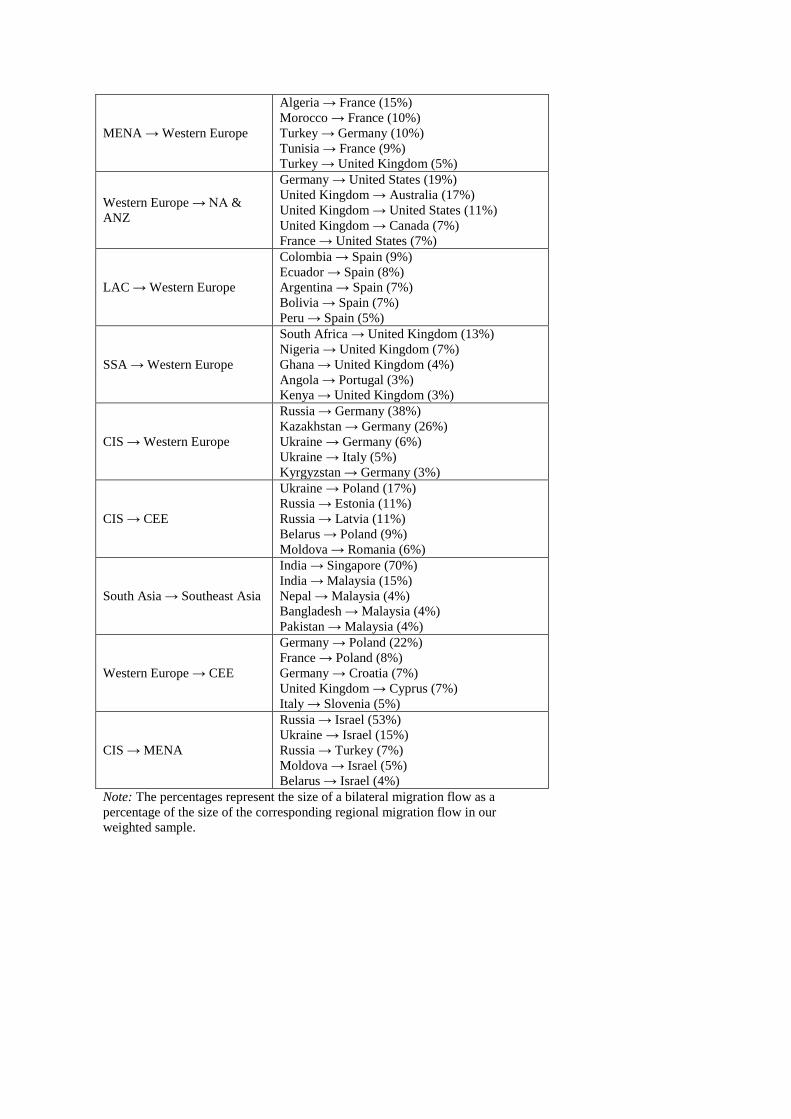
MENA → Western Europe
Algeria → France (15%)
Morocco → France (10%)
Turkey → Germany (10%)
Tunisia → France (9%)
Turkey → United Kingdom (5%)
Western Europe → NA &
ANZ
Germany → United States (19%)
United Kingdom → Australia (17%)
United Kingdom → United States (11%)
United Kingdom → Canada (7%)
France → United States (7%)
LAC → Western Europe
Colombia → Spain (9%)
Ecuador → Spain (8%)
Argentina → Spain (7%)
Bolivia → Spain (7%)
Peru → Spain (5%)
SSA → Western Europe
South Africa → United Kingdom (13%)
Nigeria → United Kingdom (7%)
Ghana → United Kingdom (4%)
Angola → Portugal (3%)
Kenya → United Kingdom (3%)
CIS → Western Europe
Russia → Germany (38%)
Kazakhstan → Germany (26%)
Ukraine → Germany (6%)
Ukraine → Italy (5%)
Kyrgyzstan → Germany (3%)
CIS → CEE
Ukraine → Poland (17%)
Russia → Estonia (11%)
Russia → Latvia (11%)
Belarus → Poland (9%)
Moldova → Romania (6%)
South Asia → Southeast Asia
India → Singapore (70%)
India → Malaysia (15%)
Nepal → Malaysia (4%)
Bangladesh → Malaysia (4%)
Pakistan → Malaysia (4%)
Western Europe → CEE
Germany → Poland (22%)
France → Poland (8%)
Germany → Croatia (7%)
United Kingdom → Cyprus (7%)
Italy → Slovenia (5%)
CIS → MENA
Russia → Israel (53%)
Ukraine → Israel (15%)
Russia → Turkey (7%)
Moldova → Israel (5%)
Belarus → Israel (4%)
Note: The percentages represent the size of a bilateral migration flow as a
percentage of the size of the corresponding regional migration flow in our
weighted sample.

Table A6 Happiness gains of migrants and origin-destination happiness differential by
migration flow Life evaluations Positive affect Negative affect
Migration flow Migrant
gain/loss
Origin-
destination
differential
Migrant
gain/loss
Origin-
destination
differential
Migrant
gain/loss
Origin-
destination
differential
Within regions
CIS 0.39 0.09 0.43 -0.02 -0.51 -0.13
Sub-Saharan Africa 0.21 0.05 0.18 0.05 -0.18 0.14
MENA 0.44 0.60 0.57 0.40 -0.95 -0.41
Western Europe 0.45 0.22 0.36 0.20 -0.31 -0.14
South Asia -0.28 0.04 -0.27 -0.06 0.25 0.03
Southeast Asia 1.08 1.01 0.34 -0.29 -0.84 -0.44
LAC 0.45 0.47 -0.17 0.25 -0.2 -0.27
East Asia 0.54 0.64 0.85 -0.55 0.02 0.36
Central & Eastern Europe 0.39 0.18 0.51 0.13 -0.49 -0.03
Northern America & ANZ -0.01 -0.07 -0.84 -0.12 -0.55 0.07
Between regions
MENA → Western Europe 0.90 1.67 0.86 1.82 -0.04 -0.9
LAC → Western Europe 0.36 0.37 -0.37 -0.68 0.19 -0.07
CIS → MENA 1.11 1.58 0.24 0.70 0.57 1.36
CIS → Western Europe 0.59 1.28 0.47 1.49 0.38 0.08
CEE →Western Europe 0.78 1.16 0.50 1.08 -0.14 -0.58
SSA → Western Europe 1.44 2.29 0.87 1.04 0.22 -0.21
CIS → CEE 0.57 0.32 0.69 0.82 0.13 0.55
Western Europe → CEE 0.27 -1.10 -0.01 -1.05 -0.65 0.88
Western Europe → NA&ANZ 0.84 0.47 0.73 0.34 -0.13 0.33
South Asia → Southeast Asia 0.80 1.71 -0.26 0.32 -0.37 -1.01

Table A7 Descriptive statistics of the GSOEP analysis sample by immigrant group
Refugees
(N=607)
Voluntary migrants
(N=4,607) Mean (SD) / % Mean (SD) / %
Age (years) 41 (12.6) 38 (11.4)
Years since migration 13 (7.9) 11 (8.4)
Female (%) 43 55
Region of origin (%)
Middle East and North Africa 48 12
Central & Eastern Europe 27 42
Commonwealth of Independent States 16 28
Sub-Saharan Africa 5 2
South Asia 3 1
Latin America & the Caribbean 1 2
Western Europe 0 10
Northern America & ANZ 0 1
East Asia 0 1
Southeast Asia 0 1
Note: The migrant categorization is based on the following question: How did you move to Germany? (a) As
an employed person who already had a job offer in Germany, (b) As an ethnic German (Aussiedler) from an
Eastern European country, (c) As a spouse, child, or other family member, (d) As an asylum-seeker or refugee,
(e) As a student or vocational trainee, (f) As a job-seeker, (g) In a different way. Respondents who answered
option (d) were classified as refugees; all other respondents were classified as voluntary migrants. We computed
years since migration by subtracting the year that the respondents entered Germany from the survey year.
Table A8 OLS regression: Life satisfaction in Germany by immigrant type
Dependent variable: Life satisfaction
Type of migrant
Refugee Ref.
Expat with job offer 0.55**
(0.10)
Ethnic German (Aussiedler) 0.62**
(0.09)
Co-moving family member 0.33**
(0.09)
Student 0.31**
(0.12)
Job seeker 0.21*
(0.10)
Other 0.35**
(0.12)
Years since migration -0.01**
(0.00)
Age -0.02
(0.01)
Age^2/100 0.00
(0.00)
Female 0.05
(0.05)
Observations 5,214
R2 0.03
Notes: Regression coefficients are displayed with robust standard errors in parentheses. *
p<0.05, ** p<0.01.

Table A9 Descriptive statistics of the GWP 2007-2011 analysis sample (unweighted)
All
individuals
with a
household
member
abroada
Individuals
with a
household
member abroad
for temporary
workb
Individuals
with a
household
member living
permanently
abroadb
Individuals
receiving
remittances
from relatives
abroadc
Mean (SD) / % Mean (SD) / % Mean (SD) / % Mean (SD) / %
Age (years) 39 39 42 36
Female (%) 54 58 55 56
Education level
Primary school or less 29 30 26 33
Secondary school or some 56 57 53 60
tertiary education
4-year university degree or higher 15 13 21 7
Destination region of the migrated
household member (%)
Western Europe 32 23 19 23
Northern America & ANZ 24 23 42 54
Middle East and North Africa 11 2 3 0
Sub-Saharan Africa 10 0 0 0
Commonwealth of Independent States 10 34 19 0
Latin America & the Caribbean 5 16 14 22
Central & Eastern Europe 3 2 2 0
Southeast Asia 2 0 0 0
East Asia 2 0 1 1
South Asia 1 0 0 0
Origin region (%)
Latin America & the Caribbean 26 56 30 100
Sub-Saharan Africa 23 0 0 0
Central & Eastern Europe 12 3 4 0
Commonwealth of Independent States 11 41 66 0
Middle East and North Africa 9 0 0 0
South Asia 6 0 0 0
Western Europe 5 0 0 0
Northern America & ANZ 1 0 0 0
East Asia 3 0 0 0
Southeast Asia 4 0 0 0
Notes: The destination country is known for only a small part of the sample. a Migrant- and non-migrant households are identified based on the following question: Have any members of
your household gone to live in a foreign country permanently or temporarily in the past five years? (a) Yes, still
there, (b) No. b These groups are identified based on the following question: What was the primary reason for this person to
go abroad? (a) To study, (b) For temporary work, (c) To live permanently, (d) Other. c This group is identified based on the following question: Does this household receive remittances from relatives
living outside of the country on a regular basis? Yes/No.

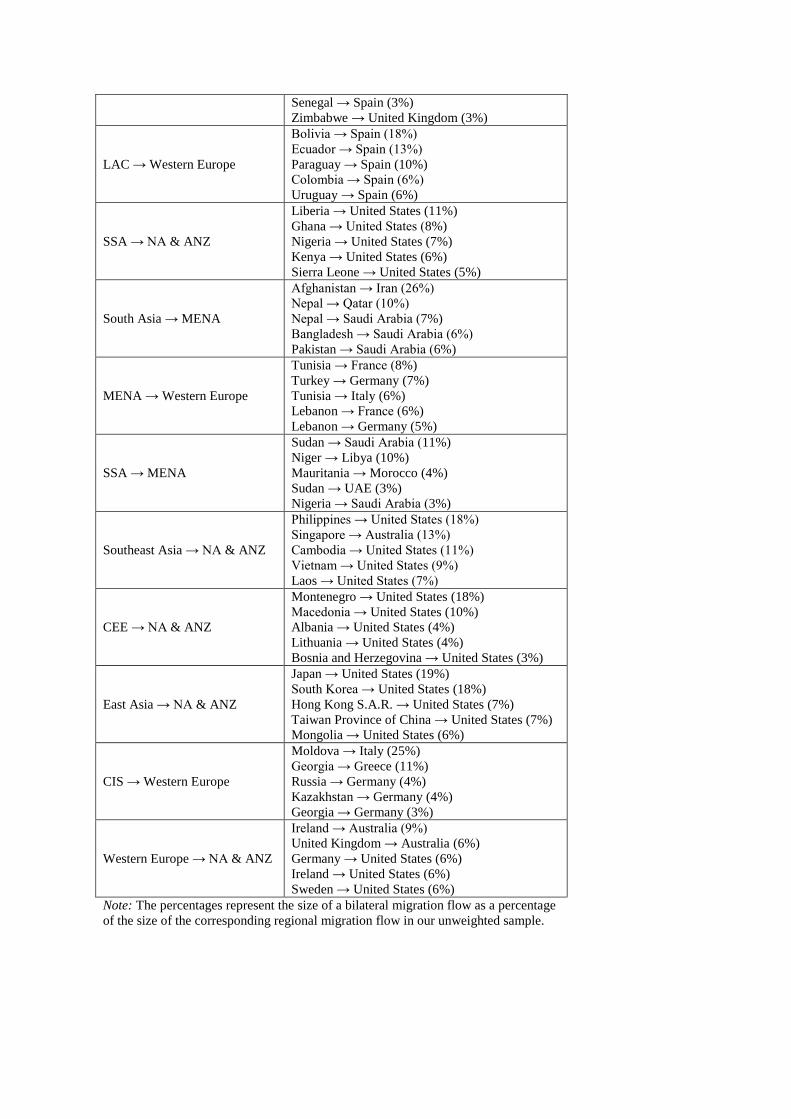
Table A10 Composition of regional migration flows of migrated
household members (unweighted)
Regional migration flow Top 5 largest bilateral migration flows
Within regions
Commonwealth of Independent
States
Tajikistan → Russia (26%)
Kyrgyzstan → Russia (17%)
Armenia → Russia (11%)
Moldova → Russia (10%)
Uzbekistan → Russia (7%)
Sub-Saharan Africa
Zimbabwe → South Africa (10%)
Burkina Faso → Ivory Coast (7%)
Niger → Nigeria (6%)
Mozambique → South Africa (4%)
Malawi → South Africa (4%)
Middle East and North Africa
Yemen → Saudi Arabia (8%)
Lebanon → UAE (6%)
Jordan → Saudi Arabia (5%)
Syria → Saudi Arabia (5%)
Syria → UAE (4%)
Latin America & the Caribbean
Paraguay → Argentina (20%)
Nicaragua → Costa Rica (14%)
Bolivia → Argentina (12%)
Colombia → Venezuela (4%)
Peru → Argentina (3%)
Western Europe
Portugal → France (6%)
Ireland → United Kingdom (5%)
Iceland → Denmark (3%)
United Kingdom → Spain (2%)
Portugal → Switzerland (2%)
Central & Eastern Europe
Montenegro → Serbia (10%)
Bosnia and Herzegovina → Slovenia (6%)
Bosnia and Herzegovina → Croatia (5%)
Romania → Hungary (4%)
Bosnia and Herzegovina → Serbia (4%)
Southeast Asia
Indonesia → Malaysia (18%)
Singapore → Malaysia (14%)
Malaysia → Singapore (13%)
Cambodia→ Thailand (8%)
Philippines → Singapore (7%)
East Asia
Mongolia → South Korea (34%)
South Korea → China (11%)
South Korea → Japan (10%)
Japan → China (9%)
Mongolia → Japan (7%)
Between regions
LAC → NA & ANZ
Honduras → United States (13%)
El Salvador → United States (13%)
Guatemala → United States (10%)
Costa Rica → United States (7%)
Mexico → United States (7%)
CEE → Western Europe
Albania → Italy (5%)
Kosovo → Germany (5%)
Albania → Greece (4%)
Poland → United Kingdom (3%)
Romania → Italy (3%)
SSA → Western Europe
Comoros → France (7%)
Mauritania → France (6%)
Senegal → France (5%)
Senegal → Spain (3%)
Zimbabwe → United Kingdom (3%)
LAC → Western Europe
Bolivia → Spain (18%)
Ecuador → Spain (13%)
Paraguay → Spain (10%)
Colombia → Spain (6%)
Uruguay → Spain (6%)
SSA → NA & ANZ
Liberia → United States (11%)
Ghana → United States (8%)
Nigeria → United States (7%)
Kenya → United States (6%)
Sierra Leone → United States (5%)
South Asia → MENA
Afghanistan → Iran (26%)
Nepal → Qatar (10%)
Nepal → Saudi Arabia (7%)
Bangladesh → Saudi Arabia (6%)
Pakistan → Saudi Arabia (6%)
MENA → Western Europe
Tunisia → France (8%)
Turkey → Germany (7%)
Tunisia → Italy (6%)
Lebanon → France (6%)
Lebanon → Germany (5%)
SSA → MENA
Sudan → Saudi Arabia (11%)
Niger → Libya (10%)
Mauritania → Morocco (4%)
Sudan → UAE (3%)
Nigeria → Saudi Arabia (3%)
Southeast Asia → NA & ANZ
Philippines → United States (18%)
Singapore → Australia (13%)
Cambodia → United States (11%)
Vietnam → United States (9%)
Laos → United States (7%)
CEE → NA & ANZ
Montenegro → United States (18%)
Macedonia → United States (10%)
Albania → United States (4%)
Lithuania → United States (4%)
Bosnia and Herzegovina → United States (3%)
East Asia → NA & ANZ
Japan → United States (19%)
South Korea → United States (18%)
Hong Kong S.A.R. → United States (7%)
Taiwan Province of China → United States (7%)
Mongolia → United States (6%)
CIS → Western Europe
Moldova → Italy (25%)
Georgia → Greece (11%)
Russia → Germany (4%)
Kazakhstan → Germany (4%)
Georgia → Germany (3%)
Western Europe → NA & ANZ
Ireland → Australia (9%)
United Kingdom → Australia (6%)
Germany → United States (6%)
Ireland → United States (6%)
Sweden → United States (6%)
Note: The percentages represent the size of a bilateral migration flow as a percentage
of the size of the corresponding regional migration flow in our unweighted sample.

Figure A1 Robustness check: Comparing migrants to stayers with concrete emigration plans
Source: GWP 2009-2016.
Note: All measures have a 0-10 scale. 95% confidence interval bars shown. The sample contains 29,440
immigrants, including 6,188 newcomers, 23,061 long-time immigrants, and 191 migrants with an unknown
length of stay. Migrants with concrete migration plans were identified using the question “Are you planning to
move permanently to another country in the next 12 months, or not?”, In contrast to the main analysis, a person
with concrete migration plans could be matched to multiple migrants for reasons of sample size.
-1-0.9-0.8-0.7-0.6-0.5-0.4-0.3-0.2-0.1
00.10.20.30.40.50.60.70.80.9
1
Life evaluation Positive affect Negative affect
Ch
ange
in h
app
ines
s
All immigrants Newcomers Long-timers
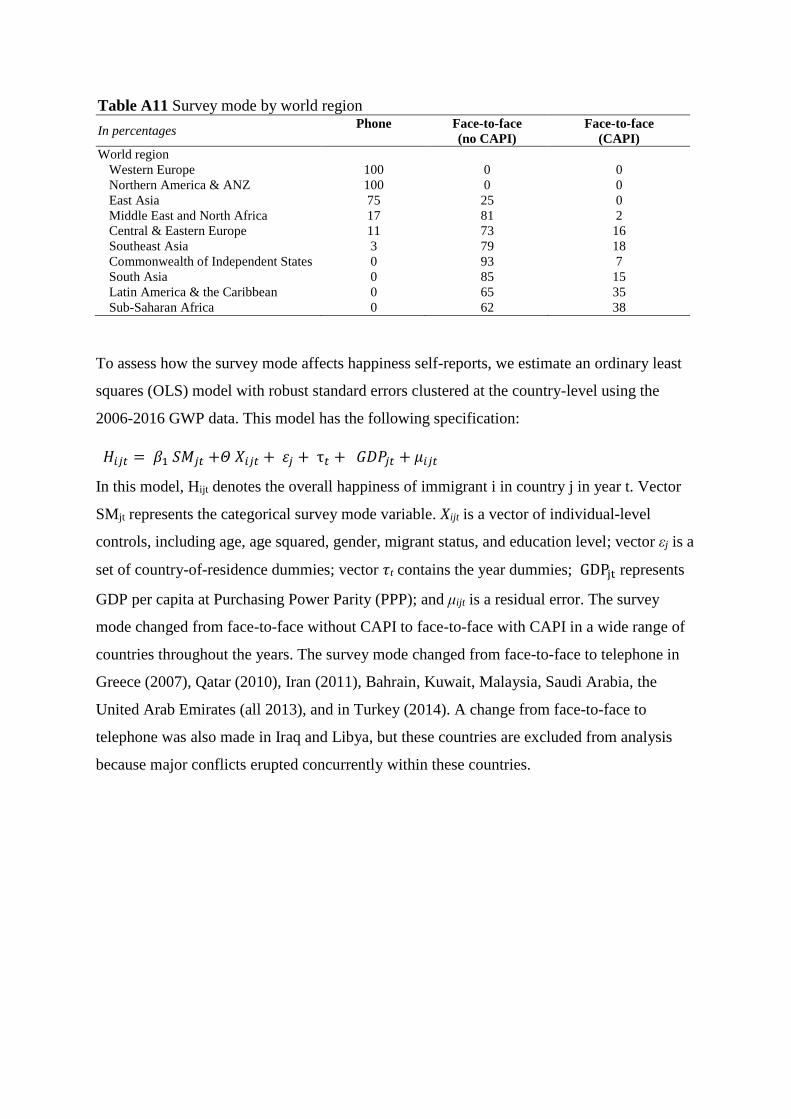
Table A11 Survey mode by world region
In percentages Phone Face-to-face
(no CAPI) Face-to-face
(CAPI) World region
Western Europe 100 0 0
Northern America & ANZ 100 0 0
East Asia 75 25 0
Middle East and North Africa 17 81 2
Central & Eastern Europe 11 73 16
Southeast Asia 3 79 18
Commonwealth of Independent States 0 93 7
South Asia 0 85 15
Latin America & the Caribbean 0 65 35
Sub-Saharan Africa 0 62 38
To assess how the survey mode affects happiness self-reports, we estimate an ordinary least
squares (OLS) model with robust standard errors clustered at the country-level using the
2006-2016 GWP data. This model has the following specification:
In this model, Hijt denotes the overall happiness of immigrant i in country j in year t. Vector
SMjt represents the categorical survey mode variable. Xijt is a vector of individual-level
controls, including age, age squared, gender, migrant status, and education level; vector εj is a
set of country-of-residence dummies; vector 𝜏t contains the year dummies; GDPjt represents
GDP per capita at Purchasing Power Parity (PPP); and μijt is a residual error. The survey
mode changed from face-to-face without CAPI to face-to-face with CAPI in a wide range of
countries throughout the years. The survey mode changed from face-to-face to telephone in
Greece (2007), Qatar (2010), Iran (2011), Bahrain, Kuwait, Malaysia, Saudi Arabia, the
United Arab Emirates (all 2013), and in Turkey (2014). A change from face-to-face to
telephone was also made in Iraq and Libya, but these countries are excluded from analysis
because major conflicts erupted concurrently within these countries.
𝐻𝑖𝑗𝑡 = 𝛽1 𝑆𝑀𝑗𝑡 +𝛩 𝑋𝑖𝑗𝑡 + 𝜀𝑗 + τ𝑡 + 𝐺𝐷𝑃𝑗𝑡 + 𝜇𝑖𝑗𝑡

Table A12 OLS regression: Survey mode
Dependent variable Life evaluation Positive affect Negative affect
Country-level
Phone Ref. Ref. Ref.
Face-to-Face (no CAPI) 0.19
(0.12)
0.38
(0.28)
-0.60**
(0.21)
Face-to-Face (CAPI) 0.09
(0.13)
0.26
(0.32)
-0.29
(0.23)
GDP per capita (x1000) 0.02*
(0.01)
0.00
(0.00)
-0.01**
(0.00)
Individual level
Age -0.03** -0.01** 0.01**
(0.01) (0.00) (0.00)
Age2/100 0.03** 0.00** -0.00**
(0.01) (0.00) (0.00)
Female 0.09** 0.00 0.03**
(0.01) (0.00) (0.00)
Education level
Primary school or less Ref. Ref. Ref.
Secondary school or some tertiary education 0.54**
(0.02)
0.05**
(0.00)
-0.04**
(0.00)
4-year university degree or higher 1.06**
(0.03)
0.09**
(0.01)
-0.07**
(0.01)
Immigrant -0.18** -0.02** 0.02**
(0.04) (0.01) (0.00)
Year dummies Yes Yes Yes
Country Dummies Yes Yes Yes
N individuals 1,246,560 1,246,560 1,246,560
N countries 153 153 153
R2 0.24 0.09 0.06
Notes: Regression coefficients are displayed with cluster-robust standard errors in parentheses. * p<0.05, **
p<0.01.