one hundred years of forgetting a quantitative … · one hundred years of forgetting" a...
TRANSCRIPT

Psychological Review Copyright 1996 by the American Psychological Association, Inc. 1996, Vol. 103, No. 4, 734-760 0033-295X/96/$3.00
One Hundred Years of Forgetting" A Quantitative Description of Retention
David C. Rubin Duke University
Amy E. Wenzel University o f Iowa
A sample of 210 published data sets were assembled that (a) plotted amount remembered versus time, (b) had 5 or more points, and (c) were smooth enough to fit at least 1 of the functions tested with a correlation coefficient of .90 or greater. Each was fit to 105 different 2-parameter functions. The best fits were to the logarithmic function, the power function, the exponential in the square root of time, and the hyperbola in the square root of time. It is difficult to distinguish among these 4 functions with the available data, but the same set of 4 functions fit most data sets, with autobio- graphical memory being the exception. Theoretical motivations for the best fitting functions are offered. The methodological problems of evaluating functions and the advantages of searching exist- ing data for regularities before formulating theories are considered.
At the simplest level, this article is a search for regularities. We ask whether there is one retention function that can describe all of memory, or perhaps a different function for each of a small number of different kinds of memory. At a more abstract level, it is about the role of theory and data in psychological research. Can we most rapidly advance psychology as a science by devel- oping theories at the level that commonly fills psychological jour- nals such as this one, or should we first try to describe phenomena that could constrain theories by establishing robust, preferably quantitative, regularities (Rubin, 1985, 1989, 1995)? A balance between these alternatives is needed, and here we argue that to obtain such a balance more description is needed.
Retention offers the ideal topic to make this abstract, philo-
David C. Rubin, Department of Experimental Psychology, Duke University; Amy E. Wenzel, Department of Psychology, University of Iowa.
We thank John Anderson, Alan Boneau, John Cerella, Herb Crovitz, Sean Hinton, Armando Machado, Bennet Murdock, Matt Serra, Har- old Schiffman, John Staddon, Wayne Wickelgren, and John Wixted for their suggestions; Richard Palmer for information about the exponen- tial-power function and its history and use in physics; Michael Reed for mathematical advice and help with derivations; Robert Terry for statistical advice; and Jenny Zervakis for help with the figures. Support was provided by a Duke University Research Council grant and by Na- tional Science Foundation Grant BNS-9010174. Parts of this research were presented in Amy E. Wenzel's senior honor's thesis and at the 35th annual meeting of the Psychonomic Society in St. Louis, MO, in No- vember 1994.
Although we tried to be exhaustive in our search of the literature on retention functions, we must have omitted many relevant data sets. We hope to continue this effort and to maintain as complete a public record of retention functions as is possible. We therefore would be grateful for information about any data sets that we failed to find.
Correspondence concerning this article, including requests for a com- puter-readable copy of the data sets we have assembled, should be ad- dressed to David C. Rubin, Department of Experimental Psychology, Duke University, Durham, North Carolina 27708-0086. Electronic mail may be sent via Internet to [email protected].
sophical debate concrete and in doing so to reveal the strengths and weaknesses o f the different approaches. At the theory- driven extreme are proponents who derive retention functions from first principles: either differential equations describing memory mechanisms (Wickelgren, 1972, 1974a, 1974b) or more global principles of optimization (Anderson, 1990; An- derson & Schooler, 1991 ). At the data-driven extreme is the present a t tempt to search the literature for as many data sets as possible and to fit each one with as many functions as can be practically managed in order to provide the most theory-neutral empir ical description possible.
How should we do science efficiently? When is it most effi- cient to speculate, when is it most efficient to produce a formal mathematical model, and when is it most efficient to search the data and describe regularities? In high school science and in graduate school experimental design, we are taught to first for- mulate a theory, to next derive testable hypotheses, and finally to test them experimentally. We usually write our papers (and always write our grant proposals) as i f we did only this. But many advances in science have been made by document ing and accumulating regularities, often quantitative regularities, and only then developing theories to account for them. Theories so developed are next tested on novel predictions and altered or abandoned as needed. In psychology the latter approach is most often seen in contemporary mathematical modeling; it is the one favored here. However, in many areas, such as retention, we are at the stage where the lack Of a documented regularity makes theory formulation inefficient and the phenomenon itself is ignored in theory building (Brainerd, Reyna, Howe, & Kingma, 1990; Ratcliff, 1990; Slamecka & McElree, 1983). For these cases, quantitative descriptions in a form that is as theory- neutral as possible are needed before theory can be efficiently developed. The data for such a description have been accumu- lating for over 100 years.
Among the basic inquiries Ebbinghaus (1885 /1964) made when he began the experimental study of human memory was an investigation of the shape of the retention function. He learned lists of nonsense syllables until he could recite them
734

100 YEARS OF FORGETTING 735
twice perfectly and then measured the percentage of time saved when he tried to relearn them later at delays ranging from 20 min to a month. His data provide the classic retention function: smooth, monotonic, decreasing rapidly at first, but then level- ing. Ebbinghaus proposed the function y = 100. a / { [ log (t) ] b + a } to fit his data but mentions no other functions he consid- ered. The search has continued in much the same fashion for the last century, with each researcher considering at most a handful of data sets and functions.
Here we make an evaluation that is as unbiased as possible of what we now know. Our work builds on studies testing one or two theoretically motivated functions on a variety of data sets (e.g., Indow, 1993; Laming, 1992; Wickelgren, 1972, 1974a; Woodworth, 1938) and on studies comparing a handful of func- tions using one (Rubin, 1982) or a handful (Anderson & Schooler, 1991; Wixted & Ebbesen, 1991 ) of experimental pro- cedures. We differ from these earlier careful and informative studies mainly in our lack of selectivity of functions and data sets. Unlike most previous attempts, no new data are collected; we find it inefficient to add to a large database before evaluating it to find what data are needed. Unlike most previous attempts, no single function is favored on theoretical grounds; the more standard scientific approach for our level of knowledge is first to determine which functions fit the data and only then attempt to account for these findings theoretically. That is, we initially view retention as an empirical observation rather than as an hypothesized process, reserving theory building until the reten- tion function is described in relatively neutral terms (Slamecka, 1985). Theory is not abandoned; we know a great deal about retention that is needed for an intelligent investigation. How- ever, theory must fit the existing data, and for retention there is considerable existing data.
A n Out l ine
First, we review some fundamental questions that have been raised in the long history of the study of retention functions. We do this to guide our analysis of the existing data, to develop a set of questions we will ask of the data, and to benefit from insights gained in earlier work.
Second, we describe 210 data sets from the psychological lit- erature that (a) have a measure of amount remembered as one variable and time since learning as a second variable, (b) have 5 or more points, and (c) fit at least one of the two-parameter functions tested with a correlation of .90 or greater. The first criterion is the definition of a retention function. The second criterion ensures enough points to differentiate among two-pa- rameter functions. A straight line can fit any two points per- fectly. A smooth curved line can usually fit three points per- fectly if the points are monotonically decreasing and one selects from as many functions as are used here. We therefore required two data points beyond this minimum. The third criterion lim- its our database to smooth plots. Thus we use arbitrary but rea- sonable, objective, and easy-to-apply criteria to assemble as large and unbiased a collection of data sets as possible.
Third, we describe the set of 105 two-parameter functions to which we fit each of the 210 data sets. We include the standard linear, hyperbolic, logarithmic, exponential, and power func- tions. We also include some novel ones. However, they are no
stranger than Ebbinghaus' (1885/1964) original attempt, or In(y) = ln(a/2.51 ) - ( a2 /2 ) . ( ln ( t ) - b) 2, which was among those considered by Rubin (1982). At this stage no attempt is made to limit our search to theoretically motivated functions. Ifa function fits, the challenge we face is to explore its properties or to derive it from reasonable principles. Thus even a function as odd as the one just given is a form of the lognormal distribu- tion, and it would have theoretical interest if it fit the data.
Fourth, we sort this mass of over 22,000 correlations for pat- terns. In particular we expect to find that one of the following three patterns will hold. First, one function (or a small set of equally good-fitting functions) fits all the retention data; that is, within experimental error there is one retention function that describes all procedures and participants tested. Second, different functions (or different sets of functions) fit different classes of data sets; for instance, there may be one function for recall data and another for recognition data. Third, no patterns emerge; that is, there is no lawful way to generalize over data sets to provide a quantitative description of retention. The search for one of these three patterns must be done before any serious theoretical work. Psychologists have assumed that the first or second option would hold, but this is an empirical ques- tion. Because many arbitrary decisions are made in such a de- scriptive undertaking and because inferential statistics to check such decisions are not always possible, we make our collection of data sets available to others so they may try their own procedures.
Fifth, we review the results in terms of the questions raised by the initial literature search and in terms of new practical and theoretical questions that arise. We include theoretical deriva- tions for the best fitting functions, and we suggest useful studies that we did not find in the literature. Finally, we examine the implications of the research approach undertaken and ponder how psychology can most rapidly advance as a science.
Two notes of caution should be introduced before proceed- ing. The first is that although the study of retention functions is often called the study of forgetting, what is remembered is measured, not what is forgotten. Items not remembered can be assumed to be forgotten only on the one instance in which the measurement was made. They may be remembered in a differ- ent but otherwise similar situation or under different testing conditions. The second caution is that time is the independent variable in all studies reported here, but time is not what is im- portant to retention. How the time is filled is what matters (Baddeley, 1990; McGeogh, 1932; Rubin, 1995). Time is the best index we have of the amount of interfering or competing activity that has occurred in the retention interval. In single- session studies the activity that fills the retention interval is known. In multiple-session studies it is assumed to be equal during the various intervals.
A n Example
Before presenting a literature review and an analysis of actual data sets, idealized data sets are used to provide a graphic indi- cation of both the functions to be considered and of the good- ness of fit of various degrees ofr 2. To accomplish this, two data sets were formed that were generally smooth and monotonically decreasing. The goal was not to produce the most scientifically

736 RUBIN AND WENZEL
informative data sets, but realistic ones in which a lack of fit could be attributed mostly to the shape of the function rather than to noise in the data. Data from classic studies in the short- term memory for material learned in the laboratory were aver- aged, as were data from a classic study of very long-term mem- ory for material learned outside the laboratory.
The first data set is an average of the short-term memory study of Peterson and Peterson (1959) with a replication by Murdock ( 1961 ) for the conditions in which he used tr igrams and word triads (Exper iment 1, Sessions 1 and 3). In these ex- periments participants were presented with three letters or words, counted backward during the retention interval that lasted as long as 18 s, and then recalled the three items. Mur- dock replaced Peterson and Peterson's 15-s retention interval with an immedia te retention interval, and we used Murdock 's intervals in combining data sets.
Murdock ( 1961 ) reported his immedia te retention interval as 0 s. When t ime is computed or plotted on a linear scale, as Murdock did, zero is a good estimate o f " immedia te , " but when logarithmic scales are also used, zero is undefined. In experi- ments, immediate recall is never at zero but is after the partici- pant is signaled to recall, or turns the page, or looks down to begin writing, or according to Murdock 's description, after a met ronome set to 1 s has sounded. From Murdock ' s description of his procedure, we assumed that the total t ime for his imme- diate retention interval actually occurred 1 s after learning. Our results would change only slightly i f . 1 s or .5 s were chosen instead of 1 s, but the alternative of omitt ing the immediate recall interval results in larger changes and more data loss. Sim- ilar assumptions were made for all data sets in this article re- porting a zero retention interval, and our assumed values are listed in Tables 1 to 9. As the data sets are in the public domain, alternatives can be freely considered.
The second data set was made by combining all six free recall measures from Bahrick's (1983) long-term memory study of recall of campus locations. As with the Murdock ( 1961 ) study, a t ime had to be assumed for a retention interval for immediate recall. From Bahrick's procedures we decided that the under- graduates probably saw the average city or campus location about 3 days (.008 years) before their " immed ia t e " test. The 100% value at " immed ia t e " is not a ceiling effect but the result of Bahrick normalizing his data by dividing recall at all reten- tion intervals by that at the " immed ia t e " one.
Figure 1 presents the two data sets fit to four of the most com- monly used retention functions. The most striking feature is the similarity of the appearance of the plots, given that one covers an 18-s range and the other a 46-year range. For the short-term memory data set, the exponential function fits well, as claimed in the original articles. But all functions presented fit well, with the power function providing a slightly poorer fit than the oth- ers. For the long-term memory data set, it is easier to distinguish among the functions, with the logari thmic function fitting best (as it technically does in the short-term data set) followed by the power, hyperbolic, and exponential functions, a pattern we will see again. Both the power and the logari thmic function rise rapidly to infinity as the retention interval shrinks to zero, and so for the long-term memory data set, both can more easily fit the " immedia te" data point. A linear function, y = b - m t ,
does not fit the short-term and long-term memory data sets as
oo
8
oo
tD
Short-term Memory
Hyperbolic loo]. ] 'if
Exponential
logarithmic
/ I
Power
1°°1 r2= 5075 t .936
25 • e ~ - - - _ _ _ -
0 0 5 10 15 20
seconds
Long-term Memory
y = l /(m.t + b)
y = b-e-mr
r 2 = .639 l
= b - re'In(t)
1 r 2 = .939
y = b.t ~
0 10' 20 30 40 50 years
F i g u r e 1. Retention data for an idealized short-term and an idealized very-long-term memory experiment fit to four common functions. For this figure and throughout the article, y is always a measure of remem- bering, t is time from learning, and m and b are positive, empirically fit constants.
well as the functions shown with r2s of .821 and .486, respectively.
Unlike previous studies comparing retention functions (e.g., Anderson & Schooler, 1991; Rubin, 1982; Wixted & Ebbesen, 1991 ), the fits presented were made to the untransformed data as shown in Figure l rather than to transformed data. It could be argued that there is some theoretical (Estes, 1956 ) or practi- cal (Newell & Rosenbloom, 1981 ) reason to transform the data or not to (Slamecka & McElree, 1983), but transformations do not make for a fair comparison among different functions. The logari thmic function would not change, but the hyperbolic function would be fit as 1 / y = b + m. t, the exponential as In (y) = b - m- t, and the power as ln(y) = b - m. In( t ) . The param- eters of the fits and the r 2 values differ in the two methods. For the method used here (y - )3) 2 is always minimized, where the
indicates the estimate based on the best fitting parameters for the function. For the approach used in the earlier literature, (y _ )3)2 is used for the linear and logari thmic functions, ( 1 /y -
1/)3) 2 for the hyperbolic, and [ ln(y) - In()3)] 2 for the exponen- tial and power. The r 2 values change because they are defined as one minus these values divided by the variance in y, or 1 /y , and

100 YEARS OF FORGETTING 737
In(y) , respectively. The rank orderings of the r2s of the fits for the four functions in Figure 1 do not change for the two data sets when the transformed functions are fit, but the values do. For the short-term memory data sets, the hyperbolic, exponen- tial, and power fit the transformed data with r2s of .973, .969, and .932. For the long-term memory data sets, the rEs are .736, .612, and .88 l, respectively. Thus, in the transformed data, the fits are slightly more differentiated.
Some F u n d a m e n t a l Ques t ions A b o u t Re ten t ion Func t ions
Many of the questions about the shape of retention functions that have been considered in the literature can be divided into three classes. The first and most theoretically contentious class of questions concerns how retention functions should be mea- sured, considered, and compared. The second class of questions concerns whether there is one retention function for all of mem- ory or whether there are different functions for (a) different de- grees of learning and overlearning, (b) short and long intervals, (c) different participant populations, (d) different materials or different learning processes, and (e) different memory tasks. The third class concerns dependent measures.
How Should Retention Be Measured?
Among the first class of questions, several approaches are pos- sible, and there is no simple consensus. Bahrick (1965) has noted advantages for plotting functions in units of variance, Sla- mecka and McElree (1983) have argued for a standard analysis of variance (ANOVA) technique, Loftus ( 1985a, 1985b; Loftus & Bamber, 1990) has developed a theoretical framework based on comparing functions horizontally instead of vertically, and Bogartz ( 1990a, 1990b) has considered splitting the observed function into underlying unobserved components correspond- ing to assumed memory processes. The simplest approach, and the one adopted here, is to fit the empirical data using standard curve-fitting techniques first and to consider complications only if necessary.
There are two reasons to opt for the simplest approach first. The obvious one is that, until the collection of data sets is con- sidered, it is not clear that the added complexity will aid our understanding of the data. If the best fitting function does not require the y axis to be transformed, the same conclusions will be drawn under both the ANOVA and curve-fitting approaches, and thus Siamecka and McElree's (1983) arguments would be less relevant (x-axis transformations are irrelevant because time values never enter into Slamecka and McElree's ANOVAs). Lofius's horizontal difference proposal has advantages, but these appear naturally only if the retention function is an expo- nential, which may or may not occur. Similarly, we may need to divide our function into one component for initial learning and one for retention (Bogartz, 1990b, Rubin, 1985), into one com- ponent that reflects the nature of the retrieval task and one for retention, or in any of a host of other ways depending on the differences observed across conditions. Thus, it is most efficient to wait until the results are examined to make such decisions.
The second reason for choosing the simplest empirical curve- fitting approach is more subtle and concerns the nature of the
available data. Empirical retention plots are usually aggregates over both many items and many participants. Ebbinghaus (1885/1964), Jans and Catania (1980), Nelson and Wasser- man (1978), Rubin (1982, 1989), White and McKenzie (1982), and Wickelgren (1968) are some exceptions that do not group over both dimensions simultaneously. However, be- cause in most procedures the same item cannot be tested re- peatedly with the same participant without providing addi- tional retrieval practice, grouping over either participants or items is necessary for most questions of interest. Moreover, in many procedures, such as those involving learning to a crite- rion or all of Bahrick's very-long-term studies, there are multiple exposures to the material to be tested. Thus, an im- plicit average over time is used, with the last time that material was presented in an assumed learning period taken as the be- ginning of the retention interval.
Mechanistic models predict what individual participants do on individual trials (e.g., Staddon, 1993). The difference be- tween such models and the heavily aggregated data at hand can be large. Data are lost that would allow the model to separately consider the time course of each presentation of a multiply pre- sented item or differences among individual items or partici- pants. In the extreme case, a set of all-or-none step functions for individual items or participants could be summed to form any of the aggregate functions considered here (for a review, see Kausler, 1974, pp. 8-10, 153-158). Even if all individual par- ticipants (or items) were described by the same function but with different parameters, for some functions the resulting ag- gregated function would not be the same one as the individual participants' (Estes, 1956). Therefore, it seems more reason- able initially to be satisfied with an empirical description that could constrain theorizing of all kinds than to embark on a search for a more complex theoretical framework that involves assumptions that would not apply to all models.
Is There One Retention Function for All Conditions?
There is little reason to assume that retention functions will differ or not differ along any particular dimension until existing data and theory are examined. The approach used here is to group the data sets along different dimensions guided by what we already know about memory and to see if any groupings produce functions that are more similar within the groups than between them. The basic questions are whether there is one re- tention function or many, and if there are many, what charac- terizes the different kinds (Luh, 1922). If retention is viewed as an observable, empirical phenomenon as opposed to an in- ferred mental process ( Bogartz, 1990a), then the answer to this question depends on the function that is chosen as the best em- pirical description. Different choices of a function could lead to different conclusions for the same data. Nonetheless, in most of the debate so far, regardless of theoretical positions on how retention should be measured, the equation has either been as- sumed to be y = b.e -m~ or has been chosen to fit the particular data set (Bogartz, 1990a, 1990b; Loftus, 1985a, 1985b; Loftus & Bamber, 1990). I f a retention function (or a set of retention functions) could be chosen that fit a class of retention data, one could return to this question using that function.
The particular question that has generated the most debate in
738 RUBIN AND WENZEL
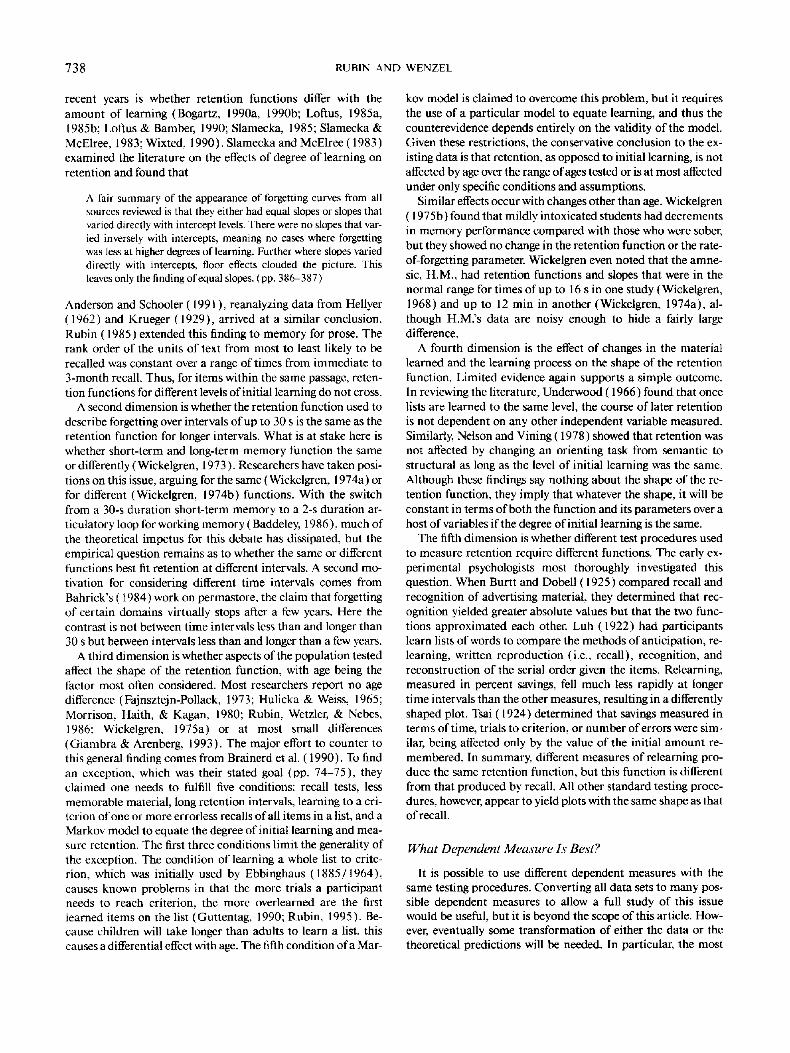
recent years is whether retention functions differ with the amount of learning (Bogartz, 1990a, 1990b; Loftus, 1985a, 1985b; Loftus & Bamber, 1990; Slamecka, 1985; Slamecka & McEIree, 1983; Wixted, 1990). Slamecka and McElree (1983) examined the literature on the effects of degree of learning on retention and found that
A fair summary of the appearance of forgetting curves from all sources reviewed is that they either had equal slopes or slopes that varied directly with intercept levels. There were no slopes that var- ied inversely with intercepts, meaning no cases where forgetting was less at higher degrees of learning. Further where slopes varied directly with intercepts, floor effects clouded the picture. This leaves only the finding of equal slopes. (pp. 386-387)
Anderson and Schooler ( 1991 ), reanalyzing data from Hellyer (1962) and Krueger (1929), arrived at a similar conclusion. Rubin (1985) extended this finding to memory for prose. The rank order of the units of text from most to least likely to be recalled was constant over a range of times from immediate to 3-month recall. Thus, for items within the same passage, reten- tion functions for different levels of initial learning do not cross.
A second dimension is whether the retention function used to describe forgetting over intervals of up to 30 s is the same as the retention function for longer intervals. What is at stake here is whether short-term and long-term memory function the same or differently (Wickelgren, 1973 ). Researchers have taken posi- tions on this issue, arguing for the same (Wickelgren, 1974a) or for different (Wickelgren, 1974b) functions. With the switch from a 30-s duration short-term memory to a 2-s duration ar- ticulatory loop for working memory (Baddeley, 1986 ), much of the theoretical impetus for this debate has dissipated, but the empirical question remains as to whether the same or different functions best fit retention at different intervals. A second mo- tivation for considering different time intervals comes from Bahrick's (1984) work on permastore, the claim that forgetting of certain domains virtually stops after a few years. Here the contrast is not between time intervals less than and longer than 30 s but between intervals less than and longer than a few years.
A third dimension is whether aspects of the population tested affect the shape of the retention function, with age being the factor most often considered. Most researchers report no age difference (Fajnsztejn-Pollack, 1973; Hulicka & Weiss, 1965; Morrison, Haith, & Kagan, 1980; Rubin, Wetzler, & Nebes, 1986; Wickelgren, 1975a) or at most small differences (Giambra & Arenberg, 1993). The major effort to counter to this general finding comes from Brainerd et al. (1990). To find an exception, which was their stated goal (pp. 74-75), they claimed one needs to fulfill five conditions: recall tests, less memorable material, long retention intervals, learning to a cri- terion of one or more errorless recalls of all items in a list, and a Markov model to equate the degree of initial learning and mea- sure retention. The first three conditions limit the generality of the exception. The condition of learning a whole list to crite- rion, which was initially used by Ebbinghaus (1885/1964), causes known problems in that the more trials a participant needs to reach criterion, the more overlearned are the first learned items on the list (Guttentag, 1990; Rubin, 1995). Be- cause children will take longer than adults to learn a list, this causes a differential effect with age. The fifth condition of a Mar-
kov model is claimed to overcome this problem, but it requires the use of a particular model to equate learning, and thus the counterevidence depends entirely on the validity of the model. Given these restrictions, the conservative conclusion to the ex- isting data is that retention, as opposed to initial learning, is not affected by age over the range of ages tested or is at most affected under only specific conditions and assumptions.
Similar effects occur with changes other than age. Wickelgren (1975b) found that mildly intoxicated students had decrements in memory performance compared with those who were sober, but they showed no change in the retention function or the rate- of-forgetting parameter. Wickelgren even noted that the amne- sic, H.M., had retention functions and slopes that were in the normal range for times of up to 16 s in one study (Wickelgren, 1968) and up to 12 min in another (Wickelgren, 1974a), al- though H.M.'s data are noisy enough to hide a fairly large difference.
A fourth dimension is the effect of changes in the material learned and the learning process on the shape of the retention function. Limited evidence again supports a simple outcome. In reviewing the literature, Underwood (1966) found that once lists are learned to the same level, the course of later retention is not dependent on any other independent variable measured. Similarly, Nelson and Vining ( 1978 ) showed that retention was not affected by changing an orienting task from semantic to structural as long as the level of initial learning was the same. Although these findings say nothing about the shape of the re- tention function, they imply that whatever the shape, it will be constant in terms of both the function and its parameters over a host of variables if the degree of initial learning is the same.
The fifth dimension is whether different test procedures used to measure retention require different functions. The early ex- perimental psychologists most thoroughly investigated this question. When Burtt and Dobell ( 1925 ) compared recall and recognition of advertising material, they determined that rec- ognition yielded greater absolute values but that the two func- tions approximated each other. Luh (1922) had participants learn lists of words to compare the methods of anticipation, re- learning, written reproduction (i.e., recall), recognition, and reconstruction of the serial order given the items. Relearning, measured in percent savings, fell much less rapidly at longer time intervals than the other measures, resulting in a differently shaped plot. Tsai (1924) determined that savings measured in terms of time, trials to criterion, or number of errors were sim- ilar, being affected only by the value of the initial amount re- membered. In summary, different measures of relearning pro- duce the same retention function, but this function is different from that produced by recall. All other standard testing proce- dures, however, appear to yield plots with the same shape as that of recall.
What Dependent Measure Is Best?
It is possible to use different dependent measures with the same testing procedures. Converting all data sets to many pos- sible dependent measures to allow a full study of this issue would be useful, but it is beyond the scope of this article. How- ever, eventually some transformation of either the data or the theoretical predictions will be needed. In particular, the most

100 YEARS OF FORGETTING 739
common dependent measure reported, percentage correct, can- not be a measure of underlying memory strength in most models. At a minimum it fails to distinguish degrees of over- learning at 100% correct and degrees of what might be left at 0%.
The second most common measure after percentage correct is d', which is used to report many studies of recognition mem- ory. d' is a measure of sensitivity from statistical decision theory (Green & Swets, 1966). It is analogous to a t test in that its numerator is the difference of the means of two distributions and the denominator is a measure of the standard deviation of the distributions. The data used to estimate the means of the distributions are the probabilities of saying that a word that oc- curred earlier in an experiment when it did occur (i.e., the prob- ability of a hit), p (hit), and the probability of saying that a word that occurred earlier in an experiment when it did not (i.e., the probability of a false alarm), p(fa). Two methods are used in memory experiments to transform the p(hit) and p(fa) mea- sures to a Scale with a unit standard deviation so that they can be subtracted to yield d'. In the simplest method, p = .5, which is the location of the mean of the underlying distribution, is sub- tracted from both p ( hit ) and p (fa). These values are converted to normal deviate scores, or z scores--z(hit) and z ( fa ) - -and subtracted from each other to produce d'. In the more complex method, memory operating characteristic curves are formed by obtaining not only yes-no decisions fo r each word presented for recognition but also confidence ratings. A p (hit) and p(fa) for each level of confidence is plotted on double-probability paper with normal deviate scales, and d' is determined graphically (see Wickelgren, 1972, for more details).
In some memory experiments, such as those using continu- ous recognition, the false-alarm rates are for items not seen be- fore, and thus they have no retention interval. Researchers using d' for such experiments therefore assume that the false-alarm rate does not change with retention interval; that is, for exam- ple, that participants do not relax their criterion when they think that an item occurred a long time ago. Thus the level of p(fa) used is the same for all retention intervals, and changes in d' must be due to changes in p(hit) or in the simpler method described, z(hit). If the transformation from p(hit) to z(hit) were linear, then d' would be a linear transformation of percent- age correct. Over the range ofp(h i t ) = 15% to 85%, this is a fair approximation. In fact, Wixted and Ebbesen ( 1991 ), whose recognition-experiment points all fell in this range, found that percentage correct and d' yielded the same functions. At more extreme values, small changes in proportion correct yield large changes in z scores and thus in d'. Thus, one might expect plots fit to d' and proportion correct to differ most for y values near 0% and 100%.
Another common dependent measure is log d, which is used in studies of animal discrimination. Log d is the log [p (correct)/p ( w r o n g ) ] averaged over the two stimuli of the discrimination experiment. If the animal makes a choice on each trial, it becomes log[p(correct)/( 1 - p(correct)], which is the same as the log of the odds measure introduced indepen- dently into the literature by Anderson and Schooler (1991 ). The measure has useful properties for animal research and also can be seen as a variant of d' (White, 1985; White & McKenzie, 1982). The studies using laboratory animals as subjects tend to
report their data in detail, and we can therefore report analyses based on proportion correct to allow a comparison with other studies.
Anderson and Schooler ( 1991 ) have used an odds measure equal to p / ( 1 - p ) with empirical success. Their measure has advantages in terms of their theory and lets the dependent mea- sure go to infinity as t approaches zero as needed by the two- parameter logarithmic and power functions.
Bahrick (1965) proposed the ebb as a unit based on percent- age correct. His argument was as follows. Recall or recognition data yield a dichotomy of remembered or not remembered. The proportion remembered represents the proportion of memories that have a strength above a threshold. The observed retention function for percentage or proportion correct depends not only on how these unobserved, inferred strengths weaken with time, but also on the shape and variance of their distribu- tion and the position of the threshold relative to the distribution at t = 0. Without added assumptions, the added factors about the underlying strength cannot be known. If the weak assump- tion is made that the distribution is normal, then normal devi- ate scores can be used to assess the position of the mean strength from the proportion correct scores, as is done in estimating d'. In fact, the ebb measure can be seen as the half of the d' measure based on hits. Because of the shape of the normal distribution, the ebb measure provides a transformation that separates per- centage correct scores near 0 and 100% much more than scores near 50%. Bahrick's ebb measure was not adopted here because of the desire to first describe the data with as few assumptions or transformations as possible, but like d', log d, and the odds ratio, it is a reasonable first step in going from the observed data to the realm of underlying process needed to evaluate proposed theoretical mechanisms.
The d', ebbs, and odds ratio can have serious measurement problems for most psychological data. In retention experi- ments, changes of .01 in probability are hardly ever reliable. That is, an observed proportion correct of .99 will result in a value of.98 or 1.00 on replication, with a probability not much lower than that of obtaining the original value of .99. Yet the odds measure can vary dramatically with .01 changes that occur nearp = 1.00. The odds forp = .50, .51, .52, and .53 go from 1.00 to 1.04 to 1.08 to I. 13 in small, nearly uniform steps so that a random change among them on replication would not greatly alter a curve fit. In contrast, the odds for p = .97, .98, .99, and 1.00 go from 32 to 49 to 99 to infinity. The nonlinearity is less important in the log d measure used with delayed match- ing to sample in animals (e.g., White, 1985), because in these studies individuals and groups rarely approach extreme levels of performance. But where the probability of retention ap- proaches 1.00 (or 0.00 for d' and the log odds ratio), care must be taken to ensure that the confidence intervals around the points are reasonable for the transformed values. If this is not possible, the empirical values can be left as percentage correct, and the theoretical values in terms of d' odds, or ebbs can be transformed into percentage correct values.
Other dependent measures, including savings (Ebbinghaus, 1885/1964; Finkenbinder, 1913; see Bahrick, 1965, for a discussion) and discrimination index (Nelson & Wasserman, 1978), are each used in one or more studies but, except for savings, do not provide enough data for comparisons.

740 RUBIN AND WENZEL
In summary, the studies to date indicate that aspects of the participant population and materials have little effect on the shape of the retention function if the level of initial learning is controlled. The testing procedures used do have an influence but, except for the savings, these appear to be relatively minor in practice. If this conclusion holds on closer investigation and if it applies to other factors, a relatively simple empirical de- scription may be available in which the same function (or set of functions) with the same parameters holds over a range of conditions once the level of initial learning is controlled. Trans- formations of the data from percentage correct to d', ebbs, log d, or odds ratio affect curve fitting to various degrees, but these mathematical transformations should be viewed separately from the procedures used to produce the data. Moreover, the relation of any of these observed measurements and underlying memory strength cannot be decided outside the context of a theory. With full reporting of the data, they can be applied at will depending on the psychometric properties of the data and the theoretical disposition of the researcher.
The Data Sets
General Criteria and Procedures
The literature was searched to assemble a sample of data sets l that each had five or more data points consisting of a measure of the amount remembered as one value and the time since learning as a second value and that fit at least one of the two- parameter functions tested with a correlation of.90 or greater. These data sets are organized in Tables 1 to 9 according to major divisions that might cause differences in their retention func- tions. Other important features of the data sets are listed along with identifying information so that the reader can entertain some alternative hypotheses from the tables and can formulate others by examining the full description of the studies in their original publications. Data sets in Tables 1-9 are labeled with the number of the figure or table in the original article from which the data were extracted. If more than one data set was taken from the figure or table, then we added a one- or two-letter code to distinguish between the specific data sets. Some of these codes may seem opaque here but are easier to interpret in the context of the original articles. In a few cases two data sets rep- resented the same conditions but were tested in terms of two different tasks (e.g., Bahrick, 1984, Figure 6). In this case, the labels are identical, and the data sets can be distinguished by the task column.
We did not convert the data sets to common units. The ex- ceptions are that all values for percentage correct, proportion correct, and number correct are reported as percentage correct. The units of time are those reported in the original studies. We kept the original units to allow the reader to more easily match and compare our description of the data with that in the original articles, to avoid the awkwardness of having to report values tfiat are difficult to understand, such as 1.46 x 10 9 S for the 46.33-year retention interval of Bahrick ( 1983 ), and because the unit change does not affect the r 2 values reported.
There are two exceptions to our attempt to be as inclusive as possible. First, we did not search for data sets that had a longest retention interval of shorter than a few seconds. Second, we did
not include studies that explicitly studied reminiscence because such studies often use repeated testing of participants and score performance differently from most retention studies (see Roe- diger & Payne, 1982, and Wheeler & Roediger, 1992, for reviews). For example, Ballard ( 1913 ) obtained reminiscence in part because, for each retention interval, he counted answers correct if students answered them correctly in that or in previ- ous retention intervals.
Data Sets From the Laboratories of Bahrick and Wickelgren
Two laboratories were responsible for many of the data sets. We list these separately to assess how much variability can be expected among studies performed in the same manner. The variability within each laboratory provides a baseline against which differences among laboratories and techniques can be compared. For these purposes it is fortunate that the two labo- ratories differ so greatly in their methods. We cannot do justice to the amount of effort and importance of the work done in these two laboratories, or in the studies from other laboratories that enter as a line or two in a table here. Rather we provide just enough information to allow interpretation of the results and to provide concrete examples of the kind of studies involved.
The research from Bahrick's laboratory reported here in Ta- ble 1 is mostly of material learned outside the laboratory while participants were growing up in the United States and then later tested, usually under controlled conditions. A range of materials has been used, including the names and faces of high school classmates, information about the layout of the city in which college was attended, and Spanish learned in school. Dependent measures varied as needed to test the material and included free and cued recall, recognition, matching names and locations or names and faces, and Spanish reading comprehension. As with many laboratory studies, different participants were tested at each retention interval, but here the participants were not ran- domly assigned. To produce a large range of retention intervals, typically from 3 months to 50 years, the age of the participant at the time of testing and retention interval were confounded. For instance, all participants learned the names of their high school classmates in high school. Therefore participants tested at the longer retention intervals were older than those tested at the shorter retention intervals. In many laboratory studies of retention, the material is presented once in the laboratory and tested once in the laboratory, either for its contents or for the fact that it occurred within the laboratory session. In contrast, in the Bahrick studies the material was presented and tested many times in the course of life outside the laboratory and then tested once in a laboratory-like situation.
The research from Wickelgren's laboratory reported in Table 2 provides a contrast in that it uses a procedure and dependent measure Bahrick did not use, usually uses the same participants at all time intervals, and has its longest retention intervals shorter than most of Bahrick's shortest retention intervals. In a typical study, participants were presented with a series of words,
A computer-readable copy of the data sets is available from David C. Rubin.

100 YEARS OF FORGETTING
Table 1
Descriptions of Data Sets From Bahrick 's Laboratory With Fits to Selected Functions
741
Range r 2 fit of selected functions
Study ~ Task Time % correct Lin Hyp Exp Log (m) Pwr EP HP Hi
Bahrick et al. (1975) 4 FR 4n MG
Bahrick (1983) 8 FR 8 MG 8 CR 9ca FR 9ca CR 9ci CR 9ci FR 9ci MG 9ca MG 10s FR 10s CR 10i FR 101 CR 10a FR
Bahrick (1984) 6sv CR 6sv RG 6ev CR 6ev RG 6g CR 6g RG 6i CR 6i RG 6 WO
M
3 mo-48 y 47-20 .90 .87 .89 .73 (3.9) .69 .83 .80 .90 3 mo-48 y 90-59 .89 .85 .87 .55 (4.7) .52 .75 .72 .94
3 d-46 y 100-31 .20 .73 .43 .86 (9.3) .84 .74 .88 .98 3 d-46 y 100-23 .41 .92 .76 .92 (10) .85 .93 .95 .95 3 d-46 y 100-7 .33 .96 .88 .94 (11) .91 .95 .95 .98 3 d-46 y 100-39 .67 .88 .78 .85 (7.2) .78 .96 .97 .97 3 d-46 y 100-28 .57 .92 .78 .88 (9.1) .79 .95 .96 .96 3 d-46 y 100-1 .53 .92 .80 .91 (11) .82 .93 .92 .93 3 d-46 y 100-16 .69 .97 .88 .82 (9.6) .71 .97 .92 .97 3 d-46 y 100-45 .56 .80 .68 .73 (7.1) .66 .86 .88 .87 3 d-46 y 100-59 .79 .88 .84 .73 (4.5) .68 .95 .95 .95 3 d-46 y 100-15 . 16 .93 .95 .83 (12) .85 .92 .88 .95 3 d-46 y 100-20 .22 .84 .69 .89 (10) .92 .84 .92 .92 3 d-46 y 100-35 .59 .78 .69 .87 (7.3) .82 .88 .91 .91 3 d-46 y 100-36 .47 .73 .58 .85 (7.7) .80 .84 .90 .90 3 d-46 y 100-43 .79 .88 .84 .80 (5.9) .74 .95 .94 .95
mo-50 y 57-22 .39 .53 .45 .90 (1.3) .88 .72 .83 .93 mo-50 y 62-45 .19 .21 .20 .75 (.32) .77 .40 .44 .87 mo-50 y 66-21 .33 .56 .41 .89 (1.6) .88 .72 .86 .97 mo-50 y 69-47 .36 .40 .38 .80 (.39) .79 .60 .64 .84 mo-50 y 57-14 .47 .79 .62 .96 (1.6) .92 .88 .97 .97 mo-50 y 56-22 .45 .52 .48 .90 (.54) .90 .69 .76 .91 mo-50 y 12-6 .27 .31 .29 .81 (. 19) .83 .50 .56 .88 mo-50 y 39-16 .60 .73 .66 .95 (.38) .91 .88 .94 .97 mo-50 y 32-10 .59 .64 .62 .81 (.33) .78 .75 .78 .83
.50 .74 .66 .84 .80 .82 .85 .93
Note. The participants were adults, and 9 points were fit. Lin = linear; Hyp = hyperbolic; Exp = exponential; Log = logarithmic; m = slope parameter; Pwr = power; EP = exponential power; HP = hyperbolic power; Hi = the highest of the 105 functions fit; CR = cued recall; FR = free recall; MG = matching; RG = recognition, WO = word order; mo = month; d = day; y = year. a Subentries are the number of the figure or table in the study from which the data were extracted. If more than one data set was taken, a one- or two- letter code was added to distinguish them from each other.
one every few seconds. They judged whether the word presented was also presented earlier in the exper iment . By varying the spacing between repet i t ions o f a word in this con t inuous recog- n i t ion task, re ten t ion intervals of between I s and 2 h r were typically ob ta ined in a single session, with intervals o f up to 2 weeks achieved by having addi t ional sessions. The par t ic ipants were often undergraduates , bu t as men t ioned earlier, people of different ages; an amnes ic pa t ien t (H .M. ) , and s tudents while sober or in toxica ted were also tested. All results are repor ted in t e rms o f the signal-detection measure , d'. Unl ike Bahr ick ' s tests for the con ten t of semant ic m e m o r y of mater ia ls learned over m a n y presentat ions, Wickelgren 's test was for the episodic m e m o r y of whether there was a previous presenta t ion of a well- known word wi th in the exper imenta l context.
Data Sets Sorted by Task and Species
The r ema in ing data sets are grouped themat ical ly ra ther than by laboratory. Recogni t ion and recall da ta sets are repor ted in Tables 3 and 4. Savings and sensor imotor tasks are repor ted in Tables 5 and 6. Two recogni t ion studies require added clarifi- cation. Luh ( 1922 ) presented recogni t ion da ta in three separate
tables. However, the recogni t ion da ta f rom the 100% learning condi t ion in his Table 15 were no t included in our analysis be- cause they were the same values as the data for the second set of exper iments in his Table 11. In Spitzer (1939) , par t ic ipants were tested two and somet imes even three t imes. Al though re- peated test ing did occur, recogni t ion monotonica l ly decreased, and we included the data.
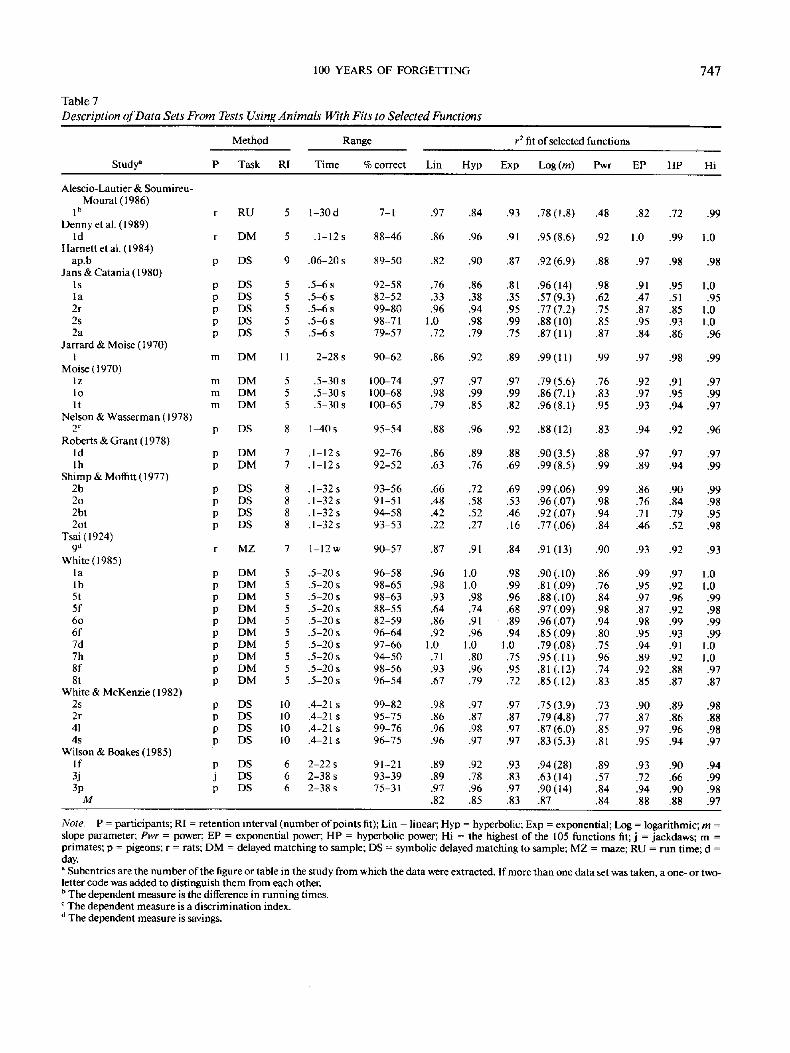
Studies of re tent ion in an imals are repor ted in Table 7. The mos t c o m m o n procedure for these studies is delayed ma tch ing to sample. Subjects indicate tha t one o f two choices represents the mos t recently presented target stimulus. Variants exist, bu t in one form, an imals are presented wi th a target s t imulus (e.g., ei ther vertical or hor izonta l l ines) on a central key. After a b r i e f delay, compar i son st imuli (i.e., hor izonta l and vertical l ines) appear on left and r ight keys, and the an imal is rewarded for indicat ing which occur red earlier. In delayed symbolic ma tch- ing to sample, the s t imulus present at test ing is no t identical to the one initially presented bu t ei ther s tands for it or notes a pat- tern in it. These procedures and thei r var iants have a variety o f names including delayed pai red compar i son and delayed condi- t ional d iscr iminat ion . In one case we changed the dependen t measure because the one the exper imenters repor ted increased

7 4 2 RUBIN AND WENZEL
Table 2
Description of Data Sets From Wickelgren "s Laboratory With Fits to Selected Functions
Method Range r 2 fit of selected functions
Study a P RI Time d' Lin Hyp Exp Log (m) Pwr EP HP Hi
Begg & Wickelgren (1974) lal u 14 7.5 s-2 hr 5.0-1.8 .68 .81 .76 .89(.42) .85 .89 .91 .91 lah u 14 7.5 s-2 hr 4.4-2.3 .60 .71 .68 .83 (.35) .80 .82 .84 .84 lbl u 13 7.5 s-2 hr 4.4-1.2 .69 .76 .72 .82 (.41) .78 .84 .85 .85 lbh u 13 7.5 s-2 hr 4.6-1.9 .76 .85 .81 .83 (.35) .78 .91 .91 .91 21 u 13 15 s-2 hr 1.8-0.4 .57 .81 .68 .92(.21) .92 .86 .92 .92 2h u 13 15 s-2 hr 1.6-0.4 .63 .80 .72 .85 (. 17) .82 .84 .86 .86
Fajnsztejn-Pollack (1973) la c 5 2-49 w 4.0-1.4 .94 .97 .96 .94 (.75) .88 .97 .93 .98 It c 5 2-49 w 3.3-1.0 .92 .96 .96 .95 (.67) .88 .96 .93 .98 1 s c 5 2-49 w 2.6-0.6 .90 1.0 .98 .99 (.63) .91 .99 .95 1.0 1 f c 5 2-49 w 2.7-0.4 .93 .94 .96 .94 (.66) .82 .94 .88 .98 2a c 5 2-49 w 3.0-0.9 .69 .96 .86 .97 (.70) .98 .96 .99 .99 2t c 5 2-49 w 2.4-0.6 .61 .91 .76 .92 (.52) .99 .91 .98 1.0 2s c 5 2-49 w 1.8-0.2 .78 .99 .96 .99 (.49) .96 1.0 .96 1.0 2f c 5 2-49 w 1.7-0.2 .84 .99 .96 1.0 (.44) .94 .99 .96 1.0 3a c 5 2-49 w 1.8-0.2 .57 .94 .82 .88 (.45) .97 .92 .98 .98 3t c 5 2-49 w 1.2-0.2 .27 .82 .64 .60 (.26) .84 .73 .88 .96 3s c 5 2-49 w 1.3-0.2 .43 .97 .88 .80 (.34) .98 .93 .99 1.0 3f c 5 2-49 w 0.9-0.0 .46 .99 .99 .83 (.37) 1.0 1.0 .98 1.0
Wickelgren (1968) l sdt H 6 1-6 s 2.1-0.6 .87 .92 .95 .94 (.95) .90 .93 .88 .95 It H 6 .25-4 s 1.5-0.4 .83 .65 .73 .51 (.34) .43 .59 .69 .99
Wickelgren (1972) l sw u 8 .9-23 s 4.3-2.8 .68 .78 .73 .95 (.47) .97 .88 .92 .98 ltcdw u 6 .9-12 s 3.2-2.0 .78 .85 .82 .86 (.61) .85 .86 .87 .88 1 u 6 .9-12 s 1.4-0.5 .73 .90 .82 .93 (.36) .96 .91 .96 .96 3h u 8 .9-23 min 6.0-5.0 .51 .54 .52 .83 (.21) .84 .68 .70 .93 3m u 8 .9-23 min 4.0-2.6 .54 .66 .59 .81 (.57) .83 .74 .79 .84 31 u 8 .9-23 min 3.2-1.8 .68 .76 .72 .82 (.43) .81 .80 .82 .82 5t u 12 5 min-7 hr 4.2-2.2 .78 .84 .82 .88 (.43) .87 .88 .89 .89 5f u 12 5 min-7 hr 3.6-1.6 .82 .86 .85 .87 (.44) .85 .88 .88 .88 5s u 12 5 min-7 hr 2.4-0.9 .87 .92 .90 .95 (.30) .92 .95 .95 .96 6h u 15 5 hr-14 d 2.7-0.7 .75 .88 .82 .93 (.45) .90 .91 .93 .93 61 u 15 5 h r - 14 d 1.4-0.4 .55 .80 .68 .84 (.28) .85 .81 .86 .86 7h u 5 10-110 w 2.8-1.3 .83 .96 .90 .98 (.66) .99 .97 .99 .99 71 u 5 10-110 w 1.0-0.6 .76 .86 .82 .93 (. 18) .94 .90 .93 .94 8o u 7 1-60 min 1.8-1.8 .66 .86 .76 .97 (.40) .97 .92 .96 .97 8to u 5 3-61 min 3.2-1.8 .76 .85 .80 .98 (.46) 1.0 .93 .97 1.0 8tt u 6 4-62 min 3.0-1.4 .86 .91 .88 .96 (.39) .95 .95 .96 .96 8tn u 6 12-70 min 3.2-2.0 .75 .78 .76 .85 (.53) .86 .82 .84 .89
Wickelgren (1974a) 2n u 12 7-700 s 4.5-2.1 .73 .84 .79 .85 (.49) .82 .87 .87 .87
Wickelgren (1975a) la u 10 2-120 min 2.2-1.0 .58 .72 .65 .89(.28) .93 .80 .87 .95 le o 10 2-120 min 1.4-0.7 .44 .57 .50 .78(.18) .84 .67 .76 .91 lc c 10 2-120 min 0.8-0.3 .38 .47 .42 .66 (.09) .74 .55 .62 .88
Wickelgren (1975b) ls a 12 2 m-14 d 2.8-0.2 .48 .90 .78 .94 (.26) 1.0 .90 .97 1.0 la a 12 2 m-14 d 2.6-0.2 .48 .92 .82 .95 (.23) .99 .92 .98 .99
M .68 .84 .79 .88 .89 .87 .90 .94
Note. The task was always recognition. P = participants; RI = retention interval (number of points fit); Lin = linear; Hyp = hyperbolic; Exp = exponential; Log = logarithmic; m = slope parameter; Pwr = power; EP = exponential power; HP = hyperbolic power; Hi = the highest of the 105 functions fit; a = adults; c = children; H = the amnesic, H.M.; o = older adults; u = undergraduate students; w = weeks; d = days. a Subentries are the number of the figure or table in the study from which the data were extracted. If more than one data set was taken, a one- or two- letter code was added to distinguish them from each other.
as re ten t ion decreased. After t r a in ing an ima l s to t ransverse a
r u n w a y m o r e quickly w h e n a d i sc r imina t ive s t imu lus signals
food, S ÷, t han when it signals no food, S - , Alesc io-Laut ier and
S o u m i r e u - M o u r a t ( 1986 ) used the s u m of the S ÷ t imes divided
by the s u m o f the S ÷ t imes p lus the S - t imes as their dependen t
measure . However the S ÷ t imes increase as the an ima l t reats the
S ÷ and S - m o r e equally. Ins tead we r e po r t as the dependen t
m e a s u r e the difference be tween the S ÷ and the S - t imes, wh ich

100 YEARS OF FORGETTING
Table 3
Description of Recognition Data Sets With Fits to Selected Functions
743
Method
Study ~ P RI
Range r ~ fit of selected functions
Time % correct Lin Hyp Exp Log (m) Pwr EP HP Hi
Burtt & Dobell (1925) 1 u
Fioravanti & Di Cesare (1992) 2v a
Gehring et al. (1976) 2p u 2w u 2km u
Glasnapp et al. (1978) 2kn u 2cn u 2an u
Luh (1922) 6 g 11 g 15o g 15s g 15t g
Spitzer (1939) la c lu c
Squire (1989) la a
Strong ( 1913) 3 a
M
5 5 min-4 w 88-51 .90 .97 .94 .85 (3.8) .83 .98 .96 .98
6 2-48 hr 82-79 .58 .59 .59 .89 (1.4) .89 .75 .76 .89
6 10 min-3 mo 74-20 .61 .84 .73 .99 (5.7) .95 .93 .98 .99 6 10 min-3 mo 52-14 .53 .84 .69 .99 (4.2) .95 .91 .98 .99 5 4-16 mo 66-58 .97 .98 .98 1.0 (.56) 1.0 1.0 1.0 1.0
5 4 - 1 6 m o 65-48 .80 .82 .81 .85(1.0) .85 .84 .85 .85 5 4 - 1 6 m o 73-60 .20 .23 .20 .36 (.47) .39 .30 .32 .85 5 4 - 1 6 m o 44-50 .81 .82 .82 .67 (.17) .68 .76 .77 .87
5 20 min-48 hr 98-72 .89 .93 .91 .90 (5.6) .88 .97 .97 .97 5 20 min-48 hr 96-.79 .78 .82 .80 .90 (4.0) .89 .91 .92 .92 7 20 min-48 hr 98-73 .97 .97 .97 .87 (7.0) .85 .94 .93 .97 5 20 min-48 hr 93-62 .96 .97 .97 .91 (6.2) .88 .98 .98 1.0 5 20 min-48 hr 73-26 .91 .91 .92 .92 (8.4) .89 .94 .93 .96
7 5 min-63 d 52-42 .74 .78 .76 .75 (.22) .73 .94 .95 .95 7 5 min-63 d 52-25 .40 .59 .48 .98 (.70) .97 .79 .88 .98
15 1 y-15 y 77-58 .88 .92 .90 .96 (7.9) .95 .96 .96 .96
14 15 s-7 d 92-57 .28 .33 .30 .94 (2.9) .92 .60 .67 .95 .72 .78 .75 .87 .85 .85 .87 .95
Note. The task was always recognition. P = participants; RI = retention interval (number of points fit); Lin = linear; Hyp = hyperbolic; Exp = exponential; Log = logarithmic; m = slope parameter; Pwr = power; EP = exponential power; HP = hyperbolic power; Hi = the highest of the 105 functions fit; a = adults; c = children; g = graduate students; u = undergraduate students; w = weeks; mo = months; d = days; y = years. a Subentries are the number of the figure or table in the study from which the data were extracted. If more than one data set was taken, a one- or two- letter code was added to distinguish them from each other.
is abbrevia ted as r u n t ime in Table 7. Fur the rmore , a l though mos t an ima l researchers present re ten t ion data using group means , a few studies included data for individual subjects ( Jans & Catania, 1980; Nelson & Wasserman, 1978; Whi te & Mc- Kenzie, 1982). To make these studies consis tent with the others and because individual da ta were often too noisy to meet our r equ i r emen t tha t one fit be at least r = .9, we averaged data f rom the individual subjects for our analyses.
The miscel laneous category of Table 8 conta ins several da ta sets tha t require explanat ion. Bean (1912) and Luh (1922) used a recons t ruc t ion procedure . In this task, par t ic ipants first learned a list of words. Next, they were given cards in a scram- bled order with the words wr i t ten on them. The par t ic ipants were scored on the extent to which they rep roduced the order o f the words presented du r ing learning (see Serra & Nairne, 1993, for a recent appl ica t ion of this m e t h o d ) . Conway, Cohen, and Stanhope ( 1991 ) used a grouping task in which partici- pants categorized cognitive psychology t e rms of s imilar mean- ings. Rovee-Collier (1993) measured re ten t ion using the kick- ing rate of infants to the sight of a mobi le divided by thei r kick- ing rate immedia te ly after t r a in ing with the mobile. Al though implic i t m e m o r y is a ma jo r area of research in which strong claims have been made abou t re ten t ion (see Roediger & Mc- Dermot t , 1993, for a review), the comple t ion da ta sets provided
by Sloman, Hayman, Ohta , Law, and Tulving (1988) are the only implici t m e m o r y data tha t me t our cr i ter ia for inclusion. These researchers used f ragment comple t ion procedures with percentage correct as the dependent measure . A n addi t ional sixth re ten t ion interval was included in thei r Exper imen t 2, bu t we did no t include it because it was based on much less data than the earlier five.
Several researchers adopted a dat ing procedure . Per formance was measured by the absolute n u m b e r o f days away f rom the target date tha t par t ic ipants da ted events. Such measures in- crease over t ime because a m o u n t o f dat ing er ror increases over t ime. Two dat ing data sets were included for T h o m p s o n (1982) for the same exper imen t because it had two different dependen t measures. The m e a n of each par t ic ipan t ' s median dat ing er ror is the dependent measure in T h o m p s o n ( 1982, Exper imen t 2) and the mean percentage of events da ted correct ly is used in T h o m p s o n ( 1982, Exper imen t 2 ). Finally, MacLeod ( 1988 )- 4ns was included in the miscel laneous category because Mac- Leod (1988) used a mix of recogni t ion and savings. The da ta set tha t me t our cr i ter ia is the percentage o f pic tures recognized tha t were forgotten dur ing the re ten t ion interval bu t re learned in one trial.
The au tobiographica l m e m o r y data sets repor ted in Table 9 are included here because they have been c la imed to be reten-

7 4 4 RUBIN A N D WENZEL
Table 4
Description of Recall Data Sets With Fits to Selected Functions
Study a
Method
P Task RI
Range r 2 fit of selected functions
Time % correct Lin Hyp Exp Log (m) Pwr EP HP Hi
Bean (1912) 6 u SR
Bregman (1968) I a s u CR 1 a g u C R 1 a p u C R I a c u CR lbs u CR lbg u C R lbp u CR 1 b c u CR
Burtt & Dobell (1925) 1 u CR
Conway et al. (1991) 2c a CR
Fioravanti & Di Cesare (1992) 2s a SR
Krueger (1929) 2o g AR 2of g AR 2t g AR
Lavach ( 1971 ) 11 u CR
Longmore & Knight (1988) lc a FR ld a FR 1 k a FR
Luh (1922) 6 g AR 6 g SR 11 g SR 15o g SR 15s g SR 1 5 t g SR
Murdock ( 1961 ) lc u FR I w u FR 1 w t u FR 3z u FR 3th u FR 3s u FR 3n u FR 3t u FR
Nelson et al. (1980) la u CR
Peterson & Peterson (1959) 3 u FR
Rubin (1989) I a FR
Runquis t (1983) I t t u CR 1 o t u CR ltu u CR lou u CR
Schonfield (1969) b I y a a FR I e a a FR
Staats et al. (1970) lp u CR I n u CR
Turvey & Weeks (1975) l u FR 3s u FR 3z u FR
6 1-28 d 89-79 .62 .64 .63 .92 (3.3)
8 3-288 s 80-25 .54 .86 .64 .92 (. 13) 8 3-288 s 91-7 .60 .87 .75 .90(.17) 8 3-288 s 74-14 .50 .89 .78 .88 (. 15) 8 3-288 s 70-3 .44 .96 .94 .86 (. 15) 8 3-288 s 92-14 .47 .92 .78 .87 (. 17) 8 3-288 s 88-17 .53 .84 .73 .89 (. 14) 8 3-288 s 86-12 .50 .85 .67 .86(.15) 8 3-288 s 78-1 .28 .96 .98 .68 (. 14)
5 5 m i n - 4 w 43-2 .59 1.0 .99 1.0 (4.7)
12 3-125 mo 60-75 .60 .81 .70 .93 (9.5)
7 5 m i n - 4 8 hr 97-68 .91 .94 .93 .69 (2.6)
6 1-28 d 26-0 .43 .97 1.0 .81 (1.2) 6 1-28 d 38-2 .65 .99 .98 .96 (1.4) 6 1-28 d 49-3 .69 .98 .98 .97 (1.7)
5 5 m i n - 3 0 d 36-1 .76 .80 .78 .84(.18)
5 .1-18 s 100-45 .82 .97 .91 .92 (3.0) 5 . l - 1 8 s 100-7 .82 .98 1.0 .94(5.1) 5 . 1 -18s 100-13 .75 .99 .97 .98(4.8)
5 20 m i n - 4 8 hr 68-10 .78 .96 .90 .99 (11) 5 20 mi n -48 hr 88-27 .84 .96 .91 .99 (13) 5 20 m i n - 4 8 hr 91-40 .78 .90 .84 .98 (11) 7 20 m i n - 4 8 hr 88-31 .80 .97 .91 .98 (20) 5 20 m i n - 4 8 hr 86-25 .92 .97 .96 .96 (11 ) 5 20 m i n - 4 8 hr 68-14 .84 .94 .90 .99 (10)
6 1-18 s 94-16 .79 .96 .97 .95 (30) 6 1-18 s 98-84 .92 .93 .93 .75 (5.2) 6 1-18 s 93-23 .74 .97 .92 .95 (26) 6 1 -18s 100-91 .90 .90 .90 .84(.03) 6 1 -18s 100-82 .63 .69 .66 .84(.08) 6 1-18 s 98-80 .92 .95 .94 .98 (.06) 6 1-18 s 98-83 .82 .86 .84 .93 (.06) 6 1-18 s 97-82 .80 .83 .82 .86 (.06)
5 l - T w 42-14 .82 .94 .94 .94(15)
6 3-15 s 53-5 .92 .90 .98 .97 (.29)
11 . 1 - 2 . 3 y 37-1 .85 .93 .93 .95 ( 1 0 )
6 20 min-21 d 100-33 .93 .98 .98 .73 (8.7) 6 20 min-21 d 98-57 .65 .80 .70 .65 (6.9) 6 20 min-21 d 89-17 .63 .94 .88 .95 (11) 6 20 min-21 d 75-21 .41 .58 .81 .86(9.2)
5 .5-18 s 93-18 .61 .93 .79 .92(22) 5 .5-18 s 66-10 .61 .91 .90 .91 (17)
5 5 m i n - 4 w 30-7 .92 .96 .97 .84 (.29) 5 5 ra in-4 w 41-7 .94 .96 .98 .81 (.30)
6 1-25 s 92-27 .59 .89 .82 .86 (.23) 5 2-30 s 91-42 .47 .50 .49 .72 (.05) 5 2-30 s 68-51 .47 .70 .55 .76 (.20)
.92 .80 .81 .93
.94 .88 .94 .96
.94 .88 .94 .94
.91 .88 .92 .93
.93 .95 .92 .96
.97 .89 .97 .97
.95 .86 .94 .95
.95 .84 .94 .96
.96 .96 .93 .98
.99 1.0 .99 1.0
.95 .87 .93 .95
.67 .92 .91 .95
.98 .99 .94 1.0
.97 1.0 .95 1.0
.95 .99 .94 1.0
.82 .84 .83 .87
.87 .98 .96 .98
.86 .97 .90 1.0
.92 .99 .95 .99
.97 .98 .98 .99
.94 .99 .99 .99
.97 .96 .98 .99
.96 .98 .98 .98
.91 .98 .97 .99
.96 .97 .98 .99
.89 .96 .89 .98
.73 .87 .86 .93
.93 .96 .94 .97
.84 .91 .91 .93
.84 .79 .81 .84
.97 .99 1.0 1.0
.92 .93 .94 .94
.86 .88 .88 .88
.93 .94 .90 .95
.89 .94 .84 1.0
.88 .94 .88 .96
.58 .94 .86 .98
.56 .82 .82 .82
.85 .98 .98 .98 ~81 .88 .85 .99
.94 .94 .92 .95
.90 .93 .83 .95
.80 .94 .90 .98
.77 .93 .87 .98
.85 .88 .86 .89
.75 .60 .63 .89
.82 .72 .81 .88
100 YEARS OF FORGETTING 745
Table 4 (continued)
Range r 2 fit of selected functions
Study a P Task RI Time % correct Lin Hyp Exp Log (m) Pwr EP HP Hi
Method
Waugh & Norman (1965) lo u CR 9 1-12 s 95-1 .87 .93 .97 .95 (.35) .86 .94 .85 .97 If u CR 9 .5-18s 93-14 .88 .81 .93 .90(.45) .56 .85 .71 .98
Wixted & Ebbeson ( 1991 ) If u FR 5 2.5-40 s 77-55 .76 .82 .79 .98 (.08) .99 .91 .94 1.0 1o u FR 5 2.5-40 s 58-40 .75 .83 .79 .97 (.06) .98 .91 .94 .99
M .71 .89 .86 .89 .88 .91 .90 .96
Note. P = participants; RI = retention interval (number of points fit); Lin = linear; Hyp = hyperbolic; Exp = exponential; Log = logarithmic; rn = slope parameter; Pwr = power; EP = exponential power; HP = hyperbolic power; Hi = the highest of the 105 functions fit; a = adults; g = graduate students; u = undergraduates; AR = anticipation recall; CR = cued recall; FR = free recall; SR = serial recall; d = days; w = weeks; mo = months; y = years. a Subentries are the number of the figure or table in the study from which the data were extracted. If more than one data set was taken, a one- or two- letter code was added to distinguish them from each other. b Cited in Kausler ( 1982, p. 434).
tion functions (Conway & Rubin, 1993; Rubin, 1982; Rubin, Wetzler, & Nebes, 1986). Each has different methods and anal- yses, but in all of them undergraduates or older adults were asked to recall autobiographical memories from their lives and later were asked to date them. These memories were then sorted into t ime bins, such as decades, or 20 equal intervals on a loga- r i thmic scale spanning the participants ' lives, or the t ime mark- ers used in English (e.g., l to 24 hrs, 1 to 7 days . . . . 1 to 70 years). For each bin in the resulting histogram, two measures were obtained: the number o f memories per hour and time. If it is assumed that on the average people encode an equal number o f memories each day of their lives, these values are a retention function. In previous studies, such data sets were fit well by a power function and better by it than by the other classic two- parameter retention functions, agreeing with what Wickelgren had claimed for laboratory retention at the t ime (Rubin, 1982).
T h e F u n c t i o n s
Psychologists have suggested many functions to describe the monotonic loss o f information with time. Five of the most com- monly considered functions are the linear, hyperbolic, exponen- tial, logarithmic, and power functions. In the form used here, all are two-parameter functions, but in many curve-fitting situ- ations each function has only one free parameter because there is often the added constraint that the immedia te recall be set to 100% or that the area under the curve equals the total amount recalled.
Linear
The simplest function is y = - m . t + b. In theory, there is an added condition. For t > b/m, y = 0, which prevents negative values of y for large values of t. In actual curve-fitting proce- dures, negative observed values o f y never occur, so the function without the restrictions rarely becomes negative over the range of t imes to which it is applied. Having degrees o f unobserved negative values that are expressed behaviorally as not remem- bering can be useful in situations in which the same added re- trieval cue can produce retrieval at short but not long intervals.
A problem with such use of negative values, however, is in de- fining where the " t rue zero" of no prior learning would be (W. Wickelgren, personal communicat ion, January 1996). Similar constraints and boundary conditions occur with many two-pa- rameter functions, either at large values of t or an t = 0. The positive constant, m, is the slope, and larger values o f m indicate a more rapid loss of memory. The equation can be used success- fully over short intervals o f time, but because retention func- tions typically drop more rapidly over their shorter retention intervals, it does not fit data well over the complete range from initial recall to when recall approaches zero.
Hyperbolic
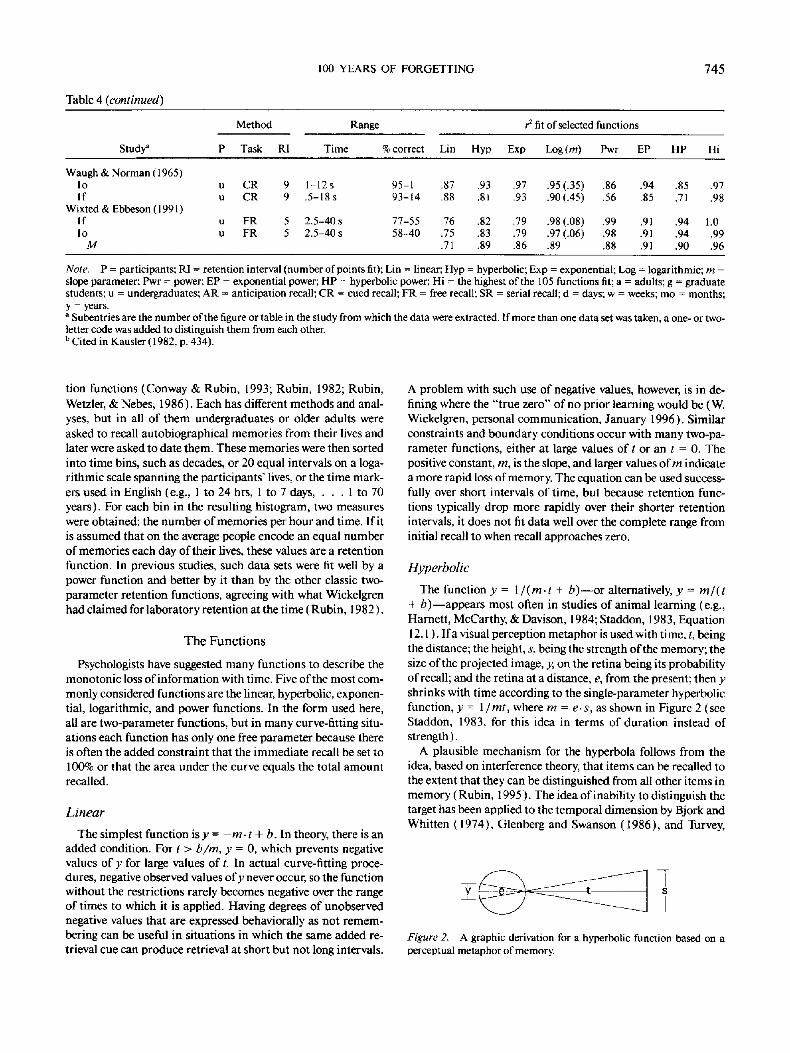
The function y = 1/(m.t + b ) - - o r alternatively, y = m/( t + b ) - - a p p e a r s most often in studies of animal learning (e.g., Harnett , McCarthy, & Davison, 1984; Staddon, 1983, Equation 12.1 ). I fa visual perception metaphor is used with time, t, being the distance; the height, s, being the strength of the memory; the size o f the projected image, y, on the retina being its probability of recall; and the retina at a distance, e, from the present; then y shrinks with t ime according to the single-parameter hyperbolic function, y = 1 ~rot, where m = e.s, as shown in Figure 2 (see Staddon, 1983, for this idea in terms of duration instead of strength).
A plausible mechanism for the hyperbola follows from the idea, based on interference theory, that i tems can be recalled to the extent that they can be distinguished from all other i tems in memory (Rubin, 1995 ). The idea o f inability to distinguish the target has been applied to the temporal dimension by Bjork and Whitten (1974), Glenberg and Swanson (1986) , and Turvey,
Figure 2. A graphic derivation for a hyperbolic function based on a perceptual metaphor of memory.

7 4 6 RUBIN AND WENZEL
Table 5
Descriptions of Savings Data Sets With Fits to Selected Functions
Method Range r 2 fit of selected functions
Study ~ P RI Time Savings Lin Hyp Exp Log (m) Pwr EP HP Hi
Boreas (1930) 2 a 11 10 m i n - 1 0 mo 82-0 .66 .87 .85 .88 (4.7) .80 .94 .91 .92 3 a 12 9 hr -2 y 67-32 .43 .69 .47 .86 (6.3) .81 .80 .89 .95
Ebbinghaus (1885/1964) s 7 19 min-31 d 58-21 .35 .51 .40 .94(4.5) .98 .69 .82 .98 Finkenbinder ( 1913)
2 a 11 30 m i n - 7 2 h 75-52 .82 .87 .84 .96 (4.3) .95 .96 .97 .97 Krueger (1929)
3o g 6 1-28 d 22-2 .38 .96 .98 .77 (6.0) .96 .98 .94 .99 3of g 6 1-28 d 36-20 .65 .81 .73 .93 (5.3) .95 .88 .93 .95 3t g 6 1-28 d 47-25 .54 .72 .62 .90 (7.1) .94 .81 .89 .96
Luh (1922) 6 g 5 20 mi n -48 hr 75-48 .62 .66 .64 .93 (5.1) .96 .79 .82 .98
Radosavljevich (1907) 2nb b a 11 5 m i n - 1 2 0 d 98-3 .57 .81 .80 .86(7.7) .80 .85 .84 .89
M .56 .77 .70 .89 .90 .85 .89 .96
Note. The task was always relearning. P = participants; RI = retention interval (number of points fit); Lin = linear; Hyp = hyperbolic; Exp = exponential; Log = logarithmic: m = slope parameter; Pwr = power; EP = exponential power; HP = hyperbolic power; Hi = the highest of the 105 functions fit; a = adults; g = graduate students; s = self. a Subentries are the number o f the figure or table in the study from which the data were extracted. If more than one data set was taken, a one- or two- letter code was added to distinguish them from each other. b Taken from Finkenbinder ( 1913).
Br ick , a n d O s b o r n e ( 1 9 7 0 ) a n d h a s b e e n u s e d by Badde l ey
( 1 9 9 0 ) to a r g u e t h a t t he 30-s d u r a t i o n o f s h o r t - t e r m m e m o r y is
real ly a n a r t i f ac t o f h o w t he m e a s u r e m e n t s a re m a d e . A s s u m e
t h a t n o n t a r g e t i t e m s a re r e c o r d e d u n i f o r m l y over t i m e a t a ra te
o f one every a s e c o n d s a n d t h a t a m o n g t h e m , a t t i m e t ago, was
t he ta rget i t em. A s s u m e , to s i m p l i f y t he p roo f , t h a t all i t e m s
r eco rded a re o f equa l s t r e n g t h a n d a re equa l in s t r e n g t h to the
ta rget even t u n d e r t he e x p e r i m e n t a l c u i n g cond i t i ons . Moreover ,
a s s u m e W e b e r ' s law for t he l imi t s o f t e m p o r a l d i s c r i m i n a t i o n
s u c h t h a t the w i n d o w o f e r ro r in j u d g i n g t he t i m e ago t h a t an
even t o c c u r r e d is c . t, w h e r e c is a posi t ive c o n s t a n t (B jo rk &
W h i t t e n , 1974; R u b i n & Baddeley , 1989) . T h e n u m b e r o f n o n -
ta rge t i t e m s in t he w i n d o w for l ack o f t e m p o r a l d i s c r i m i n a t i o n
t h a t c o u l d be c o n f u s e d w i th t he ta rge t i t e m is c. t/a. T h e p r o b -
ab i l i ty o f reca l l ing t he target , y, is equa l to one over t h e to ta l
n u m b e r o f i t e m s in t he l a c k - o f - d i s c r i m i n a t i o n window. I f we let
m = c /a , t h e n y = 1 / ( m . t + 1 ), w h i c h is a hype rbo l i c w i th o n e
free p a r a m e t e r . T h i s f o r m o f t he hype rbo l i c f u n c t i o n is s i m i l a r
to t he o n e on w h i c h L a m i n g ( 1 9 9 2 ) b a s e d h is t h e o r y o f shor t -
t e r m r e t en t ion .
Tab le 6
Description of Sensorimotor Data Sets With Fits to Selected Functions
Method Range
Study a Task RI
r 2 fit of selected functions
Time Savings Lin Hyp Exp Log (m) Pwr EP HP Hi
A m m o n s et al. (1958) If MS It MS 2o T R 2e T R
Bean (1912) 14 b TP 7
Tsai (1924) 2 MZ 6
M
6 l m i n -704 d 68-6 .74 .78 .80 .85(3.9) .68 .90 .92 .95 6 l min-695 d 92-70 .41 .42 .43 .92(1.8) .91 .69 .69 .97 5 21 hr-706 d 100-57 .59 .70 .64 .99 (6.6) .99 .86 .90 .99 5 22 hr-884 d 100-90 .87 .87 .87 .87 (1.3) .86 .92 .92 .94
1-35 d 83-15 .90 .97 .96 .96(19) .88 .97 .92 .98
1-9 w 8 1 - 5 0 .91 .94 .92 .94 (14) .93 .95 .94 .95 .74 .78 .77 .92 .88 .88 .88 .96
Note. The participants were undergraduates. RI = retention interval (number of points fit); Lin = linear; Hyp = hyperbolic; Exp = exponential; Log = Logarithmic; m = slope parameter; Pwr = power; EP = exponential power; HP = hyperbolic power; Hi = the highest of the 105 functions fit; MS = motor skill; MZ = maze; T R = tracking; TP = typing; d = days; w = weeks. a Subentries are the number of the figure or table in the study from which the data were extracted. If more than one data set was taken, a one- or two- letter code was added to distinguish them from each other. b The dependent measure in this study was percentage correct, not savings.
100 YEARS OF FORGETTING
Table 7
Description o f Data Sets From Tests Using Animals With Fits to Selected Functions
7 4 7
Method Range
Study ~ P Task RI Time % correct
r 2 fit of selected functions
Lin Hyp Exp Log (m) Pwr EP HP Hi
Alescio-Lautier & Soumireu- Mourat (1986)
1 b r RU 5 1-30d 7-1 .97 Denny et al. (1989)
ld r DM 5 .1-12s 88-46 .86 Harnett et al. (1984)
ap.b p DS 9 .06-20 s 89-50 .82 Jans & Catania (1980)
ls p DS 5 .5-6 s 92-58 .76 la p DS 5 .5-6 s 82-52 .33 2r p DS 5 .5-6 s 99-80 .96 2s p DS 5 .5-6 s 98-71 1.0 2a p DS 5 .5-6 s 79-57 .72
Jarrard & Moise (1970) 1 m DM 11 2-28 s 90-62 .86
Moise (1970) lz m DM 5 .5-30 s 100-74 .97 1o m DM 5 .5-30 s 100-68 .98 It m DM 5 .5-30 s 100-65 .79
Nelson & Wasserman (1978) 2 c p DS 8 1-40 s 95-54 .88
Roberts & Grant (1978) ld p DM 7 .1-12 s 92-76 .86 lh p DM 7 .1-12 s 92-52 .63
Shimp & Moflitt (1977) 2b p DS 8 .1-32 s 93-56 .66 20 p DS 8 .1-32 s 91-51 .48 2bt p DS 8 .1-32 s 94-58 .42 2or p DS 8 .1-32 s 93-53 .22
Tsai (1924) 9 d r MZ 7 1-12 w 90-57 .87
White (1985) la p DM 5 .5-20 s 96-58 .96 lb p DM 5 .5-20 s 98-65 .98 5t p DM 5 .5-20 s 98-63 .93 5f p DM 5 .5-20 s 88-55 .64 60 p DM 5 .5-20 s 82-59 .86 6f p DM 5 .5-20 s 96-64 .92 7d p DM 5 .5-20 s 97-66 1.0 7h p DM 5 .5-20 s 94-50 .71 8f p DM 5 .5-20 s 98-56 .93 8t p DM 5 .5-20 s 96-54 .67
White & McKenzie (1982) 2s p DS 10 .4-21 s 99-82 .98 2r p DS 10 .4-21 s 95-75 .86 41 p DS 10 .4-21 s 99-76 .96 4s p DS 10 .4-21 s 96-75 .96
Wilson & Boakes (1985) If p DS 6 2-22 s 91-21 .89 3j j DS 6 2-38 s 93-39 .89 3p p DS 6 2-38 s 75-31 .97
M
.84 .93 .78 (1.8) .48 .82 .72 .99
.96 .91 .95 (8.6) .92 1.0 .99 1.0
.90 .87 .92(6.9) .88 .97 .98 .98
.86 .81 .96(14) .98 .91 .95 1.0
.38 .35 .57(9.3) .62 .47 .51 .95
.94 .95 .77(7.2) .75 .87 .85 1.0
.98 .99 .88(10) .85 .95 .93 1.0
.79 .75 .87(11) .87 .84 .86 .96
.92 .89 .99(11) .99 .97 .98 .99
.97 .97 .79(5.6) .76 .92 .91 .97
.99 .99 .86(7.1) .83 .97 .95 .99
.85 .82 .96(8.1) .95 .93 .94 .97
.96 .92 .88 (12) .83 .94 .92 .96
.89 .88 .90(3.5) .88 .97 .97 .97
.76 .69 .99(8.5) .99 .89 .94 .99
.72 .69 .99(.06) .99 .86 .90 .99
.58 .53 .96(.07) .98 .76 .84 .98
.52 .46 .92(.07) .94 .71 .79 .95
.27 .16 .77(.06) .84 .46 .52 .98
.91 .84 .91 (13) .90 .93 .92 .93
1.0 .98 .90 (. 10) .86 .99 .97 1.0 1.0 .99 .81 (.09) .76 .95 .92 1.0 .98 .96 .88 (. 10) .84 .97 .96 .99 .74 .68 .97 (.09) .98 .87 .92 .98 .91 .89 .96 (.07) .94 .98 .99 .99 .96 .94 .85 (.09) .80 .95 .93 .99
1.0 1.0 .79 (.08) .75 .94 .91 1.0 .80 .75 .95 (.11) .96 .89 .92 1.0 .96 .95 .81 (.12) .74 .92 .88 .97 .79 .72 .85 (.12) .83 .85 .87 .87
.97 .97 .75 (3.9) .73 .90 .89 .98
.87 .87 .79 (4.8) .77 .87 .86 .88
.98 .97 .87 (6.0) .85 .97 .96 .98
.97 .97 .83 (5.3) .81 .95 .94 .97
.92 .93 .94(28) .89 .93 .90 .94
.78 .83 .63(14) .57 .72 .66 .99
.96 .97 .90(14) .84 .94 .90 .98 .82 .85 .83 .87 .84 .88 .88 .97
Note. P = participants; RI = retention interval (number of points fit); Lin = linear; Hyp = hyperbolic; Exp = exponential; Log = logarithmic; m = slope parameter; Pwr = power; EP = exponential power; HP = hyperbolic power; Hi = the highest of the 105 functions fit; j = jackdaws; m = primates; p = pigeons; r = rats; DM = delayed matching to sample; DS = symbolic delayed matching to sample; MZ = maze; RU = run time; d = day. a Subentries are the number of the figure or table in the study from which the data were extracted. If more than one data set was taken, a one- or two- letter code was added to distinguish them from each other. b The dependent measure is the difference in running times. c The dependent measure is a discrimination index.
The dependent measure is savings.

748 RUBIN A N D WENZEL
Table 8
Description of Miscellaneous Data Sets With Fits to Selected Functions
Method
Study ~ P Task RI
Range r 2 fit of selected functions
Time % correct Lin Hyp Exp Log (m) Pwr EP HP Hi
Bean (1912) 7 u SG 6 1-28 d 89-77 .70 .71 .70 .91 (3.2) .91 .82 .83 .92
Conway et al. ( 1991 ) 4 a GR 12 3-125 mo 57-35 .46 .57 .49 .79 (6.5) .82 .69 .75 .84
King (1963a) 11 u RP 6 2 ra in-28 d 92-78 .61 .65 .63 .76 (1.6) .75 .79 .80 .84
King (1963b) I f u RP 6 2 min -28 d 81-59 .23 .20 .16 .05(.58) .01 .12 .11 .88
Linton (1975) 14 b s DT 8 2-192 d 0-10 .55 .30 .41 .89 ( -3 .3) .77 .57 .45 .98
Luh (1922) 6 g CN 5 20 min -48 hr 92-39 .91 .98 .96 .96 (11) .90 1.0 .99 1.0 11 g CN 5 20 min-48 hr 89-44 .84 .95 .90 .94 (10) .90 .98 .98 .98 15o g CN 7 20 min -48 hr 88-44 .80 .88 .86 .83 (17) .78 .86 .83 .88 15s g CN 5 20 min-48 hr 92-32 .87 .88 .88 .92 (10) .90 .92 .92 .94 15t g CN 5 20 min-48 hr 76-20 .79 .95 .88 1.0 (11) .98 .98 1.0 1.0
MacLeod (1988) 4ns u RG 5 2 - 1 0 w 91-86 .80 .79 .79 .71 (.08) .69 .76 .74 .92
Rovee-Collier (1993) 4 c b KR 11 .84-28 d 94-35 .71 .85 .83 .79 (.25) .71 .83 .77 .88
Rubin & Baddeley (1989) 2 b a DT 5 .27-2.2 y 78-359 .99 .89 .97 .91 ( -126) .98 .99 .94 .99
Sloman et al. (1988) 2f u CM 14 14-196 s 85-70 .85 .83 .84 .70 (.05) .69 .79 .78 .87 2t u CM 5 18 min -23 w 27-4 .64 .89 .79 .98 (.02) .93 .96 .98 .99
Thompson (1982) I b u DT 5 1.6-12 w 2-15 .99 .83 .91 .97( -6 .2 ) .99 .96 .89 1.0 2 u DT 9 3 d-13 w 67-9 .66 .97 .85 .95 (16) .98 .96 .98 .98
M .73 .77 .76 .83 .81 .82 .81 .93
Note. P = participants; RI = number of points fit; Lin = linear; Hyp = hyperbolic; Exp = exponential; Log = logarithmic; m = slope parameter; Pwr = power; EP = exponential power; HP = hyperbolic power; Hi = the highest of the 105 functions fit; a = adults; b = babies; g = graduate students; s = self; u = undergraduates; d = days; mo = months; w = weeks, y = years; CM = completion; CN = reconstruction; DT = dating; GR = grouping; KR = kicking rate; RG = recognition; RP = reproduction; SG = serial recognition.
Subentries are the number of the figure or table in the study from which the data were extracted. If more than one data set was taken, a one- or two- letter code was added to distinguish them from each other, b The dependent measure is absolute error in days. c The dependent measure is the ratio of kicking rate to rate at training.
Tab le 9
Descriptions of Autobiographical Memory Data Sets With Fits to Selected Functions
Range r 2 fit of selected functions
Study ~ P RI Time Frequency Lin Hyp Exp Log(m) Pwr EP HP Hi
Methods
Crovitz & Schiffman (1974) 1 u 59 1 hr - I 7 y 77-.0007
Rubin (1982) 1 u 58 1 hr-15 y 1.9-.0001 2 u 48 1 hr-12 y .71-.0002
Rubin et al. (1986) t u 10 37 hr-13 y .35-.0002 s o 10 37hr -13 y .19-.0001
M
.03 .97 .95 .22 (1.4) .97 .96 .97 .97
.09 .89 .59 .40 (.06) .97 .98 .90 .99
.04 .93 .86 .45 (.03) .95 .90 .96 .96
.07 1.0 .17 .46(.03) 1.0 1.0 1.0 1.0
.07 1.0 .99 .44 (.01) 1.0 .99 1.0 1.0
.06 .96 .71 .39 .98 .96 .96 .98
Note. The task was always providing autobiographical memories to cue words. P = participants; RI = number of points fit; Lin = linear; Hyp = hyperbolic; Exp = exponential; Log = logarithmic; m = slope parameter; Pwr = power; EP = exponential power; HP = hyperbolic power; Hi = the highest of the 105 functions fit; o - older adults; u = undergraduates; y = years. aSubentries are the number of the figure or table in the study from which the data were extracted. If more than one data set was taken, a one- or two- letter code was added to distinguish them from each other.

100 YEARS OF FORGETTING 749
Exponen t ia l
Perhaps the most commonly used retention function is y = b .e mr, where e is the base for the natural logarithm. The equa- tion is simple, has mathematical properties that make it easy to use in models, and has been successfully fit to many short-term memory experiments (Peterson & Peterson, 1959; Wickelgren, 1974a, 1974b). It is the equation for radioactive decay; loss is proportional to the amount that is left (Simon, 1966). No matter how much time has passed since initial learning, each time an additional .69/m, or half-life, passes, the amount re- membered is cut by half.
Logar i t hmic
The function y = b - m . ln ( t ) , where In is the base e, or natural, logarithm also needs boundary conditions. At long times the logarithmic function, like the linear function, be- comes negative as opposed to reaching an asymptote at y = 0. Because the In(0) is undefined, when t = 0, the value of y is undefined. However, values of zero are never included in the data; " immediate" recall is actually recall after a brief period. Moreover, if ratios of time are what matters for the logarithmic function, as will be argued shortly, then ratios involving zero in the denominator are meaningless and should be excluded on theoretical grounds. The same t = 0 boundary problem holds for the power function where one solution offered is to change the independent measure so that it also goes to infinity instead of to 100% (Anderson & Schooler, 1991 ) by using d', or ebbs, or an odds ratio. Although some textbooks and journal articles remark that Ebbinghaus used a logarithmic retention function, as noted, he actually combined the logarithm, hyperbola, and power to form his complex retention function. However, the log- arithmic function was favored by several early researchers (see Luh, 1922, for a review) and by Woodworth ( 1938 ) as the best simple empirical fit to the half-dozen data sets he plotted, in- cluding Ebbinghaus's.
There is an easy way to arrive at the logarithmic function if in psychological terms equal ratios of time, not equal intervals, are important. Assume that the psychological difference be- tween the 3 to 4 ratio of 3 and 4 s is the same psychological difference as that between 30 and 40 min, or 8 and 24 hr, or 3 and 4 decades. On a logarithmic scale these differences are all equal to In(3) - In(4), or -0 .29, though on a linear scale the differences range for 1 s to 1 decade (i.e., from 1 s to 3 × 10⁸ s). The ratio view, which justifies a logarithmic transformation, is also supported by the observation that errors in dating follow Weber's law (Rubin & Baddeley, 1989), as well as by research leading to measures of distinctiveness based on the logarithmic transformation of temporal and order scales (Helson, 1964; Johnson, 1991; Murdock, 1960). The simplest function to de- scribe retention is the linear function, y = - m . x + b. If one uses the logarithm of time, as suggested by the equal ratio ob- servation, instead of time for x, this equation becomes the loga- rithmic equation, y = - m - I n ( t ) + b.
Thus, according to the logarithmic function, forgetting is lin- ear with the ratio of time not the difference in time as it is in the linear equation; equal ratios of time cause equal amounts of loss in remembering. If there are four times, tj, t2, t3, and t4, such
that t~/t2 = t3/t4, then the corresponding recalls will follow the equation Yl - Y2 = Y3 - Y4. For example, if there is a drop in retention from 90% to 80% between 1 and 5 s, then there also should be a drop of 10% between 10 and 50 years. Using the same rationale, one could say that the exponential is a function for which equal intervals of time result in equal ratios of loss in remembering.
Power Function
The function y = b. t -m, was first suggested as a retention function by Wickelgren in a series of experiments on complex retention functions derived from mathematical models of memory (e.g., Wickelgren, 1974a, 1975a, 1975b) and was not directly compared with a range of other functions until it was used in studies of retention in autobiographical memory (Rubin, 1982). More recent empirical work has also supported the power function (Anderson & Schooler, 1991; Wixted, 1990; Wixted & Ebbesen, 1991 ). It implies that if there are four times, t~, t2, t3, and t4, such that t~ [ t2 = t3/t4, then the corresponding recalls will follow the equation yl/Y2 = Y3/Y4. In words, equal ratios of time result in equal ratios of recall. The power function provides an excellent empirical fit in at least two major areas of research outside retention. It is the best description of the relationships between the judgment of perceptual magnitude, such as brightness, loudness, or salinity, and their underlying physical dimensions (Stevens, 1975), though the logarithmic function also provides a good fit. It describes the relation be- tween the amount of practice and the time taken to perform a host of tasks (Newell & Rosenbloom, 1981 ), though a form of the hyperbolic also provides a good fit (Mazur & Hastie, 1978).
The Other 100 Funct ions
There are an infinite number of less studied two-parameter functions. A commercially available program, TableCurve (1994), includes 105 two-parameter functions. These are formed by letting y equal z, 1/z , z z, f~, and e ~, where z takes on each of the following 21 expressions: b + m . t , b + m . t . l n ( t), b + m . t j5, b + m . t z, b + m.tZln( t), b + m . t 25, b + m . t 3, b + m . e t, b + m.t'51n(t), b + m.[ ln ( t ) ] z, b + m . t / In(t) , b + m . t "5, b + m. ln ( t ) , b + re~In(t), b + m . t "-5, b + m . ln ( t ) / t, b + m / t , b + m . t -1"5, b + m. ln ( t ) - t -z, b + m . t -2, and b + m.e -t. Although not exhaustive, these 105 functions, which include the five classic ones, provided a reasonable initial search set and one that was chosen without awareness of the purposes of this project.
We limited the search to two-parameter functions, although theoretically motivated three-parameter functions exist (e.g., Indow, 1993; Wickelgren, 1974a) and other functions with three or more parameters could be formulated. We did this first because the large number of reasonable functions with three or more parameters would have greatly expanded the scope of our initial search to the point where it would have become unwieldy. Second, comparisons among functions of different numbers of parameters are difficult because functions with three or more parameters usually fit better than two-parameter functions. Third, differentiating among functions with three or more pa- rameters should have data sets with more points than many of

750 RUBIN AND WENZEL
the ones included here. Fourth, most recent debate has centered on two-parameter functions. Nonetheless, a function with three or more parameters could be the best theoretical function, es- pecially if the parameters could be identified with concepts in the theory or i f they varied systematically across experimental conditions, such as amount o f initial learning or the dependent measure of remembering. Our decision was to postpone such an expanded search until the two-parameter functions could be evaluated to see whether any obvious addition of parameters, such as in Wickelgren's (1974a) function that multiplies an ex- ponential and a power function factor, would provide more ex- planatory power for the data. Nonetheless, it could be argued that the problem of retention is complex enough to warrant at least three parameters. One parameter is needed for the level o f initial learning. One parameter is needed to scale the t ime range of the experiment. Finally, a third parameter is needed to say something about the shape of the function and how it changes with conditions.
Bas ic Resu l t s
Determin ing the Bes t Fi t t ing Functions
In fitting many functions to many data sets, the first check that has to be made is whether the results can be accounted for by a random process. Figure 3 is a histogram. Each of the 105 functions appears as one point. The number of data sets, out of a possible 210 data sets, in which each function was among the best fitting 10 functions is given by the values on the left axis. The classic five retention functions and some other successful equations are given at the right of the histogram. The most suc- cessful function by this ranking measure is the logarithmic, which appears as one o f the best 10 functions in 109 of 210 data sets.
The number of times a function should be in the top 10 by chance is ( 10 /105 ) × 210, or 20. The standard deviation of such a binomial distribution is (npq) 5, or [ (210 ) (10 / 105 ) (95 / 105 ) ] .5, which equals 4.25. If the distribution shown
in Figure 3 were the result of random processes, it would be symmetrical around a mean of approximately 20. It is not. Rather, Figure 3 shows that there are a few functions that are successful by the ranking measure but that most functions are not. The successful functions are not just one tail of a binomial distribution but are outliers.
Several functions appear among the most successful that have not been considered by psychologists. One, y = [ b - m. In (t) ] 2, is the logarithmic function squared. When expanded it becomes y = b 2 - m. b. In( t ) + m 2 • In( t ) 2. I f m is smaller than b (it is in most fits by about a factor of 10), the m s term may be small enough to be ignored, and the equation could be rewritten as y = b' - m' . In( t ) , where b' = b 2 and m' = m.b . That is, i f m is small enough, the equation approximates the logarithmic equa- tion. Both equations appear together or are absent together from the best fitting 10 equations in 180 of the 210 data sets. In the remaining 30 data sets in which one function is in the top 10 and the other is not, the equation that is not appears in the top twenty 25 times and in the top thirty 4 times. Moreover, the b' = b 2 and m' = m. b equations were good approximations for the data sets examined. Thus, if the logari thmic equation fits, y =
110
105
100
95
90
85
80
75
70
65
60
55
50
x
- x
- x
° x
- x
- x
- xx
xx h y p e r b o U c x
l o g a r i t h m i c
y = (b - m ln ( t ) ) z
y = b.e-m.4t y = 1/(b + m~Ct) p o w e r
y = ( b - m'~ro 2
45
40 x e x p o n e n f i ~
35 x xx
30
25 x x x x
I ~ x x x l inear
10 _ i ~ X x x x
00
Figure 3. A histogram showing the number of times each of 105 func- tions was one of the best 10 fits to the 210 data sets. Each mark repre- sents one function. The commonly used live functions are labeled ver- bally, other successful functions are labeled with their formulas. The maximum possible value is 210, chance is 20 (SD = 4.25 ).

100 YEARS OF FORGETTING 751
[ b - m. In ( t) ] 2 also fits with a similar intercept and slope and so is considered a more complex form of the logari thmic equa- tion. In addition, for very long times, the value o f y will increase with t ime for this equation. For these reasons the equation is not pursued further. However, i f theoretically motivated, it could be used in place o f the logari thmic equation.
Many of the other novel functions come from the five equations based on the expression b + m. ~ . The success o f so many functions based on the square root o f t ime was a surprise. However, it should be noted that the square root was the only power less than 1 included in the 105 functions tested, and so its success does not argue for its superiority over other fractional powers o f t ime and suggests that such powers should be investi- gated further. The two most successful square-root-of-t ime functions are y = b .e -m~ and y = 1 / (b + m. ~ ) . These two equations can be seen as the standard exponential and hyper- bolic equations with the square root of t ime substituted for t. They therefore have well-defined intercepts o f b and 1 / b at t = 0 and asymptote to 0 at long times. The third most successful function, which fits approximately as well as the power func- tion, is y = (b - m - ~ ) 2. When expanded to y = b 2 + m2t -
mb . ~t, the equation looks like the standard linear equation with an added ~ term, but it is not in that the coefficient o f t is positive. The function decreases smoothly for a while but then starts to increase and does so at a much faster rate than the quadratic equation in In( t ) discussed earlier. Because o f this property and because the function adds little empirically to the other functions in Vt, it is not considered further.
It was suggested that the best fitting functions may just be the most flexible ones, the ones most able to change their basic shapes to fit any data sets by changing their parameters. This concern is not a problem for the best fitting functions found
here. First, all functions tested have only two parameters limit- ing their flexibility. Second, each can be t ransformed into a straight line by one particular combinat ion o f t ransforming the y axis to y, In (y) , or 1 / y and the x axis to t, In ( t ), or ~ . In these transformed versions, it can be seen that there is little flexibility available to change the basic shape o f the functions; the two free parameters determine the slope and the intercept o f a straight line.
H o w Wel l D o the S a m e F u n c t i o n s F i t A l l D a t a Se t s?
The top-10 measure, more commonly used to quantify pop- ularity in music, is sufficient to show that some of the 105 func- tions tested often worked well whereas others rarely did, but it is not the best way to compare fits. Tables 1 to 9 contain the fit of all 210 data sets to the five classic functions and the two nonclassic best fitting functions just discussed, the exponential and hyperbolic in ~ , using r E as measure of amount o f variance accounted for for each function. The r ightmost co lumn con- tains the highest r 2 obtained with any of the 105 functions. It therefore can be viewed as an approximate upper bound of what could be expected from a wide range o f two-parameter func- tions. At the end of Tables 1 to 9 are rows for the average r 2 values of each function. The histogram was based on fits chosen by the program that resulted in approximat ions for the hyper- bolic and two functions in the square root o f t . Here slower iter- ative solutions were used for these functions, which resulted in an occasional increase in their r 2 values.
Table l0 is a summary that averages the values o f the fits f rom Tables 1 to 9. In addition we present the same summary but from calculations of linear fits to transformations of the data. We do this to provide a comparison to the most commonly used
Table 10 S u m m a r y o f Tables 1 to 9
Source
Table Description
r 2 fit of selected functions
Lin Hyp Exp Log Pwr EP HP Hi
Average of data sets reported in tables 1-9
1-9 Grand mean .68 .83 .79 .86 1-8 Grand mean, without Table 9 a .69 .83 .79 .87
.86 .87 .88 .95
.86 .87 .88 .95
Average of data sets using tranformed dependent measures
1 Bahrick .50 .61 .57 .84 .73 .71 .69 2 Wickelgren .68 .84 .78 .88 .88 .87 .88 3 Recognition .73 .81 .78 .87 .83 .86 .86 4 Recall .71 .82 .80 .89 .86 .88 .84 5 Savings/relearning .56 .73 .66 .89 .88 .81 .84 6 Sensorimotor .74 .79 .77 .92 .84 .87 .82 7 Animal .82 .86 .84 .87 .85 .89 .89 8 Miscellaneous .73 .75 .76 .83 .81 .82 .79 9 Autobiographical memory .06 .86 .52 .39 .97 .73 .82
1-9 Grand mean .68 .80 .76 .86 .84 .84 .83 I-8 Grand mean, without Table 9 a .70 .79 .76 .87 .84 .85 . .83
Note. Lin = linear; Hyp = hyperbolic; Exp = exponential; Log = logarithmic; Pwr = power; EP = expo- nential power; HP = hyperbolic power; Hi = the highest of the 105 functions fit to the untransformed data. a Because the autobiographical memory data sets differ from the other data sets, we also provide means without them.

752 RUBIN AND WENZEL
method in the literature. The basic conclusions remain the same, but the nonlinear fits to the untransformed data do pro- vide slightly higher r 2 values (about .02 higher on the average). The difference, however, can sometimes be large, especially for the hyperbolic and hyperbolic in ~ .
One of the biggest surprises from Figure 3 and Tables 1 to 9 was how well the same functions fit different data sets. The ta- bles have a restricted range ofr 2 values because they contain the five classic functions, most of which were good predictors in the past, and two added functions chosen for their fit. Nonetheless, although there are exceptions, the same functions fit most data sets. One way to describe the degree of similarity is to consider the five classic functions, eliminating for the moment the two that were included in the tables based on the same data that are to be examined. The overall rank order of most to least vari- ance-accounted-for measure given in Table 10 is the same as measure of the number of data sets fit in the top 10 functions in Figure 3: logarithmic, power, hyperbolic, exponential, and lin- ear. Except for the autobiographical memory data, this rank order occurs in all of the tables, with minimal exceptions. In particular, the logarithmic and power functions are inverted in Wickelgren's and the savings data, the power and hyperbolic functions are inverted in the recall and animal data, the expo- nential and linear functions are inverted in the sensorimotor data, and the hyperbolic and exponential functions are inverted in the miscellaneous data. Considering that most of these differences would not be statistically significant, the stability is notable.
The exponential and hyperbolic in the square root of time fit consistently well, occurring as two of the best fitting four func- tions in Tables 1 to 9. Their exact ordering is less consistent, with both sometimes doing better than the five classic functions (as in the overall means, recall, and animal studies data), some- times between the best and second best of the classic five func- tions (as in the sensorimotor, miscellaneous, and autobiograph- ical memory data), and sometimes with one of the square-root functions being the best and the other third or fourth best (as in the Bahrick, Wickelgren, and recognition data).
Autobiographical Memory
The autobiographical memory data sets are clearly different from the other data sets, but there is also clear agreement among them indicating that this difference is not by chance. As noted in Rubin (1982), the power function is the best fitting of the classic five functions, accounting for 97% of the variance, whereas the logarithmic function accounts for only 39%. We therefore separate the autobiographical memory data sets from the rest. The autobiographical memory procedure is different from that in most other experiments in that no particular mem- ory is required; the participants can produce any memory they want from their lives. Thus, autobiographical memory involves much more sampling from among memories and is more sub- ject to the ease of availability than other procedures (Rubin, 1982; Rubin, Wetzler, & Nebes, 1986).
One possible reason for the difference is that the extreme range of times, typically from 1 hr to 18 years, is causing the difference. To see whether this can be the case, the five autobio- graphical memory data sets were divided into two time in-
tervals. The first approximated a typical laboratory study that had 1 hr as its shortest interval by including all data up to 1 week. A second interval, which was more like that used by Bah- rick, included times from beyond 1 week to 20 years. The transformed versions of the hyperbolic, exponential, and power functions were used for these analyses so that an exact fit could be obtained without iterations. For the two Rubin et al. (1986) data sets, this meant that there were only two points in the short interval and only the long interval could be used. For the other three data sets, both the short and long intervals had a mini- mum of 22 points, except the Rubin (1982) data set, which had seven points in the short interval. Although the values for amount of variance accounted for the power function de- creased from 97% to 85% and 88% for the short and long in- tervals when the data sets were divided and increased for the logarithmic function from 39% to 57% and 65%, the superiority of the power function remained substantial. The differences ob- served in the autobiographical memory data sets cannot be at- tributed to just an artifact of their large range of retention intervals.
Another technical reason for differences between the auto- biographical memory data sets and the others is the range of the dependent variable. In most data sets considered here, the range is about one order of magnitude, but for the autobiographical memory data sets it is three or four orders of magnitude. Three of the autobiographical memory data sets had enough points to be divided: Crovitz and Schiffman ( 1974, Experiment 1 ), Ru- bin ( 1982, Experiment l ), and Rubin ( 1982, Experiment 2). Two were each divided into four data sets, with a range of one order of magnitude in their dependent variable. The third, Ru- bin ( 1982, Experiment 2), was divided into three data sets be- cause it had only one value that was beyond a range of three orders of magnitude. With these divisions, which are smaller than those just used to investigate the time-range problem, the superiority of the power function compared with the logarith- mic shrunk dramatically. Averaging over the ! 1 data sets with a single order of magnitude, the power accounts for 76% of the variance; the logarithmic, 70%; the hyperbolic, 70%; the expo- nential, 66%; and the linear, 50%. When the three source data sets are not divided, these average figures for amount of variance accounted for are 96%, 36%, 84%, 58%, and 5%. Thus it is pos- sible that the differences noted in the autobiographical memory data sets are caused by the expanded range of their dependent variable.
If the range explanation holds then, in an ideal world where reliable values of percentage remembered in laboratory tasks could be extended from 99% down three orders of magnitude to 0.1%, the power function also might provide a much better fit than the logarithmic for laboratory learning. Data on this issue are lacking, and so two possibilities remain. One is that the retention function of autobiographical memory is different from that of laboratory tasks. This possibility is supported by the power function's consistent, though reduced, superiority over the logarithmic function in all analyses. The second is that the retention function of autobiographical memory is the same as that of laboratory tasks, but that laboratory studies to date have only tapped a small section of their range that is bet- ter fit by logarithmic and other functions than the whole range would be.

100 YEARS OF FORGETTING 753
Other Issues
The data sets that used savings as a dependent measure also differ from the others, but less dramatically than the autobio- graphical memory data sets. Luh had a similar conclusion. He found recognition, reconstruction (serial ordering), recall, and anticipation all had parallel plots, but that "relearning does not satisfy quite the same type of equation as the other memory processes" ( 1922, p. 28).
Another minor exception to the general pattern occurred in the animal studies. Here the relative order of success in terms of rank was roughly the same as in other tables, but there was little variability in how well each of the individual five classic func- tions fit, with the best accounting for 87% of the variance and the worst, 82%. The small difference in fits could be due to difference in the stimuli, the general procedures (which in most cases resulted in six or fewer retention intervals), the species, the range of times (which with two exceptions had their longest retention interval less than 45 s), or the percentage recalled val- ues (which because of the methods used were rarely below 50%). In any case, a replication of the animal studies, changing the species to humans and using stimuli that are difficult to la- bel, might be one first step to investigate this difference.
The power function has recently been argued to be the best retention function (Anderson, 1990, 1995; Anderson & Schooler, 1991; Rubin, 1982; Wixted & Ebbesen, 1991 ). The superiority of the logarithmic function, as foretold by Wood- worth (1938), is therefore a challenge that requires further in- vestigation. If the r 2 values of the 205 nonautobiographical memory data sets of Tables 1 to 8 are compared, with each data set being considered as an independent observation, then the logarithmic function is a better fit than the power function, t(204) = 3.20, accounting for 1.5% more of the variance. The logarithmic function does even better if the normally used lin- ear fit to transformed data is applied, t(204) = 5.68, accounting for 3.2% more of the variance. Such differences may not be enough to draw a clear conclusion, but they are enough to say that the power is not a better fit for the percentage correct measure.
Slopes
In Tables 1 to 9 we give the slopes for the logarithmic func- tion. We choose this function because it is the best fitting of the common five functions and because it has two useful properties. First, the slope does not depend on the units of measurement of time. Thus all studies using the same dependent measure, such as percentage recalled or d', can be directly compared. Second, the dependent measure does not have to be transformed to use a linear fit, and thus the type of fit previously used in the litera- ture was used here. The slope values allow the rate of loss among conditions in one study to be contrasted, and if caution is used, trends across studies can be made, though comparisons of stud- ies that use different dependent measures are not meaningful. The values given also serve to demonstrate in a concrete fashion the seriousness of our concern that a function needs to be cho- sen before questions about rate of loss can be raised.
Consider two studies that claim that slopes do not change with the age of the participant. Using a modified power func-
tion, y = b( 1 + .22.t) -'~, Wickelgren (1975a) found slopes of .26, .26, and .24 for children, adults, and older adults, respec- tively, whereas we found corresponding slopes of .09, .28, and • 18 with the logarithmic function. Rubin et al. (1986), using a power function, found slopes of.93 and .96 for 20- and 70-year- olds, whereas here we found slopes of.03 and .01 with the loga- rithmic function. If the pattern of results of slopes with the log- arithmic function is examined in these studies and in the two other developmental studies (Fajnsztejn-Pollaek, 1973; Schon- field, 1969, as cited in Kausler, 1982), it is clear that the loga- rithmic function gives a steeper slope when the level of initial learning is higher, independent of the age of the participant. In agreement with Slamecka and McElree (1983), under either analysis there is no evidence of less loss with increases in the initial learning level. However, there is a consistent trend to more loss with increased initial learning level if the slope is cal- culated from the logarithmic function.
The point of this analysis is that conclusions drawn about rate of loss depend in dramatic ways on the function used to describe retention. The concern of those involved in the debate reviewed earlier on how to measure retention and to decide whether loss is different for different degrees of initial learning is warranted. Questions about rate of loss can be answered only in the context of a particular retention function (Wixted, 1990). Alternatively, one could choose the retention function to make the slopes behave in a desired fashion. Thus the power function could be favored over the logarithmic, because the rate of loss does not change with age even when the level of initial learning does (Anderson & Schooler, 1991 ). Because of the de- pendence of interpretations of slope values on the function gen- erating the slope, further interpretations should await a decision about a function.
Theore t i ca l Mot iva t ions for the Exponen t i a l and Hyperbo l i c -Power Func t i ons
General Properties
Having described and summarized the basic quantitative findings, now is the time to consider a theory, or competing the- ories, that could account for them. As the logarithmic and power functions have been described earlier, we concentrate on the exponential in ~ and the hyperbolic in ~ . When the .5 power of the square root is replaced by the parameter c, these become
y = b . e -mtc and y = l / ( b + m . t C ) . (1)
The first equation was called the exponential-power function by Wickelgren ( 1972 ), and by extension we call the second the hyperbolic-power function. Alternative forms exist for both functions• Replacing rn by ( 1 [ T ) c changes these functions into
y = b . e -(t/r)c and y = l / [ b + ( t / T ) C ] . (2)
For the exponential power when t = 0, y = b and when t = T, y = b/e. For the hyperbolic power when t = 0, y = 1/b and when t = T, y = 1/(b + 1 ). At all other values o f t , y i s a function of c. Thus both functions have clear intercepts (b and 1/b, respectively) and both have a parameter Tthat is related to their

754 RUBIN AND WENZEL
slopes, because when t goes from 0 to T, the functions drop a set amount, b(e - 1 ) /e = .63b and 1 /b(b + 1 ), respectively. For both functions, the c parameter indicates the degree of cur- vature of the function.
In searching for regularities, we limited ourselves to two-pa- rameter functions and found two such functions that are actu- ally three-parameter functions with one parameter set to .5. An attempt was made to allow the exponent c in the exponential- power and hyperbolic-power functions to vary from .5, chang- ing the two-parameter function into a three-parameter func- tion. With the data sets assembled, we reached the same conclu- sion that Wickelgren (1972) did over two decades earlier. No clear pattern emerged. One reason was that most data sets had too few points to allow three-parameter functions to be easily distinguished. A second reason was that the functions them- selves do not differ dramatically over the range ofc from. 1 to .9 that we examined. There is some trend, which was clearer in the data sets with more points, for powers of less than .5 to fit better for the exponential-power function. However, given the data available, we leave the powers fixed at .5.
The Exponential-Power Function
Before examining theoretical motivations for the exponen- tial-power function, its simpler mathematical properties need to be noted. Assume for the rest of the paragraph that the values ofb and Tremain constant. When c = 1, the exponential power is the exponential. Graphing the functions shows that with pow- ers greater than 1, it is an S-shaped function that stays near its initial level for a while and then drops sharply before leveling. The larger the value of c, the more the function looks like a step function, remaining above the exponential for t < T and below the exponential for t > T. For powers less than 1, like the square root, the function begins by dropping faster than the exponen- tial until t = T but then drops more slowly and remains above the exponential. Palmer and Stein (1989a, 1989b) noted that with c < 1 for large values o f t , the function drops faster than the power or logarithmic functions.
The exponential-power function was first derived as a reten- tion function by Wickelgren (1972). He derived the three-pa- rameter function for long-term memory from the following three axioms: (a) The rate of change of strength of the trace with respect to time is equal to - 1 multiplied by the force of decay acting on the trace divided by the resistance of the trace; (b) the force of decay is proportional to the similarity of the material currently being studied multiplied by the strength of the trace; and (c) the resistance is equal to a positive constant multiplied by time raised to a power between 0 and 1. The axi- oms were supported by brief reviews of retrograde amnesia and interference theory. The set of three axioms is interesting, espe- cially the axiom that the resistance of memories increases with time, but they are not well supported in their quantitative form. Although Wickelgren derived a three-parameter function, he analyzed his data with a two-parameter function by using the special case of c = .5, apparently because the square root was the simplest value of c between .4 and .8, which is where the best empirical fits occurred (pp. 419-420). Thus, the finding that y = b.e -mftt fits a wide range of data offers support for Wickelgren's theory, although he abandoned the function in fa-
vor of others derived from different axioms. Besides Wickel- gren's theoretical mechanisms, other possible motivations for the exponential power exist because of the function's long and distinguished history outside psychology.
The exponential-power function was first used by Kohlrausch in 1854 to describe the decay of a static-electric charge in a Leyden jar (Bendler & Shlesinger, 1987). The exponential power has since been used in many different fields, where it goes by many names, including the extreme value distribution, the fractional exponential, the Kohlrausch-Williams-Watts law, the stretched exponential, the third asymptotic distribution, and the cumulative Weibull distribution. For an example Banks (1994) used it to describe a problem in technology transfer: the rate at which diesel and electric locomotives replaced steam locomotives in the United States. Gumbel (1958) applied the distribution to account for extreme values distributions, such as in analyzing droughts on the Colorado and Connecticut Rivers. Earlier applications by Weibull ( 1951 ) were for the study of dy- namic breaking strength in materials and machines (i.e., how long material lasts until failure). Palmer and Stein (1989a, 1989b) used the function to describe the slow relaxation of ma- terials after a step-function stress is applied. In this guise, values of c between .5 and .7 are common for glasses and values of .3 for polymers. It has also been used to describe creep in rubber fibers, dielectric relaxation, return to randomness after nuclear magnetic resonance, and optical scattering (Bendler & Shle- singer, 1987). As Weibull (1951, p. 293) noted, "It is utterly hopeless to expect a theoretical basis for distribution functions for random variables such as strength properties of materials or machine parts or particle sizes, the 'particles' being fly ash, Cyrtoideae, or even adult males, born in the British Isles." Nonetheless, a function with so many varied applications might have a derivation or mechanical analog that could be adapted for a theory of retention.
WeibuU's ( 1951 ) derivation of the exponential power is based on the model of a chain made ofn links, where n is large. If any one link breaks, the chain fails. If the probability that a link will break by time t is p, then the probability that it will not break by time t is ( 1 - p) , and the probability that none of the n links will break is ( 1 - p)n. By starting in this way and choosing a distribution function for the individual links that happens to yield the correct result, the exponential-power function is ob- tained. Cox ( 1962, pp. 109-110), starting with the same ( 1 - p)" idea and different distributions, arrived at the same answer. Indow (1993) used the weakest-link chain idea to produce a model of retention by assuming that if any one feature of a memory trace changed, then with the cues available the mem- ory would not be accessed.
Analogs for memory also follow from two different models of the study of the relaxation of glassy materials. In the first formulation, Bendler and Shlesinger (1987) assumed a three- dimensional lattice of polarizable glassy material made of indi- vidual dipole moments. At t = 0 the field is turned off and the frozen-in dipoles start to relax. The average correlation of their current position with their position when the field was on decays by the exponential-power law. Frozen-in dipoles relax when they are contacted by a mobile defect. The defects are scattered throughout the lattice and move independently and randomly with time, but activation barriers with a distribution of heights

100 YEARS OF FORGETTING 755
17181 10 11111121
Figure 4. A toy model adapted from Palmer and Stein (1989b). The restricted moves of the toy lead to a loss of information in the position of the pieces that approximate the exponential-power function.
must be jumped for the defects to move. With the proper choice of the distribution of barrier heights, the desired equation is reached. Moreover, if both shallow dipole traps and frozen-in dipoles are considered, the distribution starts out as exponential and then changes to exponential power. If one envisions memo- ries, or aspects or features of memories, as being distributed in an abstract space with random noise spreading through the space and changing values of the memories they contact, such a mechanism could be adapted for memory. Bendler and Shle- singer's model will not be pursued because the second glassy- material formulation seems easier to apply.
The second model of glassy material relaxation does not use defects or barriers. The model is for relaxation following me- chanical stress, temperature, electric field, or some other step function change. Instead of barriers to impede the random movement, paths are removed to produce constrained dynam- ics. Before tackling this more abstract formalism directly, con- sider what is technically termed in the physics of complex sys- tems a toy model, which in this case is the toy shown in Figure 4. Palmer and Stein (1989b) noted that many models with con- strained dynamics produced the exponential-power function, so they tried a relatively simple two-dimensional model. The standard toy shown in Figure 4 has an area of L 2 squares, of which L 2 - 1 are filled. As anyone who has tried the puzzle knows, the paths that can be taken by a labeled square are lim- ited, and moving a labeled square from a particular location to another requires other squares to be moved opening a path, slowing the movement of all squares in the puzzle. If glass were deformed, molecules might not be able to relax to a lower en- ergy position until neighboring molecules moved. In simula- tions, which produced the exponential-power function, the open square was allowed to move randomly, L was much larger than 4, and the measure of the amount of decay was the city block distance between the original and current locations of each square. Equilibrium, which would be analogous to no memory, would occur when this distance no longer systemati- cally increased because all information of the original position was lost.
A more general form of this class of models is the diluted
hypercube. An N-dimensional hypercube has 2 u points or states and N. 2u/2 edges. The state of the system is defined by the N- tuple of ones and zeros defining the location of a marker. The marker moves randomly along the edges of the hypercube, but in the diluted hypercube most edges have been removed, mak- ing transition from one state to another slower, as in the puzzle analog. Again, under many conditions, the ability to predict the current position from the original position follows the exponen- tial-power function. In many instances, the exponent tends to- ward 1/3. If one were to consider memories as n-tuples of zeros and ones, or equivalently ones and minus ones, and were to de- grade them by randomly changing the sign of one feature every t seconds, one could build a model of memory (e.g., Hintzman, 1986). It may be possible in such a model to incorporate the constrained dynamics idea by generating such random changes but acting on only those that occur along existing edges of the hypercube. Alternatively, the states of the system could be lim- ited instead of the edges (Palmer & Stein, 1989b). For a model like Hintzman's, retention would be calculated from an average of all stored traces.
In a model of memory the paths or states could be limited to those that really exist as entities in the world, which need not be true of every combination of features a random change of sign might produce (Rubin & Wallace, 1989). Similar mechanisms might be able to produce appropriate retention functions within the framework of other models of memory. The reason retention would show an exponential-power function is that the dynamics of loss are constrained. A greater movement from the original "location" could still be remembered as the original position if better or broader cuing were used.
The Hyperbolic-Power Function
Having provided theoretical frameworks for the logarithmic, power, and exponential-power function, none could be found for the hyperbolic-power function. Nonetheless, its simpler mathematical properties can be noted. Assume for the rest of the paragraph that the values ofb and Tremain constant. When c = 1, the hyperbolic power is the hyperbolic. With powers of less than one, a parallel situation exists to that in the exponen- tial power. The function begins by dropping faster than the hy- perbolic until t = T, where it would cross the standard hyper- bolic, but then it drops more slowly and remains above it. With powers of greater than one, the opposite is true.
Three Omiss ions
A Study of Prediction
How well one can predict future forgetting? For instance, if one knows that a group of students studied a lesson until they just knew it perfectly and that 1 hr later they remembered 80%, can more be said about remembering 1 week later than it will be between 0 and 80% most of the time? How much would an- other test at 1 day add to our ability to predict? If we had the immediate and l-day test and could add a third test between them, when should it be given to most improve our prediction? How much would be gained by a well-placed fourth or fifth test? The answers will depend on the function chosen, and the ones

756 RUBIN AND WENZEL
that produce the best fits may not produce the best extrapola- tions over long gaps.
A comprehensive way to begin would be to see how the best fitting parameters for the best fitting functions change as we re- move data points from each data set, starting with those for the longest retention intervals and moving sequentially toward the most recent. To the extent that the parameters do not change, the extrapolation would be as good as the interpolated curve fitting. If systematic changes occur in the parameters, they could be compensated for, thereby reducing the error. The same pro- cedure could be used to see what range and spacing of short retention-interval points are most useful in predicting the lon- gest retention-interval points (see Baron & Cerella, 1993, for a similar logic applied to acquisition).
If the data fell perfectly on a known function, none of this would be necessary. Once n of the points were known, a curve with n free parameters could be fit and would make perfect pre- dictions. However, with less than perfectly fitting functions and with noisy data, having an estimate of how accurate prediction is given known variability in the data, a given number and place- ment of points, and the gap in time between them and the to- be-predicted retention interval would be of practical interest. At the least, it would allow us as experimental psychologists to offer advice on estimating loss of knowledge with time and to know how good that advice is.
A Study Contrasting Dependent Measures
With minor exceptions, we report data in the units used by the original authors. But for most theories, one specific measure is best. For instance, to test Anderson's (1990) claims, we should use the odds ratio. For theories that assume that memory strength is continuous and that remembering is a matter of whether a threshold in that strength is reached, d', ebbs, or other measure of underlying strength would be more appropriate. In- cluding all such measures here would have greatly expanded al- ready lengthy analyses. An efficient way to test several theories that use different dependent measures would be to keep one de- pendent measure and transform the retention functions to be tested. Thus, instead of testing the power function against odds- ratio-transformed data, one could keep the percent-recalled data and transform the power function to ( b. t - " ) / ( 1 + b. t-m ) (J. R. Anderson, personal communication, November 1994).
A Study Discriminating the Best Fitting Functions
There are no existing data sets that can distinguish among the best fitting functions. The following six criteria would define such a data set.
1. There should be nine or more retention intervals, which would allow nonlinear iterative fits of functions with two or three parameters to be made and discriminated.
2. The study should have small confidence intervals for each of these retention intervals, which should be publicly reported with the means (Loftus, 1993). Functions that do not remain within the obtained confidence intervals could be rejected. In the existing literature, confidence intervals are rarely reported, cannot be calculated from reported statistics in most proce- dures, and when they can they are too large to reject functions.
The study need not have the same number of observations at each retention interval, but rather should obtain near-equal confidence intervals at each retention interval. If a measure such as d', odds ratio, or ebbs was the main measure, the near- equal confidence intervals should be in terms of this measure.
3. To distinguish among the four most successful functions, which are based on logarithmic (or logarithmic-like) scales, the study should have a large ratio of the most to least amount re- membered and a large ratio of the longest to shortest retention intervals without obtaining indeterminate amount-recalled val- ues of 0% or 100%. Except for the autobiographical memory studies, the dependent measure in existing studies of retention usually ranges over a ratio of less than 10 to 1. This ratio could be expanded to a ratio of 90 to 1. The analysis of the autobio- graphical memory data sets suggested that increasing the range of values of the dependent measure may allow the logarithmic and power functions, in particular, to be more easily distinguished.
4. For the time between presentation and testing to be unam- biguous, each item should be presented only once, but if multiple presentations are used, they should be spaced close to- gether compared with the shortest retention interval in order to keep the length of the retention intervals well defined.
5. The activity that fills the retention intervals should be con- stant throughout the experiment so that time is proportional to the amount of intervening material.
6. Ideal data would allow retention functions (with larger confidence intervals) to be plotted for individual participants to guard against attributing to the aggregate data a retention function that does not describe individuals.
One method to meet these requirements would be a general- ization of Wickelgren's continuous recognition procedure (Wickelgren, 1972, 1974a) adapted to cued recall, recognition, and implicit memory. The method produced relatively smooth curves for Wickelgren, even when he used only six participants. Because over the course of the experiment each participant is tested at each retention interval, it would be possible to obtain fits for each participant individually. To test whether this kind of procedure could distinguish among the four best fitting func- tions, we assumed that one of them--the logarithmic func- t i o n - w a s correct, and we generated ideal data from it. With nine points spread evenly on a logarithmic time scale, we could reject the other three functions if the confidence intervals on the data points were _+2%. Thus, from a data set that meets the six properties described, it would be possible to distinguish among our top four functions or possibly to reject all four and have enough data points to distinguish among alternative three-pa- rameter functions. From a set of such data sets, it would also be possible to test whether one function could hold over a range of tasks. In addition, it would be useful to have a comparison within one experiment between conditions that presented and tested each item only once and conditions that presented items more than once at carefully chosen intervals. In the literature, the dimension of whether items are presented once or many times is not salient, yet the distinction is central to building a model of memory in which each presentation is considered as a separate event. Such a study would by necessity merge the literatures on spaced practice and retention functions.

100 YEARS OF FORGETTING 757
Discuss ion
An Evaluation of Description Before Theory
Cognitive and experimental psychology has long been domi- nated by the inferential-statistics hypothesis-testing approach (Meehl, 1978) that has provided much of the data reviewed. Nevertheless, we argued by example that this approach has hin- dered the uncovering of theoretically useful and practically im- portant regularities. It has encouraged researchers to formulate and test hypotheses on their own new data rather than to exam- ine existing data. It has also encouraged researchers to ignore the important cases where there are no differences when condi- tions are changed (Greenwald, 1975; Rubin, 1989). This article demonstrates that psychology can note quantitative regularities that are far more useful than rejected null hypotheses. Although sophisticated mathematical models of memory exist (e.g., Gil- lund & Shiffrin, 1984; Hintzman, 1986; Murdock, 1982), they do not make strong predictions about the mathematical form of the retention function. Even Anderson's adaptive model that favors the power function is only committed to the claim that retention and recurrence of events in the environment are sim- ilar (Anderson, 1990; Anderson & Schooler, 1991 ).
There is a circular problem that our approach has begun to solve. Because no adequate description of the empirical course of retention exists, models of memory cannot be expected to include it. Because no current model predicts a definite form for the retention function, there is no reason for individual model makers to gather retention data to test their models. Here the description of the empirical course of retention was made both for its own sake and as a challenge and impetus to inclusion in model building.
We explicitly considered and rejected an alternative strategy. We could have proposed a theory that explains only the shape of the retention function and attempted to test it. Our findings indicate that progress was much less likely that way for at least two reasons. The first reason is the incompleteness of the set functions that happen to be derived from theoretical principles. No theory we could find posited the hyperbola in the ~ , even though it turns out to be one of the best fitting retention func- tions and even though it may have a reasonable derivation and interpretation within an existing model of memory. The second reason is the problem of testing alternative derivations of such a function. Another one of the four best fitting retention func- tions, the exponential in the ~ , has at least four totally indepen- dent derivations that do not share common underlying mecha- nisms. Because all four theories or mechanisms arrive at the same function, there is no way for the retention data to distin- guish among them.
A more fruitful course is to add to the shape of the retention function to the collection of other observations that mathemat- ical models of memory already attempt to explain. Models that can also account for these other observations are much less likely to be consistent with all mechanisms that can be used to derive a function and thus can be used to eliminate some derivations. Thus the preferred approach is to provide a unified theory that accounts for the shape of the retention function and other memory phenomena. Deciding on whether or not it is rea- sonable to assume one retention function for a wide range of
conditions and deciding on an adequate mathematical descrip- tion of that retention function are the first two steps in this process.
An Evaluation of the Four Best Fitting Functions
One problem of describing data without guidance from a strong theory is interpreting that data. We have argued for four functions as descriptions of retention. How can we choose among these four, assuming their fits do not distinguish among them and that we do not want to wait for a comprehensive the- ory of memory? If one prefers (a) a simple two-parameter func- tion, that (b) fits the data well, with (c) a verbal description that is consistent with a host of other data besides retention, that can be (d) quickly described to students, and (e) quickly computed on a hand calculator, the logarithmic function is best. However, colleagues in physics and mathematics will not agree. The first properties they consider are the boundary conditions, and at both t = 0 and t = infinity the logarithm is not well behaved. In addition, it cannot easily be derived from a mechanism as opposed to a principle.
The power function has the same advantages and disadvan- tages as the logarithmic function. It provides a somewhat poorer fit than the logarithmic function except for the savings and the autobiographical memory data sets. Its empirical disadvantage, however, may disappear if the range of the dependent measure of retention is large. It has the advantage of being consistent with an integrated attempt to understand human memory (Anderson, 1990, 1995; Anderson & Schooler, 1991), but within this attempt the power function is only favored because it appears to fit change in the environment, and other functions might do this as well.
The exponential-power function does not have all the advan- tages of the logarithmic or power functions, but it has none of their disadvantages. The exponential power is well behaved at the boundary conditions. It can be derived from mechanisms; we offered four to choose from, and there are more to be found in the literature. Moreover, it makes sense on an intuitive level in that it is like the exponential, long favored by psychologists, but is just different enough to fit the data. It routinely turns up in disparate fields that try to fit distributions (Indow, 1993), which should be a comfort to some and a worry to others. The hyperbolic-power function has the boundary condition and in- tuitive-sense advantages of the exponential-power function, but it lacks a derivation from a mechanism or a verbal explanation. Thus it has the advantage of providing a challenge to those in- clined to find such derivations.
Our hope is that in considering retention functions in partic- ular and memory in general the data sets assembled here serve as one basis for debate. They represent the empirical effort of those who have considered the problem of retention over the last century. Recently, debate about retention has occurred without much reference to data. The 210 data sets assembled here could change that. Each has advantages for some questions. Each is described fully in a published article or technical report. The data to make methodological and theoretical improvements on this attempt to understand retention exist in the assembled data sets. If criticisms or corrections are to be made, it would be

758 RUBIN AND WENZEL
bo th efficient and rhetorically elegant to use the data we have assembled to make them.
Conclusion
Psychologists once formulated laws to account for regulari- ties in behavior, such as Feehner's law, Herrnstein's matching law, Jost's laws, Stevens' law, and Weber's law. Such lawmaking has gone out of style in cognitive psychology. Perhaps the t e rm law seems pre tent ious for the act of docum en t i ng quantif iable empir ica l regulari t ies of b road appl icat ion and somet imes ini- tially weak theoret ical underpinnings . But laws have uses be- sides providing ins t ructors with easy-to-write shor t -answer questions. They formalize the regulari t ies tha t s tudents of the field should know in a way tha t theories can use, We have estab- l ished a law: the logari thmic-loss law. Given our cu r r en t state of knowledge, we mus t offer it in three al ternative ma themat ica l formulat ions: the power law, the hyperbola- in- the-square-root- of-t forgetting funct ion, and the R u b i n - W e n z e l - W i c k e l g r e n - Weibu l l -Wi l l i ams-Wat t s exponent ia l -power law. O ur law in any of its mathemat ica l forms summar izes what we now know abou t the quant i ta t ive course of forgetting. It will serve its pur- pose either i f it r emains a fact of na tu re or i f it suggests advances tha t rapidly render it obsolete.
References
Alescio-Lautier, B., & Soumireu-Mourat, B. (1986). Comparison of re- tention and extinction of a visual discrimination as an index of for- getting in mice. Animal Learning and Behavior, 14, 197-204.
Ammons, R. B., Farr, R. G., Bloch, E., Neumann, E., Dey, M., Marion, R., & Ammons, C. H. (1958). Long term retention of perceptual motor skills. Journal of Experimental Psychology, 55, 318-328.
Anderson, J. R. (1990). The adaptive character of thought. Hillsdale, N J: Erlbaum.
Anderson, J. R. (1995). Learning and memory: An integrated ap- proach. New York: Wiley.
Anderson, J. R., & Schooler, L. J. ( 1991 ). Reflections of the environ- ment in memory. Psychological Science, 2, 396-408.
Baddeley, A. D. (1986). Working memory Oxford, England: Oxford University Press.
Baddeley, A. D. (1990). Human memory: Theory andpractice. Boston: Allyn and Bacon.
Bahrick, H. P. ( 1965 ). The ebb of retention. Psychological Review, 72, 60-73.
Bahrick, H. P. ( 1983 ). The cognitive map of a city: Fifty years of learn- ing and memory. In G. H. Bower (Ed.), The psychology of learning and motivation ( Vol. 17, pp. 125-163). New York: Academic Press.
Bahrick, H. P. (1984). Semantic memory content in permastore: Fifty years of memory for Spanish learned in school. Journal of Experi- mental Psychology: General, 113, 1-27.
Bahrick, H. P., Bahrick, P. O., & Wittlinger, R. P. (1975). Fifty years of memory for names and faces: A cross-sectional approach. Journal of Experimental Psychology: General, 104, 54-75.
Ballard, P. B. ( 1913 ). Obliviscence and reminiscence. British Journal of Psychology Monographs Supplement, 3-82.
Banks, R. B. (1994). Growth and diffusion phenomena: Mathematical frameworks and applications. Berlin: Springer-Verlag.
Baron, A., & Cerella, J. (1993). Laboratory tests of the disuse account of cognitive deficits. In J. Cerella, J. Rybash, W. Hoyer, & M. L. Com- mons (Eds.), Adult information processing: Limits on loss (pp. 175- 203 ). San Diego: Academic Press.
Bean, C. H. ( 1912 ). The curve of forgetting. Archives of Psychology, 2, 1-47.
Begg, I., & Wickelgren, W. A. (1974). Retention functions for syntactic and lexical vs. semantic information in sentence recognition mem- ory. Memory and Cognition, 2, 353-359.
Bendler, J. T., & Shlesinger, M. E (1987). Defect-diffusion models of relaxation. Journal of Molecular Liquids, 36, 37-46.
Bjork, R. A., & Whitten, W. B. (1974). Recency-sensitive retrieval pro- cesses in long-term free recall. Cognitive Psychology, 6, 173-189.
Bogartz, R. S. (1990a). Evaluating forgetting curves psychologically. Journal of Experimental Psychology: Learning, Memory and Cogni- tion, 16, 138-148.
Bogartz, R. S. (1990b). Learning-forgetting rate independence defined by forgetting function parameters or forgetting function form: Reply to Loftus and Bamber and to Wixted. Journal of Experimental Psy- chology: Learning, Memory, and Cognition, 16, 936-945.
Boreas, T. (1930). Experimental studies of memory: Second prelimi- nary communication. The rate of forgetting. Praktika Acad Athenes, 5, 382-396.
Brainerd, C. J., Reyna, V. E, Howe, M. L., & Kingma, J. (1990). The development of forgetting and reminiscence. Monographs of the So- ciety for Research in Child Development, 55 (3-4, Serial No. 222 ), 1- 92.
Bregman, A. S. (1968). Forgetting curves with semantic, phonetic, graphic, and contiguity cues. Journal of Experimental Psychology 78, 539-546.
Burtt, H. E., & Dobell, E. M. ( 1925 ). The curve of forgetting for adver- tising material. Journal of Applied Psychology, 9, 5-21.
Conway, M. A., Cohen, G., & Stanhope, N. ( 1991 ). On the very long term retention of knowledge acquired through formal education: Twelve years of cognitive psychology. Journal of Experimental Pgy- chology: General, 120, 395-409.
Conway, M. A., & Rubin, D. C. ( 1993 ). The structure of autobiograph- ical memory. In A. E. Collins, S. E. Gathercole, M. A. Conway, & P. E. Morris (Eds.), Theories of memory (pp. 103-137). Hove, Sussex, England: Erlbaum.
Cox, D. R. (1962). Renewal theory. London: Methuen. Crovitz, H. F., & Schiffman, H. (1974). Frequency of episodic memo-
ries as a function of their age. Bulletin of the Psychonomic Society, 4, 517-518.
Denny, M. R., Clos, C., & Rilling, M. (1989). Delayed matching to sample in rats in a y-maze: Instances of facilitation and immediate cross-modal transfer. Bulletin of the Psychonomic Society, 27, 141- 144.
Ebbinghaus, H, (1964). Memory. A contribution to experimental psy- chology (H. A. Ruger & C. E. Bussenius, Trans.). New York: Dover. (Original work published 1885 )
__ Estes, W. K. (1956). The problem of inference from curves based on group data. Psychological Bulletin, 53, 134-140.
Fajnsztejn-Pollack, G. ( 1973 ). A developmental study of the decay rate in long term memory. Journal of Experimental Child Psychology, 16, 225-235.
Finkenbinder, E. D. ( 1913 ). The curve of forgetting. American Journal of Psychology 24, 8-32.
Fioravanti, M., & Di Cesare, E (1992). Forgetting curves in long term memory: Evidence for a multistage model of retention. Brain and Cognition, 18, 116-124.
Gehring, R. E., Toglia, M. P., & Kimble, G. A. (1976). Recognition memory for words and pictures at short and long retention intervals. Memory and Cognition, 4, 256-260.
Giambra, L. M., & Arenberg, D. (1993). Adult aging in forgetting sen- tences. Psychology and Aging, 8, 451-462.
Gillund, G., & Shiffrin, R. M. (1984). A retrieval model for both recall and recognition. Psychological Review, 91, 1-67.

100 YEARS OF FORGETTING 759
Glasnapp, D. R., Poggio, J. P., & Ory, J. C. (1978). End-of-course and long term retention outcomes for mastery and nonmastery learning paradigms. Psychology in the Schools, 15, 595-603.
Glenberg, A. M., & Swanson, N. G. ( 1986 ). A temporal distinctiveness theory of recency and modality effects. Journal of Experimental Psy- chology: Learning, Memory, and Cognition, 12, 3-15.
Green, D. M., & Swets, J. A. (1966). Signal detection theory andpsy- chophysics. New York: Wiley.
Greenwald, A. G. ( 1975 ). Consequences of prejudice against the null hypothesis. Psychological Bulletin, 82, 1-20.
Gumbel, E. J. ( 1958 ). Statistics of extremes. New York: Columbia Uni- versity Press.
Guttentag, R. E. (1990). Issues in the study of age differences in forget- ting. Monographs of the SocietyJbr Research in Child Development, 55(3-4, Serial No. 222), 94-99.
Harnett, P., McCarthy, D., & Davison, M. (1984). Delayed signal de- tection, differential reinforcement, and short term memory in the pi- geon. Journal of the Experimental Analysis of Behavior, 42, 87-111.
Hellyer, S. ( 1962 ). Frequency of stimulus presentation and short-term decrement in recall. Journal of Experimental Psychology, 64, 650.
Helson, H. (1964). Adaptation-level theory. An experimental and sys- tematic approach to behavior New York: Harper & Row.
Hintzman, D. L. (1986). "Schema abstraction" in a multiple-trace memory model. Psychological Review, 93, 411-428.
Hulicka, I. M., & Weiss, R. L. (1965). Age differences in retention as a function of learning. Journal of Consulting Psychology, 29, 125-129.
Indow, T. ( 1993 ). Retention curves of artificial and natural memory: ~g, ht and soft models (Institute for Mathematical Behavioral Sci- ences, Technical Report Series, MBS 93-11 ). lrvine: University of California.
Jans, J. E., & Catania, C. (1980). Short-term remembering of discrim- inative stimuli in pigeons. Journal of the Experimental Analysis of Behavior, 34, 177-183.
Jarrard, L. E., & Moise, S. L. (1970). Short term memory in the stump- tail macaque: Effect of restraint of behavior on performance. Learn- ing and Motivation, 1, 267-275.
Johnson, G. J. ( 1991 ). A distinctiveness model of serial learning. Psy- chological Review,, 98, 204-217.
Kausler, D. H. (1974). Psychology of verbal learning and memory, New York: Academic Press.
Kausler, D. H. ( 1982 ). Experimental Psychology and Human Aging. New York: Wiley.
King, H. E. (1963a). The retention of sensory experience: I. Intensity. Journal of Psychology, 56, 283-290.
King, H. E. (1963b). The retention of sensory experience: I1. Fre- quency. Journal of Psychology, 56, 291-298.
Krueger, W. C. E (1929). The effect of overlearning on retention. Journal of Experimental Psychology, 12, 71-78.
Laming, D. (1992). Analysis of short-term retention: Models for Brown-Peterson experiments. Journal of Experimental Psychology: Learning, Memory, and CognRion, 18, 1342-1365.
Lavach, J. E ( 1971 ). The effects of emotional arousal on short vs. long term retention of continuously presented information. Final report. Williamsburg, VA: College of William and Mary.
Linton, M. ( 1975 ). Memory for real world events. In D. A. Norman & D. E. Rumelhart (Eds.), Explorations in cognition (pp. 376--404). San Francisco: Freeman.
Loftus, G. R. (1985a). Consistency and confoundings: Reply to Sla- mecka. Journal of Experimental Psychology: Learning, Memory, and Cognition, 11, 817-820.
Loftus, G. R. (1985b). Evaluating forgetting curves. Journal of Exper- imental Psychology." Learning, Memory, and Cognition, 11, 397-409.
Loftus, G. R. ( 1993 ). Editorial comment. Memory & Cognition, 21, 1- 3.
Lofius, G. R., & Bamber, D. (1990). Learning-forgetting indepen- dence, unidimensional memory models, and feature models: Com- ment on Bogartz. Journal of Experimental Psychology. Learning, Memory, and Cognition. 16, 916-926.
Longmore, B. E., & Knight, R. G. (1988). The effect of intellectual deterioration on retention deficits in amnesic alcoholics. Journal of Abnormal Psychology, 97, 448--454.
Luh, C. W. (1922). The conditions of retention. Psychological Mono- graphs, 31, whole no. 142.
MacLeod, C. M. (1988). Forgotten but not gone: Savings for pictures and words in long term memory. Journal of Experimental Psychol- ogy." Learning, Memory, and Cognition, 14, 195-212.
Mazur, J., & Hastie, R. ( 1978 ). Learning as accumulation: A reexami- nation of the learning curve. Psychological Bulletin, 85, 1256-1274.
McGeogh, J. A. ( 1932 ). Forgetting and the law of disuse. Psychological Review,, 39, 352-370.
Meehl, P. E. (1978). Theoretical risks and tabular asterisks: Sir Karl, Sir Ronald, and the slow progress of soft psychology. Journal of Con- sulting and Clinical Psychology, 46, 806-834.
Moise, S. J. (1970). Short term retention in macaca speciosa following interpolated activity during matching from sample. Journal of Com- parative and Physiological Psychology, 73, 506-514.
Morrison, E J., Haith, M. M., & Kagan, J. (1980). Age trends in recog- nition memory for pictures: The effects of delay and testing proce- dure. Bulletin of the Psychonomic Society, 16, 480-483.
Murdock, B. B., Jr. (1960). The distinctiveness of stimuli. Psychological Review,, 67, 16-31.
Murdock, B. B., Jr. ( 1961 ). The retention of individual items. Journal of Experimental Psychology, 62, 618-625.
Murdock, B. B., Jr. (1982). A theory for the storage and retrieval of of item associative information. Psychological Review, 89, 609-627.
Nelson, K. R., & Wasserman, E. A. (1978). Temporal factors influenc- ing the pigeon's successful matching to sample performance: Sample duration, intertrial interval, and retention interval, dournaloftheEx- perimental Analysis of Behavior, 30, 153-162.
Nelson, T. O., Shimamura, A. R, & Leonescio, J. (1980). Large effects on long term retention after standard list learning and adjusted learn- ing. Behavior Research Methods and Instrumentation, 12, 42-44.
Nelson, T. O., & Vining, S. K. ( 1978 ). Effects of semantic versus struc- tural processing on long-term retention. Journal of Experimental Psychology. Human Learning and Memory, 4, 198-209.
Newell, A., & Rosenbloom, P. S. ( 1981 ). Mechanisms of skill acquisi- tion and the law of practice. In J. R. Anderson (Ed.), Cognitive skills and their acquisition (pp. 1-55 ). Hillsdale, N J: Erlbaum.
Palmer, R. G., & Stein, D. L. (1989a). Glasses: I. Phenomenology. In D. L. Stein (Ed.), Lectures in the sciences of complexity: Lectures (Vol. 1,759-769). Redwood, CA: Addison-Wesley.
Palmer, R. G., & Stein, D. L. (1989b). Glasses: II. Models of glassy relaxation. In D. L. Stein (Ed.), Lectures in the sciences of complexity (pp. 771-785 ). Redwood City, CA: Addison-Wesley.
Peterson, L. R., & Peterson, M. J. ( 1959 ). Short term retention of indi- vidual verbal items. Journal of Experimental Psychology, 58, 193- 198.
Radosavljevich, P. R. ( 1907 ). Das Behalten und Vergessen bei Kindern und Erwachsenen nach experimentellen Untersuchungen [ An experi- mental investigation of the retention and forgetting of children and adults]. Leipzig: Nemnich.
Ratcliff, R. (1990). Connectionist models of recognition memory: Con- straints imposed by learning and forgetting functions. Psychological Review, 97, 285-308.
Roberts, W. A., & Grant, D. S. (1978). An analysis of light-induced retroactive inhibition in pigeon short-term memory. Journal of Ex- perimental Psychology: Animal Behavior Processes, 4, 219-236.
Roediger, H. L., III, & McDermott, K. B. (1993). Implicit memory in
760 RUBIN AND WENZEL
normal human subjects. In E Boiler & J. Grafman (Eds.), Handbook ofneuropsychology (Vol. 8, pp. 63-131 ). Amsterdam: Elsevier.
Roediger, H. L., II1, & Payne, D. G. (1982). Hypermnesia: The role of repeated testing. Journal of Experimental Psychology: Learning. Memory, and Cognition, 8, 66-72.
Rovee-Collier, C. (1993). The capacity for long-term memory in in- fancy. Current Directions in Psychological Science, 2, 130-135.
Rubin, D. C. (1982). On the retention function for autobiographical memory. Journal of Verbal Learning and Verbal Behavior, 21, 21-38.
Rubin, D. C. ( 1985 ). Memorability as a measure of processing: A unit analysis of prose and list learning. Journal of Experimental Psychol- ogy: General 114, 213-238.
Rubin, D. C. (1989). Issues of regularity and control: Confessions of a regularity freak. In L. W. Poon, D. C. Rubin, & B. A. Wilson (Eds.), Ew, ryday cognition in adult and later life (pp. 84-103 ). Cambridge, England: Cambridge University Press.
Rubin, D. C. ( 1995 ). Memory in oral traditions: The cognitive psychol- ogy of epic, ballads, and counting-out rhymes. New York: Oxford Uni- versity Press.
Rubin, D. C., & Baddeley, A. D. (1989). Telescoping is not time com- pression: A model of dating autobiographical events. Memory and Cognition. 17, 653-661.
Rubin, D. C., & Wallace, W. T. ( 1989 ). Rhyme and reason: Analyses of dual cues. Journal of Experimental Psychology. Learning, Memory, and Cognition, 15, 698-709.
Rubin, D. C., Wetzler, S. E., & Nebes, R. D. (1986). Autobiographical memory across the adult lifespan. In D. C. Rubin (Ed.), Autobio- graphical memory ( pp. 202-221 ). Cambridge, England: Cambridge University Press.
Ru nquist, W. ( 1983 ). Some effects of remembering on forgetting. Mem- ory and Cognition, 11, 641-650.
Serra, M., & Nairne, J. S. (1993). Design controversies and the genera- tion effect: Support for an item-order hypothesis. Memory & Cogni- tion, 21.34-40.
Shimp, C. E, & Moifitt, M. (1977). Short term memory in the pigeon: Delayed pair comparison procedures and some results. Journal of the Experimental Analysis of Behavior, 28, 15-25.
Simon, H. A. (1966). A note on Jost's law and exponential forgetting. Psychometrika, 31, 505-506.
Slamecka, N. J. (1985). On comparing rates of forgetting: Comment on Loftus. Journal of Experimental Psychology: Learning, Memory, and Cognition, 11, 812-816.
Slamecka, N. J., & McElree, B. ( 1983 ). Normal forgetting of verbal lists as a function of their degree of learning. Journal of Experimental Psychology: Learning, Memory, and Cognition, 9, 384-397.
Sloman, S. A., Hayman, C. A. G., Ohta, N., Law, J., & Tulving, E. (1988). Forgetting in primed fragment completion. Journal of Ex- perimental Psychology: Learning, Memory, and Cognition, 14, 223- 239.
Spitzer, H. E (1939). Studies in retention. Journal of Educational Psy- chology, 30, 641-656.
Squire, L. R. (1989). On the course of forgetting in very long term memory. Journal of Experimental Psychology: Learning, Memory, and Cognition, 15, 241-245.
Staats, A. W., Minke, K. A., & Stalling, R. B. (1970). Longterm reten- tion tfconditioned attitudes (Report No. TR-6 ). Honolulu: Hawaii University, Department of Psychology. (ERIC Document Reproduc- tion Service No. ED 043 215 )
Staddon, J. E. R. ( 1983 ). Adaptive behavior and learning. Cambridge, England: Cambridge University Press.
Staddon, J. E. R. (1993). On rate-sensitive habituation. Adaptive Be- havior, 1,421-436.
Stevens S. S. ( 1975 ). Psychophysics: Introduction to its perceptual neu- ral, and social prospects. New York: Wiley.
Strong, E. K. ( 1913 ). The effect of time interval upon recognition mem- ory. Psychological Review, 30, 339-372.
TableCurve 2D [Computer software]. (1994). San Rafael, CA: Jandel Scientific.
Thompson, C. E (1982). Memory for unique personal events: The roommate study. Memory and Cognition, 10, 324-332.
Tsai, C. ( 1924 ). A comparative study of retention curves for motor hab- its. Comparative Psychology Monographs, 2, 1-29.
Turvey, M. T., Brick, E, & Osborn, J. (1970). Proactive interference in short-term memory as a function of prior-item retention interval. Quarterly Journal of Experimental Psychology, 22, 142-147.
Turvey, M. T., & Weeks, R. A. ( 1975 ). Effects of proactive interference and rehearsal on the primary and secondary components of short term retention. Quarterly Journal of Experimental Psychology, 27, 47-62.
Underwood, B. J. (1966). Experimental psychology (2nd ed.). New York: Appleton-Century-Crofts.
Waugh, N. C., & Norman, D. A. ( 1965 ). Primary memory. Psycholog- ical Review, 72, 89-104.
Weibull, W. ( 1951 ). A statistical distribution function of wide applica- bility. Journal of Applied Mechanics, 18, 293-297.
Wheeler, M. A., & Roediger, H. L., III.(1992). Disparate effects of re- peated testing: Reconciling Ballard's ( 1913 ) and Bartlett's ( 1932 ) results. Psychological Science, 3, 240-245.
White, G. K. ( 1985 ). Characteristics of forgetting functions in delayed matching to sample. Journal of the Experimental Analysis of Behav- ior, 44, 15-34.
White, G. K., & McKenzie, J. (1982). Delayed stimulus control: Recall for single and relational stimuli. Journal of the ExperimentalAnalysis of Behavior, 38, 305-312.
Wickelgren, W. A. ( 1968 ). Sparing of short term memory in an amne- sic patient: Implications of strength theory of memory. Neuropsycho- logia. 6, 235-244.
Wickelgren, W. A. ( 1972 ). Trace resistance and the decay of long-term memory. Journal of Mathematical Psychology, 9, 418-455.
Wickelgren, W. A. (1973). The long and the short of memory. Psycho- logical Bulletin, 80, 425-38.
Wickelgren, W. A. (1974a). Single-trace fragility theory of memory dy- namics. Memory & Cognition, 2, 775-780.
Wickelgren, W. A. (1974b). Strength/resistance theory of the dynam- ics of memory storage. In D. H. Krantz, R. C. Atkinson, R. D. Luce, & E Suppes (Eds.), Contemporary developments in mathematical psychology: Learning, memory and thinking (pp. 209-242). San Francisco: Freeman.
Wickelgren, W. A. (1975a). Age and storage dynamics in continuous recognition memory. Developmental Psychology, 1 I, 165-169.
Wickelgren, W. A. (1975b). Alcoholic intoxication and memory stor- age dynamics. Memory & Cognition. 3, 385-389.
Wilson, B., & Boakes, R. A. (1985). A comparison of the short term memory performances of pigeons and jackdaws. Animal Learning and Behavior, 13, 285-290.
Wixted, J. T. (1990). Analyzing the empirical course of forgetting. Journal of Experimental Psychology: Learning, Memory, and Cogni- tion. 16, 927-935.
Wixted, J. T., & Ebbesen, E. B. ( 1991 ). On the form of forgetting. Psy- chological Science, 2, 409-415.
Woodworth, R. S. ( 1938 ). Experimentalpsychology, New York: Henry Holt.
Received Janua ry 20, 1995 Revision received M a r c h 5, 1996
Accepted Apri l 3, 1996 •