one country two economies bill dunkelberg and william dennis
TRANSCRIPT

ONE COUNTRYTWO ECONOMIES
Bill Dunkelberg, Chief Economist – NFIB
William J. Dennis, Jr., Pinch Hitter – NFIB
Richmond Fed Credit Markets Symposium
April, 2013
Charlotte, NC

A Bifurcated Economy
GDP Growth Tepid while
Stock Market near Record High
Corporate Profits near Record High
Unemployment Rate at 7.6%
[ 0% + 4%] / 2 = 2% Growth

Small Business Optimism Index(Quarterly, 1986 = 100)
80
85
90
95
100
105
110
Seasonally Adjusted
Source: NFIB Research Foundation

Small Business Economic Trends

Outlook for Business Expansion(Pct. “Now Is a Good Time”)
0
5
10
15
20
25
30
Perc
ent
of F
irms
“NO” for 20 Quarters

“Not a Good” Time to ExpandDUE TO ________
0102030405060708090
Perc
ent
of F
irms
Political Economic Costs
As Pct. Saying “Not a Good Time”
Source: NFIB Research Foundation

Reported Change in Past Sales (Last Three Months vs. Prior Three)
-40
-30
-20
-10
0
10
20
30
[Pct. "Higher" - Pct. "Lower", Seas. Adj.]
Perc
ent
of F
irms
Recession Ends
Source: NFIB Research Foundation

Earnings Trends - Pct. “Higher” – Pct. “Lower”
-50
-40
-30
-20
-10
0
Perc
ent
of F
irm
s

Planned Capital Outlays(Next Three to Six Months)
15
20
25
30
35
40
45
Perc
ent
of F
irms
Source: NFIB Research Foundation

INVENTORY INVESTMENT PLANS[% PLAN INCREASE – % PLAN DECREASE]
-15
-10
-5
0
5
10
15
Perc
ent
of F
irms
Source: NFIB Research Foundation

Job Openings -(Pct. with at Least One Unfilled Opening)
5
10
15
20
25
30
35
40
76 79 82 85 88 91 94 97 '00 '03 '06 '09 '12
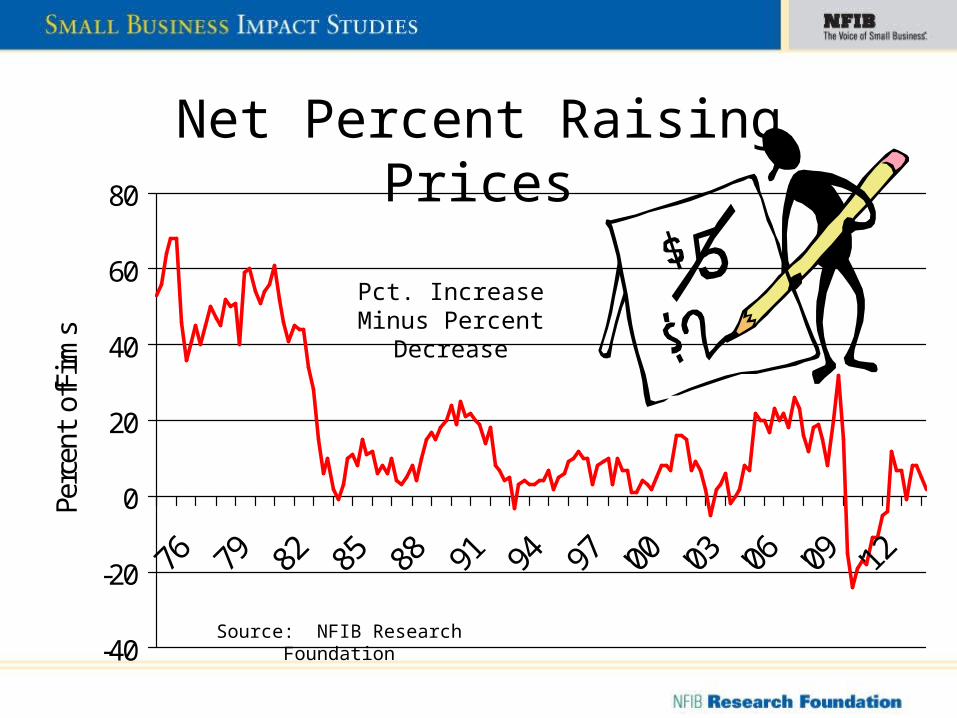
Net Percent Raising Prices
-40
-20
0
20
40
60
80
Perc
ent
ofFi
rms
Pct. Increase Minus Percent Decrease
Source: NFIB Research Foundation

Tepid Small Business Recovery
A Function of: ?
1.Credit Supply
2.Credit Demand
3.Both
4.Neither

Single Most Important Problem
0
5
10
15
20
25
30
35
40
45
Perc
ent
of F
irms Inflation Credit/Interest
Source: NFIB Research Foundation

Single Most Important Small Business Problem:
2000 – 2013 (monthly)
Source: NFIB Research Foundation

Most Important ProblemsProb.Rank Problem – Aug. 20121.2.3.4.5.6.14.26.32.56.
Rising Health Care CostsUncertainty Over Economic ConditionsEnergy CostsUncertainty Over Government ActionsCost of Regulations and Red TapeTaxes on Business IncomePoor EarningsPoor SalesLocating Qualified EmployeesSecuring Long Term Financing

Regular Borrowing Activity(At Least Once a Quarter)
Source: NFIB Research Foundation

Loan Demand Weakens Through the Recession
35
40
45
50
55
Perc
ent
of F
irms
Recession Starts
Source: NFIB Research Foundation
Pct. – Not Wanting a Loan

Business Loans (Origination) under $1 Millionfrom Commercial Banks: 1996 – 2011*
Source: Community Reinvestment Act data, Federal Financial Examination Council
*Represents approximately 80 percent of such loans.

Outstanding Small C&I and RE Loans by Number and Dollar Volume: 1995-2012(p)
Source: Call Reports, FDIC

More/Less in Competition for Small Businesses Banking Business
Source: NFIB Research Foundation Selected Year
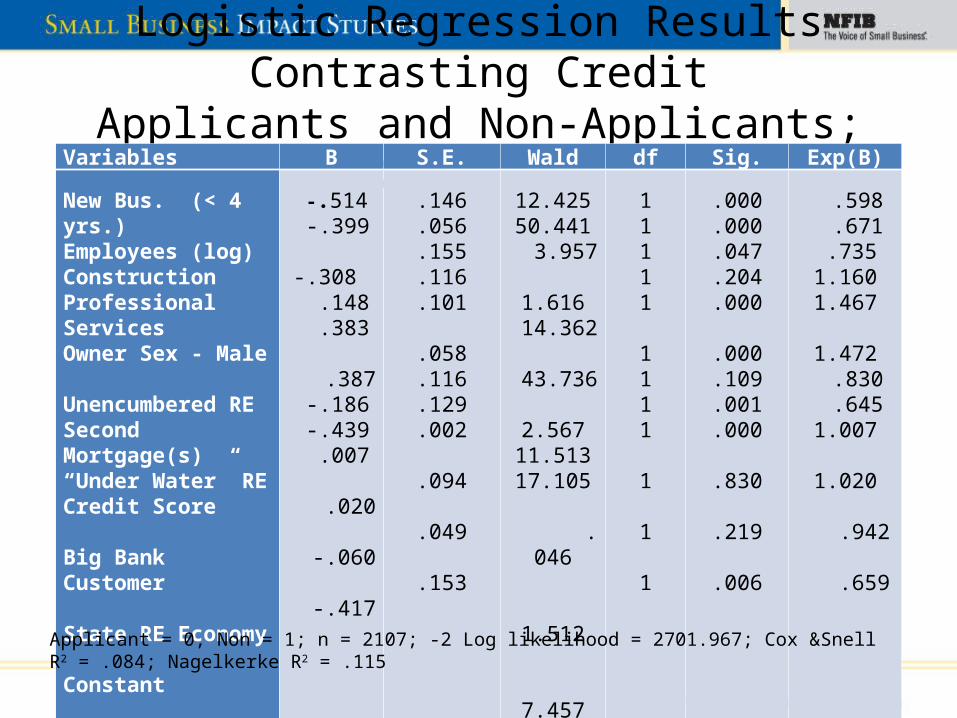
Logistic Regression Results Contrasting CreditApplicants and Non-Applicants; 2009 – 2011
Variables B S.E. Wald df Sig. Exp(B)
New Bus. (< 4 yrs.)Employees (log)Construction Professional ServicesOwner Sex - Male
Unencumbered RESecond Mortgage(s)“Under Water” RECredit Score
Big Bank Customer State RE Economy Constant
-.514 -.399 -.308 .148 .383
.387 -.186 -.439 .007
.020
-.060
-.417
.146
.056
.155
.116
.101
.058
.116
.129
.002
.094
.049
.153
12.42550.441 3.957 1.616 14.362
43.736 2.56711.51317.105
.046
1.512
7.457
11111 1111
1 1 1
.000
.000 .047 .204.000
.000 .109 .001.000
.830
.219
.006
.598 .671 .7351.1601.467
1.472 .830 .6451.007
1.020
.942
.659
Applicant = 0, Non = 1; n = 2107; -2 Log likelihood = 2701.967; Cox &Snell R2 = .084; Nagelkerke R2 = .115

Logistic Regression Results Contrasting Accepted and Rejected Borrowers; 2009 – 2011
Variables B S.E. Wald df Sig. Exp(B)
New Bus. (< 4 yrs.)Employees (log)ConstructionProfessional ServicesOwner Sex - Male
Unencumbered RESecond Mortgage(s)“Under Water” RECredit Score Big Bank Customer State RE Economy Constant
-.095 .066 .372-.257 .107
.328 -.597 -.560 .014
-.517
.204
-.347
.178 .068 .210.169.155
.099 .149 .157.002
.134
.070
.211
.287 .945 .2872.311 .477
10.839 16.015 12.714 38.568
15.011
8.480
2.715
11111 1111
1 1
1
.592.331 .076 .128 .490
.001 .000 .000.000
.000
.004
.099
.909
1.069 1.451 .773 1.113
1.388
.550 .571 1.014
.596
1.227
.707
Accept = 1, Reject = 0; n = 1231; - 2 Log likelihood = 1344.014; Cox &Snell R2 = .144; Nagelkerke R2 = .193

Credit Approval and Discouraged Borrowers in States Grouped by Residential Mortgages
with Negative EquityCredit Approval High Negative Eq. Med. Negative
Eq.Low Negative Eq. All States
AcceptedRejected
43%57
59%41
63%37
56%44
N 321 840 249 1410
Not Borrowing High Negative Eq. Med. Negative Eq.
Low Negative Eq. All States
Non-BorrowerDiscouraged Borrower
84%
16
84%
16
89%
11
85%
15
N 229 544 170 943
Source: NFIB Research Foundation

Small-Employer-Owned Real Estate by SelectedReal Estate Finance Characteristics – 2010
Residential Business1 Investment All Real EstateCharacteristic Total2 Own3 Mort.4 Total2 Own3 Mort.4 Total2 Own3 Mort.4 Total2 Own3 Mort.4
Own1st Mortgage2nd MortgageUpside-DownMort. For Bus. PurposesUsed as Collateral
94% 61 65% 16 17 26% 6 7 10 15 16 24 7 7 11
36% 19 63% 1 4 7 % 1 4 6 2 9 20 4 19 30
37% 18 49% 2 5 9% 3 8 15 2 5 9 2 6 12
95% 68 71% 17 18 25% 8 9 12 17 18 21 11 11 16
N
734 693 457
734 324 198
734 310 166
734 708 537
Source : “Small Business and Credit Access,” NFIB Research Foundation, January 2011. 1Businesses operating primarily from the home are included in residential only.2As a percentage of the small employer population.3As a percentage of small employers owning that type of real estate.4As a percentage of small employers with that type of real estate mortgaged.
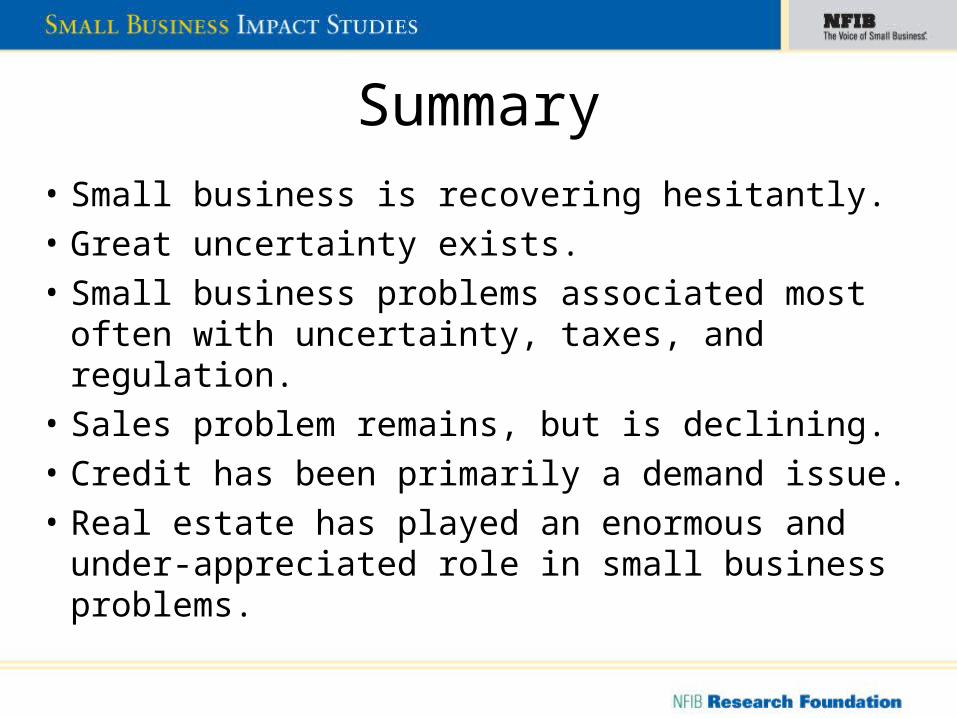
Summary• Small business is recovering hesitantly.• Great uncertainty exists.• Small business problems associated most often
with uncertainty, taxes, and regulation.• Sales problem remains, but is declining.• Credit has been primarily a demand issue.• Real estate has played an enormous and under-
appreciated role in small business problems.