economies of scale v economies of volume lwrs -...
TRANSCRIPT
Economies of Scale v
Economies of Volume – LWRs Nuclear Institute - SMR Conference
Tony Roulstone, Zhenjun Guan September 2014
1
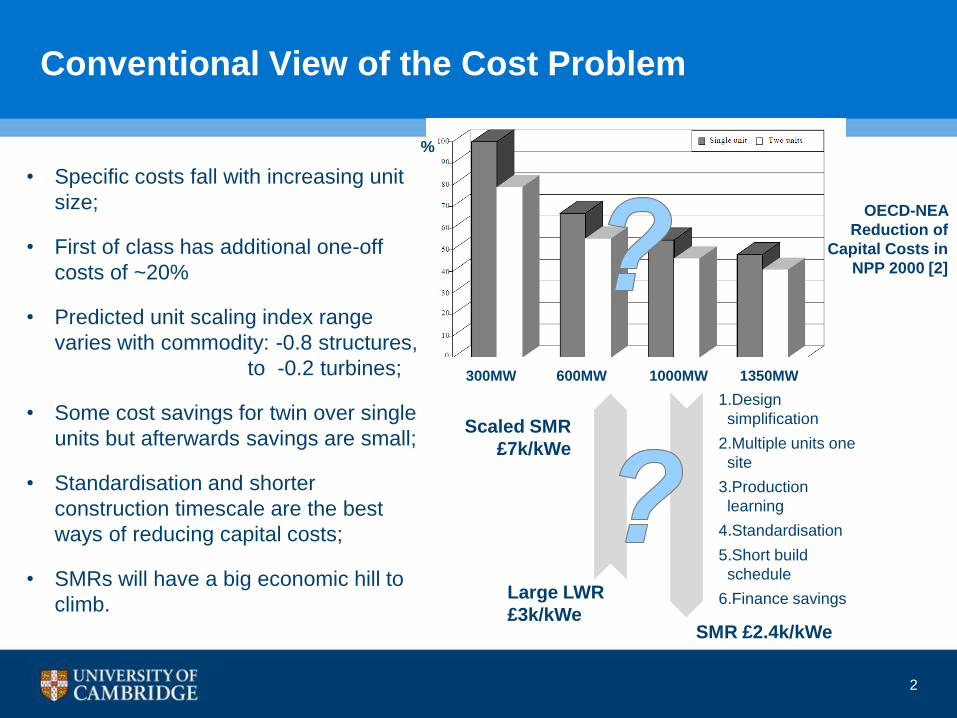
Conventional View of the Cost Problem
• Specific costs fall with increasing unit
size;
• First of class has additional one-off
costs of ~20%
• Predicted unit scaling index range
varies with commodity: -0.8 structures,
to -0.2 turbines;
• Some cost savings for twin over single
units but afterwards savings are small;
• Standardisation and shorter
construction timescale are the best
ways of reducing capital costs;
• SMRs will have a big economic hill to
climb.
2
OECD-NEA
Reduction of
Capital Costs in
NPP 2000 [2]
Large LWR
£3k/kWe
Scaled SMR
£7k/kWe
SMR £2.4k/kWe
1.Design
simplification
2.Multiple units one
site
3.Production
learning
4.Standardisation
5.Short build
schedule
6.Finance savings
%
300MW 600MW 1000MW 1350MW
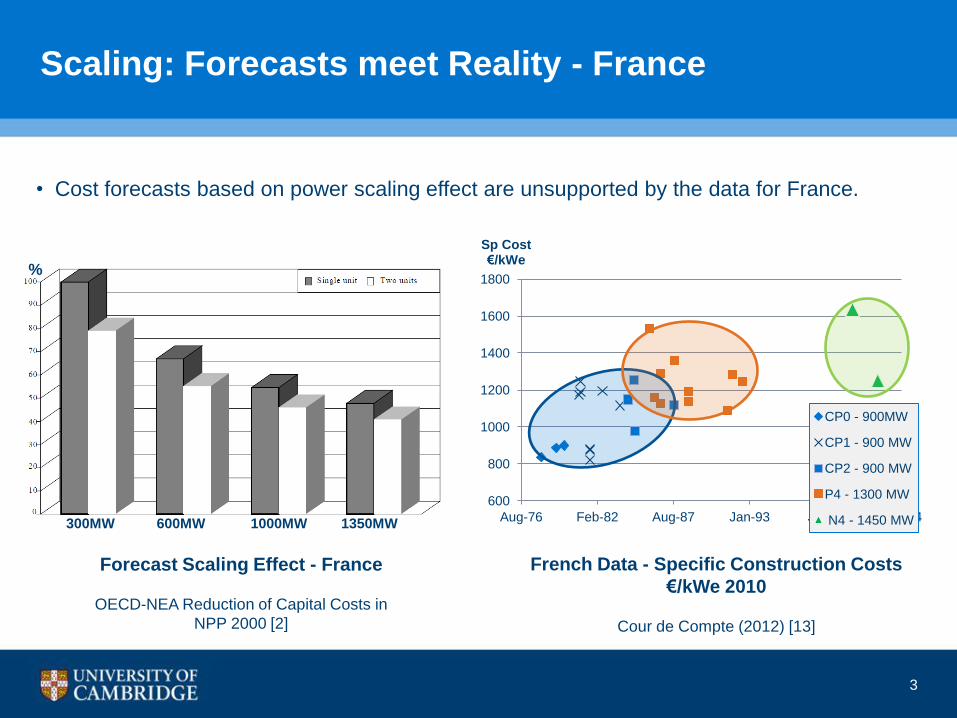
Scaling: Forecasts meet Reality - France
3
Forecast Scaling Effect - France
OECD-NEA Reduction of Capital Costs in
NPP 2000 [2]
600
800
1000
1200
1400
1600
1800
Aug-76 Feb-82 Aug-87 Jan-93 Jul-98 Jan-04
Sp Cost €/kWe
CP0 - 900MW
CP1 - 900 MW
CP2 - 900 MW
P4 - 1300 MW
N4 - 1450 MW
French Data - Specific Construction Costs
€/kWe 2010
Cour de Compte (2012) [13]
• Cost forecasts based on power scaling effect are unsupported by the data for France.
300MW 600MW 1000MW 1350MW
%
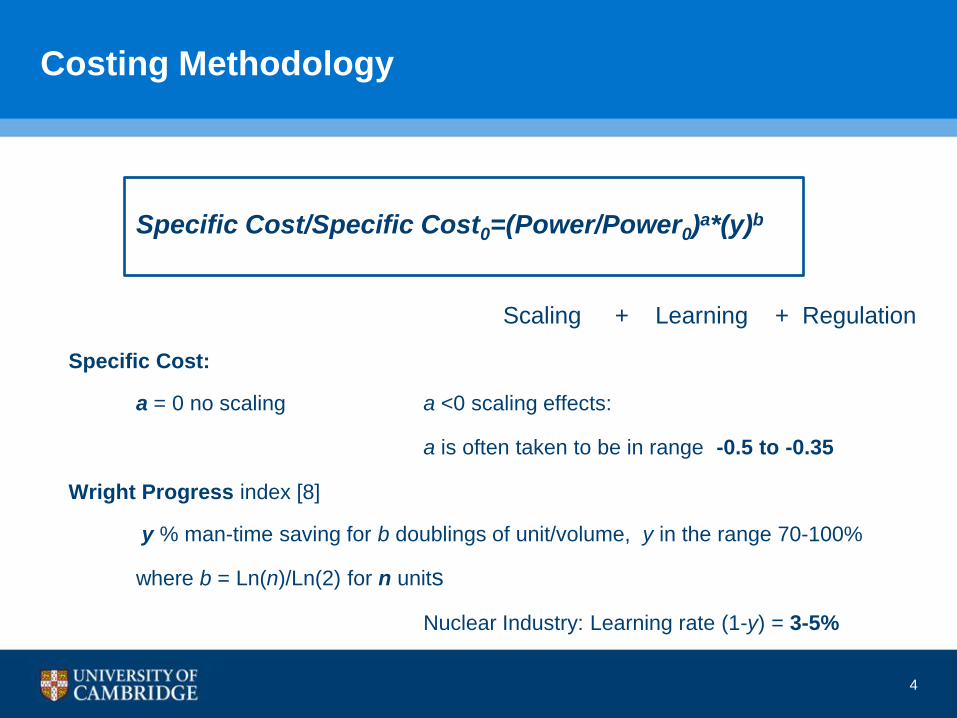
Costing Methodology
Specific Cost/Specific Cost0=(Power/Power0)a*(y)b
Scaling + Learning + Regulation
Specific Cost:
a = 0 no scaling a <0 scaling effects:
a is often taken to be in range -0.5 to -0.35
Wright Progress index [8]
y % man-time saving for b doublings of unit/volume, y in the range 70-100%
where b = Ln(n)/Ln(2) for n units
Nuclear Industry: Learning rate (1-y) = 3-5%
4
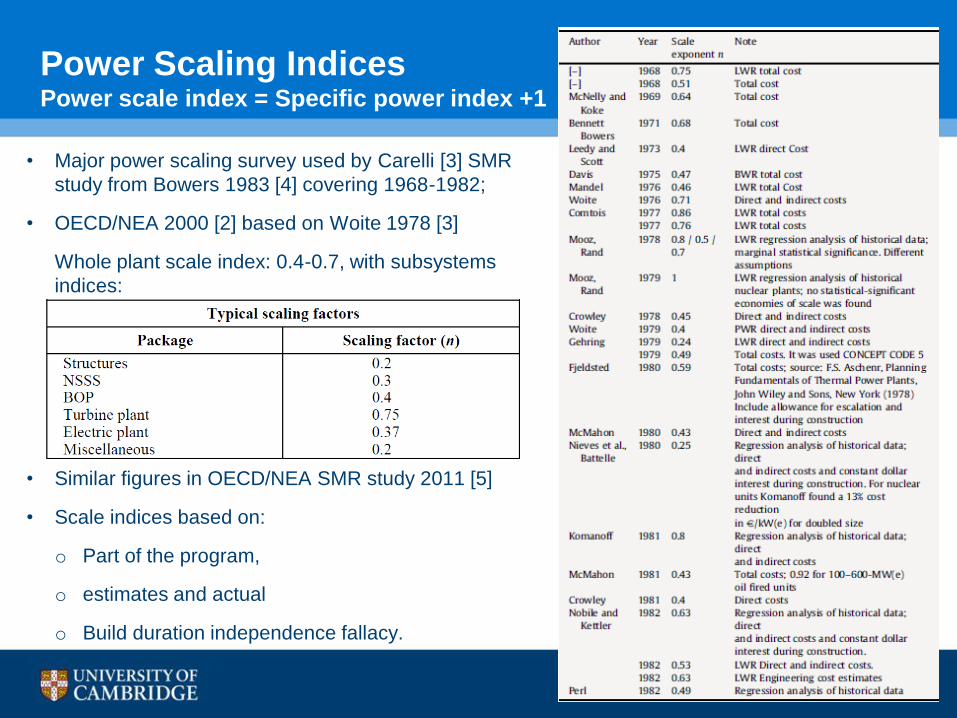
Power Scaling Indices Power scale index = Specific power index +1
5
• Major power scaling survey used by Carelli [3] SMR
study from Bowers 1983 [4] covering 1968-1982;
• OECD/NEA 2000 [2] based on Woite 1978 [3]
Whole plant scale index: 0.4-0.7, with subsystems
indices:
• Similar figures in OECD/NEA SMR study 2011 [5]
• Scale indices based on:
o Part of the program,
o estimates and actual
o Build duration independence fallacy.
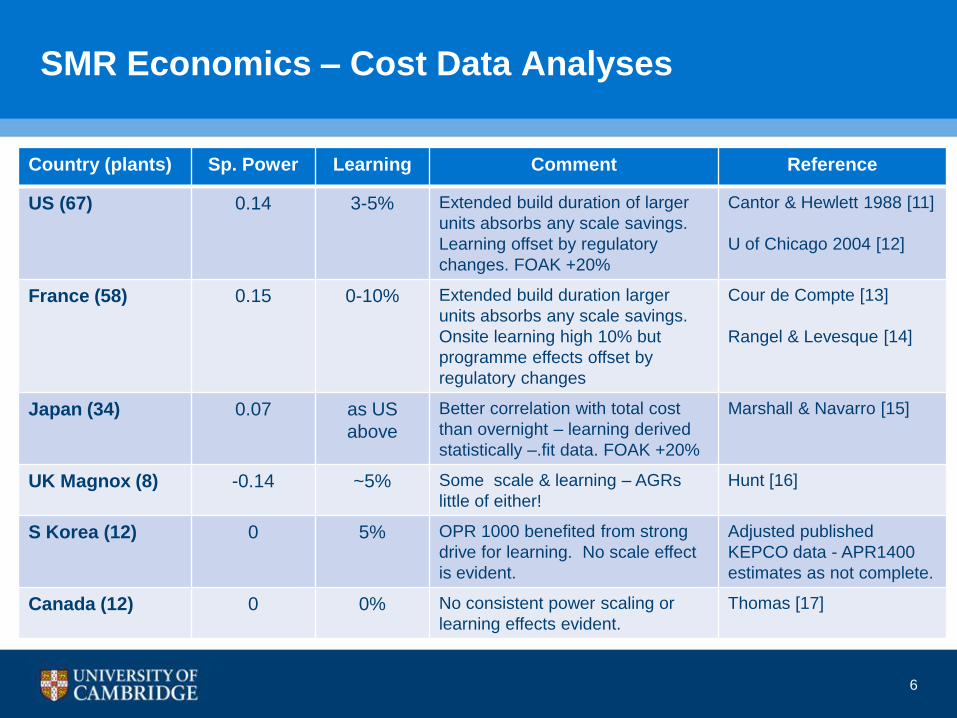
SMR Economics – Cost Data Analyses
Country (plants) Sp. Power Learning Comment Reference
US (67) 0.14 3-5% Extended build duration of larger
units absorbs any scale savings.
Learning offset by regulatory
changes. FOAK +20%
Cantor & Hewlett 1988 [11]
U of Chicago 2004 [12]
France (58) 0.15 0-10% Extended build duration larger
units absorbs any scale savings.
Onsite learning high 10% but
programme effects offset by
regulatory changes
Cour de Compte [13]
Rangel & Levesque [14]
Japan (34) 0.07 as US
above
Better correlation with total cost
than overnight – learning derived
statistically –.fit data. FOAK +20%
Marshall & Navarro [15]
UK Magnox (8) -0.14 ~5% Some scale & learning – AGRs
little of either!
Hunt [16]
S Korea (12) 0 5% OPR 1000 benefited from strong
drive for learning. No scale effect
is evident.
Adjusted published
KEPCO data - APR1400
estimates as not complete.
Canada (12) 0 0% No consistent power scaling or
learning effects evident.
Thomas [17]
6
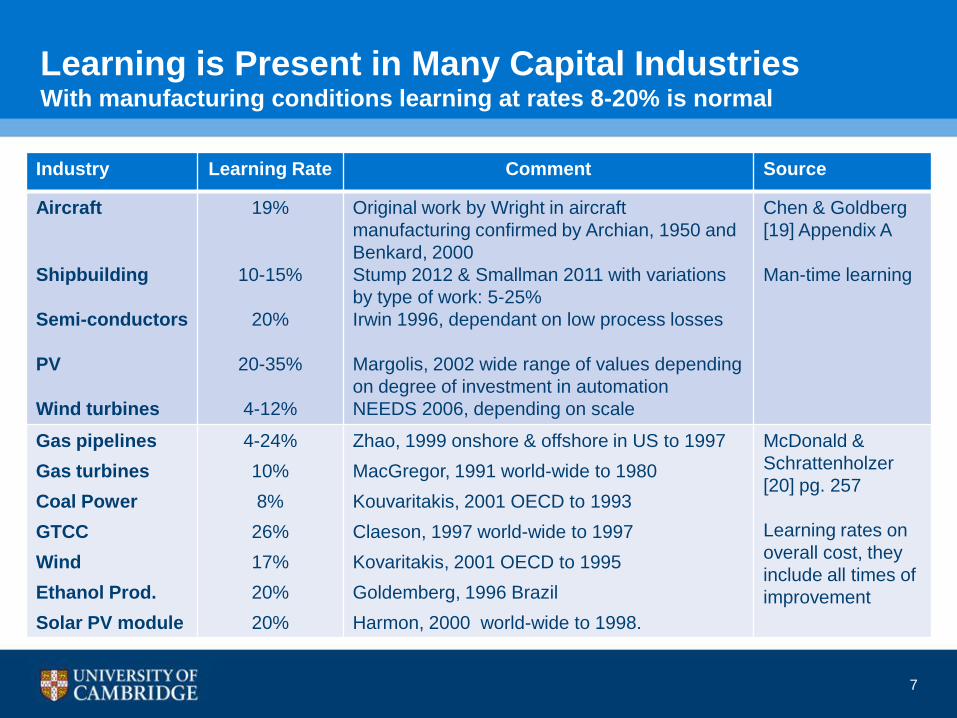
Learning is Present in Many Capital Industries With manufacturing conditions learning at rates 8-20% is normal
Industry Learning Rate Comment Source
Aircraft
Shipbuilding
Semi-conductors
PV
Wind turbines
19%
10-15%
20%
20-35%
4-12%
Original work by Wright in aircraft
manufacturing confirmed by Archian, 1950 and
Benkard, 2000
Stump 2012 & Smallman 2011 with variations
by type of work: 5-25%
Irwin 1996, dependant on low process losses
Margolis, 2002 wide range of values depending
on degree of investment in automation
NEEDS 2006, depending on scale
Chen & Goldberg
[19] Appendix A
Man-time learning
Gas pipelines
Gas turbines
Coal Power
GTCC
Wind
Ethanol Prod.
Solar PV module
4-24%
10%
8%
26%
17%
20%
20%
Zhao, 1999 onshore & offshore in US to 1997
MacGregor, 1991 world-wide to 1980
Kouvaritakis, 2001 OECD to 1993
Claeson, 1997 world-wide to 1997
Kovaritakis, 2001 OECD to 1995
Goldemberg, 1996 Brazil
Harmon, 2000 world-wide to 1998.
McDonald &
Schrattenholzer
[20] pg. 257
Learning rates on
overall cost, they
include all times of
improvement
7
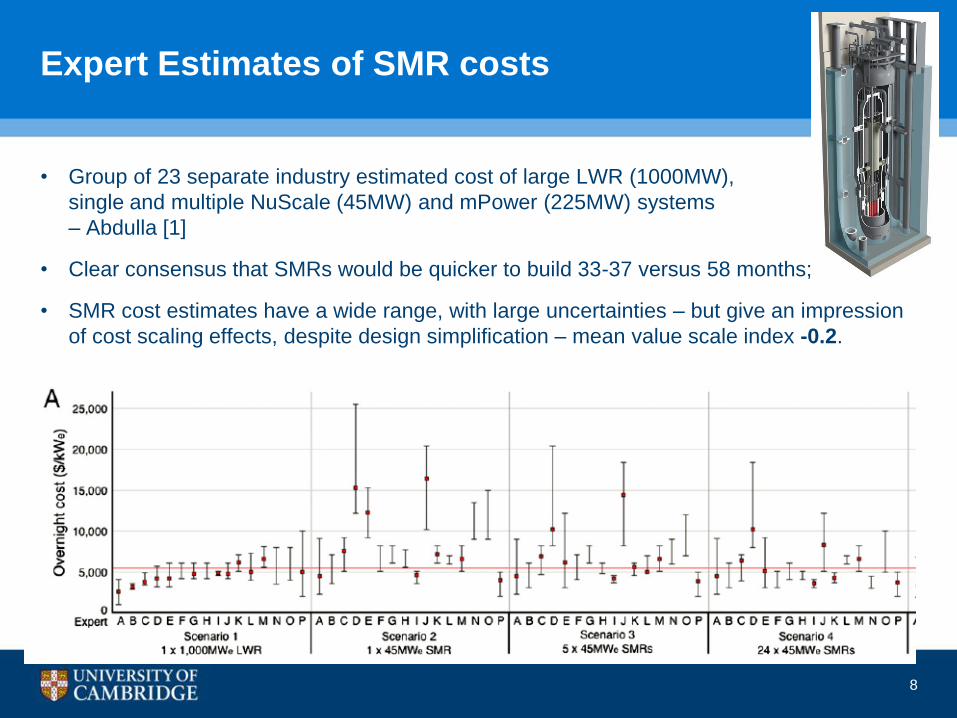
Expert Estimates of SMR costs
• Group of 23 separate industry estimated cost of large LWR (1000MW),
single and multiple NuScale (45MW) and mPower (225MW) systems
– Abdulla [1]
• Clear consensus that SMRs would be quicker to build 33-37 versus 58 months;
• SMR cost estimates have a wide range, with large uncertainties – but give an impression
of cost scaling effects, despite design simplification – mean value scale index -0.2.
8
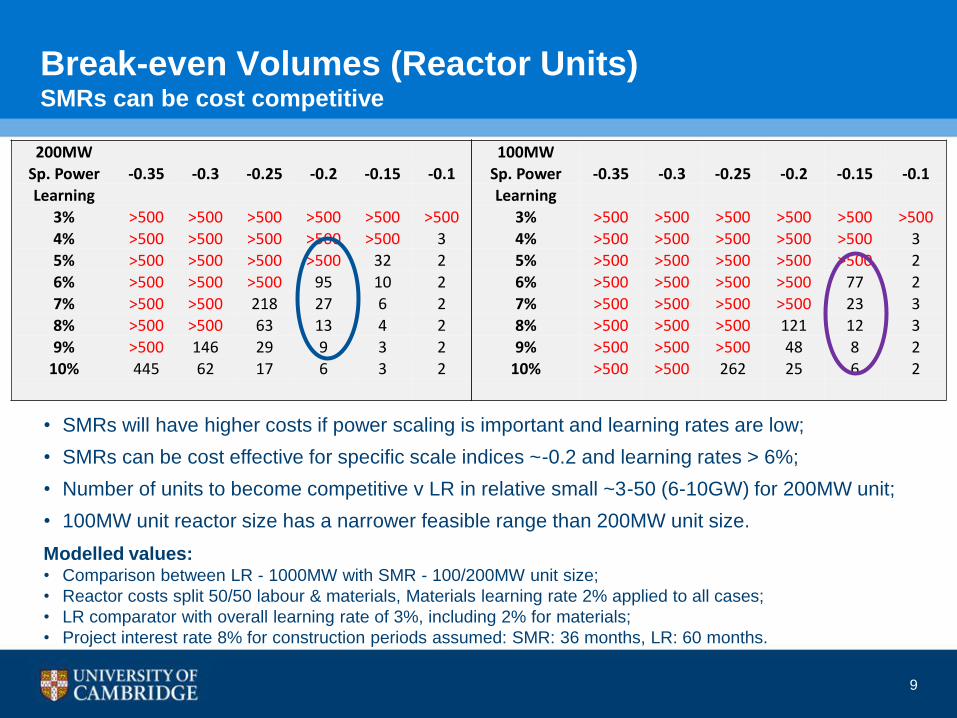
Break-even Volumes (Reactor Units) SMRs can be cost competitive
9
Modelled values: • Comparison between LR - 1000MW with SMR - 100/200MW unit size;
• Reactor costs split 50/50 labour & materials, Materials learning rate 2% applied to all cases;
• LR comparator with overall learning rate of 3%, including 2% for materials;
• Project interest rate 8% for construction periods assumed: SMR: 36 months, LR: 60 months.
100MW
Sp. Power -0.35 -0.3 -0.25 -0.2 -0.15 -0.1
Learning
3% >500 >500 >500 >500 >500 >500
4% >500 >500 >500 >500 >500 3
5% >500 >500 >500 >500 >500 2
6% >500 >500 >500 >500 77 2
7% >500 >500 >500 >500 23 3
8% >500 >500 >500 121 12 3
9% >500 >500 >500 48 8 2
10% >500 >500 262 25 6 2
200MW
Sp. Power -0.35 -0.3 -0.25 -0.2 -0.15 -0.1
Learning
3% >500 >500 >500 >500 >500 >500
4% >500 >500 >500 >500 >500 3
5% >500 >500 >500 >500 32 2
6% >500 >500 >500 95 10 2
7% >500 >500 218 27 6 2
8% >500 >500 63 13 4 2
9% >500 146 29 9 3 2
10% 445 62 17 6 3 2
• SMRs will have higher costs if power scaling is important and learning rates are low;
• SMRs can be cost effective for specific scale indices ~-0.2 and learning rates > 6%;
• Number of units to become competitive v LR in relative small ~3-50 (6-10GW) for 200MW unit;
• 100MW unit reactor size has a narrower feasible range than 200MW unit size.
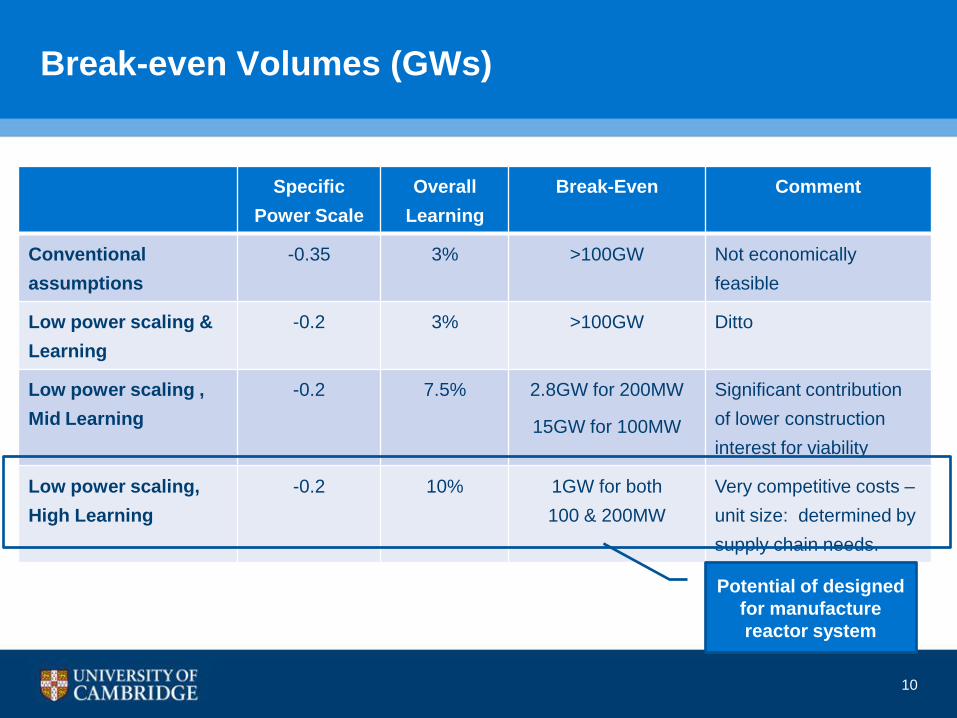
Break-even Volumes (GWs)
Specific
Power Scale
Overall
Learning
Break-Even Comment
Conventional
assumptions
-0.35 3% >100GW Not economically
feasible
Low power scaling &
Learning
-0.2 3% >100GW Ditto
Low power scaling ,
Mid Learning
-0.2 7.5% 2.8GW for 200MW
15GW for 100MW
Significant contribution
of lower construction
interest for viability
Low power scaling,
High Learning
-0.2 10% 1GW for both
100 & 200MW
Very competitive costs –
unit size: determined by
supply chain needs.
10
Potential of designed
for manufacture
reactor system

Conditions for Cost Competitive SMRs
Scaling:
• Simplify the design, less components, less systems;
• Operate within current LWR & steam technology understanding, not at the edge;
• Design plant for manufacture, not construction: whole plant and systems, not just the reactor
vessels and components.
• One design that can accommodate most of world’s requirements – a global standard 50/60 Hz
• Alignment of design certification standards, with a level stability of regulation.
Learning:
• Design for factory manufacture and site assembly - whole plant and all systems;
• Detailed design for manufacture done with global suppliers/partners;
• Manufacturing engineering, jigs, tools and fixtures as part of development;
• Launch and forward order profile that support a minimum supply chain ‘drum beat’;
• Global supply chain that ensures ‘learning by doing’ – 10 per year minimum?
Optimum unit will be the simplest 11
Are these the skills of low volume manufacturing rather than construction?
ACP100
References
1. Abdullah et al. Expert assessment of the cost of LWR SMR. Carnegie Mellon, PNAS 2013
2. OECD Reduction in capital costs of nuclear power plants 2000
3. Carelli MD. Economic features of integral, modular, small to medium-sized reactors.
Progress in Nuclear Energy 52 (2010) 403-414.
4. Bowers H I et al. Trends in nuclear power plant capital investment costs,
A2 Summary of literature review. ORNL/TM 8898.1983
5. Woite G Capital Investment Cost of NPPs. IAEA Bulletin, vol. 20, No.1 February 1978
6. OECD/NEA. Kuznetsov & Lokhov. Current status, technical feasibility and economics of Small Nuclear
Reactors June 2011
7. Ramana MV. Nuclear Power; Economics, Safety & Environment Issues of Near-term Technologies.
Annual Rev Env Resource 34, 127-152 2009
8. Mooz WE. Cost Analysis of LWR power plants in US. DoE R-2304 1978
9. Goldberg & Touw. Statistical methods for learning curves & cost analysis. CIM D0006870.A3 2003
10. Grubler A. The cost of nuclear scale-up: a case of negative learning by doing.
Energy Policy 38(2010) 5174-5188
12
References
11. Cantor & Hewlett. Economics of Nuclear. Power Resources & Energy. 10 315-335 NH 1988
12. University of Chicago. Economic Future of Nuclear Power. Chap pg. 4-24 August 2004
13. The cost of the nuclear power sector. Cour de Compte Jan 2012 pg. 22-23
14. Rangel & Levesque. Revisiting the cost escalation curse of Nuclear Power – French Exp. 2012
15. Marshall & Navarro. Cost of nuclear power construction - New evidence from Japan. RAND Journal
Economics Vol. 22-1 1991
16. Hunt SE. Fission, Fusion and The Energy. Fig 29 & Pg. 72 Elsevier 1980
17. Thomas SD. The realities of Nuclear Power. Pg. 185 Cambridge 1988 McKerron G. Nuclear Costs – Why
do they keep rising? Energy Policy July 1992
18. Goldberg & Rosner, SMR Key to Future of Nuclear Generation in US. U of Chicago. EPIC 2011
19. Chen & Goldberg. Small Modular Nuclear Reactors: Parametric Modelling of Integrated RV Manufacture.
Detailed Analysis Vol. 2 ANL 2013.
20. McDonald & Schrattenholzer. Learning rates for energy technologies. En Policy 29 255-261 2001
13