one corporate fundamental and two transaction...
TRANSCRIPT

1
Preliminary version; please do not circulate
One Corporate Fundamental and Two Transaction Taxes:
When Does “Sand in the Wheel” Reduce Financial Price Volatilities?
Yongheng Deng (NUS)
Xin Liu (NUS)
Shang-Jin Wei (Columbia, CEPR, and NBER)
Preliminary version: Oct 2013
Abstract
As the existing literature on the effects of transaction tax on financial price volatility is
characterized by ambiguity and contradictory results, this paper re-examines the question
by using a design that has a cleaner control for counterfactuals. In particular, we examine
the universe of 53 Chinese companies that are simultaneously listed in two stock
exchanges in Hong Kong and Mainland China. While arbitrage is limited by binding
capital controls, the underlying corporate fundamentals are identical for the twin shares in
the two stock exchanges. More importantly, Mainland China implemented seven discrete
and sizable changes to the stamp duties in 1997-2008 that do not directly affect trading in
Hong Kong. In contrast to Jones and Seguin (1997), we find a significantly negative
relation between stamp duty increase and price volatility. However, this average effect
masks some interesting heterogeneity. In particular, in later periods where institutional
investors have become a more significant part of traders’ pool or for stocks with a
relatively significant share of institutional ownership, we find an opposite effect for a
change in stamp duties. This suggests that the effect of transaction taxes depends crucial
on the relative importance of institutional versus retail traders.

2
3
1. Introduction
One of the Economics Nobel Prize recipients in 2013 is known for his pioneering
work that questions whether financial prices are excessively volatile. The possibility of
excessive volatility has motivated some to advocate the use of a transaction cost to
dampen short-term speculation and to reduce such volatility. Prominent proponents of
such an approach include Tobin (1978, 1984), Stiglitz (1989), and Summers and
Summers (1989). In contrast, opponents argue that security transaction taxes (STT) could
discourage fundamental-based traders more than they do noise traders, resulting in higher,
not lower, volatility in the financial market (e.g. Grundfest (1990), Grundfest and Shoven
(1991), and Kupiec (1996)). Interestingly, a large number of papers that have investigated
this question have not resolved this debate because some find a negative effect while
others find an opposite effect, and the conclusions do not appear tol be converging in
more recent publications.
One of the empirical challenges is to have a proper counterfactual: what would have
happened to the price volatility had the transaction tax not changed? Most papers use a
treatment and a control group, but cannot definitively rule out the possibility that the
control group differs from the treatment group in some systematic way that makes it not a
suitable counterfactual.
We study this topic by looking at price volatilities for Chinese companies that are
simultaneously listed in Hong Kong and Mainland China. There are referred to as H-
shares and A-shares, respectively. A few features of this set of cross-listings make them
especially suitable for our purpose. First, the A and H shares of a company have identical
cash flow and voting rights. So they have identical underlying corporate fundamentals. At

4
the same time, the Hong Kong and Mainland stock exchanges are legally segmented by
China’s massive and binding capital controls. Chinese residents can legally only trade in
A shares, whereas Hong Kong and foreign residents can legally only trade in H shares.
An evidence of market segmentation (or difficulty in arbitraging between the two markets)
is the gap in the A and H prices of the same companies. Second, during our sample of
1993-2012, investors in the two markets face very different stamp duties (transaction
costs) in terms of both levels and changes. For example, in 1997, while H-share investors
faced a stamp duty of 0.3%, A-share investors faced a stamp duty of 1%, or more than 3
times higher. More importantly for our empirical identification, A-share investors
experienced seven large and discrete adjustments in stamp duty during the sample period1,
while H-share investors experienced only negligible changes in the stamp duty. The
evolution of the stamp duties in the two markets is presented in Figure 1.
We exploit these features and study how a change in the stamp duty in the A-share
market (with no corresponding change in the H-share market) affects the stock price
volatility in the A-share market (relative to that of the H-share market). The counter-
factual for an A-share volatility in the absence of a change in the transaction cost in the
A-share market is the corresponding H-share volatility (or its linear transformation). This
is a natural counter-factual because the corporate fundamentals underlying an H-share are
literally the same as those for its corresponding A-share except for market segmentation.
In comparison, the counterfactuals in existing empirical literature are only a “similar”
portfolio of stocks to the one in treatment. For example, in Jones and Seguin (1997),
while the treatment group is a portfolio of stocks on the NYSE/AMEX, the control group
1 There were three more changes in the stamp duties in the A-share market before 1993. However, since the
first cross-listed Chinese stock (Tsingtao Brewery) only emerged on August 27, 1993, we have to exclude
these events by our difference-in-differences research design.

5
is a portfolio of stocks on NASDAQ. In this sense, our counterfactual is cleaner than all
others in the existing empirical literature.
It is useful to bear in mind two important institutional features about the Chinese stock
market. First, as the Shenzhen and Shanghai Stock Exchanges were only established in
1990 and 1991, virtually all investors in China have an extremely short history of trading,
and most lack basic knowledge about finance, accounting or economics. Second, at least
up to 2006, because mutual funds, pension funds, and other institutional investors were
either non-existent or too few to be significant, trading in the Chinese stock market was
overwhelmingly dominated by retail investors. If a transaction costs can reduce
unnecessary price volatility by discouraging noise trading, the effect has a better chance
to materialize than in perhaps most other security markets studied in the existing
empirical literature. In this sense, the study of the Chinese market can provide unique
value added to this literature.
The microstructure literature, such as De Long et al (1990), suggests that the fraction
of “noise trader” to “informed trader” affects the process of price discovery and the noise
to signal ratio. Uninformative trading by noise traders moves security price away from its
intrinsic value and generates excessive volatility which is the essential goal of STT to
tackle. In contrast, trading by informed traders contributes to price discovery, which in
turn lowers price volatility. Therefore, when a STT is imposed on the market, both
fundamental-based and non-fundamental-based traders would be discouraged from
trading. However, their reductions in transaction have opposite implications on price
volatility. What we observe in reality reflects the net effect of the two competing effects.
6
For this reason, we will also examine the role of institutional share in affecting results
on price volatility. Following many studies which point out that institutional investors are
fundamental-based rational traders, we use institutional ownership to proxy for the
fraction of fundamental-based trader. As a matter of fact, comparing to developed market,
the Chinese financial market is dominated by retail investors. In fact, in Jones and Seguin
(1997), their findings are based on an event in 1975 when the institutional ownership in
US stock market was about 22%, a level that China did not reach until 2009.
There are two key findings in the paper. First, pooling over the seven discrete changes
in stamp duties, we find a negative relationship between transaction tax and price
volatility, opposite to the influential papers by Jones and Seguin (1997) and Umlauf
(1993). Our findings of a lower price volatility in higher transaction tax regimes are
consistent and robust in various forms of firm and portfolio level estimations. We
interpreted it as evidence that a Tobin tax may achieve its intended objective in an
immature market where retail investors dominate. However, this is not the end of the
story. Second, we find that, with a significant presence of institutional investors, the
effect of a higher transaction cost is reversed. For example, for the two most recent
changes in transaction costs (a decrease in April, 2008, and another decrease in
September 2008) when the share of institutional ownership in Chinese stocks was closer
to the level in the United States in the early 1970s, transaction costs and price volatility
are positively related. Also, across individual stocks, transaction costs and price volatility
are more likely to be positively related for stocks with a relatively high institutional
trading but negatively related for stocks with relatively low or no institutional trading.
These findings are only suggestive evidence at this point. If this holds up to further
7
scrutiny when more data becomes available, it might provide a way to reconcile
seemingly contradictory findings in the existing empirical literature.
The rest of the paper is organized as follows. Section 2 supplies some background
information. . Section 3 describes the data and descriptive statistics. Section 4 provides
the statistical analysis. Section 6 concludes.
2. Background Information
In this section, we provide two types of background information, First, we briefly
review the existing empirical literature, highlighting the design of control and treatment
groups as well as the main findings. We then present some basic background about the
Chinese and Hong Kong stock exchanges and the seven discrete events of stamp duty
changes in Mainland China.
2.1 Existing empirical literature
Our study with unique A-H twin shares as treatment-control pairs contributes to the
literature with an improved understanding of the Tobin tax. Only a few studies find
empirical evidence supporting the proponent’s view of STT. Liu and Zhu (2009) find that
commission deregulation in Japan is associated with a statistically and economically
significant increase in price volatility, which suggests that imposing higher transaction
costs might be feasible to stabilize the market by curbing short-term noise trading. Hanke
et al (2010) also show evidence to support that a Tobin tax would reduce speculative
trading. However, neither study uses a control group that can be said to be the same
8
as the treatment group. Our study provides additional empirical evidence to support the
advocates of Tobin tax.
Moreover, since more studies2 find the opposite effect of STT on price volatility, this
paper contributes to the literature by providing a potential explanation for the
inconsistencies in empirical evidences. Umlauf (1993) studies the volatility impact of the
inception and increase of Swedish tax and finds that volatility significantly increased in
response to the introduction of taxes although stock price levels and turnover declined.
Jones and Seguin (1997) find consistent results with Umlauf (1993) that a reduction in
transaction costs is associated with a decline in stock return volatility. They argue that
increasing the costs of trading through transaction taxes, increasing margin requirements,
or reducing the availability of low-cost substitutes like equity futures may in fact
encourage, rather than reduce the impact of noise traders and volatility. In addition,
findings of no significant impact of STT on market volatility cast doubt on STT as an
effective policy instrument. Roll (1989) uses the cross-country data to study the matter
and finds that transaction taxes are inversely but insignificantly correlated with market
volatility. Hu (1998) finds with Asian market data that increases in STT reduce the stock
price, but have no significant impact on price volatility or turnover.
Lastly, our study has broad implications for other security classes. Several researchers
study the question with the housing market instead. Fu et al (2012) use the Singapore
housing market and show that prices become less informative and volatility significantly
increases in the affected market following the transaction tax increase. Sheffrin and
Turner (2001) find a capital gains tax with full loss offset at ordinary tax rates would
2 See e.g. Hau (2006), Habemeier and Kirilenko (2001), Lanne and Vesala (2010), Aliber, Chowdhry, and
Yan (2002), Chuo and Wang (2006), Green, Maggioni and Murinde (2000), Atkins and Dyl (1997), and
Westerhold (2003), Baltagi et al (2006), and Phylakti and Aristidou (2007)

9
generate a benefit to households by reducing the volatility of housing returns; however,
the effect on the rate of return exceeds the benefits of volatility reduction. Aregger et al
(2012) show that transaction taxes have no impact on house price growth based on
evidence from the variation of tax rates across Swiss cantons, while capital gains taxes
exacerbate house price dynamics.
2.2 Stamp Duties in the Chinese Stock Market
The history of the stock trading stamp duty in China goes back to the early 90s, shortly
after the establishment of Shanghai Stock Exchange (SSE) and Shenzhen Stock
Exchange (SZSE). The stock trading stamp duty was first introduced on Shenzhen Stock
Exchange on June 28, 1990. While there were three adjustments in the duty during 1990-
1992, there were no cross listed stocks at the time. So these adjustments are not part of
our sample.
The stamp duty is regarded by the government as a revenue-generating tool as much
as an instrument to reduce price volatility. After 1992, the year in which China Securities
Regulatory Commission (CSRC) was established, a surge in the stock market transaction
volume made stamp duty a noticeable source of revenue. While at the beginning, the
revenue was shared 50-50 between the central government and local governments, the
sharing rule has been adjusted a few times, progressively more in favor of the central
government. After 2002, 97% of the stamp duty revenue has been accrued to the central
government. The dominance of the revenue consideration makes it plausible that
adjustments in the stamp duty are not an endogenous response to changes in stock price
volatility. (Conversations with a former CEO of the Shanghai Stock Exchange also

10
suggest to us that adjustments in stamp duties are not made to alter price volatility. The
former CEO states that the stock exchange always advocates for a low stamp duty to
minimize transaction costs, and their policy advocacy sometimes but not always carries
the day when the overall index is low, but periodically the Ministry of Finance would
decide to raise the duty.)
As shown in Table 1, China experienced seven adjustments in stock trading stamp
duty during the sample period. After an increase in stamp duty in 1997, the duty was
adjusted downwards stamp between 1998 and 2007, but raised in 2007, before two more
downwards adjustments in 2008.
The historical stamp duty adjustments in Hong Kong Stock Exchange (HKEX) are
also reported in table 1. Not only the level of the stamp duty in Hong Kong is low, the
magnitudes of the adjustments are also substantially smaller when compared to the A-
share market. In any case, the duty stays at a low constant level of 1‰ of transaction
value for buyer and seller after 2001. In our statistical analysis, we will ignore the
adjustments in the stamp duties in Hong Kong. (In an appendix table, we will perform a
robustness check that accounts for the duty adjustments in the Hong Kong market.)
2.3 A short history of institutional investors in China
The Chinese stock market, for much of its 30-plus-year history, is known to be
dominated by retail investors. Figure 2 provides a graphical illustration of evolution of
institutional investors in China based on the quarterly institutional holding information
from the WIND database. First, figure 2a shows the time series of outstanding
institutional investors in the Chinese domestic stock market. Next, figure 2b shows the

11
share of institutional holding as of the entire A-share market based on market
capitalization over the years. In 1975, the year of the sample used in Jones and Seguin
(1997), the share of institutional holding in the United States reached 22%. China did not
reach this level until 2008. (Both the number of institutional investors and the share of
institutional holding have exploded since 2008, though the stamp duty in the A-share
market stays at a low level of 0.1% set in September 2008.)
It is convenient to think of the history of Chinese institutional investors in three stages.
First, in the early stage between 1990 and 1997, the financial market is overwhelmingly
populated by retail investors, whereas institutional investors were negligible both in
numbers and in trading volume. The second stage - emerging stage from 1998 to 2005,
when mutual funds and insurance companies, though very few pension funds or hedge
funds, began to emerge in the Chinese stock market. Finally, since 2006, a growth stage
sets in when institutional investors have grown at a high speed, eventually catching up
with the US level by 2012 in terms of its relative importance in both trading and
shareholding.
3. Empirical Results
3.1 Data
There are seven discrete changes in the stamp duties in the Chinese market during our
sample period of 2004-2009, which constitute our events3. They are both listed in Table 1
and graphed in Figure 1. While there are also independent changes in the stamp duties in
3 There were also adjustments in stamp duties in Shenzhen Stock Exchanges in 1990 and 1991. Since there
were no cross-listed firms at these times, they are not part of our sample. During our sample, the stamp
duties are set jointly by the Ministry of Finance and the China Securities Regulatory Commission, and
always common to both Shanghai and Shenzhen Stock Exchanges.

12
Hong Kong, the changes are negligibly small when compared to the changes in the
Mainland. The comparison can be most clearly seen in Figure 1. In this paper, we will
ignore stamp duty changes in Hong Kong. Because the changes in Hong Kong are not
systematically related to those in the Mainland (and are very small in magnitude anyway),
they mainly add noise to our inferences.
Our sample of stocks consists of the universe of 53 Chinese companies that are cross-
listed in both Mainland China and Hong Kong and have unbroken daily closing price data
for 12 months before and 12 months after at least one of the stamp duty events. Because
the last stamp duty event took place in September 2008, stocks that become cross-listed
after 2008 do not make into our sample. Appendix 1 provides a list of these companies in
the sample and their IPO dates on both stock exchanges, sorted by the date they first
became cross-listed.
Because the number of cross-listed stocks increases gradually during the sample
period, the total number of unique firm-event observations is 223, less than 7 x 53. Daily
information of A- and H-share stocks comes from China Securities Market and
Accounting Research Database (CSMAR), Reuter Datastream and Pacific Basin Capital
Market Database (PACAP).
The summary statistics of our sample is reported in table 2. In panel A, we first show
the mean and median of sample firms’ financial characteristics. Firm financials are
obtained from CSMAR, which reflects the values of the latest annual filing prior to each
event. However, since same firm could enter into our sample for multiple times due to
adjacent events, duplicated observations are eliminated to avoid biases from multiple-

13
counting. The average size of a firm in our sample measured by total asset is RMB350
billion, while the median is about RMB15 billion. The mean and median of annual
revenue are about RMB58 billion and RMB10 billion respectively. On average,
EBIT/sales is 9.7% and annual sales growth is about 17.4%. In addition, the sample firms
have relative low leverage measured by long term debt to total asset at an average of 8.8%
and average cash to total asset is about 11.5%.
Panel B provides the stock characteristics of A- and H-shares in our sample
respectively. Average market capitalization of A-share in our sample is RMB121billion,
while the corresponding value of H-share is about RMB40 billion4, suggesting that
domestic A-share serves as the primary market for these Chinese firms. It is easy to see
that the capital controls that produce the segmentation of the Hong Kong and China stock
markets are binding: H-share stocks see a 50% discount in stock price relative to the A-
share stocks. Although daily transaction volume, return and price volatility are
comparable, A-share is more liquid as suggested by Amihud illiquidity ratio.
In panel C, we also provide the statistics of institutional holding of our sample A-shares
in the latest quarter prior to stamp duty changes. The average fraction held by
institutional investors of the market capitalization of tradable shares is about 20%, while
the average quarterly change in institutional holding is about 9% in our sample. In
addition, on average, our sample firms have 24 institutional investors, while the median is
9.
3.2 Price Response to Stamp Duty Changes
We start with examining the short-term price response of cross-listed A-H shares
around stamp duty changes. As Schwert and Seguin (1993) points out, increases in STT
4 We convert the HKD to RMB with historical daily exchange rate at each trading date.
14
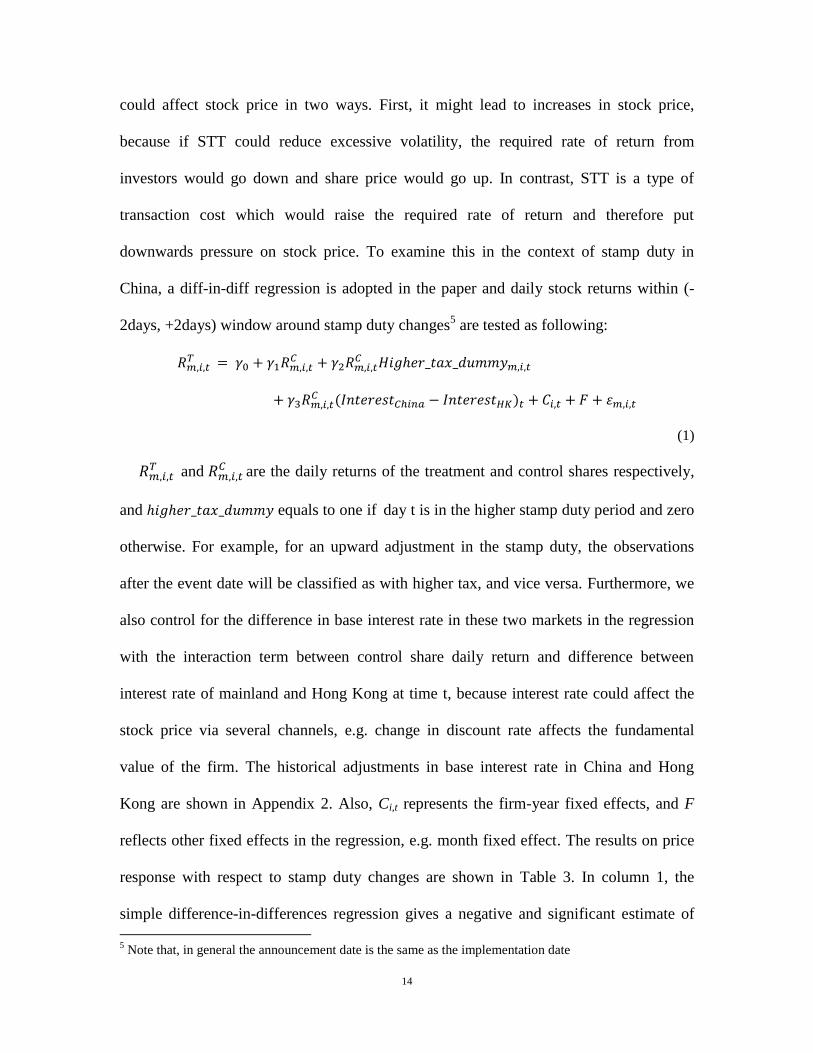
could affect stock price in two ways. First, it might lead to increases in stock price,
because if STT could reduce excessive volatility, the required rate of return from
investors would go down and share price would go up. In contrast, STT is a type of
transaction cost which would raise the required rate of return and therefore put
downwards pressure on stock price. To examine this in the context of stamp duty in
China, a diff-in-diff regression is adopted in the paper and daily stock returns within (-
2days, +2days) window around stamp duty changes5 are tested as following:
(1)
and
are the daily returns of the treatment and control shares respectively,
and equals to one if day t is in the higher stamp duty period and zero
otherwise. For example, for an upward adjustment in the stamp duty, the observations
after the event date will be classified as with higher tax, and vice versa. Furthermore, we
also control for the difference in base interest rate in these two markets in the regression
with the interaction term between control share daily return and difference between
interest rate of mainland and Hong Kong at time t, because interest rate could affect the
stock price via several channels, e.g. change in discount rate affects the fundamental
value of the firm. The historical adjustments in base interest rate in China and Hong
Kong are shown in Appendix 2. Also, Ci,t represents the firm-year fixed effects, and F
reflects other fixed effects in the regression, e.g. month fixed effect. The results on price
response with respect to stamp duty changes are shown in Table 3. In column 1, the
simple difference-in-differences regression gives a negative and significant estimate of
5 Note that, in general the announcement date is the same as the implementation date

15
the interaction term between H-share return and higher tax dummy, suggesting a short-
term return reduction about 64% (=0.5491*0.07%/0.06%) in high tax regime. When
incorporating interest rate difference between the two markets into the model, similar
results are obtained as shown in column 2. The coefficient on the interaction term
between H-share return and interest rate difference is negative and significant. In other
words, if the A-share market has a high interest rate, the required rate of return would be
higher and stock price would be lower, which is reflected in the realized return.
In order to mitigate any potential bias due to outliers, we further conduct subsample
analyses by eliminating potential outlier stocks. In column 3 and 4, observations with A-
share price over H-share price exceeding 95th
and 90th
percentile of the sample are
dropped in the regression,. Overall, consistent results are found both in full sample and
subsamples, suggesting a significant negative impact of STT on short-term stock return.
3.3 Average Effect on Price Volatility
Firm level price volatility
In this sub-section, we examine the effect of stamp duty changes on price volatility.
For event m, the treatment group consists of A-share stocks in our sample, while the
control group includes their corresponding H-share stocks. We follow Jones and Seguin
(1997) to run the following model:
, (2)
16
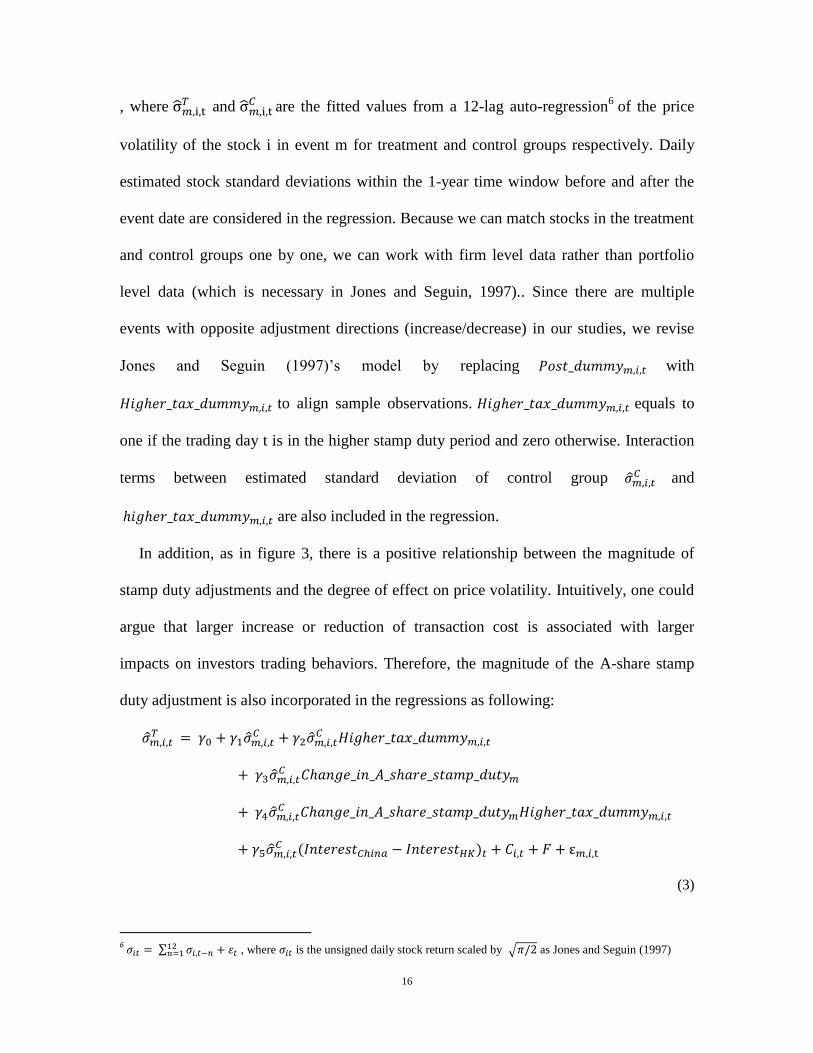
, where and
are the fitted values from a 12-lag auto-regression6 of the price
volatility of the stock i in event m for treatment and control groups respectively. Daily
estimated stock standard deviations within the 1-year time window before and after the
event date are considered in the regression. Because we can match stocks in the treatment
and control groups one by one, we can work with firm level data rather than portfolio
level data (which is necessary in Jones and Seguin, 1997).. Since there are multiple
events with opposite adjustment directions (increase/decrease) in our studies, we revise
Jones and Seguin (1997)’s model by replacing with
to align sample observations. equals to
one if the trading day t is in the higher stamp duty period and zero otherwise. Interaction
terms between estimated standard deviation of control group and
are also included in the regression.
In addition, as in figure 3, there is a positive relationship between the magnitude of
stamp duty adjustments and the degree of effect on price volatility. Intuitively, one could
argue that larger increase or reduction of transaction cost is associated with larger
impacts on investors trading behaviors. Therefore, the magnitude of the A-share stamp
duty adjustment is also incorporated in the regressions as following:
(3)
6 ∑
, where is the unsigned daily stock return scaled by √ as Jones and Seguin (1997)

17
, where refers to the absolute magnitude of A-share
stamp duty change in event m. Interaction term of H-share price volatility and difference
in base interest rate between China and Hong Kong are also incorporated in the
estimation, while firm-year and month fixed effects are controlled. Robust standard errors
adjusted for heteroskedasticity are clustered at firm level in our regression estimations.
The results of diff-in-diff regressions are reported in table 4. Column 1 shows the
regression result followed equation (2). The price volatility of H-share stocks is
positively and significantly correlated with A-share stocks, reflecting the effectiveness of
control. The negative and significant coefficient of the interaction term between H-share
price volatility and suggests that, on average, increases in stamp duty
result in a reduction in price volatility. From Table 2, we know that the average daily
price volatility in the A-share market is 0.0310, whereas that in the H-share market is
0.0332. A typical increase in the stamp duty in the sample (by 0.2%) would reduce the A-
share volatility by about 2% (= 0.0198 x 0.0332/0.0310). So the effect is economically
moderate even though it is statistically significant. To put it another way, it would take a
much bigger increase in the stamp duty than actually practiced in China and other
countries to induce an economically large reduction in price volatility.
In addition, unlike the negative coefficient in the estimation of stock return, the
interaction term between H-share price volatility and the difference in the interest rates in
the two markets is positive and significant, indicating the higher interest rate in mainland
relative to Hong Kong, the higher the portion of price volatility of the A-shares is linked
to the price volatility of H-share.
18
In column 2 of table 4, we further incorporate the magnitude of A-share stamp duty
changes into the regressions followed equation (3). However, the results show that the
triple interaction term is insignificant. As there is only a small number of stamp duty
changes, there may not be enough statistical power to detect the effect of the size of a
stamp duty change.
To ensure that the results are not driven by outlier stocks, we also perform a regression
in a subsample where we exclude those stocks whose A share price premium over H
share exceeds the 95th
and 90th
percentiles. The results are reported in Column 3 and 4 of
Table 4. The coefficient on the interaction between a higher tax dummy and the H-share
volatility is still negative and statistically significant. The point estimate is modestly
bigger in absolute term. In other words, by excluding potential outlier stocks, the effect of
a higher transaction tax on volatility becomes somewhat bigger, but still economically
modest.
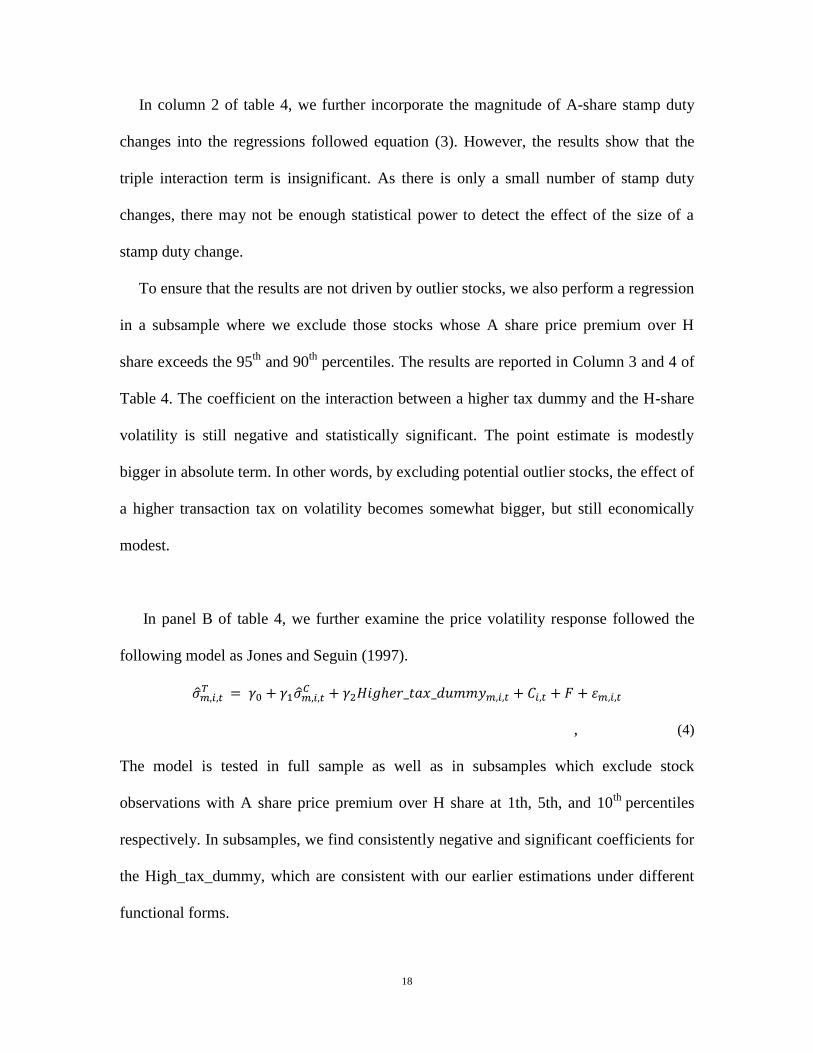
In panel B of table 4, we further examine the price volatility response followed the
following model as Jones and Seguin (1997).
, (4)
The model is tested in full sample as well as in subsamples which exclude stock
observations with A share price premium over H share at 1th, 5th, and 10th
percentiles
respectively. In subsamples, we find consistently negative and significant coefficients for
the High_tax_dummy, which are consistent with our earlier estimations under different
functional forms.

19
3.4 Additional Robustness Checks
Additional robustness checks are conducted and shown in table 5. First, we re-estimate
our sample by dividing it into two subgroups based on the direction of the stamp duty
changes. This enables us to capture any asymmetric effect of stamp duty changes. We
report the results with the subsample of stamp duty increases in the first column, and
those with stamp duties decreases in the second column. The coefficients on the
interaction between a dummy for higher tax regime and H-share volatility are negative
and statistically significant. A formal t-test does not reject the null that the two
coefficients are the same. Interestingly, the point estimates are 50% larger than that in
Column 1 of Table 4. Of course, one important difference between these regressions and
the on in Column 1 of Table 4 is that they do not impose the restrictions that the
coefficients on the large number of fixed effects as well as those on H-share volatility are
the same between the two subsamples.
Recognizing that firms in the financial service sector and the utility sector may be
different from other manufacturing firms, we also perform a regression for a subsample
that excludes financial and utility firms. The result is reported in Column 3 of Panel A of
Table 5. This does not change the basic pattern that a higher transaction cost is associated
with a lower price volatility; the magnitude is statistically significant but economically
modest.
The validity of an event study approach depends on the maintained assumption that
the event in question – a change in the stamp duty in our case – is the only major event
during the event window. To gain additional confidence, we manually check for each
20
sample firm in the CSMAR database on event disclosure for any significant event around
each event date. Several companies underwent a reform where previously non-traded
shares were converted to tradable during 2005-2008. Some of the conversions were close
to our event dates. In Column 4, Panel A of Table 5, we re-estimate the model for the
subsample of firms without any key events recorded in CASMAR/Factiva/Bloomberg
over the event windows. Reassuringly, we find qualitatively similar results as the full
sample.
In panel B of table 5, we divide the firms into two subsamples of high and low
volatility (based on A-share volatility relative to the sample mean), and re-estimate the
model. In both subsamples, a higher transaction cost is associated with a lower price
volatility, but the effect is stronger for the high-volatility subsample.
Taken together, our findings suggest that price volatility of treatment A-shares relative
to control H-shares is lower in high stamp tax regime and the results are robust in various
subsamples. We interpret our findings as evidence to support the advocates’ view on
Tobin tax and argue that in China context, on average, stamp duty does have a positive
effect on curbing speculation and reducing excessive volatility. At the same time, we find
that the economic effect of a change in stamp duties is relatively modest. Given that the
changes in the size of the stamp duty in China are already on the high side when
compared to other countries’ practices, we conclude that an increase in the transaction
cost can only modestly reduce the price volatility.
Events such as adjustments in required reserve capital rate (Appendix 3) and
commission fee (Appendix 4), which could potentially affect the price volatility, are also
checked and consistent results are found.
21
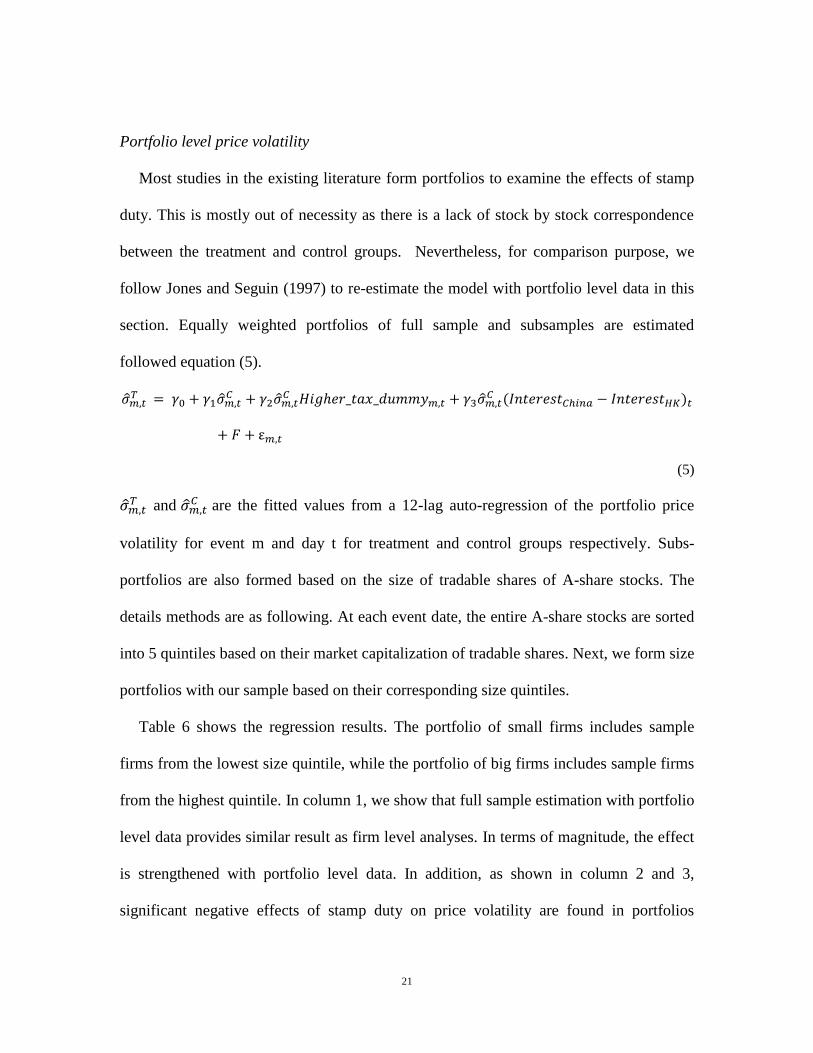
Portfolio level price volatility
Most studies in the existing literature form portfolios to examine the effects of stamp
duty. This is mostly out of necessity as there is a lack of stock by stock correspondence
between the treatment and control groups. Nevertheless, for comparison purpose, we
follow Jones and Seguin (1997) to re-estimate the model with portfolio level data in this
section. Equally weighted portfolios of full sample and subsamples are estimated
followed equation (5).
(5)
and
are the fitted values from a 12-lag auto-regression of the portfolio price
volatility for event m and day t for treatment and control groups respectively. Subs-
portfolios are also formed based on the size of tradable shares of A-share stocks. The
details methods are as following. At each event date, the entire A-share stocks are sorted
into 5 quintiles based on their market capitalization of tradable shares. Next, we form size
portfolios with our sample based on their corresponding size quintiles.
Table 6 shows the regression results. The portfolio of small firms includes sample
firms from the lowest size quintile, while the portfolio of big firms includes sample firms
from the highest quintile. In column 1, we show that full sample estimation with portfolio
level data provides similar result as firm level analyses. In terms of magnitude, the effect
is strengthened with portfolio level data. In addition, as shown in column 2 and 3,
significant negative effects of stamp duty on price volatility are found in portfolios
22
constructed with small and large firms respectively. In unreported analysis, we form
value weighted portfolios and find similar results.
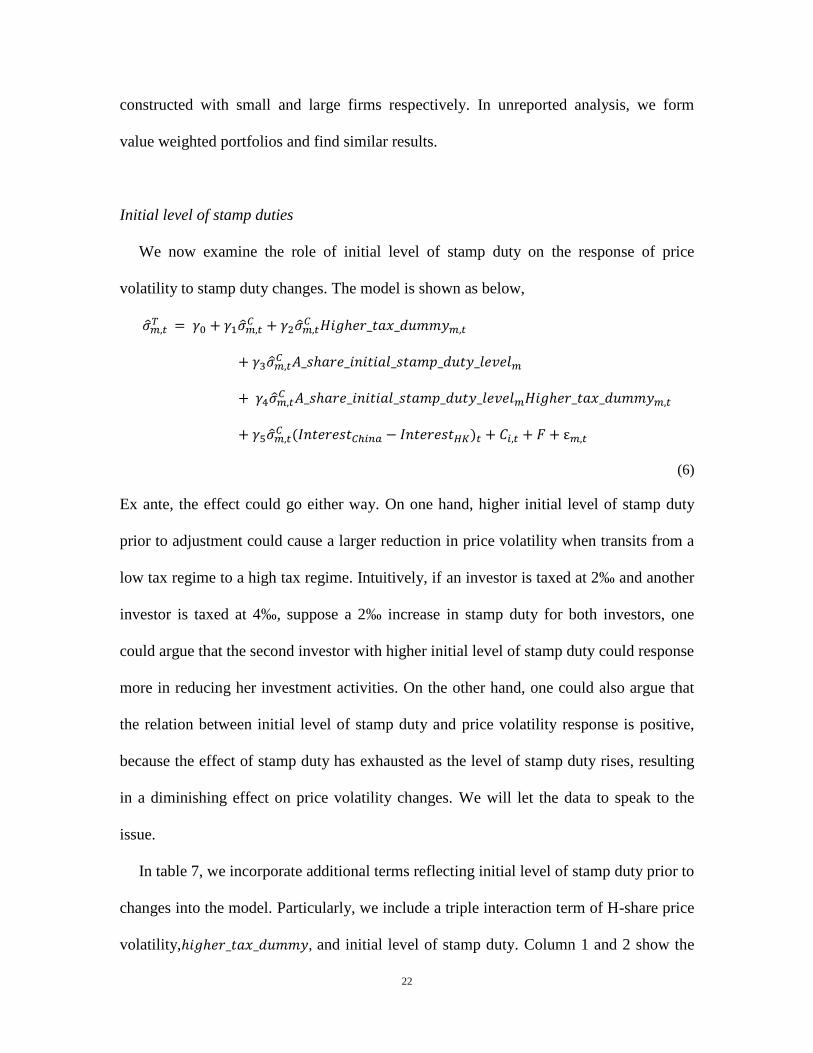
Initial level of stamp duties
We now examine the role of initial level of stamp duty on the response of price
volatility to stamp duty changes. The model is shown as below,
(6)
Ex ante, the effect could go either way. On one hand, higher initial level of stamp duty
prior to adjustment could cause a larger reduction in price volatility when transits from a
low tax regime to a high tax regime. Intuitively, if an investor is taxed at 2‰ and another
investor is taxed at 4‰, suppose a 2‰ increase in stamp duty for both investors, one
could argue that the second investor with higher initial level of stamp duty could response
more in reducing her investment activities. On the other hand, one could also argue that
the relation between initial level of stamp duty and price volatility response is positive,
because the effect of stamp duty has exhausted as the level of stamp duty rises, resulting
in a diminishing effect on price volatility changes. We will let the data to speak to the
issue.
In table 7, we incorporate additional terms reflecting initial level of stamp duty prior to
changes into the model. Particularly, we include a triple interaction term of H-share price
volatility, , and initial level of stamp duty. Column 1 and 2 show the
23
results of full sample. Unlike table 4, we find that the adverse effect of stamp duty on
price volatility change is fully loaded on the triple interaction term. In addition, the
negative coefficient for the triple interaction term suggests that a higher initial level of
stamp duty is associated with larger impact on price volatility reduction when moving
from a low tax regime to a high tax regime.
In Columns 3 and 4 of Table 7, we exclude potential outlier stocks as defined earlier,
and find qualitatively similar results as before.
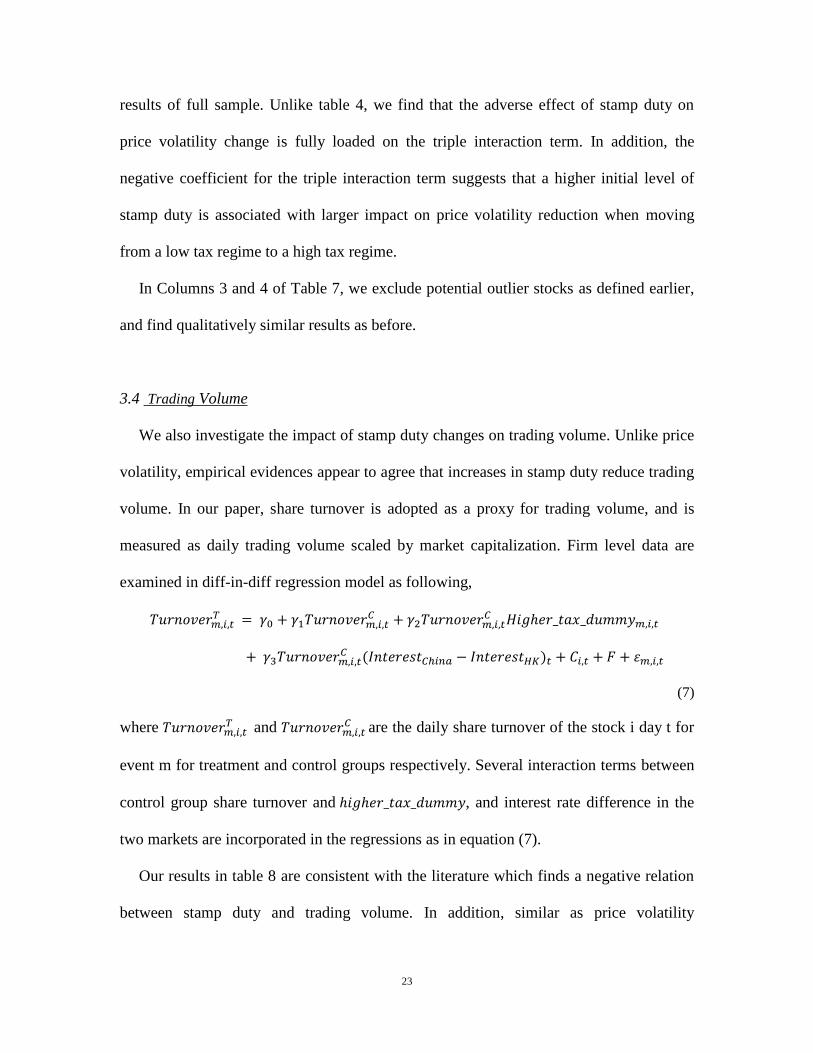
3.4 Trading Volume
We also investigate the impact of stamp duty changes on trading volume. Unlike price
volatility, empirical evidences appear to agree that increases in stamp duty reduce trading
volume. In our paper, share turnover is adopted as a proxy for trading volume, and is
measured as daily trading volume scaled by market capitalization. Firm level data are
examined in diff-in-diff regression model as following,
(7)
where and
are the daily share turnover of the stock i day t for
event m for treatment and control groups respectively. Several interaction terms between
control group share turnover and , and interest rate difference in the
two markets are incorporated in the regressions as in equation (7).
Our results in table 8 are consistent with the literature which finds a negative relation
between stamp duty and trading volume. In addition, similar as price volatility
24
estimations, magnitude of stamp duty changes doesn’t have a significant effect on share
turnover. In table 9, we replicate firm level turnover estimations with portfolio level data.
Equally weighted portfolios are constructed as in section 4.2.3. Overall, portfolio level
results are similar to firm level ones. However, the magnitude of impact is larger in
portfolios.
4 Institutional Share and the Effect of Stamp Duty on Price Volatility
We have argued that the effect of a higher transaction cost on price volatility depends
out whether the transaction cost drives out more informed fundamental-based traders or
more non-fundamental-based noise traders. The negative effect we have found so far
could reflect the fact that young Chinese stock market has been dominated by non-
fundamental based noise traders.
We now aim to extract more insight by exploring possible heterogeneous price
volatility response both across time periods and across stocks.
As shown in figure 2, the institutional share in the Chinese financial market was non-
existent in the early part of the sample period and remains significantly lower than in
developed markets. For example, in Jones and Seguin (1997), institutional ownership in
the U.S. stock market around the commission deregulation in 1975 is about 25%, while
for China, the number was anywhere near that level only in the tail end of the sample
period, i.e., after 2007. If a greater share of institutional trading implies a proportionately
smaller role of speculative noise trading, it would be interesting to examine whether the
effect of a higher transaction cost on price volatility is reversed in the later part of the
sample period.

25
Evolution of Institutional Investors in China
Guided by Figure 2b, we can divide the entire history of the Chinese equity market
into three periods: (1) The infant stage (1990-1997): after the Shanghai and Shenzhen
stock exchanges were established in 1990, there was virtually no institutional investors,
and the market was almost entirely dominated by retail investors; (2) The toddler stage
(1998-2005): institutional investors have emerged though still not significant in trading.
Investors became relatively less naive after having experienced several ups and downs in
the stock market in the preceding years. (3) The growth stage (after 2006): Institutional
investors start to grow at a high speed and play more important role in the Chinese stock
markets, while some of the retail investors have also become more sophisticated and
more exposed to the knowledge of finance and economics. At the same time, the number
of stocks has increased dramatically. While the exact dividing lines among the three
periods are somewhat arbitrary, they roughly divide the history of the Chinese equity
market (from late 1990 to now) into three stages of equal length, and are meant to capture
the evolution of the relative importance of institutional traders in the market.
We implement the same regression specification as in Column 1 of Table 4 for each
time period, and report the results in Table 10. We focus our discussions on the
coefficients for the interaction term between a dummy for a higher tax regime and H-
share volatility. Interestingly, we see a negative coefficient for the first two historical
periods (1990-1997, and 1998-2005) but a positive coefficient in the more recent period
(after 2006). This intriguing pattern of signs is consistent with the notion that, in earlier
periods when the market is dominated by retail traders, a higher transaction cost reduces
26
price volatility, whereas in the most recent period when institutional investors have
started to play a more important role in the market. It is also interesting to note that, when
we allow the effects to be different in different time periods, the volatility suppressing
effect of a higher transaction cost has also become bigger in the earlier periods. The
coefficients (-0.0720 and -0.0683, respectively) are more than three times as big as the
corresponding coefficient in Table 4.
This result has the potential to explain the different findings of ours and opponents’ of
Tobin tax in the literature, such as Jones and Seguin (1997). As pointed out earlier, the
institutional share in the Chinese financial market in growth era is about the similar level
as in the U.S. market around commission deregulation in 1975 discussed by Jones and
Seguin (1997). Therefore, our findings highlight the importance of investor structure in
driving mixing empirical evidences in the literature. We argue that a thorough
understanding of investor structure studied enables us to get a better comparison of
empirical findings.
Instead of looking at three sub-periods, we can perform separate event studies for
each of the seven changes in the stamp duties. Figure 3 provides the graphical
illustrations of the effects of each stamp duty changes on price volatility over 1-year and
6-month windows. Double difference7 in price volatility is calculated as the change in
price volatility of treatment group (A-share sample stocks) subtracts the change in price
volatility of the control group (H-share sample stocks). Overall, consistent patterns in
price volatility responses to stamp duty changes are found in figure 3, suggesting that
increase in stamp duty leads to reduction in price volatility, while decrease in stamp duty
in general leads to the opposite effect. Figure 3 also shows a positive relation between the
7 Double difference is calculated as

27
magnitude of stamp duty changes and its effect on price volatility. We also plot similar
graphs for share turnover and return, and a consistent negative relationship between
stamp duty and share turnover is found both with firm and portfolio level data.
Institutional Share and Price Volatility
While the results in the previous subsection are suggestive, we cannot read too much
into a data pattern from three time periods. Next, we use three direct measures of
institutional ownership in the estimations, constructed with institutional ownership level
and number of institutional investors8. First, we adopt the reported information from
WIND on institutional ownership at firm level on quarterly basis. The first available data
starts from the 2nd
quarter of 1998. For firms without information on institutional
ownership reported in the database, we consider them have zero institutional ownership
at the reporting time.
Our second measure is the change of institutional ownership in the latest quarter prior
to the stamp duty changes in our sample. We consider the absolute value of the
institutional holding changes as a proxy for institutional trading at stock level.
Our last measure of the relative importance of institutional investors at the stock-
event level is the number of institutional investors in logarithm. The regression results are
reported in table 11. Consistently negative relations between stamp duty changes and
price volatility for stocks with low institutional ownership are found in full sample and
subsamples excluding outlying stocks.
8 Information on institutional ownership for sample A-shares is obtained from WIND database one quarter
prior to stamp duty changes. For firms without any institutional ownership information reported, we
consider them as zero.
28
Interestingly, the coefficients on the trip interaction terms are all positive and
statistically significant. In column 1, in estimation with institutional ownership level, as
institutional ownership level increases, the negative effect of stamp duty increases on
price volatility reduces. However, the coefficient estimation is insignificant. As we
substitute the institutional ownership with more direct proxy of institutional trading in
column 2, our results confirm that stocks with more institutional trading lower the
negative effect of stamp duty on price volatility, Similarly, in column 3, when use natural
logarithm of the total number of institutional investors, we find a positive coefficient,
which suggests that increases in institutional share weaken the effect of stamp duty in
reducing price volatility.
In columns 4 to 6, the subsample eliminates observations with A-share price over H-
share price above 90th
percentile are performed and consistent results are found in
subsamples, confirming that the results are not driven by any outliers.
Additional Proxies for Institutional Trading
Some additional regression estimations are performed and results are reported in table
12. First, we define a large firm dummy which equals to one if the sample firm is the top
two size quintiles based on free float market capitalization around each event, and zero
otherwise. Firm size is argued in many studies as proxy for institutional ownership.
Therefore, one should expect to find a smaller price volatility response in the event of
stamp duty increases among large firms as they attract more institutional investing.
Result shown in column 1 confirms with this conjecture.

29
Next, we test how firm liquidity affects our results. On average, A-share stocks are
more liquid than stocks in the U.S. market9. Therefore, we use the median monthly share
turnover level of 0.06 in the U.S. market between 1990 and 2012 as a cutoff point. Share
turnover is measured as monthly trading volume over market capitalization. Hence, we
construct a liquidity firm dummy which equals to one if firm’s average monthly share
turnover over the one year period prior to stamp duty change is higher than 0.06, and zero
otherwise. In column 2 of table 12, we find that price volatilities of liquid firms reduce
less to stamp duty increases.
Lastly, we use the membership of some indices as proxies of institutional trading. In
particular, we examine how being a member of CSI 300 index affect the role of stamp
duty in lowering price volatility. Established in April 2005, CSI 300 accounts for over 60%
of SSE and SZSE A-share markets based on market capitalization, and a growing number
of funds benchmark upon it. We argue that a stock become member of CSI 300 would
naturally increase its exposure to institutional trading. Therefore, we expect being a
member of CSI 300 would lower the negative impact of stamp duty increases on price
volatility. In column 3, our results confirms with our conjecture, suggesting that inclusion
in CSI 300 has positive impact on price volatility.
Overall, our findings on institutional share confirm our conjecture that stocks with
more institutional investors experience smaller reduction in price volatility in response to
increases in stamp duty. The rationale behind it is that the competing effects of stamp
duty changes on price volatility are highly correlated with the fraction of informed and
noise traders. In some cases, as institutional investors play more and more significant role
in trading certain securities, increases in stamp duty could even result in increases in
9 Median of monthly share turnover between 1990 and 2012 are 0.06 (U.S.) and 0.12 (China A-share).

30
price volatility of those stocks, as in these stocks, large reduction in institutional trading
deters price discovery process and leads to higher volatility, and this effect dominates the
price volatility reduction from reduced noise trading.
5 Conclusion
Although many studies have been conducted with the goal to tackle the long-lasting
debate over Tobin tax, mixed empirical evidences have been found so far in the literature.
A potential problem in the existing studies is that the treatment and the control groups
may not have truly identical corporate fundamentals. Unlike existing studies, our paper
studies the effect of transaction cost on eliminating excess volatility and dampening the
speculation with a unique sample consisting of all the cross-listed A and H-shares in
China. The historical stamp duty adjustments in China A-share market are adopted as
natural experiments and we argue that the twin-share offers a clean treatment-control pair
with identical fundamentals but different transaction cost environments. Diff-in-diff
regressions are estimated at both firm and portfolio levels which show that increase in
stamp duty relates to reduction in price volatility, share turnover, and return.
Furthermore, we make effort to understand the reasons discrepancies in empirical
evidences on the topic. We argue that investor structure plays a key role in the story,
because reduction in trading by informed and noise traders due to stamp duty increases
could lead to completely opposite effect on price volatility. Therefore, from market
perspective, the aggregate effect of stamp duty on price volatility combines the two
competing effects driven by informed and noise traders respectively, and highly depends
on the relative proportion of each group in the market or in a security. In the literature,
31
institutional investors are commonly considered as informed trader, while retail investors
are considered as noise trader. In our analyses, various proxies of institutional trading are
incorporated into the estimations, and all of these proxies suggest that increases in the
fraction of institutional share weakened the negative effect of stamp duty on price
volatility.
In addition, our studies shed lights on disentangling the mixed evidences in the
literature. As Tobin tax is introduced to deter speculation of noise traders, and the effects
of transactions tax decreases as the fraction of noise trader drops. Developed markets
such as U.S. have much higher institutional ownership on average than emerging markets
like China, and informed institutional investors would have different response to
transaction tax. Hence, the different empirical findings on transaction tax could be
primarily driven by the different nature of the examined markets.
In summary, our findings largely support the proponents of security transaction tax
such as Tobin (1984), Stiglitz (1989) and Summers and Summers (1989), but only in a
setting in which institutional investors do not play a significant role in the market. We
argue that China offers a unique context which is close to the market condition as Tobin
first suggested security transaction tax. In this setting, when noise traders play important
role in the stock market and lead to excessive market volatility, transaction tax such as
stamp duty could serve as an effective method to curb speculation and improve stability
of the financial market. In particular, we highlight the role of investor structure in
disentangling the mixed evidences found in the literature. Finally, the paper has many
policy implications which not only apply to stock market but also to markets with broad
asset classes.

32
33
Reference
Aliber, Robert Z., Chowdhry, Bhagwan and Yan, Shu, 2002, “Some Evidence that a
Tobin Tax on Foreign Exchange Transactions may Increase Volatility”, European
Finance Review 7: 481–510, 2003
Amihud, Yakov, 2002, “Illiquid and Stock Returns: Cross-Section and Time-Series
Effects”, Journal of Financial Markets, 5, 31-56
Aregger, N., Brown, M. and Enzo, R., 2012, “Can a Transaction Tax or Capital Gains
Tax Smooth House Prices?”, working paper
Atkins, Allen B. and Dyl, Edward A., 1997, “Stock Price Volatility, Transaction Costs
and Securities Transactions Taxes”, Managerial and Decision Economics, 18(7-8),
709-718
Baltgi, Badi H., Li, Dong and Li, Qi, 2006, “Transaction Tax and Stock Market Behavior:
Evidence from an Emerging Market”, Empirical Economics, 31(2), 393-408
Chou, Robin K., and Wang, George H. K., 2006, “Transaction Tax and Market Quality of
the Taiwan Stock Index Futures”, Journal of Futures markets, 26, 1195-1216
Chow, Gregory C. (1960). "Tests of Equality between Sets of Coefficients in Two Linear
Regressions". Econometrica 28 (3): 591–605
De Long, Bradford, Andrei Shleifer, Lawrence H. Summers, and R. J. Waldman, 1990,
“Noise Trader Risk in Financial Markets”, Journal of Political Economy, 98(4),
703-38
Fu, Yuming, Qian, Wenlan, and Yeung, Bernard, 2012, “Financial Transaction Tax: the
Double-edged Sword Effects on Price Stability”, Working paper
Green, Christopher J., Maggioni, Paolo and Murinde, Victor, 2000, “ Regulatory Lessons
for Emerging Stock markets from A Century of Evidence on Transactions Costs
and Share Price Volatility in the London Stock Exchange”, Journal of Banking &
Finance, 24(4), 577-601
Grundfest, Joseph A., 1990, “The Damning Facts of a New Stocks Tax”, Wall Street
Journal, July 23rd
Grundfest, Joseph A., and Shoven, John B., 1991, “Adverse Implications of a Securities
Transaction Exercise Tax”, Journal of Accounting, Auditing, and Finance, 6,(4),
409-442

34
Habermeier, Karl and Kirilenko, Andrei A., 2001, “Securities Transaction Taxes and
Financial Markets”, IMF working paper
Hanke, Michael, Huber J., Kirchler, M. and Sutter, M., 2010, “The Economic
Consequences of A Tobin Tax – An Experimental Analysis”, Journal of
Economic Behavior & Organization, 74(1-2), 58-71
Hau, Harald, 2006, “The Role of Transaction Costs for Financial Volatility: Evidence
from the Paris Bourse”, Journal of the European Economic Association, 4(4),
862-890
Hu, Shing-yang, 1998, “The Effects of the Stock Transaction Tax on the Stock Market –
Experiences from Asian Markets”, Pacific-Basin Finance Journal, 6(3-4), 347-
364
Jones, Charles M., and Seguin, Paul J., 1997, “Transaction Costs and Price Volatility:
Evidence from Commission Deregulation”, The American Economic Review,
87(4), 728-737
Kupiec, Paul H., 1996, “Noise Traders, Excessive Volatility, and a Securities
Transactions Tax”, Journal of Financial Services Research, 10, 115-129
Lanne, Markku, and Vesala, Timo, 2010, “The Effect of A Transaction Tax on Exchange
Rate Volatility”, International Journal of Finance & Economics, 15(2), 123-133
Liu, Shinhua and Zhu, Zhen, 2009, “Transaction Costs and Price Volatility: New
Evidence from the Tokyo Stock”, Journal of Financial Services Research, 36(1),
65-83
Phylakti, Kate S. and Aristidou, Antonis., 2007, “Security Transaction Taxes and
Financial Volatility: Athens Stock Exchange”, Applied Financial Economics,
17(18), 1455-1467
Roll, Richard, 1989, “Price Volatility, International Market Links, and Their Implications
for Regulatory Policies”, Journal of Financial Services Research, 3, 211-246
Sheffrin, Steven M. and Turner, Tracy M., 2001, “Taxation and House-Price Uncertainty:
Some Empirical Estimates”, International Tax and Public Finance, 8, 621-636
Stiglitz, Joseph E., 1989, “Using Tax Policy to Curb Speculative Short-term Trading”,
Journal of Financial Services Research, 3(2-3), 101-115
35
Summers, Lawrence H. and Summers, Victoria P., 1989, “When Financial Markets Work
Too Well: A Cautious Case for a Securities Transaction Tax”, Journal of
Financial Services Research, 3(2-3), 261-286
Tobin, James, 1978, “A Proposal for International Monetary Reform”, Eastern Economic
Journal, 4, 153-159
Tobin, James, 1984, “On the Efficiency of the Financial System”, Lloyd Bank Review,
153, 1-15
Umlauf, Steven R., 1993, “Transaction Taxes and the Behavior of the Swedish Stock
Market”, Journal of Financial Economics, 33(2), 227-240
Westerholm, Joakim, 2003, “The Impact of Transaction Costs on Turnover, Asset Prices
and Volatility: The Cases of Sweden’s and Finland’s Security Transaction Tax
Reductions”, The Finnish Journal of Business Economics, 2(3), 213-241
36
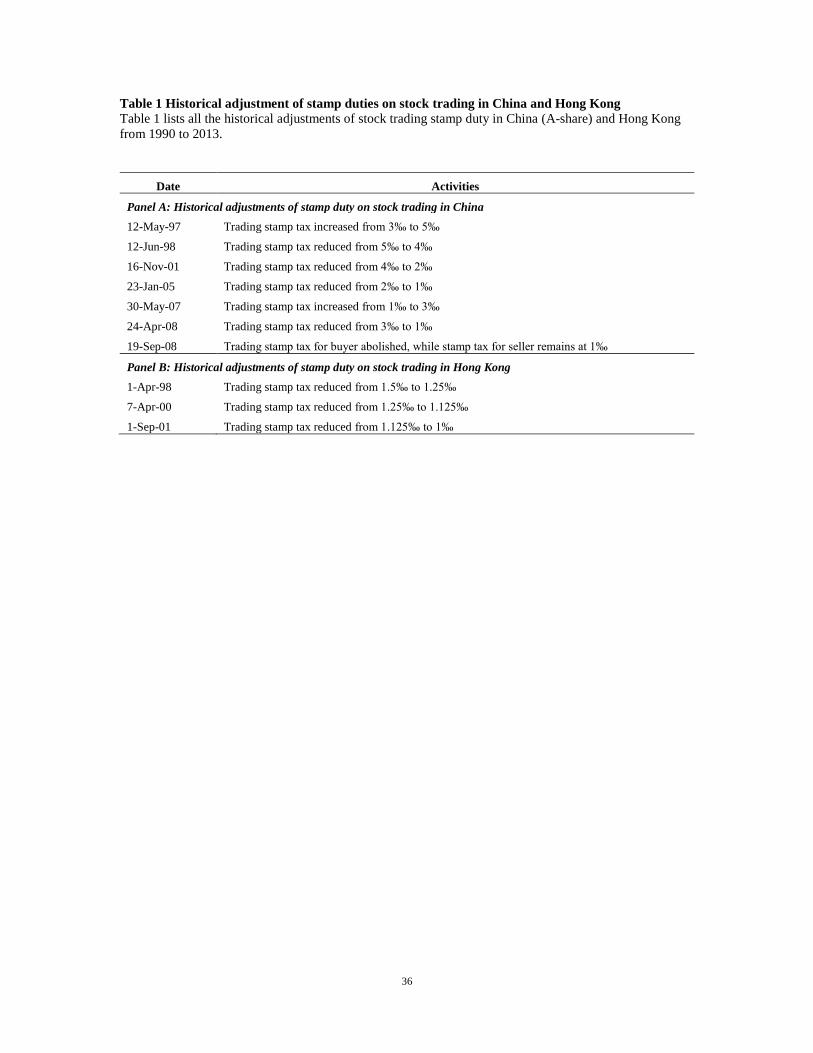
Table 1 Historical adjustment of stamp duties on stock trading in China and Hong Kong
Table 1 lists all the historical adjustments of stock trading stamp duty in China (A-share) and Hong Kong
from 1990 to 2013.
Date Activities
Panel A: Historical adjustments of stamp duty on stock trading in China
12-May-97 Trading stamp tax increased from 3‰ to 5‰
12-Jun-98 Trading stamp tax reduced from 5‰ to 4‰
16-Nov-01 Trading stamp tax reduced from 4‰ to 2‰
23-Jan-05 Trading stamp tax reduced from 2‰ to 1‰
30-May-07 Trading stamp tax increased from 1‰ to 3‰
24-Apr-08 Trading stamp tax reduced from 3‰ to 1‰
19-Sep-08 Trading stamp tax for buyer abolished, while stamp tax for seller remains at 1‰
Panel B: Historical adjustments of stamp duty on stock trading in Hong Kong
1-Apr-98 Trading stamp tax reduced from 1.5‰ to 1.25‰
7-Apr-00 Trading stamp tax reduced from 1.25‰ to 1.125‰
1-Sep-01 Trading stamp tax reduced from 1.125‰ to 1‰

37
Table 2 Summary Statistics
Table 2 reports the summary statistics of our sample. There are 223 firm-event observations in our sample.
Panel A shows the financial characteristics of the sample firms cross-listed both in A- and H-share markets.
The financial information acquired from CSMAR reflects the latest annual filing prior to each event date.
However, because the same firm enters into our sample multiple times given adjacent events, duplicated
observations for firms with same annual filing are eliminated in reporting the financial characteristics. In
panel B, the stock characteristics of A- and H-shares in our sample are reported respectively. The mean
values of the key stock characteristic variables over a 2-year window around each event date are reported.
Panel C reports the mean and median of institutional holding of sample A-shares in the latest quarter prior
to a certain stamp duty change. Institutional holding information is obtained from WIND database, and
institutional ownership is shown as a fraction of total market capitalization of tradable shares in the same
reporting period. Absolute change in institutional holding reflects the aggregate change in institutional
holding within the one quarter prior to stamp duty changes. Number of institutional investors is also
reported in the table. All the variables are reported in RMB, and for H-shares, we convert the HKD to RMB
based on the historical daily exchange rate.
Panel A: Financial Characteristics
Currency: RMB Mean Median
No. observations 223
Total asset (mil) 349,843 15,057
Sales (mil) 58,205 9,784
Cash/Total asset 11.5% 9.2%
EBIT/Sales 9.7% 6.3%
Net income margin 6.6% 4.9%
Sales growth 17.4% 15.5%
Debt/Total asset 9.3% 5.5%
Panel B: Stock Characteristics
Currency: RMB A-share H-share
Market Capitalization (mil) 120,857 40,129
Stock price 13.4 6.7
Average value of daily transaction volume (mil) 268 256
Average daily return 0.06% 0.07%
Average daily price volatility 0.0310 0.0332
Average daily share turnover 0.0057 0.0115
Amihud illiquidity ratio 0.0015 0.0360
Panel C: Institutional Holding Characteristics
Mean Median
Institutional ownership (% of tradable shares) 19.7 12.6
Absolute institutional ownership change (% of tradable shares) 8.6 4.1
Number of institutional investors 24 9
38
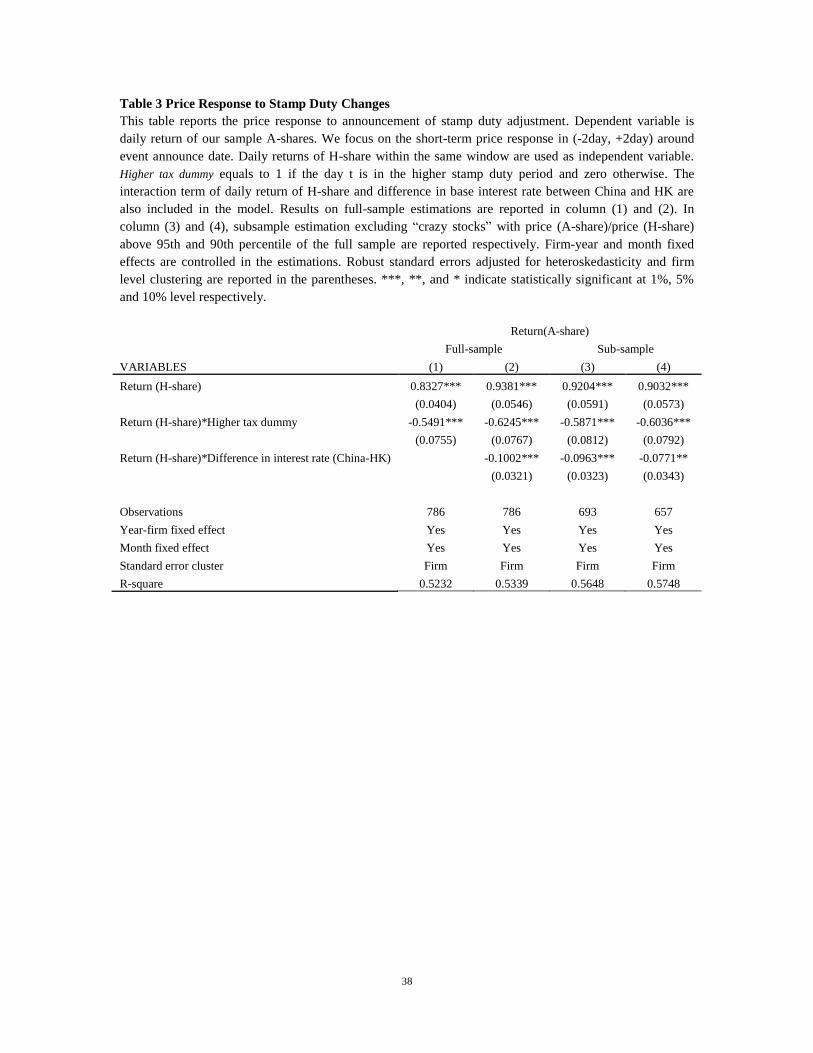
Table 3 Price Response to Stamp Duty Changes
This table reports the price response to announcement of stamp duty adjustment. Dependent variable is
daily return of our sample A-shares. We focus on the short-term price response in (-2day, +2day) around
event announce date. Daily returns of H-share within the same window are used as independent variable.
Higher tax dummy equals to 1 if the day t is in the higher stamp duty period and zero otherwise. The
interaction term of daily return of H-share and difference in base interest rate between China and HK are
also included in the model. Results on full-sample estimations are reported in column (1) and (2). In
column (3) and (4), subsample estimation excluding “crazy stocks” with price (A-share)/price (H-share)
above 95th and 90th percentile of the full sample are reported respectively. Firm-year and month fixed
effects are controlled in the estimations. Robust standard errors adjusted for heteroskedasticity and firm
level clustering are reported in the parentheses. ***, **, and * indicate statistically significant at 1%, 5%
and 10% level respectively.
Return(A-share)
Full-sample Sub-sample
VARIABLES (1) (2) (3) (4)
Return (H-share) 0.8327*** 0.9381*** 0.9204*** 0.9032***
(0.0404) (0.0546) (0.0591) (0.0573)
Return (H-share)*Higher tax dummy -0.5491*** -0.6245*** -0.5871*** -0.6036***
(0.0755) (0.0767) (0.0812) (0.0792)
Return (H-share)*Difference in interest rate (China-HK)
-0.1002*** -0.0963*** -0.0771**
(0.0321) (0.0323) (0.0343)
Observations 786 786 693 657
Year-firm fixed effect Yes Yes Yes Yes
Month fixed effect Yes Yes Yes Yes
Standard error cluster Firm Firm Firm Firm
R-square 0.5232 0.5339 0.5648 0.5748

39
Table 4 Stamp Duties and Stock Price Volatility
Table 4 provides results of multivariate analyses on daily price volatility with respect to stamp duty
changes. The price volatility is measured as √
| | for event m stock i at day t, and conditional on 12
previous daily price volatility followed Jones and Seguin (1997). Higher tax dummy equals to 1 if the day t is
in the higher stamp duty period and zero otherwise, i.e. for a positive stamp duty adjustment, the
observations after the event date will be classified as with higher tax, and vice versa. The interaction term
of H-share price volatility and difference in base interest rate between China and HK are also included in
the model. In Panel A, we estimate our sample price volatility followed the equation shown below:
Results on full-sample estimations
are reported in column (1) and (2), and size of change in stamp duties is included and corresponding
interaction terms are added in the regressions. In column (3) and (4), subsample estimations excluding
observations of “crazy stocks” which has price(A-share)/price(H-share) of top 5 and 10 percentiles of the
sample are reported respectively. In Panel B, we re-estimate our sample with full sample and subsamples
excluding stock observations with price (A-share)/ price (H-share) above 1, 5, and 10 percentiles of full
sample respectively followed the equation as
Firm-year and month fixed effects are controlled in the estimations. Robust standard errors adjusted
for heteroskedasticity and firm level clustering are reported in the parentheses. ***, **, and * indicate
statistically significant at 1%, 5% and 10% level respectively.
Panel A Price volatility (A-share)
Full-sample Sub-sample
VARIABLES (1) (2) (3) (4)
Price volatility (H-share) 0.1373*** 0.1212*** 0.1273*** 0.1241***
(0.0089) (0.0095) (0.0099) (0.0098)
Price volatility (H-share)* Higher tax dummy -0.0198** -0.0216** -0.0265*** -0.0263***
(0.0075) (0.0090) (0.0091) (0.0091)
Price volatility (H-share)*Size of change in A-share stamp
duty
0.0013 0.0005 0.0007
(0.0010) (0.0009) (0.0009)
Price volatility (H-share)*Size of change in A-share stamp
duty* Higher tax dummy
0.0023 0.0025* 0.0020
(0.0015) (0.0015) (0.0015)
Price volatility (H-share)*Difference in interest rate
(China-HK)
0.0072*** 0.0068** 0.0070***
(0.0026) (0.0025) (0.0025)
Observations 101,020 101,020 83,777 79,373
Year-firm fixed effect Yes Yes Yes Yes
Month fixed effects Yes Yes Yes Yes
Standard error cluster Firm Firm Firm Firm
R-square 0.4112 0.4120 0.4126 0.4137

40
Panel B Price volatility (A-share)
Full sample Subsample 1 Subsample 2 Subsample 3
VARIABLES (1) (2) (3) (4)
Price volatility (H-share) 0.1270*** 0.1304*** 0.1283*** 0.1251***
(0.0087) (0.0087) (0.0086) (0.0086)
Higher tax dummy -0.0004 -0.0004* -0.0005** -0.0006**
(0.0003) (0.0003) (0.0003) (0.0003)
Observations 101,020 87,289 83,777 79,373
Year-firm fixed effect Yes Yes Yes Yes
Month fixed effect Yes Yes Yes Yes
Standard error cluster Firm Firm Firm Firm
R-square 0.4107 0.4089 0.4111 0.4121

41
Table 5 Robustness Checks
Several robustness checks are conducted and results are shown in following table. Firm level data are
estimated with diff-in-diff regressions. In panel A, we first divide our sample into two subsamples based on
the direction (increase or decrease) of stamp duty adjustments. In column (3), we exclude the financial and
utility firms based on the industry classification (indcd=1 refers to financial firms and indcd=2 refers to
utility firms) from CSMAR. In column (4), we manually check and exclude the firm observations with
significant event, e.g. massive non-tradable shares transfer to tradable shares, over the event window. In
panel B, we divide the sample into two groups based on A-share price volatility. High volatility group
includes stocks with price volatility higher than (and include) sample mean, while low volatility group
contains the rest. For event m, the price volatility is measured as √
| | for event m stock i at day t, and
higher tax dummy equals to 1 if the day t is in the higher stamp duty time period and zero otherwise. The
price volatility of A-share and H-share used in the regression are the estimated standard deviation of returns
conditional on 12 previous daily price volatility followed Jones and Seguin (1997). The interaction term of
H-share price volatility and difference in base interest rate between China and HK are also included in the
model at monthly frequency. Firm-year and month fixed effects are controlled in the estimations. Robust
standard errors adjusted for heteroskedasticity and firm level clustering are reported in the parentheses. ***,
**, and * indicate statistically significant at 1%, 5% and 10% level respectively.
Panel A Price volatility (A-share)
(1) (2) (3) (4)
VARIABLES
Reduce
stamp duty
events
Increase
stamp duty
events
Sub-industry
(excl.
financial &
utility
sectors)
Sub-sample
(excl. firms
with
significant
event)
Price volatility (H-share) 0.1293*** 0.1945*** 0.1140*** 0.1150***
(0.0100) (0.0201) (0.0100) (0.0125)
Price volatility (H-share)* Higher tax dummy -0.0317*** -0.0330* -0.0205** -0.0189**
(0.0077) (0.0169) (0.0096) (0.0082)
Price volatility (H-share) *Difference in interest rate
(China-HK) 0.0099*** 0.003 0.0080*** 0.0079***
(0.0024) (0.0044) (0.0026) (0.0028)
Observations 77,542 23,478 66,242 68,403
Firm-year fixed effect Yes Yes Yes Yes
Month fixed effect Yes Yes Yes Yes
Standard error cluster Firm Firm Firm Firm
R-square 0.3990 0.2856 0.3942 0.4223

42
Panel B Price volatility (A-share)
(1) (2)
VARIABLES High volatility Low volatility
Price volatility (H-share) 0.1048*** 0.0299***
(0.0068) (0.0036)
Price volatility (H-share)* Higher tax dummy -0.0157** -0.0065*
(0.0068) (0.0034)
Price volatility (H-share) *Difference in interest rate (China-HK) -0.0059** 0.0064***
(0.0024) (0.0010)
Observations 43,800 57,220
Firm-year fixed effect Yes Yes
Month fixed effect Yes Yes
Standard error cluster Firm Firm
R-square 0.2065 0.2656
43
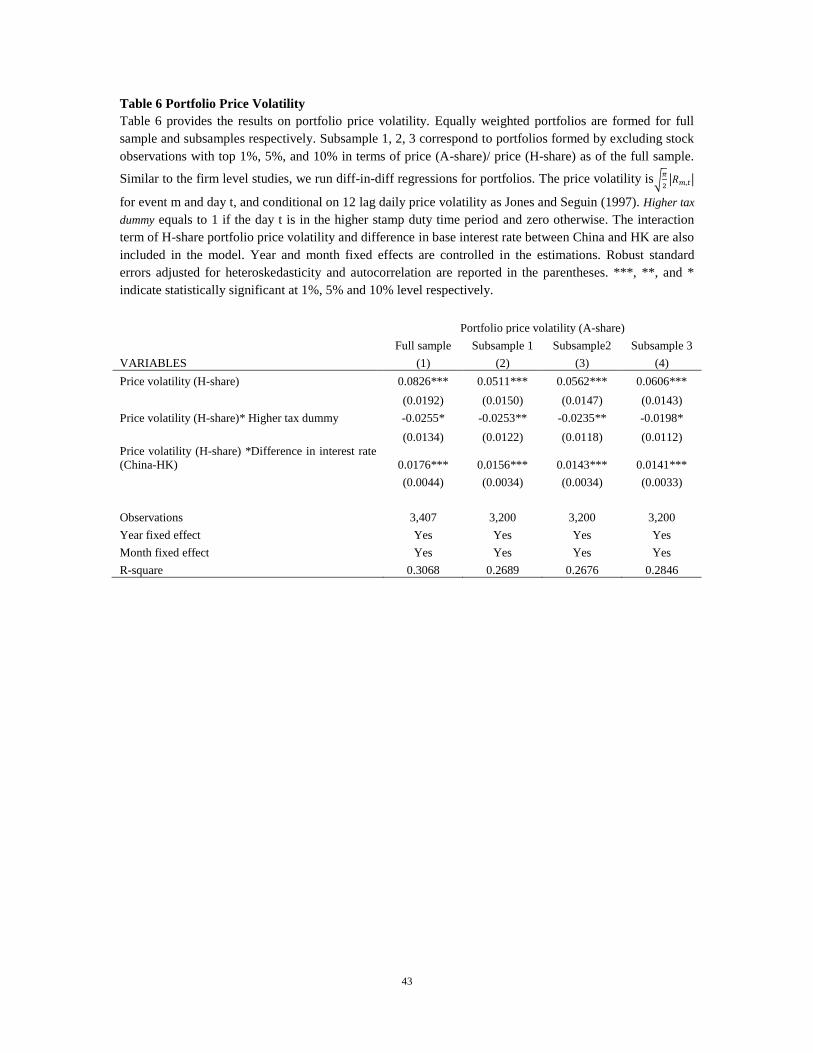
Table 6 Portfolio Price Volatility
Table 6 provides the results on portfolio price volatility. Equally weighted portfolios are formed for full
sample and subsamples respectively. Subsample 1, 2, 3 correspond to portfolios formed by excluding stock
observations with top 1%, 5%, and 10% in terms of price (A-share)/ price (H-share) as of the full sample.
Similar to the firm level studies, we run diff-in-diff regressions for portfolios. The price volatility is√
| |
for event m and day t, and conditional on 12 lag daily price volatility as Jones and Seguin (1997). Higher tax
dummy equals to 1 if the day t is in the higher stamp duty time period and zero otherwise. The interaction
term of H-share portfolio price volatility and difference in base interest rate between China and HK are also
included in the model. Year and month fixed effects are controlled in the estimations. Robust standard
errors adjusted for heteroskedasticity and autocorrelation are reported in the parentheses. ***, **, and *
indicate statistically significant at 1%, 5% and 10% level respectively.
Portfolio price volatility (A-share)
Full sample Subsample 1 Subsample2 Subsample 3
VARIABLES (1) (2) (3) (4)
Price volatility (H-share) 0.0826*** 0.0511*** 0.0562*** 0.0606***
(0.0192) (0.0150) (0.0147) (0.0143)
Price volatility (H-share)* Higher tax dummy -0.0255* -0.0253** -0.0235** -0.0198*
(0.0134) (0.0122) (0.0118) (0.0112)
Price volatility (H-share) *Difference in interest rate
(China-HK) 0.0176*** 0.0156*** 0.0143*** 0.0141***
(0.0044) (0.0034) (0.0034) (0.0033)
Observations 3,407 3,200 3,200 3,200
Year fixed effect Yes Yes Yes Yes
Month fixed effect Yes Yes Yes Yes
R-square 0.3068 0.2689 0.2676 0.2846

44
Table 7 Effects of Initial Size of Stamp Duties
Table 7 examines the effects of initial size of stamp duties on price volatility. Initial size of stamp duties is
included and corresponding interaction terms are added in the regressions. The price volatility is measured
as √
| | for event m stock i at day t, and conditional on 12 previous daily price volatility followed Jones
and Seguin (1997). Higher tax dummy equals to 1 if the day t is in the higher stamp duty period and zero
otherwise, i.e. for a positive stamp duty adjustment, the observations after the event date will be classified
as with higher tax, and vice versa. The interaction term of H-share price volatility and difference in base
interest rate between China and HK are also included in the model. Results on full-sample estimations are
reported in column (1) and (2). In column (3) and (4), subsample estimation excluding “crazy stocks” with
price (A-share)/price(H-share) above 95th and 90th percentile of the full sample are reported respectively.
Firm-year and month fixed effects are controlled in the estimations. Robust standard errors adjusted for
heteroskedasticity and firm level clustering are reported in the parentheses. ***, **, and * indicate
statistically significant at 1%, 5% and 10% level respectively.
Price volatility (A-share)
Full-sample Sub-sample
VARIABLES (1) (2) (3) (4)
Price volatility (H-share) 0.1509*** 0.1305*** 0.1359*** 0.1333***
(0.0113) (0.0112) (0.0114) (0.0112)
Price volatility (H-share)* Higher tax dummy 0.0093 0.0281*** 0.0212** 0.0195*
(0.0115) (0.0103) (0.0103) (0.0103)
Price volatility (H-share)*Initial size of A-share stamp
duty -0.0013 0.0001 -0.0003 -0.0003
(0.0011) (0.0010) (0.0010) (0.0010)
Price volatility (H-share)*Initial size of A-share stamp
duty* Higher tax dummy -0.0062*** -0.0089*** -0.0083*** -0.0081***
(0.0015) (0.0013) (0.0013) (0.0013)
Price volatility (H-share)*Difference in interest rate
(China-HK)
0.0099*** 0.0093*** 0.0095***
(0.0026) (0.0025) (0.0025)
Observations 101,020 101,020 83,777 79,373
Firm-year fixed effect Yes Yes Yes Yes
Month fixed effect Yes Yes Yes Yes
Standard error cluster Firm Firm Firm Firm
R-square 0.4128 0.4141 0.4147 0.4158
45
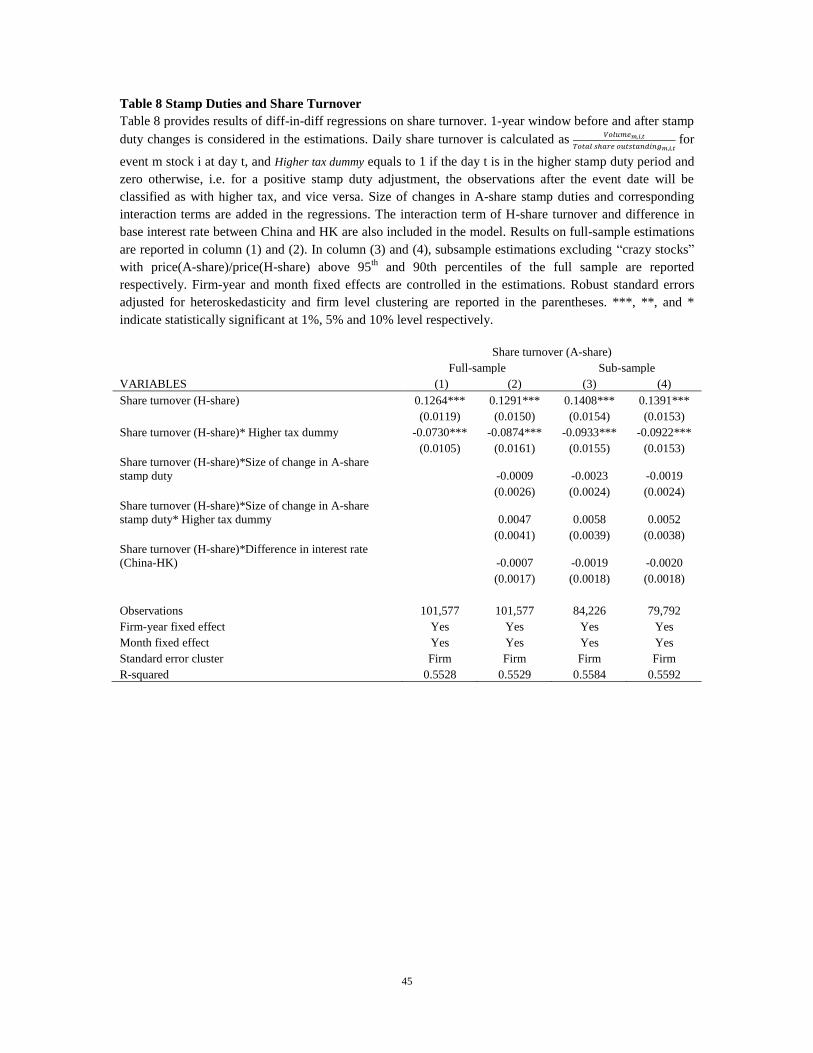
Table 8 Stamp Duties and Share Turnover
Table 8 provides results of diff-in-diff regressions on share turnover. 1-year window before and after stamp
duty changes is considered in the estimations. Daily share turnover is calculated as
for
event m stock i at day t, and Higher tax dummy equals to 1 if the day t is in the higher stamp duty period and
zero otherwise, i.e. for a positive stamp duty adjustment, the observations after the event date will be
classified as with higher tax, and vice versa. Size of changes in A-share stamp duties and corresponding
interaction terms are added in the regressions. The interaction term of H-share turnover and difference in
base interest rate between China and HK are also included in the model. Results on full-sample estimations
are reported in column (1) and (2). In column (3) and (4), subsample estimations excluding “crazy stocks”
with price(A-share)/price(H-share) above 95th
and 90th percentiles of the full sample are reported
respectively. Firm-year and month fixed effects are controlled in the estimations. Robust standard errors
adjusted for heteroskedasticity and firm level clustering are reported in the parentheses. ***, **, and *
indicate statistically significant at 1%, 5% and 10% level respectively.
Share turnover (A-share)
Full-sample Sub-sample
VARIABLES (1) (2) (3) (4)
Share turnover (H-share) 0.1264*** 0.1291*** 0.1408*** 0.1391***
(0.0119) (0.0150) (0.0154) (0.0153)
Share turnover (H-share)* Higher tax dummy -0.0730*** -0.0874*** -0.0933*** -0.0922***
(0.0105) (0.0161) (0.0155) (0.0153)
Share turnover (H-share)*Size of change in A-share
stamp duty
-0.0009 -0.0023 -0.0019
(0.0026) (0.0024) (0.0024)
Share turnover (H-share)*Size of change in A-share
stamp duty* Higher tax dummy
0.0047 0.0058 0.0052
(0.0041) (0.0039) (0.0038)
Share turnover (H-share)*Difference in interest rate
(China-HK)
-0.0007 -0.0019 -0.0020
(0.0017) (0.0018) (0.0018)
Observations 101,577 101,577 84,226 79,792
Firm-year fixed effect Yes Yes Yes Yes
Month fixed effect Yes Yes Yes Yes
Standard error cluster Firm Firm Firm Firm
R-squared 0.5528 0.5529 0.5584 0.5592

46
Table 9 Portfolio Share Turnover
Table 9 reports the results of diff-in-diff regression with portfolio turnover. Equally weighted portfolios are
formed on around each stamp duty event for full sample and subsamples respectively. Subsample 1, 2, 3
correspond to portfolios formed by excluding stock observations with top 1%, 5%, and 10% in terms of
price (A-share)/ price (H-share) as of the full sample. Similar to the firm level studies, we run diff-in-diff
regressions for portfolios. Higher tax dummy equals to 1 if the day t is in the higher stamp duty time period
and zero otherwise Initial level and change of stamp duty are included and interaction terms with H-share
turnover and Higher tax dummy are incorporated. The interaction term of H-share turnover with difference in
base interest rate between China and HK are also included in the model at monthly frequency. Firm
financial characteristics are included in the regressions. Year and month fixed effects are controlled. Robust
standard errors adjusted for heteroskedasticity and autocorrelation are reported in the parentheses. ***, **,
and * indicate statistically significant at 1%, 5% and 10% level respectively.
Share turnover (A-share)
Full sample Subsample 1 Subsample 2 Subsample 3
VARIABLES (1) (2) (3) (4)
Share turnover (H-share) 0.1261*** 0.1332*** 0.1338*** 0.1316***
(0.0105) (0.0112) (0.0112) (0.0112)
Share turnover (H-share)* Higher tax dummy -0.1054*** -0.1059*** -0.1050*** -0.1045***
(0.0095) (0.0098) (0.0098) (0.0098)
Share turnover (H-share)*Difference in base interest
rate (China-HK) -0.0000 -0.0015 -0.0021 -0.0023
(0.0014) (0.0015) (0.0015) (0.0015)
Observations 3,407 3,284 3,284 3,284
Year fixed effect Yes Yes Yes Yes
Month fixed effect Yes Yes Yes Yes
R-square 0.5866 0.5772 0.5763 0.5690

47
Table 10 Effects of Stamp Duties on Price Volatility over Time
Table 10 examines the effects of stamp duties on price volatility over time. According to the anecdotic
evidences, the evolution of institutional investors in China’s financial markets has 3 stages. Namely, the
early era is from the establishment of the stock market in 1990 to 1997 and over this period of time the
stock market mainly consists of retail investors. Next, emerging era for institutional investor is between
1998 and 2005 when the proportion of institutional investors in the market starts to grow. Lastly, in growth
era after 2006, institutional investors such as mutual funds, starts to grow at a high speed in A-share market.
Similar difference-in-difference regressions are run over the subsamples. For event m, the price volatility is
measured as √
| | for event m stock i at day t, and conditional on 12 lag daily price volatility. Higher tax
dummy equals to 1 if the day t is in the higher stamp duty time period and zero otherwise. The interaction
term of H-share price volatility and difference in base interest rate between China and HK are also included
in the model. Firm-year and month fixed effects are controlled in the estimations. T Robust standard errors
adjusted for heteroskedasticity and firm level clustering are reported in the parentheses. ***, **, and *
indicate statistically significant at 1%, 5% and 10% level respectively.
Price volatility (A-share)
(1) (2) (3)
VARIABLES
Early era
(1990-1997)
Emerging era
(1998-2005)
Growth era
(after 2006)
Price volatility (H-share) -0.3239*** 0.0818*** 0.1750***
(0.0528) (0.0118) (0.0123)
Price volatility (H-share)* Higher tax dummy -0.0720** -0.0683*** 0.0173**
(0.0275) (0.0148) (0.0075)
Price volatility (H-share)*Difference in interest rate (China-HK) 0.1159*** 0.0175*** 0.0090*
(0.0137) (0.0035) (0.0049)
Observations 6,888 29,262 64,870
Firm-year fixed effect Yes Yes Yes
Month fixed effect Yes Yes Yes
Standard error cluster Firm Firm Firm
R-square 0.2581 0.2976 0.3539

48
Table 11 Institutional Share and Price Volatility
Table 11 reports the regression results examining the effects of institutional share on stock price volatility. Three measures of institutional share are adopted in
the estimations. First, we use the fraction of shares held by the institutional investor as of total outstanding shares in the latest quarter prior to stamp duty changes
as the direct measure of institutional ownership. Second, to proxy for institutional trading, we adopt the absolute value of the institutional ownership change in
the latest quarter prior to stamp duty changes. Lastly, as Cornett et al (2007), we construct another measure of institutional share with the nature logarithm of the
number of outstanding institutional investors in A-share stocks a quarter prior to stamp duty changes. Dependent variable is A-share price volatility and
independent variable includes H-share price volatility. For event m, the price volatility is measured as √
| | for event m stock i at day t, and conditional on 12
lag daily price volatility. Higher tax dummy equals to 1 if the day t is in the higher stamp duty time period and zero otherwise. Interaction terms of the two
measures of institutional share with H-share price volatility and higher tax dummy are also incorporated in the regressions. The interaction term of H-share price
volatility and difference in base interest rate between China and HK are also included in the model. In Panel A, results on full-sample and subsample excluding
“crazy stocks” which have price(A-share)/price(H-share) above 90th percentile of the full sample are reported respectively. Firm-year and month fixed effects are
controlled in the estimations. T Robust standard errors adjusted for heteroskedasticity and firm level clustering are reported in the parentheses. ***, **, and *
indicate statistically significant at 1%, 5% and 10% level respectively.
Price volatility (A-share)
Full sample Subsample
VARIABLES (1) (2) (3) (4) (5) (6)
Price volatility (H-share) 0.1180*** 0.1243*** 0.1024*** 0.1182*** 0.1250*** 0.1003***
(0.0086) (0.0097) (0.0079) (0.0093) (0.0103) (0.0087)
Price volatility (H-share)* Higher tax dummy -0.0215** -0.0225** -0.0279*** -0.0263*** -0.0274*** -0.0313***
(0.0087) (0.0088) (0.0103) (0.0090) (0.0092) (0.0108)
Price volatility (H-share)*Institutional ownership 0.0006
0.0006
(0.0004)
(0.0004)
Price volatility (H-share)*Institutional ownership* Higher tax dummy 0.0004
0.0004
(0.0004)
(0.0004)
Price volatility (H-share)*Magnitude of institutional holding changes
0.0004
0.0004
(0.0005)
(0.0005)
Price volatility (H-share)*Magnitude of institutional holding changes* Higher tax dummy
0.0010**
0.0010**
(0.0005)
(0.0005)
Price volatility (H-share)*Ln(Number of institutional investors)
0.0146***
0.0156***
(0.0039)
(0.0038)
Price volatility (H-share)*Ln(Number of institutional investors)* Higher tax dummy
0.0088*
0.0082*

49
(0.0046)
(0.0047)
Price volatility (H-share)*Difference in interest rate (China-HK) 0.0073** 0.0077*** 0.0082*** 0.0071** 0.0076*** 0.0078***
(0.0028) (0.0026) (0.0029) (0.0027) (0.0026) (0.0029)
Observations 101,020 101,020 101,020 79,373 79,373 79,373
Firm-year fixed effect Yes Yes Yes Yes Yes Yes
Month fixed effect Yes Yes Yes Yes Yes Yes
Standard error cluster Firm Firm Firm Firm Firm Firm
R-square 0.4130 0.4126 0.4148 0.4148 0.4144 0.4169
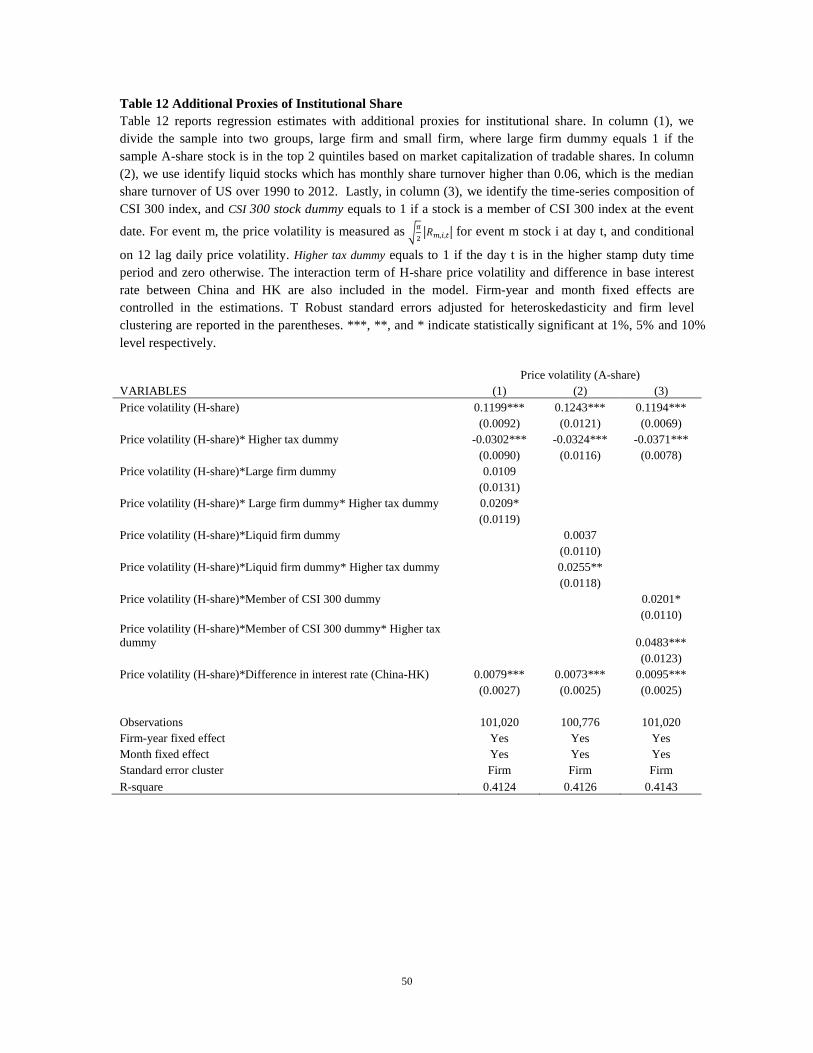
50
Table 12 Additional Proxies of Institutional Share
Table 12 reports regression estimates with additional proxies for institutional share. In column (1), we
divide the sample into two groups, large firm and small firm, where large firm dummy equals 1 if the
sample A-share stock is in the top 2 quintiles based on market capitalization of tradable shares. In column
(2), we use identify liquid stocks which has monthly share turnover higher than 0.06, which is the median
share turnover of US over 1990 to 2012. Lastly, in column (3), we identify the time-series composition of
CSI 300 index, and CSI 300 stock dummy equals to 1 if a stock is a member of CSI 300 index at the event
date. For event m, the price volatility is measured as √
| | for event m stock i at day t, and conditional
on 12 lag daily price volatility. Higher tax dummy equals to 1 if the day t is in the higher stamp duty time
period and zero otherwise. The interaction term of H-share price volatility and difference in base interest
rate between China and HK are also included in the model. Firm-year and month fixed effects are
controlled in the estimations. T Robust standard errors adjusted for heteroskedasticity and firm level
clustering are reported in the parentheses. ***, **, and * indicate statistically significant at 1%, 5% and 10%
level respectively.
Price volatility (A-share)
VARIABLES (1) (2) (3)
Price volatility (H-share) 0.1199*** 0.1243*** 0.1194***
(0.0092) (0.0121) (0.0069)
Price volatility (H-share)* Higher tax dummy -0.0302*** -0.0324*** -0.0371***
(0.0090) (0.0116) (0.0078)
Price volatility (H-share)*Large firm dummy 0.0109
(0.0131)
Price volatility (H-share)* Large firm dummy* Higher tax dummy 0.0209*
(0.0119)
Price volatility (H-share)*Liquid firm dummy
0.0037
(0.0110)
Price volatility (H-share)*Liquid firm dummy* Higher tax dummy
0.0255**
(0.0118)
Price volatility (H-share)*Member of CSI 300 dummy
0.0201*
(0.0110)
Price volatility (H-share)*Member of CSI 300 dummy* Higher tax
dummy
0.0483***
(0.0123)
Price volatility (H-share)*Difference in interest rate (China-HK) 0.0079*** 0.0073*** 0.0095***
(0.0027) (0.0025) (0.0025)
Observations 101,020 100,776 101,020
Firm-year fixed effect Yes Yes Yes
Month fixed effect Yes Yes Yes
Standard error cluster Firm Firm Firm
R-square 0.4124 0.4126 0.4143
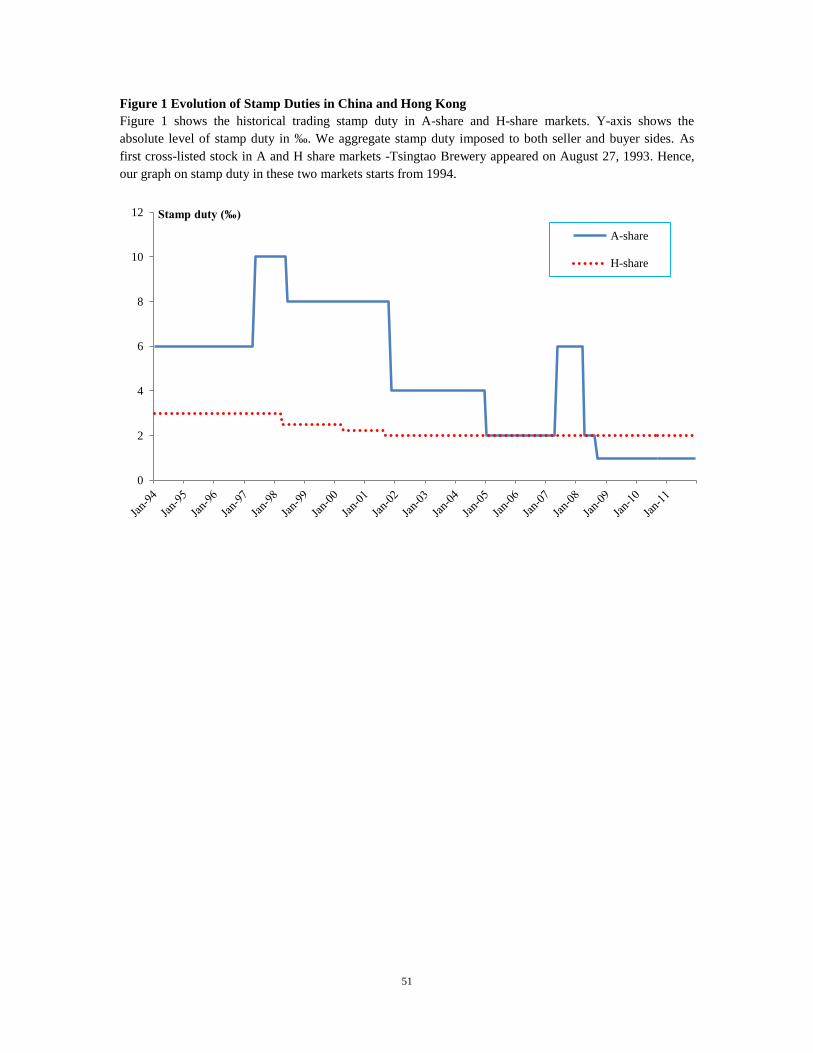
51
Figure 1 Evolution of Stamp Duties in China and Hong Kong
Figure 1 shows the historical trading stamp duty in A-share and H-share markets. Y-axis shows the
absolute level of stamp duty in ‰. We aggregate stamp duty imposed to both seller and buyer sides. As
first cross-listed stock in A and H share markets -Tsingtao Brewery appeared on August 27, 1993. Hence,
our graph on stamp duty in these two markets starts from 1994.
0
2
4
6
8
10
12 Stamp duty (‰)
A-share
H-share

52
Figure 2 Evolution of Institutional Investor in China
We provide figures below on the evolution of institutional investor in the Chinese stock market.
Information on institutional holding is from WIND database on semi-annual basis from 1999 to 2012. First,
figure 2a reports the time-series evolution of size of institutional investor group in the market. Second,
figure 2b reports the proportion of institutional holding scaled by the market capitalization of entire A-share
market.
0
1000
2000
3000
4000
5000
6000
7000
Nu
mb
er o
f In
stit
uti
on
al
Inv
esto
rs
Fig 2a Size of Institutional Investors Group
0%
10%
20%
30%
40%
50%
60%
% o
f M
ark
et C
ap
tia
liza
tio
n
Fig 2b Institutional Ownership of A-share Market
Approx. level of
institutional share in US
stock market in 1975 as in Jones and Seguin (1997)

53
Fig 3 Double difference in price volatility of different event windows
Figures below show the double difference in price volatility of treatment group (A-shares) against control
group (H-shares) regards to different stamp duty change events over different event windows. Double
difference in price volatility is constructed as
. For event m, price volatility is
constructed followed Jones and Seguin (1997) as √ | |, where is the daily return of stock i and
at day t. Graphs for different event windows are provided as well. X-axis represents the magnitude of the
stamp duty adjustment, while y-axis represents the double difference of price volatility as a response to the
stamp duty adjustment.
12-May -97
12-Jun-98
16-Nov-01
23-Jan-05
30-May-07 24-Apr-08
19-Sep-08
-0.0500
-0.0400
-0.0300
-0.0200
-0.0100
0.0000
0.0100
0.0200
0.0300
-5 -4 -3 -2 -1 0 1 2 3 4 5
Do
ub
le d
iffe
ren
ce
in p
ric
e v
ola
tili
ty
Stamp duty change (‰)
fig 3.1 Double difference in 1year-price volatility
A-Share stamp duty events
12-May -97
12-Jun-98
16-Nov-01
23-Jan-05
30-May-07
24-Apr-08
19-Sep-08
-0.0500
-0.0400
-0.0300
-0.0200
-0.0100
0.0000
0.0100
0.0200
0.0300
-5 -4 -3 -2 -1 0 1 2 3 4 5
Do
ub
le d
iffe
ren
ce
in p
ric
e v
ola
tili
ty
Stamp duty change (‰)
fig 3.2 Double difference in 6 month-price volatility
A-Share stamp duty events
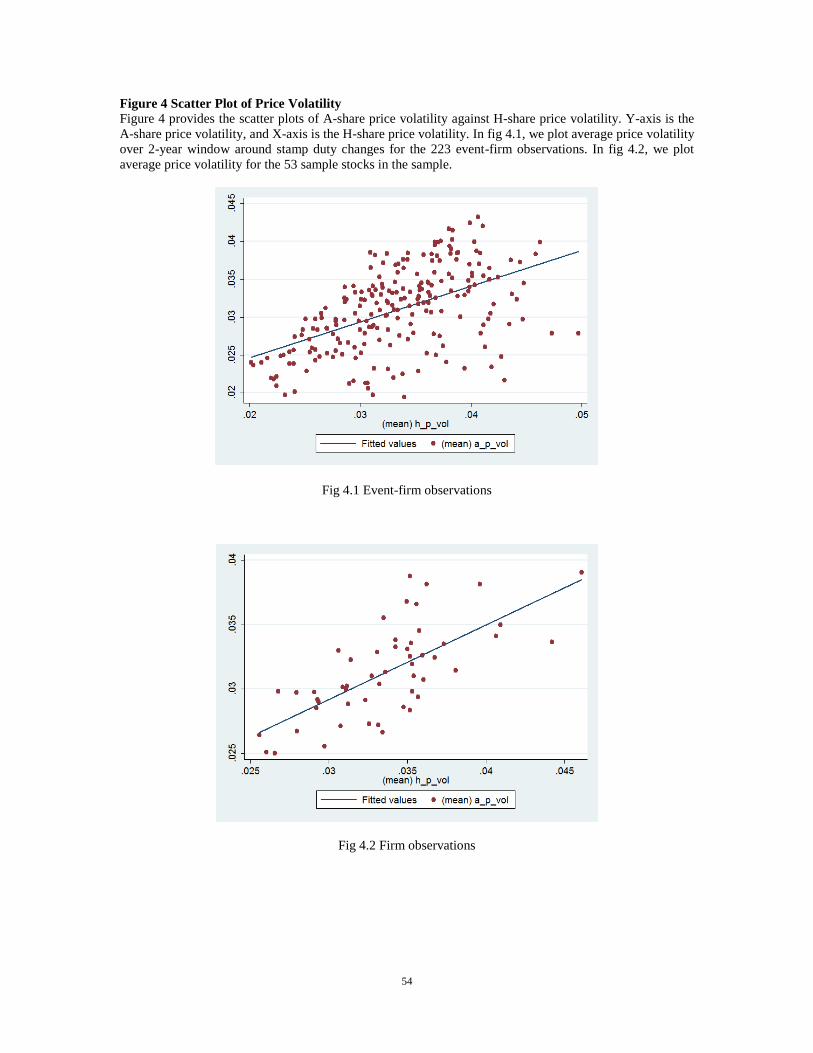
54
Figure 4 Scatter Plot of Price Volatility
Figure 4 provides the scatter plots of A-share price volatility against H-share price volatility. Y-axis is the
A-share price volatility, and X-axis is the H-share price volatility. In fig 4.1, we plot average price volatility
over 2-year window around stamp duty changes for the 223 event-firm observations. In fig 4.2, we plot
average price volatility for the 53 sample stocks in the sample.
Fig 4.1 Event-firm observations
Fig 4.2 Firm observations
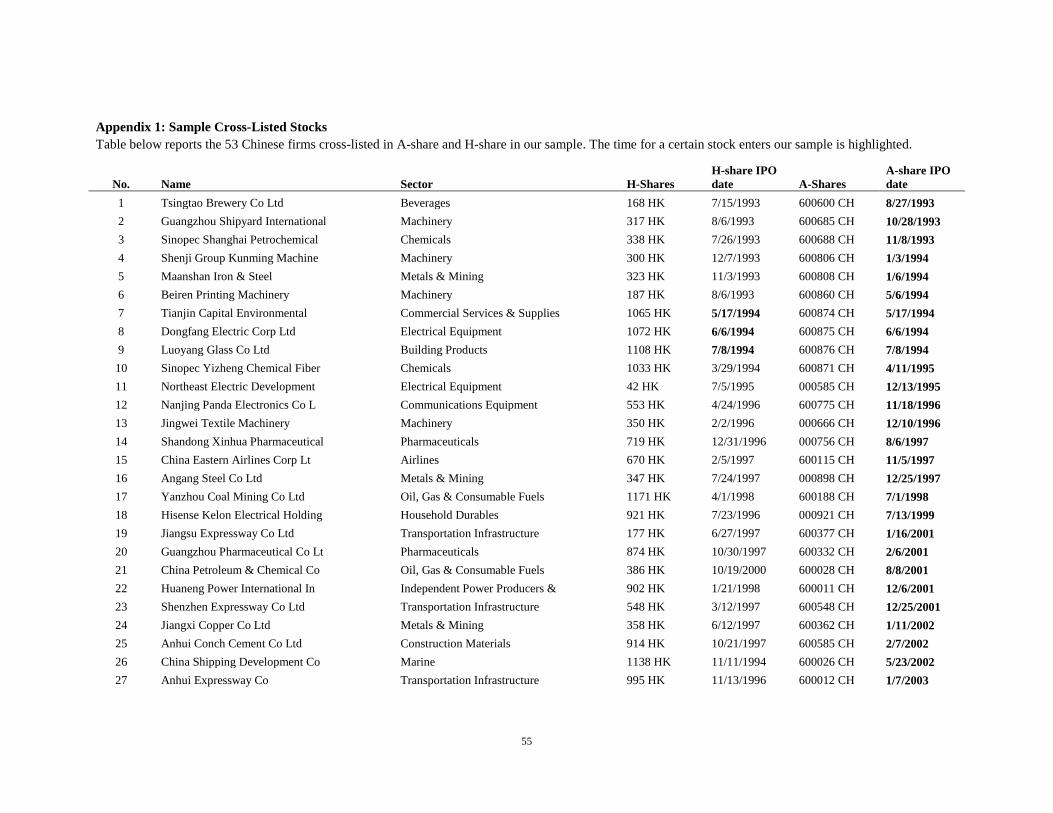
55
Appendix 1: Sample Cross-Listed Stocks
Table below reports the 53 Chinese firms cross-listed in A-share and H-share in our sample. The time for a certain stock enters our sample is highlighted.
No. Name Sector H-Shares
H-share IPO
date A-Shares
A-share IPO
date
1 Tsingtao Brewery Co Ltd Beverages 168 HK 7/15/1993 600600 CH 8/27/1993
2 Guangzhou Shipyard International Machinery 317 HK 8/6/1993 600685 CH 10/28/1993
3 Sinopec Shanghai Petrochemical Chemicals 338 HK 7/26/1993 600688 CH 11/8/1993
4 Shenji Group Kunming Machine Machinery 300 HK 12/7/1993 600806 CH 1/3/1994
5 Maanshan Iron & Steel Metals & Mining 323 HK 11/3/1993 600808 CH 1/6/1994
6 Beiren Printing Machinery Machinery 187 HK 8/6/1993 600860 CH 5/6/1994
7 Tianjin Capital Environmental Commercial Services & Supplies 1065 HK 5/17/1994 600874 CH 5/17/1994
8 Dongfang Electric Corp Ltd Electrical Equipment 1072 HK 6/6/1994 600875 CH 6/6/1994
9 Luoyang Glass Co Ltd Building Products 1108 HK 7/8/1994 600876 CH 7/8/1994
10 Sinopec Yizheng Chemical Fiber Chemicals 1033 HK 3/29/1994 600871 CH 4/11/1995
11 Northeast Electric Development Electrical Equipment 42 HK 7/5/1995 000585 CH 12/13/1995
12 Nanjing Panda Electronics Co L Communications Equipment 553 HK 4/24/1996 600775 CH 11/18/1996
13 Jingwei Textile Machinery Machinery 350 HK 2/2/1996 000666 CH 12/10/1996
14 Shandong Xinhua Pharmaceutical Pharmaceuticals 719 HK 12/31/1996 000756 CH 8/6/1997
15 China Eastern Airlines Corp Lt Airlines 670 HK 2/5/1997 600115 CH 11/5/1997
16 Angang Steel Co Ltd Metals & Mining 347 HK 7/24/1997 000898 CH 12/25/1997
17 Yanzhou Coal Mining Co Ltd Oil, Gas & Consumable Fuels 1171 HK 4/1/1998 600188 CH 7/1/1998
18 Hisense Kelon Electrical Holding Household Durables 921 HK 7/23/1996 000921 CH 7/13/1999
19 Jiangsu Expressway Co Ltd Transportation Infrastructure 177 HK 6/27/1997 600377 CH 1/16/2001
20 Guangzhou Pharmaceutical Co Lt Pharmaceuticals 874 HK 10/30/1997 600332 CH 2/6/2001
21 China Petroleum & Chemical Co Oil, Gas & Consumable Fuels 386 HK 10/19/2000 600028 CH 8/8/2001
22 Huaneng Power International In Independent Power Producers & 902 HK 1/21/1998 600011 CH 12/6/2001
23 Shenzhen Expressway Co Ltd Transportation Infrastructure 548 HK 3/12/1997 600548 CH 12/25/2001
24 Jiangxi Copper Co Ltd Metals & Mining 358 HK 6/12/1997 600362 CH 1/11/2002
25 Anhui Conch Cement Co Ltd Construction Materials 914 HK 10/21/1997 600585 CH 2/7/2002
26 China Shipping Development Co Marine 1138 HK 11/11/1994 600026 CH 5/23/2002
27 Anhui Expressway Co Transportation Infrastructure 995 HK 11/13/1996 600012 CH 1/7/2003
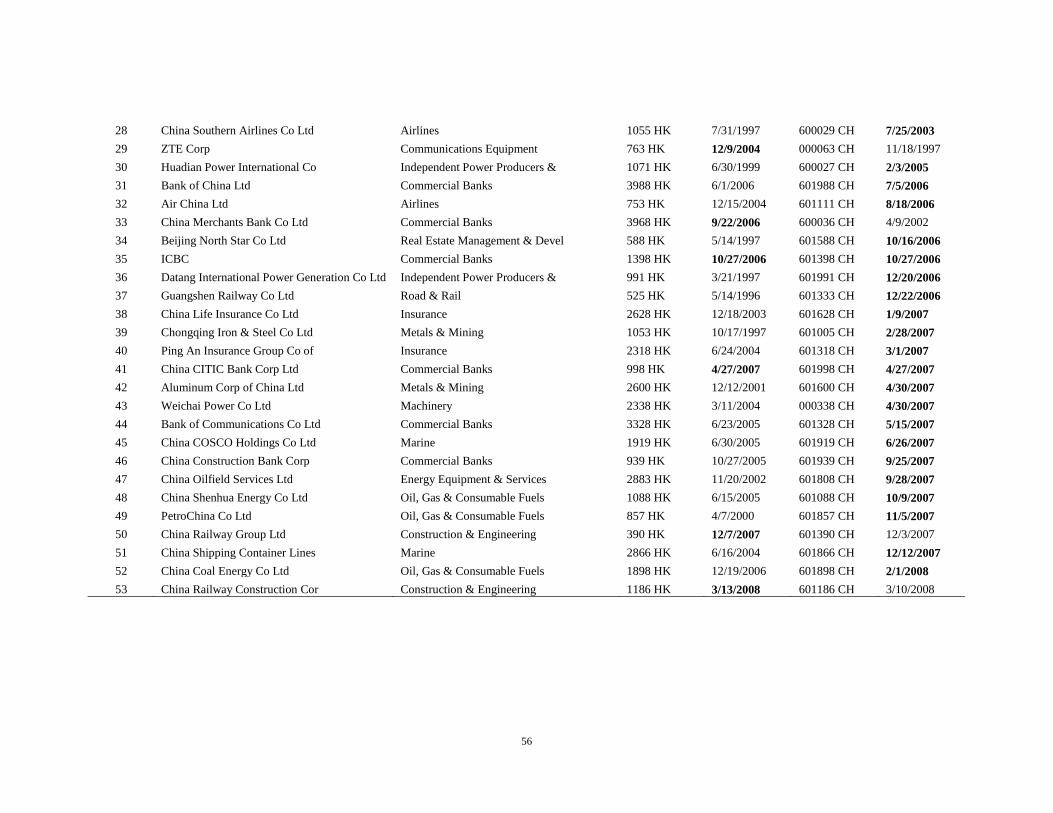
56
28 China Southern Airlines Co Ltd Airlines 1055 HK 7/31/1997 600029 CH 7/25/2003
29 ZTE Corp Communications Equipment 763 HK 12/9/2004 000063 CH 11/18/1997
30 Huadian Power International Co Independent Power Producers & 1071 HK 6/30/1999 600027 CH 2/3/2005
31 Bank of China Ltd Commercial Banks 3988 HK 6/1/2006 601988 CH 7/5/2006
32 Air China Ltd Airlines 753 HK 12/15/2004 601111 CH 8/18/2006
33 China Merchants Bank Co Ltd Commercial Banks 3968 HK 9/22/2006 600036 CH 4/9/2002
34 Beijing North Star Co Ltd Real Estate Management & Devel 588 HK 5/14/1997 601588 CH 10/16/2006
35 ICBC Commercial Banks 1398 HK 10/27/2006 601398 CH 10/27/2006
36 Datang International Power Generation Co Ltd Independent Power Producers & 991 HK 3/21/1997 601991 CH 12/20/2006
37 Guangshen Railway Co Ltd Road & Rail 525 HK 5/14/1996 601333 CH 12/22/2006
38 China Life Insurance Co Ltd Insurance 2628 HK 12/18/2003 601628 CH 1/9/2007
39 Chongqing Iron & Steel Co Ltd Metals & Mining 1053 HK 10/17/1997 601005 CH 2/28/2007
40 Ping An Insurance Group Co of Insurance 2318 HK 6/24/2004 601318 CH 3/1/2007
41 China CITIC Bank Corp Ltd Commercial Banks 998 HK 4/27/2007 601998 CH 4/27/2007
42 Aluminum Corp of China Ltd Metals & Mining 2600 HK 12/12/2001 601600 CH 4/30/2007
43 Weichai Power Co Ltd Machinery 2338 HK 3/11/2004 000338 CH 4/30/2007
44 Bank of Communications Co Ltd Commercial Banks 3328 HK 6/23/2005 601328 CH 5/15/2007
45 China COSCO Holdings Co Ltd Marine 1919 HK 6/30/2005 601919 CH 6/26/2007
46 China Construction Bank Corp Commercial Banks 939 HK 10/27/2005 601939 CH 9/25/2007
47 China Oilfield Services Ltd Energy Equipment & Services 2883 HK 11/20/2002 601808 CH 9/28/2007
48 China Shenhua Energy Co Ltd Oil, Gas & Consumable Fuels 1088 HK 6/15/2005 601088 CH 10/9/2007
49 PetroChina Co Ltd Oil, Gas & Consumable Fuels 857 HK 4/7/2000 601857 CH 11/5/2007
50 China Railway Group Ltd Construction & Engineering 390 HK 12/7/2007 601390 CH 12/3/2007
51 China Shipping Container Lines Marine 2866 HK 6/16/2004 601866 CH 12/12/2007
52 China Coal Energy Co Ltd Oil, Gas & Consumable Fuels 1898 HK 12/19/2006 601898 CH 2/1/2008
53 China Railway Construction Cor Construction & Engineering 1186 HK 3/13/2008 601186 CH 3/10/2008

57
Appendix 2: Interest Rate Adjustments
The table shows accumulative change in the base rate within 1 year window before and after the stamp duty
adjustment events in mainland China and Hong Kong respectively.
Change in Base
Interest Rate (%
per annum)
Date Activities China HK
Panel A: Historical adjustments of stamp duty on stock trading in China
12-May-97 Trading stamp tax increased to 5‰ from 3‰ pre-event -1.71 0.25
post-event -2.25 0.75
12-Jun-98 Trading stamp tax reduced to 4‰ from 5‰ pre-event -2.25 0.75
post-event -2.97 -0.75
16-Nov-01 Trading stamp tax reduced to 2‰ from 4‰ pre-event 0 -4.00
post-event -0.27 -1.25
23-Jan-05 Trading stamp tax reduced to 1‰ from 2‰ pre-event 0.27 3.75
post-event 0 2.00
30-May-07 Trading stamp tax increased to 3‰ from 1‰ pre-event 0.81 0.50
post-event 1.08 -3.25
24-Apr-08 Trading stamp tax reduced to 1‰ from 3‰ pre-event 1.35 -3.00
post-event -1.89 -3.25
19-Sep-08
Trading stamp tax for buyer abolished, while stamp tax for seller
remains at 1‰ pre-event 0.27 -3.25
post-event -1.89 -3.00
Panel B: Historical adjustments of stamp tax on stock trading in Hong Kong
1-Apr-98 Trading stamp tax reduced to 1.25‰ from 1.5‰ pre-event -2.25 0.75
post-event -2.97 -0.75
7-Apr-00 Trading stamp tax reduced to 1.125‰ from 1.25‰ pre-event -1.53 1.25
post-event 0 -1.50
1-Sep-01 Trading stamp tax reduced to 1‰ from 1.125‰ pre-event -0.27 -3.00
post-event 0 -1.75
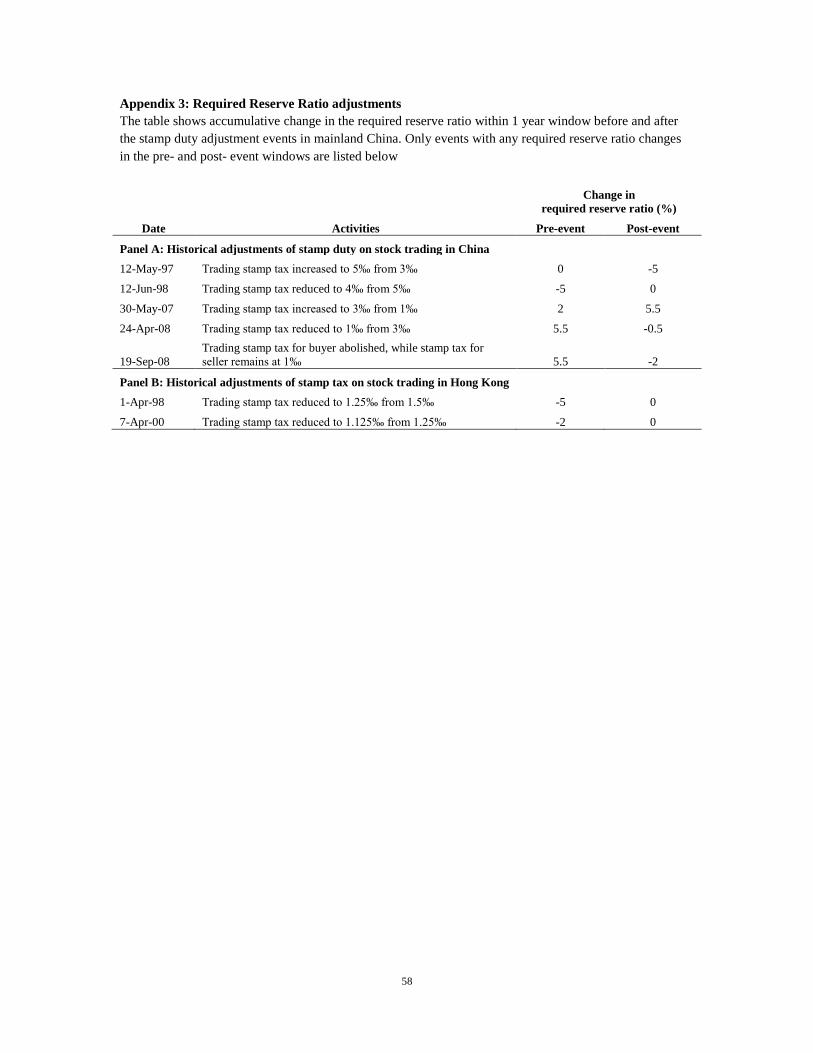
58
Appendix 3: Required Reserve Ratio adjustments
The table shows accumulative change in the required reserve ratio within 1 year window before and after
the stamp duty adjustment events in mainland China. Only events with any required reserve ratio changes
in the pre- and post- event windows are listed below
Change in
required reserve ratio (%)
Date Activities Pre-event Post-event
Panel A: Historical adjustments of stamp duty on stock trading in China
12-May-97 Trading stamp tax increased to 5‰ from 3‰ 0 -5
12-Jun-98 Trading stamp tax reduced to 4‰ from 5‰ -5 0
30-May-07 Trading stamp tax increased to 3‰ from 1‰ 2 5.5
24-Apr-08 Trading stamp tax reduced to 1‰ from 3‰ 5.5 -0.5
19-Sep-08
Trading stamp tax for buyer abolished, while stamp tax for
seller remains at 1‰ 5.5 -2
Panel B: Historical adjustments of stamp tax on stock trading in Hong Kong
1-Apr-98 Trading stamp tax reduced to 1.25‰ from 1.5‰ -5 0
7-Apr-00 Trading stamp tax reduced to 1.125‰ from 1.25‰ -2 0
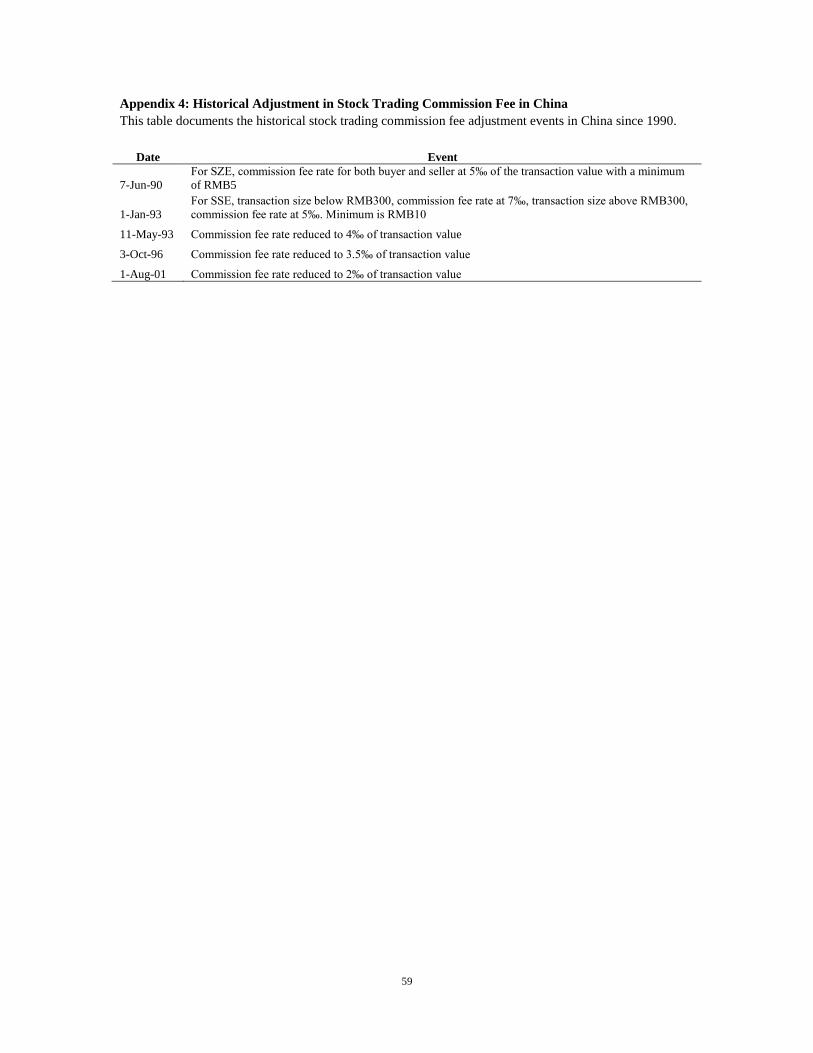
59
Appendix 4: Historical Adjustment in Stock Trading Commission Fee in China
This table documents the historical stock trading commission fee adjustment events in China since 1990.
Date Event
7-Jun-90
For SZE, commission fee rate for both buyer and seller at 5‰ of the transaction value with a minimum
of RMB5
1-Jan-93
For SSE, transaction size below RMB300, commission fee rate at 7‰, transaction size above RMB300,
commission fee rate at 5‰. Minimum is RMB10
11-May-93 Commission fee rate reduced to 4‰ of transaction value
3-Oct-96 Commission fee rate reduced to 3.5‰ of transaction value
1-Aug-01 Commission fee rate reduced to 2‰ of transaction value

60
Appendix 5: Hang Seng A-H Premium Index
Hang Seng China A-H Premium Index tracks the price premium (or discount) of A-shares to H-shares. The
higher the index, the higher the premium of A-shares over H=shares, and vice versa. Index base equals to
100 and for example, an index value of 133 means that A-shares are price at 33% premium to H-shares.
Shadow areas mark the 3-month window after the stamp duty adjustments on 30-May-2007, 24-Apr-2008
and 19-Sep-2008. The data source is Bloomberg.
0
50
100
150
200
250
Jan-06 Jan-07 Jan-08 Jan-09 Jan-10 Jan-11 Jan-12 Jan-13
Index value Hang Seng A-H Premium Index

61
Appendix 6: Double Difference in Share Turnover and Return
Figures below show the double difference in share turnover and return of treatment group (A-share) against
control group (H-share) regards to different stamp duty change events over different event windows.
Double difference in price volatility is constructed as
. Double difference in price volatility is constructed as
. Share turnover is calculated as
for stock i at day t, while
price level is measured with daily return . X-axis represents the magnitude of the stamp duty
adjustment, while y-axis represents the double difference of each variable respectively as a response to the
stamp duty adjustment.
12-May -97
12-Jun-98
16-Nov-01
23-Jan-05
30-May-07
24-Apr-08 19-Sep-08
-0.0200
-0.0150
-0.0100
-0.0050
0.0000
0.0050
0.0100
0.0150
-5 -4 -3 -2 -1 0 1 2 3 4 5
Do
ub
le d
iffe
ren
ce
in t
urn
over
Stamp duty change (‰)
Appendix 6.1 Double difference in 1year-turnover
A-Share stamp duty events
12-May -97
12-Jun-98
16-Nov-01
23-Jan-05
30-May-07
24-Apr-08 19-Sep-08
-0.0140
-0.0120
-0.0100
-0.0080
-0.0060
-0.0040
-0.0020
0.0000
0.0020
0.0040
0.0060
-5 -4 -3 -2 -1 0 1 2 3 4 5
Do
ub
le d
iffe
ren
ce
in d
ail
y r
etu
rn
Stamp duty change (‰)
Appendix 6.2 Double difference in 1year-price level
A-Share stamp duty events

62
Appendix 7: Portfolio Price Volatility, Share Turnover, and Return
Below shows the double difference in price volatility, share turnover, and return of equally weighted
portfolios formed with our sample firms. First, for each event, we form portfolios and then we calculate the
double difference of these 3 variables as respectively. 1-
year time window before and after the stamp duty event date is considered. X-axis represents the magnitude
of the stamp duty adjustment, while y-axis represents the double difference of each variable respectively as
a response to the stamp duty adjustment.
12-May -97
12-Jun-98
16-Nov-01
23-Jan-05
30-May-07
24-Apr-08 19-Sep-08
-0.03
-0.025
-0.02
-0.015
-0.01
-0.005
0
0.005
0.01
0.015
0.02
-5 -4 -3 -2 -1 0 1 2 3 4 5
Do
ub
le d
iffe
ren
ce
in p
ric
e v
ola
tili
ty
Stamp duty change (‰)
Appendix 7.1 Double difference in equal weighted portfolio price volatility
A-Share stamp duty events
12-May -97
12-Jun-98
16-Nov-01
23-Jan-05
30-May-07
24-Apr-08 19-Sep-08
-0.0200
-0.0150
-0.0100
-0.0050
0.0000
0.0050
0.0100
0.0150
-5 -4 -3 -2 -1 0 1 2 3 4 5
Do
ub
le d
iffe
ren
ce
in t
urn
over
Stamp duty change (‰)
Appendix 7.2 Double difference in equal weighted portfolio turnover
A-Share stamp duty events
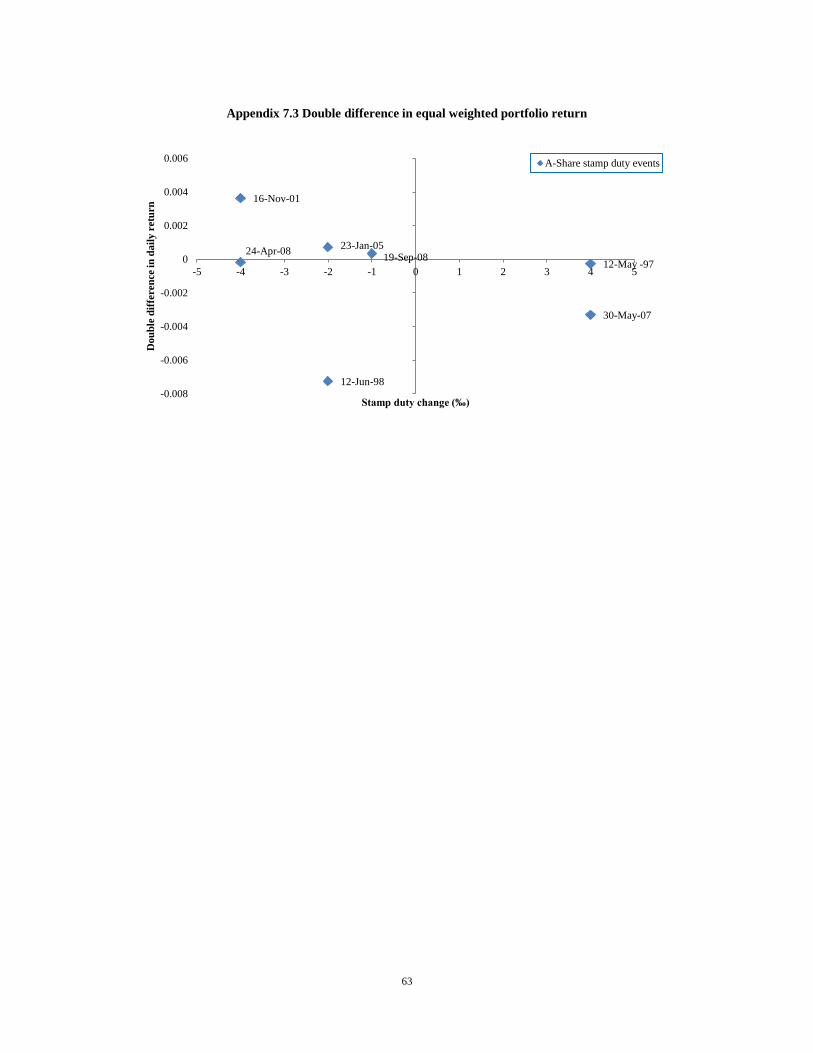
63
12-May -97
12-Jun-98
16-Nov-01
23-Jan-05
30-May-07
24-Apr-08 19-Sep-08
-0.008
-0.006
-0.004
-0.002
0
0.002
0.004
0.006
-5 -4 -3 -2 -1 0 1 2 3 4 5
Do
ub
le d
iffe
ren
ce
in d
ail
y r
etu
rn
Stamp duty change (‰)
Appendix 7.3 Double difference in equal weighted portfolio return
A-Share stamp duty events

64
Appendix 8: Price Volatility, Share Turnover, and Return across Institutional Ownership Groups
Figures below show the double difference in price volatility and share turnover of sample firms for high
and low institutional ownership groups respectively. Information on institutional ownership for sample
stocks is obtained from Wind database. Institution ownership groups are divided according to absolute
cutoff as shown in the graphs. For each event, we calculate the double difference of these 2 variables as
respectively. 1-year time window before and after the
stamp duty event date is considered. X-axis represents the magnitude of the stamp duty adjustment, while
y-axis represents the double difference of each variable respectively as a response to the stamp duty
adjustment.
12-May -97
12-Jun-98 16-Nov-01
23-Jan-05
30-May-07
24-Apr-08
19-Sep-08
30-May-07
-0.05
-0.04
-0.03
-0.02
-0.01
0
0.01
0.02
0.03
-5 -4 -3 -2 -1 0 1 2 3 4 5
Do
ub
le d
iffe
ren
ce
in p
ric
e v
ola
tili
ty
Stamp duty change (‰)
Appendix 8.1 Double difference in 1yr-price volatility
Institutional ownership [0%, 5%)
Institutional ownership [5%, 10%)
Institutional ownership [10%, 25%)
Institutional ownership [25%, 100%]
12-May -97
12-Jun-98
16-Nov-01
23-Jan-05
30-May-07
24-Apr-08 19-Sep-08
-0.02
-0.015
-0.01
-0.005
0
0.005
0.01
0.015
-5 -4 -3 -2 -1 0 1 2 3 4 5
Do
ub
le d
iffe
ren
ce
in p
ric
e v
ola
tili
ty
Stamp duty change (‰)
Appendix 8.2 Double difference in 1yr-share turnover
Institutional ownership [0%, 5%)
Institutional ownership [5%, 10%)
Institutional ownership [10%, 25%)
Institutional ownership [25%, 100%]