once upon a crime: towards crime prediction from ... · once upon a crime: towards crime prediction...
TRANSCRIPT

Once Upon a Crime: Towards Crime Prediction
from Demographics and Mobile Data
Andrey Bogomolov†, Bruno Lepri§, Jacopo Staiano†,Nuria Oliver‡, Fabio Pianesi§, Alex Pentland]
†University of Trento (Italy)‡Telefonica Research, Barcellona (Spain)
§Fondazione Bruno Kessler, Trento (Italy)]MIT Media Lab, Cambridge, MA (United States)
Abstract
In this paper, we present a novel approach to predict crime in a geographic space from multiple data sources, inparticular mobile phone and demographic data. The main contribution of the proposed approach lies in using ag-gregated and anonymized human behavioral data derived from mobile network activity to tackle the crime predictionproblem. While previous research efforts have used either background historical knowledge or offenders’ profiling,our findings support the hypothesis that aggregated human behavioral data captured from the mobile network infras-tructure, in combination with basic demographic information, can be used to predict crime. In our experimentalresults with real crime data from London we obtain an accuracy of almost 70% when predicting whether a specificarea in the city will be a crime hotspot or not. Moreover, we provide a discussion of the implications of our findingsfor data-driven crime analysis.
I. Introduction
Crime, in all its facets, is a well-known social prob-lem affecting the quality of life and the economic de-velopment of a society. Studies have shown that crimetends to be associated with slower economic growth atboth the national level [24] and the local level, such ascities and metropolitan areas [12]. Crime-related infor-mation has always attracted the attention of criminallaw and sociology scholars. Dating back to the begin-ning of the 20th century, studies have focused on thebehavioral evolution of criminals and its relations withspecific characteristics of the neighborhoods in whichthey grew up, lived, and acted.
The study of the impact on behavioral developmentof factors like exposure to specific peer networks, neigh-borhood characteristics (e.g. presence/absence of recre-ational/educational facilities) and poverty indexes, hasprovided a wealth of knowledge from both individualand collective standpoints [44]. Existing works in thefields of criminology, sociology, psychology and eco-nomics tend to mainly explore relationships betweencriminal activity and socio-economic variables such aseducation [17], ethnicity [6], income level [26], and un-employment [19].
Several studies in criminology and sociology have pro-vided evidence of significant concentrations of crime at
micro levels of geography, regardless of the specific unitof analysis defined [7, 46]. It is important to note thatsuch clustering of crime in small geographic areas (e.g.streets), commonly referred to as hotspots, does not nec-essarily align with trends that are occurring at a largergeographic level, such as communities. Research hasshown, for example, that in what are generally seen asgood parts of town there are often streets with strongcrime concentrations, and in what are often defined asbad neighborhoods, many places are relatively free ofcrime [46].
In 2008, criminologist David Weisburd proposed toswitch the popular people-centric paradigm of policepractices to a place-centric one [45], thus focusing ongeographical topology and micro-structures rather thanon criminal profiling. In our paper, crime prediction isused in conjunction with a place-centric definition of theproblem and with a data-driven approach: we specifi-cally investigate the predictive power of aggregated andanonymized human behavioral data derived from a mul-timodal combination of mobile network activity anddemographic information to determine whether a ge-ographic area is likely to become a scene of the crimeor not.
As the number of mobile phones actively in use world-
1
arX
iv:1
409.
2983
v1 [
cs.C
Y]
10
Sep
2014

wide approaches the 6.8 billion mark1, they become avery valuable and unobtrusive source of human behav-ioral data: mobile phones can be seen as sensors of ag-gregated human activity [14, 23] and have been used tomonitor citizens’ mobility patterns and urban interac-tions [21, 48], to understand individual spending behav-iors [33], to infer people’s traits [13, 37] and states [3], tomap and model the spreading of diseases such as malaria[47] and H1N1 flu [20], and to predict and understandsocio-economic indicators of territories [15, 36, 34]. Re-cently, Zheng et al. proposed a multi-source approach,based on human mobility and geographical data, to in-fer noise pollution [49] and gas consumption [29] in largemetropolitan areas.
In this paper, we use human behavioral data derivedfrom a combination of mobile network activity and de-mography, together with open data related to crimeevents to predict crime hotspots in specific neighbor-hoods of a European metropolis: London. The maincontributions of this work are:
1. The use of human behavioral data derived fromanonymized and aggregated mobile network activ-ity, combined with demographics, to predict crimehotspots in a European metropolis.
2. A comprehensive analysis of the predictive power ofthe proposed model and a comparison with a state-of-the-art approach based on official statistics.
3. A discussion of the theoretical and practical impli-cations of our proposed approach.
This paper is structured as follows: section II de-scribes relevant previous work in the area of data-drivencrime prediction; the data used for our experiments aredescribed in section III; the definition of the researchproblem tackled in this work and detailed informationon the methodology adopted is provided in IV; finally,we report our experimental results and provide a dis-cussion thereof in sections V and VI, respectively.
II. Related Work
Researchers have devoted attention to the study of crim-inal behavior dynamics both from a people- and place-centric perspective. The people-centric perspective hasmostly been used for individual or collective criminalprofiling. Wang et al. [42] proposed Series Finder, amachine learning approach to the problem of detectingspecific patterns in crimes that are committed by thesame offender or group of offenders. In [31], it is pro-posed a biased random walk model built upon empiri-cal knowledge of criminal offenders behavior along with
1http://www.itu.int
spatio-temporal crime information to take into accountrepeating patterns in historical crime data. Further-more, Ratcliffe [28] investigated the spatio-temporalconstraints underlying offenders’ criminal behavior.
An example of a place-centric perspective is crimehotspot detection and analysis and the consequentderivation of useful insights. A novel application ofquantitative tools from mathematics, physics and sig-nal processing has been proposed by Toole et al. [39]to analyse spatial and temporal patterns in criminaloffense records. The analyses they conducted on adataset containing crime information from 1991 to 1999for the city of Philadelphia, US, indicated the existenceof multi-scale complex relationships both in space andtime. Using demographic information statistics at com-munity (town) level, Buczak and Gifford [9] appliedfuzzy association rule mining in order to derive a fi-nite (and consistent among US states) set of rules to beapplied by crime analysts. Other common models arethe ones proposed by Eck et al. [16] and by Chaineyet al. [11] that rely on kernel density estimation fromthe criminal history record of a geographical area. Sim-ilarly, Mohler et al. [25] applied the self-exciting pointprocess model (previously developed for earthquake pre-diction) as a model of crime. The major problem of allthese approaches is that they relies on the prior occur-rence of crimes in a particular area and thus cannotgeneralize to previously unobserved areas.
More recently, the proliferation of social media hassparked interest in using this kind of data to predicta variety of variables, including electoral outcomes [40]and market trends [4]. In this line, Wang et al. [43]proposed the usage of social media to predict criminalincidents. Their approach relies on a semantic analysisof tweets using natural language processing along withspatio-temporal information derived from neighborhooddemographic data and the tweets metadata.
In this paper, we tackle the crime hotspot forecast-ing problem by leveraging mobile network activity asa source of human behavioral data. Our work hencecomplements the above-mentioned research efforts andcontributes to advance the state-of-the-art in quantita-tive criminal studies.
III. Datasets
The datasets we exploit in this paper were providedduring a public competition - the Datathon for SocialGood - organized by Telefonica Digital, The Open DataInstitute and MIT during the Campus Party Europe2013 at the O2 Arena in London in September 2013.
Participants were provided access to the followingdata, among others:
2

• Anonymized and aggregated human behavioraldata computed from mobile network activity in theLondon Metropolitan Area. We shall refer to thisdata as the Smartsteps dataset, because it was de-rived from Telefonica Digital’s Smartsteps prod-uct2. A sample visualization of the Smartstepsproduct can be seen in Figure 1;
• Geo-localised Open Data, a collection of openlyavailable datasets with varying temporal granular-ity. This includes reported criminal cases, resi-dential property sales, transportation, weather andLondon borough profiles related to homelessness,households, housing market, local government fi-nance and societal wellbeing (a total of 68 metrics).
We turn now to describing the specific datasets thatwe used to predict crime hotspots.
A. Smartsteps Dataset
The Smartsteps dataset consists of a geographic divi-sion of the London Metropolitan Area into cells whoseprecise location (lat,long) and surface area is provided.Note that the actual shape of the cell was not provided.In total, there were 124119 cells. We shall refer to thesecells as the Smartsteps cells.
For each of the Smartsteps cells, a variety of demo-graphic variables were provided, computed every hourfor a 3-week period, from December 9th to 15th, 2012and from December 23rd, 2012 to January 5th, 2013.
In particular:
(1) Footfall, or the estimated number of people withineach cell. This estimation is derived from the mobilenetwork activity by aggregating every hour the totalnumber of unique phonecalls in each cell tower, mappingthe cell tower coverage areas to the Smartsteps cells,and extrapolating to the general population –by takinginto account the market share of the network in eachcell location; and
(2) an estimation of gender, age andhome/work/visitor group splits.
That is, for each Smartsteps cell and for each hour,the dataset contains an estimation of how many peopleare in the cell, the percentage of these people who are athome, at work or just visiting the cell and their genderand age splits in the following brackets: 0-20 years, 21-30 years, 31-40 years, etc..., as shown in Table 1.
2http://dynamicinsights.telefonica.com/488/smart-steps
Table 1: SmartSteps data provided by the challenge orga-nizers. All data refer to 1-hour intervals and toeach Smartsteps cell.
Type Data
Origin-based
total # people# residents# workers# visitors
Gender-based# males
# females
Age-based
# people aged up to 20# people aged 21 to 30# people aged 31 to 40# people aged 41 to 50# people aged 51 to 60# people aged over 60
Figure 1 shows a sample visualization of the informa-tion made available from the SmartSteps platform.
B. Criminal Cases Dataset
The criminal cases dataset includes the geo-location ofall reported crimes in the UK but does not specify theirexact date, just the month and year. The data providedin the public competition included the criminal cases forDecember 2012 and January 2013.
In detail, the crime dataset includes: the crime ID,the month and year when the crime was committed,its location (longitude, latitude, and address where thecrime took place), the police department involved, thelower layer super output area code, the lower layer su-per output area name and its type out of 11 possibletypes (e.g. anti-social behavior, burglary, violent crime,shoplifting, etc.).
Lower Layer Super Output Areas (LSOAs) are smallgeographical areas defined by the United Kingdom Of-fice for National Statistics following the 2001 census.Their aim here is to define areas, based on populationlevels, whose boundaries would not change over time.LSOAs are the smallest type of output areas used forofficial statistics, have a mean population of 1,500 anda minimum population threshold of 1,000.
The ground truth crime data used in our experimentscorresponds to the crimes reported in January 2013 foreach of the Smartsteps cells.
C. London Borough Profiles Dataset
The London borough profiles dataset is an official opendataset containing 68 different metrics about the popu-lation of a particular geographic area. The spatial gran-ularity of the bourough profiles data is at the LSOAlevel.
In particular, the information in this dataset in-cludes statistics about the population, households (cen-
3

Figure 1: Sample visualization of the high-level information provided by the Smartsteps platform. By combining aggregatedand anonymized demographics and mobility data, fine-grained spatio-temporal dynamics can be exploited to derivevaluable insights for the scenario of interest.
sus), demographics, migrant population, ethnicity, lan-guage, employment, NEET (Not in Education, Em-ployment, and Training) people, earnings, volunteer-ing, jobs density, business survival, house prices, newhomes, greenspace, recycling, carbon emissions, cars,indices of multiple deprivation, children in out-of-workfamilies, life expectancy, teenage conceptions, happinesslevels, political control (e.g. proportion of seats wonby Labour, LibDem and Conservatives), and electionturnout.
IV. Methodology
We cast the problem of crime hotspot forecasting asa binary classification task. For each Smartsteps cell,we predict whether that particular cell will be a crimehotspot or not in the next month. In this section weprovide details of the experimental setup that we fol-lowed.
A. Data Preprocessing and FeatureExtraction
Starting from the bulk of data described in Section III,we performed the following preprocessing steps.
A.1. Referencing all geo-tagged data to the Smartstepscells
As the SmartSteps cell IDs, the borough profiles and thecrime event locations are not spatially linked in the pro-vided datasets, we first geo-referenced each crime eventby identifying the Smartsteps cell which is the closest to
the location of the crime. We carried out a similar pro-cess for the borough profile dataset. As a result, eachcrime event and the borough profile information werelinked to one of the Smartsteps cells.
A.2. Smartsteps features
Diversity and regularity have been shown to be impor-tant in the characterization of different facets of humanbehavior and, in particular, the concept of entropy hasbeen applied to assess the predictability of mobility [35]and spending patterns [22, 33], the socio-economic char-acteristics of places and cities [15] and some individualtraits such as personality [13]. Hence, for each Smart-steps variable (see Table 1) we computed the mathe-matical functions which characterize the distributionsand information theoretic properties of such variables,e.g. mean, median, standard deviation, min and maxvalues and Shannon entropy.
In order to be able to also account for temporal re-lationships inside the Smartsteps data, the same com-putations as above were repeated on sliding windows ofvariable length (1-hour, 4-hour and 1 day), producingsecond-order features that help reduce computationalcomplexity and the feature space itself, while preserv-ing useful data properties.
A.3. London borough profile features
No data preprocessing was needed for the London bor-ough profiles. Hence, we used the original 68 Londonborough profile features.
4
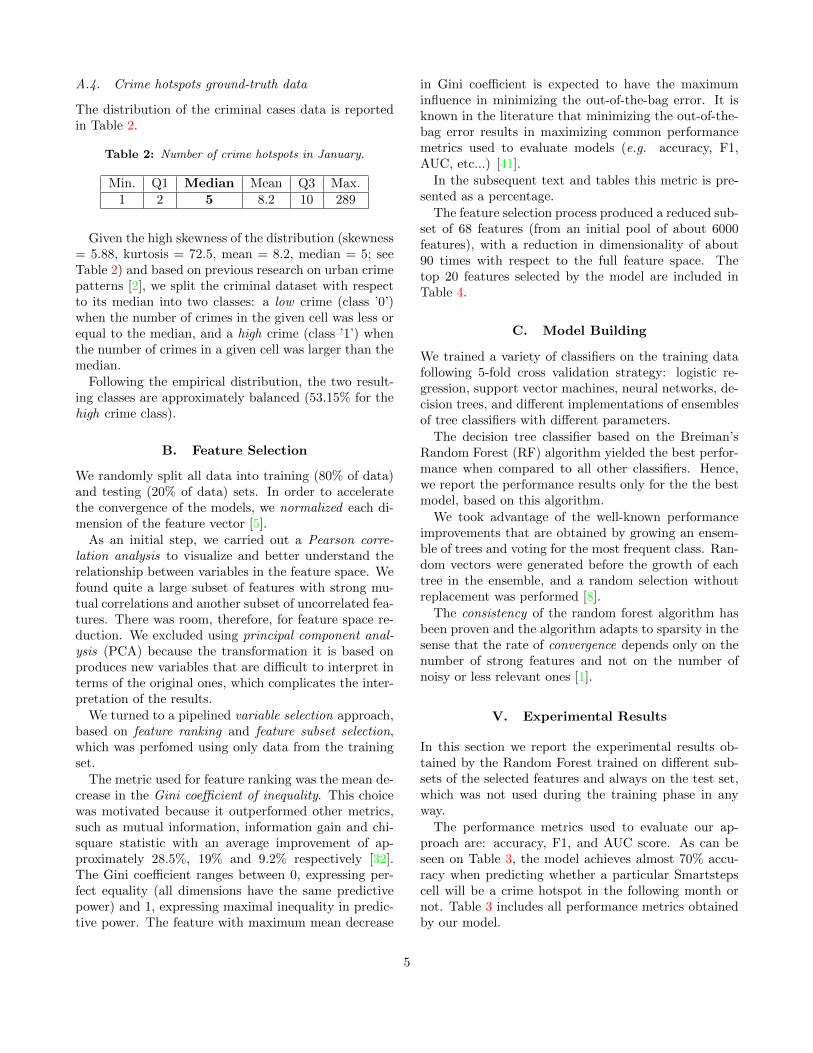
A.4. Crime hotspots ground-truth data
The distribution of the criminal cases data is reportedin Table 2.
Table 2: Number of crime hotspots in January.
Min. Q1 Median Mean Q3 Max.1 2 5 8.2 10 289
Given the high skewness of the distribution (skewness= 5.88, kurtosis = 72.5, mean = 8.2, median = 5; seeTable 2) and based on previous research on urban crimepatterns [2], we split the criminal dataset with respectto its median into two classes: a low crime (class ’0’)when the number of crimes in the given cell was less orequal to the median, and a high crime (class ’1’) whenthe number of crimes in a given cell was larger than themedian.
Following the empirical distribution, the two result-ing classes are approximately balanced (53.15% for thehigh crime class).
B. Feature Selection
We randomly split all data into training (80% of data)and testing (20% of data) sets. In order to acceleratethe convergence of the models, we normalized each di-mension of the feature vector [5].
As an initial step, we carried out a Pearson corre-lation analysis to visualize and better understand therelationship between variables in the feature space. Wefound quite a large subset of features with strong mu-tual correlations and another subset of uncorrelated fea-tures. There was room, therefore, for feature space re-duction. We excluded using principal component anal-ysis (PCA) because the transformation it is based onproduces new variables that are difficult to interpret interms of the original ones, which complicates the inter-pretation of the results.
We turned to a pipelined variable selection approach,based on feature ranking and feature subset selection,which was perfomed using only data from the trainingset.
The metric used for feature ranking was the mean de-crease in the Gini coefficient of inequality. This choicewas motivated because it outperformed other metrics,such as mutual information, information gain and chi-square statistic with an average improvement of ap-proximately 28.5%, 19% and 9.2% respectively [32].The Gini coefficient ranges between 0, expressing per-fect equality (all dimensions have the same predictivepower) and 1, expressing maximal inequality in predic-tive power. The feature with maximum mean decrease
in Gini coefficient is expected to have the maximuminfluence in minimizing the out-of-the-bag error. It isknown in the literature that minimizing the out-of-the-bag error results in maximizing common performancemetrics used to evaluate models (e.g. accuracy, F1,AUC, etc...) [41].
In the subsequent text and tables this metric is pre-sented as a percentage.
The feature selection process produced a reduced sub-set of 68 features (from an initial pool of about 6000features), with a reduction in dimensionality of about90 times with respect to the full feature space. Thetop 20 features selected by the model are included inTable 4.
C. Model Building
We trained a variety of classifiers on the training datafollowing 5-fold cross validation strategy: logistic re-gression, support vector machines, neural networks, de-cision trees, and different implementations of ensemblesof tree classifiers with different parameters.
The decision tree classifier based on the Breiman’sRandom Forest (RF) algorithm yielded the best perfor-mance when compared to all other classifiers. Hence,we report the performance results only for the the bestmodel, based on this algorithm.
We took advantage of the well-known performanceimprovements that are obtained by growing an ensem-ble of trees and voting for the most frequent class. Ran-dom vectors were generated before the growth of eachtree in the ensemble, and a random selection withoutreplacement was performed [8].
The consistency of the random forest algorithm hasbeen proven and the algorithm adapts to sparsity in thesense that the rate of convergence depends only on thenumber of strong features and not on the number ofnoisy or less relevant ones [1].
V. Experimental Results
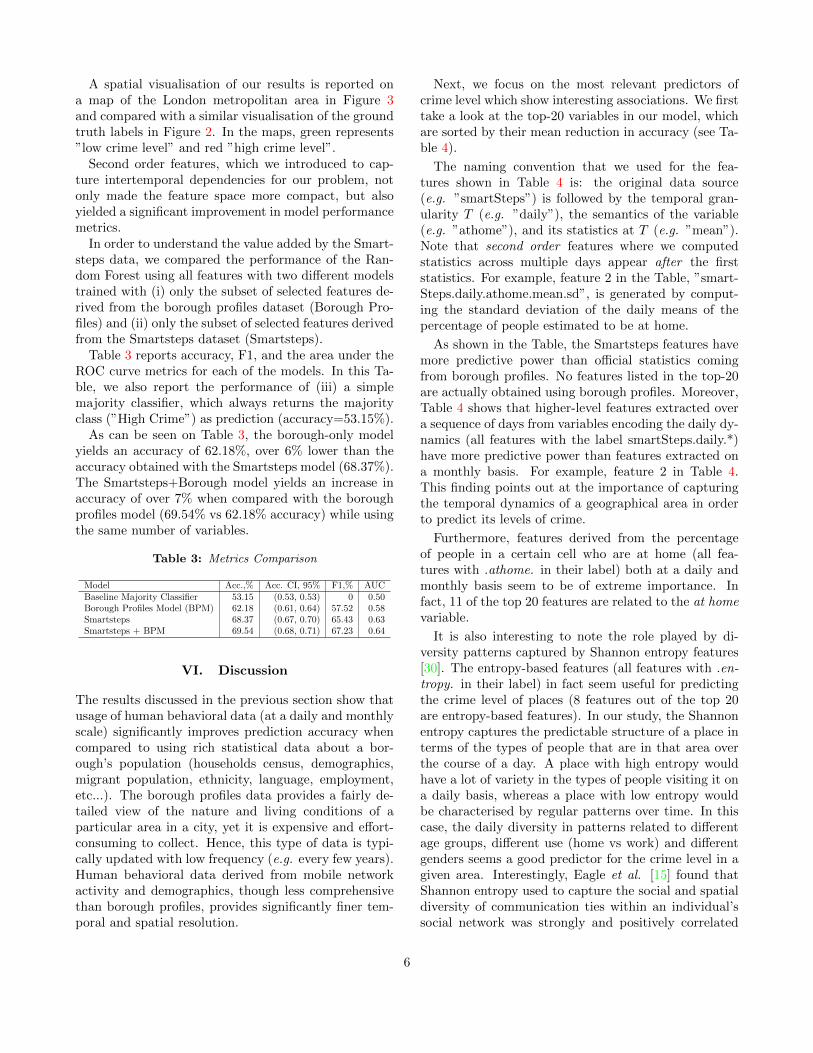
In this section we report the experimental results ob-tained by the Random Forest trained on different sub-sets of the selected features and always on the test set,which was not used during the training phase in anyway.
The performance metrics used to evaluate our ap-proach are: accuracy, F1, and AUC score. As can beseen on Table 3, the model achieves almost 70% accu-racy when predicting whether a particular Smartstepscell will be a crime hotspot in the following month ornot. Table 3 includes all performance metrics obtainedby our model.
5
A spatial visualisation of our results is reported ona map of the London metropolitan area in Figure 3and compared with a similar visualisation of the groundtruth labels in Figure 2. In the maps, green represents”low crime level” and red ”high crime level”.
Second order features, which we introduced to cap-ture intertemporal dependencies for our problem, notonly made the feature space more compact, but alsoyielded a significant improvement in model performancemetrics.
In order to understand the value added by the Smart-steps data, we compared the performance of the Ran-dom Forest using all features with two different modelstrained with (i) only the subset of selected features de-rived from the borough profiles dataset (Borough Pro-files) and (ii) only the subset of selected features derivedfrom the Smartsteps dataset (Smartsteps).
Table 3 reports accuracy, F1, and the area under theROC curve metrics for each of the models. In this Ta-ble, we also report the performance of (iii) a simplemajority classifier, which always returns the majorityclass (”High Crime”) as prediction (accuracy=53.15%).
As can be seen on Table 3, the borough-only modelyields an accuracy of 62.18%, over 6% lower than theaccuracy obtained with the Smartsteps model (68.37%).The Smartsteps+Borough model yields an increase inaccuracy of over 7% when compared with the boroughprofiles model (69.54% vs 62.18% accuracy) while usingthe same number of variables.
Table 3: Metrics Comparison
Model Acc.,% Acc. CI, 95% F1,% AUCBaseline Majority Classifier 53.15 (0.53, 0.53) 0 0.50Borough Profiles Model (BPM) 62.18 (0.61, 0.64) 57.52 0.58Smartsteps 68.37 (0.67, 0.70) 65.43 0.63Smartsteps + BPM 69.54 (0.68, 0.71) 67.23 0.64
VI. Discussion
The results discussed in the previous section show thatusage of human behavioral data (at a daily and monthlyscale) significantly improves prediction accuracy whencompared to using rich statistical data about a bor-ough’s population (households census, demographics,migrant population, ethnicity, language, employment,etc...). The borough profiles data provides a fairly de-tailed view of the nature and living conditions of aparticular area in a city, yet it is expensive and effort-consuming to collect. Hence, this type of data is typi-cally updated with low frequency (e.g. every few years).Human behavioral data derived from mobile networkactivity and demographics, though less comprehensivethan borough profiles, provides significantly finer tem-poral and spatial resolution.
Next, we focus on the most relevant predictors ofcrime level which show interesting associations. We firsttake a look at the top-20 variables in our model, whichare sorted by their mean reduction in accuracy (see Ta-ble 4).
The naming convention that we used for the fea-tures shown in Table 4 is: the original data source(e.g. ”smartSteps”) is followed by the temporal gran-ularity T (e.g. ”daily”), the semantics of the variable(e.g. ”athome”), and its statistics at T (e.g. ”mean”).Note that second order features where we computedstatistics across multiple days appear after the firststatistics. For example, feature 2 in the Table, ”smart-Steps.daily.athome.mean.sd”, is generated by comput-ing the standard deviation of the daily means of thepercentage of people estimated to be at home.
As shown in the Table, the Smartsteps features havemore predictive power than official statistics comingfrom borough profiles. No features listed in the top-20are actually obtained using borough profiles. Moreover,Table 4 shows that higher-level features extracted overa sequence of days from variables encoding the daily dy-namics (all features with the label smartSteps.daily.*)have more predictive power than features extracted ona monthly basis. For example, feature 2 in Table 4.This finding points out at the importance of capturingthe temporal dynamics of a geographical area in orderto predict its levels of crime.
Furthermore, features derived from the percentageof people in a certain cell who are at home (all fea-tures with .athome. in their label) both at a daily andmonthly basis seem to be of extreme importance. Infact, 11 of the top 20 features are related to the at homevariable.
It is also interesting to note the role played by di-versity patterns captured by Shannon entropy features[30]. The entropy-based features (all features with .en-tropy. in their label) in fact seem useful for predictingthe crime level of places (8 features out of the top 20are entropy-based features). In our study, the Shannonentropy captures the predictable structure of a place interms of the types of people that are in that area overthe course of a day. A place with high entropy wouldhave a lot of variety in the types of people visiting it ona daily basis, whereas a place with low entropy wouldbe characterised by regular patterns over time. In thiscase, the daily diversity in patterns related to differentage groups, different use (home vs work) and differentgenders seems a good predictor for the crime level in agiven area. Interestingly, Eagle et al. [15] found thatShannon entropy used to capture the social and spatialdiversity of communication ties within an individual’ssocial network was strongly and positively correlated
6

51.3
51.4
51.5
51.6
51.7
−0.50 −0.25 0.00 0.25lon
lat
Crime Level01
Radius0.51.01.5
Figure 2: Ground Truth of Crime Hotspots
51.3
51.4
51.5
51.6
51.7
−0.50 −0.25 0.00 0.25lon
lat
Crime Level01
Radius0.51.01.5
Figure 3: Predicted Crime Hotspots
Table 4: Top-20 Selected Features Ranked by Mean Decrease in Accuracy
Rank Features 0 1 MeanDecreaseAccuracy MeanDecreaseGini1 smartSteps.daily.ageover60.entropy.empirical.entropy.empirical 4.48 5.43 9.02 18.752 smartSteps.daily.athome.mean.sd 3.20 7.60 8.91 27.133 smartSteps.daily.age020.sd.entropy.empirical 5.69 3.97 8.85 16.884 smartSteps.daily.age020.mean.entropy.empirical 3.09 5.88 8.85 17.265 smartSteps.daily.age020.mean.sd 4.50 5.27 8.65 16.036 smartSteps.daily.athome.min.entropy.empirical 6.39 2.32 8.61 15.997 smartSteps.daily.athome.sd.sd 3.22 8.58 8.60 45.828 smartSteps.daily.athome.sd.mean 3.35 5.83 8.57 24.939 smartSteps.daily.ageover60.entropy.empirical.sd 4.62 4.95 8.56 20.45
10 smartSteps.daily.athome.sd.median 5.41 5.04 8.50 26.4811 smartSteps.daily.age3140.entropy.empirical.max 2.33 5.79 8.44 16.2412 smartSteps.daily.age3140.min.sd 6.81 4.06 8.31 36.5213 smartSteps.daily.athome.min.sd 4.36 6.85 8.29 34.2614 smartSteps.daily.athome.sd.max 4.13 6.87 8.27 34.8915 smartSteps.monthly.athome.max 3.92 5.42 8.26 29.8616 smartSteps.monthly.athome.sd 4.43 4.17 8.21 39.7017 smartSteps.daily.age5160.entropy.empirical.entropy.empirical 4.74 4.11 8.13 16.6418 smartSteps.daily.age020.sd.sd 3.67 5.88 8.12 16.8619 smartSteps.daily.athome.entropy.empirical.entropy.empirical 5.13 4.82 8.08 18.5520 smartSteps.daily.athome.max.sd 2.83 6.29 8.07 26.85
with economic development.
As previously described, borough profile features (of-ficial statistics) have lower predictive power with re-spect to accuracy than features extracted from aggre-gated mobile network activity data. Six borough profilefeatures were selected in the final feature vector, includ-ing the proportion of the working age population whoclaim out of work benefits, the largest migrant pop-ulation, the proportion of overseas nationals enteringthe UK and the proportion of resident population bornabroad –metrics based on 2011 Census Bureau data.The predictive power of some of these variables is inline with previous studies in sociology and criminology.For example, several studies show a positive associa-tion among unemployment rate and crime level of an
area [27]. Still under debate is the positive associa-tion among number of immigrants and crime level [18].However, our experimental results show that the staticnature of these variables makes them less useful in pre-dicting crime level’s of a given area when compared withless detailed but daily information about the types ofpeople present in a same area throughout the day.
VII. Implications and Limitations
We have outlined and tested a multimodal approachto automatically predict with almost 70% accuracywhether a given geographical area will have high orlow crime levels in the next month. The proposed ap-proach could have clear practical implications by in-
7
forming police departments and city governments onhow and where to invest their efforts and on how toreact to criminal events with quicker response times.From a proactive perspective, the ability to predict thesafety of a geographical area may provide informationon explanatory variables that can be used to identifyunderlying causes of these crime occurrence areas andhence enable officers to intervene in very narrowly de-fined geographic areas.
The distinctive characteristic of our approach liesin the use of features computed from aggregated andanonymized mobile network activity data in combi-nation with some demographic information. Previ-ous research efforts in criminology have tackled similarproblems using background historical knowledge aboutcrime events in specific areas, criminals’ profiling, orwide description of areas using socio-economic and de-mographic indicators. Our findings provide evidencethat aggregated and anonymized data collected by themobile infrastructure contains relevant information todescribe a geographical area in order to predict its crimelevel.
The first advantage of our approach is its predictiveability. Our method predicts crime level using variablesthat capture the dynamics and characteristics of the de-mographics and nature of a place rather than only mak-ing extrapolations from previous crime histories. Oper-ationally, this means that the proposed model could beused to predict new crime occurrence areas that are ofsimilar nature to other well known occurrence areas.Even though the newly predicted areas may not haveseen recent crimes, if they are similar enough to priorones, they could be considered to be high-risk areas tomonitor closely. This is an important advantage giventhat in some areas people are less inclined to reportcrimes [38]. Moreover, our approach provides new waysof describing geographical areas. Recently, some crimi-nologists have started to use risk terrain modeling [10]to identify geographic features that contribute to crimerisk, e.g. the presence of liquor stores, certain types ofmajor stores, bars, etc. Our approach can identify novelrisk-inducing or risk-reducing features of geographicalareas. In particular, the features used in our approachare dynamic and related to human activities.
Our study has several limitations due to the con-straints of the datasets used. First of all, we had accessonly to 3 weeks of Smartsteps data collected betweenDecember 2012 and the first week of January 2013. Inaddition, the crime data provided was aggregated ona monthly basis. Having access to crime events aggre-gated on a weekly, daily or hourly basis would enableus to validate our approach with finer times granularity,predicting crimes in the next week, day or even hour.
VIII. Conclusion
In this paper we have proposed a novel approach to pre-dict crime hotspots from human behavioral data derivedfrom mobile network activity, in combination with de-mographic information. Specifically, we have describeda methodology to automatically predict with almost70% of accuracy whether a given geographical area of alarge European metropolis will have high or low crimelevels in the next month. We have shown that ourapproach, while using a similar number of variables,significantly improves prediction accuracy (6%) whencompared with using traditional, rich –yet expensiveto collect– statistical data about a borough’s popula-tion. Moreover, we have provided insights about themost predictive features (e.g. home-based and entropy-based features) and we have discussed the theoreticaland practical implications of our methodology. Despitethe limitations discussed above and the additional in-vestigations needed to validate our approach and therobustness of our indicators, we believe that our find-ings open the door to exciting avenues of research incomputational approaches to deal with a well-knownsocial problem such as crime.
IX. Acknowledgments
Source data processing, reported data transformations andfeature selection, which were derived from anonymised andaggregated mobile network dataset, provided by TelefonicaDigital Limited were done only during the public competi-tion – “Datathon for Social Good” organized by Telefonica,The Open Data Institute and the MIT during the CampusParty Europe 2013 at the O2 Arena in London during 2-7 September 2013, in full compliance with the competitionrules and legal limitations imposed by the “Terms and Con-ditions” document.
The work of Andrey Bogomolov is partially supported byEIT ICT Labs Doctoral School grant and Telecom Italia Se-mantics and Knowledge Innovation Laboratory (SKIL) re-search grant T.
References
[1] G. Biau. Analysis of a random forests model.The Journal of Machine Learning Research,98888(1):1063–1095, 2012.
[2] S. L. Boggs. Urban crime patterns. American So-ciological Review, 30(6):pp. 899–908, 1965.
[3] A. Bogomolov, B. Lepri, and F. Pianesi. Happinessrecognition from mobile phone data. In SocialCom2013, pages 790–795, 2013.
8

[4] J. Bollen, H. Mao, and X. Zeng. Twitter mood pre-dicts the stock market. Journal of ComputationalScience, 2(1):1–8, 2011.
[5] G. E. P. Box and D. R. Cox. An Analysis ofTransformations. Journal of the Royal StatisticalSociety. Series B (Methodological), 26(2):211–252,1964.
[6] J. Braithwaite. Crime, Shame and Reintegration.Ambridge: Cambridge University Press, 1989.
[7] P. L. Brantingham and P. J. Brantingham. A theo-retical model of crime hot spot generation. Studieson Crime & Crime Prevention, 1999.
[8] L. Breiman. Bagging predictors. Machine Learn-ing, 24(2):123–140, 1996.
[9] A. L. Buczak and C. M. Gifford. Fuzzy associationrule mining for community crime pattern discovery.In ACM SIGKDD Workshop on Intelligence andSecurity Informatics, page 2. ACM, 2010.
[10] J. Caplan and L. Kennedy. Risk terrain modelingmanual: Theoretical framework and technical stepsof spatial risk assessment for crime analysis. Rut-gers Center on Public Security, 2010.
[11] S. Chainey, L. Tompson, and S. Uhlig. The utilityof hotspot mapping for predicting spatial patternsof crime. Security Journal, 21:4–28, 2008.
[12] J. Cullen and S. Levitt. Crime, urban flight, andthe consequences for the cities. Review of Eco-nomics and Statistics, (81):159–169, 2009.
[13] Y.-A. de Montjoye, J. Quoidbach, F. Robic, andA. Pentland. Predicting personality using novelmobile phone-based metrics. In Social Comput-ing, Behavioral-Cultural Modeling and Prediction,pages 48–55. Springer, 2013.
[14] W. Dong, B. Lepri, and A. Pentland. Modeling theco-evolution of behaviors and social relationshipsusing mobile phone data. In MUM 2011, 2011.
[15] N. Eagle, M. Macy, and R. Claxton. Networkdiversity and economic development. Science,328(5981):1029–1031, 2010.
[16] J. Eck, S. Chainey, J. Cameron, and R. Wilson.Mapping crime: understanding hotspots. NationalInstitute of Justice: Washington DC, 2005.
[17] I. Ehrlich. On the relation between education andcrime. 1975.
[18] L. Ellis, K. Beaver, and J. Wright. Handbook ofcrime correlates. Academic Press, 2009.
[19] R. B. Freeman. The economics of crime. Handbookof labor economics, 3:3529–3571, 1999.
[20] E. Frias-Martinez, G. Williamson, and V. Frias-Martinez. An agent-based model of epidemicspread using human mobility and social network in-formation. In Social Computing (SocialCom), 2011International Conference on, pages 57–64. IEEE,2011.
[21] M. Gonzalez, C. Hidalgo, and L. Barabasi. Un-derstanding individual mobility patterns. Nature,453(7196):779–782, 2008.
[22] C. Krumme, A. Llorente, M. Cebrian, A. Pentland,and E. Moro. The predictability of consumer visi-tation patterns. Scientific Reports, (1645), 2013.
[23] J. Laurila, D. Gatica-Perez, I. Aad, J. Blom,O. Bornet, T. Do, O. Dousse, J. Eberle, and M. Mi-ettinen. From big smartphone data to worldwideresearch: The mobile data challenge. Pervasive andMobile Computing, 9:752–771, 2013.
[24] H. Mehlum, K. Moene, and R. Torvik. Crime in-duced poverty traps. Journal of Development Eco-nomics, (77):325–340, 2005.
[25] G. Mohler, M. Short, P. Brantingham, F. Schoen-berg, and G. Tita. Self-exciting point process mod-eling of crime. Journal of the American StatisticalAssociation, (106):100–108, 2011.
[26] E. B. Patterson. Poverty, income inequality, andcommunity crime rates. Criminology, 29(4):755–776, 1991.
[27] S. Raphael and R. Winter-Ebmer. Identifying theeffect of unemployment on crime. Journal of Lawand Economics, 44(1), 2001.
[28] J. H. Ratcliffe. A temporal constraint theory to ex-plain opportunity-based spatial offending patterns.Journal of Research in Crime and Delinquency,43(3):261–291, 2006.
[29] J. Shang, T. W. Zheng, Y., and E. Chang. Inferringgas consumption and pollution emission of vehiclesthroughout a city. In KDD 2014, 2014.
[30] C. Shannon. A mathematical theory of communi-cation. Bell System Technical Journal, 27:379–423,623–656, July, October 1948.
9
[31] M. B. Short, M. R. D’Orsogna, V. B. Pasour, G. E.Tita, P. J. Brantingham, A. L. Bertozzi, and L. B.Chayes. A statistical model of criminal behavior.Mathematical Models and Methods in Applied Sci-ences, 18(supp01):1249–1267, 2008.
[32] S. R. Singh, H. A. Murthy, and T. A. Gonsalves.Feature selection for text classification based ongini coefficient of inequality. Journal of Ma-chine Learning Research-Proceedings Track, 10:76–85, 2010.
[33] V. K. Singh, L. Freeman, B. Lepri, and A. S. Pent-land. Predicting spending behavior using socio-mobile features. In Social Computing (SocialCom),2013 International Conference on, pages 174–179.IEEE, 2013.
[34] C. Smith-Clarke, A. Mashhadi, and L. Capra.Poverty on the cheap: Estimating poverty mapsusing aggregated mobile communication networks.In 32nd ACM Conference on Human Factors inComputing Systems (CHI2014), 2014.
[35] C. Song, Z. Qu, N. Blumm, and A. Barabasi. Lim-its of predictability in human mobility. Science,(327):1018–1021, 2010.
[36] V. Soto, V. Frias-Martinez, J. Virseda, andE. Frias-Martinez. Prediction of socioeconomic lev-els using cell phone records. In UMAP 2011, pages377–388, 2011.
[37] J. Staiano, B. Lepri, N. Aharony, F. Pianesi,N. Sebe, and A. Pentland. Friends don’t lie - infer-ring personality traits from social network struc-ture. In ACM Ubicomp 2012, pages 321–330, 2012.
[38] R. Tarling and K. Morris. Reporting crime to thepolice. British Journal of Criminology, (50):474–479, 2010.
[39] J. L. Toole, N. Eagle, and J. B. Plotkin. Spatiotem-poral correlations in criminal offense records. ACMTrans. Intell. Syst. Technol., 2(4):38:1–38:18, July2011.
[40] A. Tumasjan, T. O. Sprenger, P. G. Sandner, andI. M. Welpe. Predicting elections with twitter:What 140 characters reveal about political senti-ment. ICWSM, 10:178–185, 2010.
[41] E. Tuv, A. Borisov, G. Runger, and K. Torkkola.Feature selection with ensembles, artificial vari-ables, and redundancy elimination. The Journal ofMachine Learning Research, 10:1341–1366, 2009.
[42] T. Wang, C. Rudin, D. Wagner, and R. Sevieri.Learning to detect patterns of crime. In MachineLearning and Knowledge Discovery in Databases,pages 515–530. Springer, 2013.
[43] X. Wang, M. S. Gerber, and D. E. Brown. Auto-matic crime prediction using events extracted fromtwitter posts. In Social Computing, Behavioral-Cultural Modeling and Prediction, pages 231–238.Springer, 2012.
[44] S. K. Weinberg. Theories of criminality and prob-lems of prediction. The Journal of Criminal Law,Criminology, and Police Science, 45(4):412–424,1954.
[45] D. Weisburd. Place-based policing. Ideas in Amer-ican Policing, 9:1–16, 2008.
[46] D. Weisburd and L. Green. Defining the street-leveldrug market. 1994.
[47] A. Wesolowski, N. Eagle, A. Tatem, D. Smith,R. Noor, and C. Buckee. Quantifying the im-pact of human mobility on malaria. Science,338(6104):267–270, 2012.
[48] Y. Zheng, L. Capra, O. Wolfson, and H. Yang. Ur-ban computing: concepts, methodologies, and ap-plications. ACM Transaction on Intelligent Sys-tems and Technology, 2014.
[49] Y. Zheng, T. Liu, Y. Wang, Y. Liu, Y. Zhu, andE. Chang. Diagnosing new york city’s noises withubiquitous data. In ACM Ubicomp 2014, 2014.
10