crime prediction using hotel reviews?
TRANSCRIPT

Crime Prediction Using Hotel Reviews? Panos Kostakos
Center for Ubiquitous Computing University of Oulu
Oulu, Finland [email protected]
Somkiadcharoen Robroo Center for Ubiquitous Computing
University of Oulu Oulu, Finland
Bofan Lin Center for Ubiquitous Computing
University of Oulu Oulu, Finland
Mourad Oussalah Center for Machine Vision and
Signal Analysi University of Oulu
Oulu, Finland [email protected]
Abstract—Can hotel reviews be used as a proxy for predicting crime hotspots? Domain knowledge indicates that hotels are crime attractors, and therefore, hotel guests might be reliable “human crime sensors”. In order to assess this heuristic, we propose a novel method by mapping actual crime events into hotel reviews from London, using spatial clustering and sentiment feedback. Preliminary findings indicate that sentiment scores from hotel reviews are inversely correlated with crime intensity. Hotels with positive reviews are more likely to be adjacent to crime hotspots, and vice versa. One possible explanation for this counterintuitive finding that the review data are not mapped against specific crime types, and thus the crime data capture mostly police visibility on the site. More research and domain knowledge are needed to establish the strength of hotel reviews as a proxy for crime prediction.
Keywords—Crime Prediction, Spatial Clustering, Sentiment Analysis, Crime Hotspots, Hotels, User Reviews
I. INTRODUCTION Society hinges on norms and values that crime seeks to defy.
This conflict has a negative impact on local communities and businesses. For example, empirical evidence correlates crime rates with declining house prices and neighbourhood satisfaction, leading to reduced levels of consumption. As a result, crime increases both absolute and marginal cost to local businesses leading to the stagnation of local communities. The vetted need for control crime, has in the past 150 years informed the development of statistical models, and more recently, machine learning methods and geographical information systems GIS [13]. Lately, the growth of the social web has enabled researchers to develop analytical models using novel datasets from social media platforms [2] and mobile data [3] that have already been reported to improved prediction accuracy. This trend has lent weight to the application of the “human as sensors” approach [8] to criminality. Within this context, the paper draws on current domain knowledge indicating that accommodation establishments [9,10] are crime attractors, and sets out to explore the use of hotel reviews as potential crime predictors.
Our approach is to extract novel features from geolocated hotel reviews by calculating sentiment scores and then explore correlations between these scores and the actual crime hotspots. The intuition behind this approach is that the closer a crime hotpot is to the vicinity of a hotel the higher the volume and magnitude of negative comments. Respectively, hotels further way from locations with high crime concentration will receive better reviews from their guests.
II. BACKGROUND Geographical patterns found in the distribution of recorded
crime have always been considered central in understanding crime as they provide a more detailed analytical window into the geodemographic structure and ecology of deviance [11]. Furthermore, the large-scale patterns displayed in geolocated crime data can better inform prevention measures that increase the overall effectives of policing and lower victimization rates. Business establishments are commonly understood to play a pivotal role in the ecology of crime, especially in the urban setting.
Places or Point of Interests (POI) like alcohol establishments, internet bars, adult motels, and shopping malls are known to be sites where multiple categories of crime occur [12-11]. Similarly, it has been shown that offenders often stay in hotels with low supervision and close to targets [10], with some evidence pointing out that the number of hotels within a given community is positively correlated with the community burglary rate [9]. Similar evidence correlates the presence of sex hotels/motels and studios with local crime rates [14]. Consequently, domain knowledge indicates that information from hotel guests could in theory be used as a proxy to evaluate the overall prevalence of crime in the area. By extension, this data is easily accessible via online hotel reviews.
The central intuition is that hotel guests who have experienced either actual crime events or the threat of victimization in the vicinity of accommodation establishments, will be more likely to express negative sentiments in their online reviews. Thus, in order to operationalize this intuition, we need to fuse data coming from hotel reviews with data from the actual crime events recoded by the police.
Both the “human as sensor” approach and the use of online reviews have many methodological shortcomings. Hotel reviews are influenced by the perception of how users feel about the hotel, the time and location the review published, and the ability of the user to recall and observe events during their stay. Overcoming these hurdles is beyond the scope of this paper. Here we simply focus on combining these two datasets and to explore the information gained towards improving crime prediction.
A. Datasets Two different datasets are used to capture both ends of the
problem. The first one, a hotel review dataset which is likely to reflect the quality of the hotel service and the “local vibe” that

visitors have gained from visiting the neighbourhood. The second dataset is the actual crime events recorded by the police in London, UK.
1) Reviews dataset: We used a longettudinal dataset which contains about 140,000 unique customer reviews from 1,197 hotels in London from 2003 to 2016. Shown in Table I, this dataset includes 15 features. In this datasets, there are many missing features like the hotel address. Missing values are replaced by using the hotel Zip Code.
2) England Police Metropolitan Crime Dataset: This is a widely used database with open data about crime and policing in England, Wales and Northern Ireland [14]. We retrived street level data for the Metropolitical Police Serve from 3/2017-8/2017 with a total of 12 features, also shown in Table I.
TABLE I. ATTRIBUTES OF THE TWO DATASETS
Index Hotel Review Dataset Metropolitan Crime Dataset 1 Hotel Name Crime ID 2 Hotel Review Stars Month 3 Hotel Address Reported by 4 City Falls within 5 ZIP Longitude 6 Review Title Latitude 7 Review Date Location 8 Review Content LSOA code 9 Review Stars LSOA name 10 Reviewer Name Crime type 11 Reviewer Location Last outcome category 12 Reviewer Profile Context 13 Reviewer Total Reviews 14 Reviewer Hotel Reviews 15 Helpful Votes
III. METHODS We hypothesized that when doing a between-group
comparison, hotels that have accumulated more negative ratings would be located near areas with high density crime while hotels with positive ratings would yield opposite results. To test this hypothesis, we extracted new textual features to enhance the existing variables in the review dataset. We then merged the review and crime datasets and run spatially analysis to evaluate the correlation between the data.
• Geo-coding Conversion: with regard to location data, the reviews datasets contains only hotel addresses while the crime dataset is georeferenced. We harmonized the two datasets by mapping hotel addresses to GPS latitude and longitude.
• Features Extraction: to evaluate user generated information from the hotel reviews, we run sentiment analysis and extracted at least three new classes/features. We anticipate that the new features provide reliable information about the service and the vicinity near the hotel.
• Features Visualization: in order to explore the spatial dimensions of the data, we visualized the structured data on the map and controlled for observations which are independent or identically distributed.
A. Geo-coding Convertion In this pre-processing step, we harmonized the two datasets
on their location features. The reviews dataset contains only addresses in string format while the crime data provides the location in both string and spatial format. Data harmonization was done using the Google’s Geo-coding API [15] and was applied to convert hotel addresses into their equivalent GPS coordinates. Missing hotel addresses from the review data are converted to latitude and longitude based on their Zip Code.
B. Feature Extraction Deep learning-based sentiment classification was performed
on hotel review titles using StanfordCoreNLP [4]. We focused on the review titles because prior experimentation with the actual review text did not improve the accuracy of the classification. Also, heuristically, we can infer the sentiment of the user just by reading the title of the review. We used the Python wrapper of StanfordCoreNLP [14] to label the level of sentiment into five classes: Verynegative, Negative, Neutral, Positive, and Verypositive. These results can be directly compared with the “review star” column that takes values between 1 and 5, and thus calculate the Effective Rating Score and perform a Fraud detection. Three features are extracted from the reviews dataset:
1) EFF (Effective Rating Score): The intuition behind the EFF is based on the bias of the reviewers illustrated in the following example. Two independant reviewers give 3 stars, but one comments “Quite a Bad Hotel” while the other states “It was OK”. We can see in this example that the meaning of “3” depends on the raters’ perspective. Therefore, we use the NLP based sentiment from the review titles and the “review stars” method to determine the binary intra-rater agreement. When the positive review score (4-5 stars) and the sentiment score (Positive, Verypositive) are matched to each other, then the obesevation is valid. Equally, when both the staring score (1-2 stars) and the sentiment (Negative, Verynegative) are negative, then the obeservation is valid and kept in the dataset. A review with three stars is classifised as Neutral. The rules are summarized in the Table II.
TABLE II. EFFECTIVE RATING SCORE CALCULATION
Review Score Predicted Sentiment Enhanced Result 4-5 Positive, Verypositive keep 1-2 Verynegative, Negative keep 3 Neutral keep 3 Not Neutral remove 1-2 Positive, Verypositive remove 4-5 Verynegative, Negative remove
2) DIST (Distance from a crime event): The idea behind this
feature is that hotels close to crime spots are expected to have many bad reviews. Following pre-processing, we succesfully mapped 90% of the georeferenced data from each dataset. After the mapping, we used a Python package called GeoPy to compute the geodesic distance between two spatial location (i.e hotel and crime event) [5].
3) AVG CRIME N (Average occurrence of crime per month): The intuition for this feautre is to capture the average
crime rate that has occurred within a 6 months timeframe. This is a simple ratio of monthly averages culcuated by deviding the number of daily recorded crime over the number of days. This feature will serve as dependent value.
4) RATIO NEGREVIEWS: (Ratio of negative reviews) Online review systems are known to be prone to skewed ratios as customers with a negative experience are more liklely to leave a negative review while happy customers often do not leave positive reviews. To address this issue, we normalized the number of negative reviews, so that the total number of negative reviews is the ratio of negative reviews over the total reviews.
C. Visualistion 1) Hotel Features Visualization: A shape file of London
was retrived from the Statistical GIS Boundary Files and spatial data ploted into each borough [16]. The clustering features (effective rating score, distance from a crime spot, ratio of negative reviews and average occurrence of crime per month) are grouped and averaged by boroughs. Then, we clustered the hotels into four classes and plot into the map as shown in Figure 1. We analyzed each cluster using bar charts on each feature in Figure 2. The 4th cluster is the one with highest average monthly crime rate. The hotel ratings in this cluster are 66%, which is quite high while the ratio of negative reviews is quite low. The 3nd cluster has the highest hotel star ratings compared to other clusters. It is the furthest away from a hotspot among these clusters, resulting to lowest crime rate. The 1st and 2nd cluster quite similar. They are fairly close to the crime events, but not see significantly high monthly crime rates. Moreover, the 1st cluster has higher hotel rating scores and lower negative reviews.
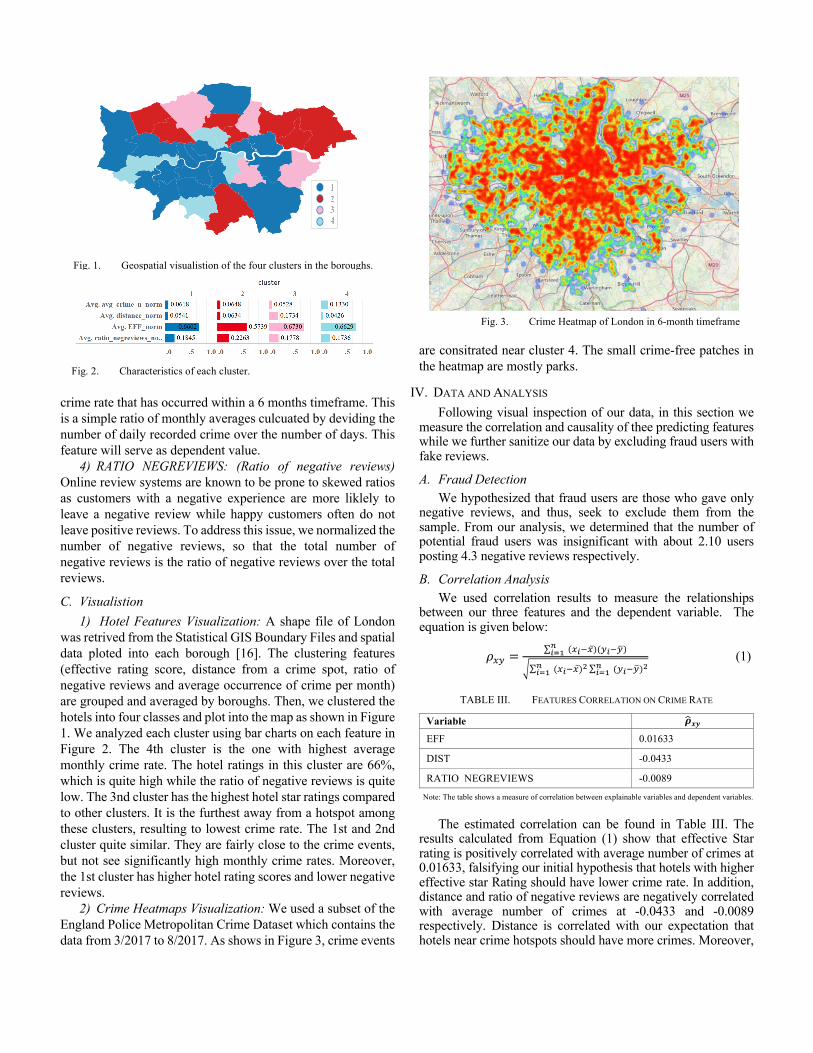
2) Crime Heatmaps Visualization: We used a subset of the England Police Metropolitan Crime Dataset which contains the data from 3/2017 to 8/2017. As shows in Figure 3, crime events
are consitrated near cluster 4. The small crime-free patches in the heatmap are mostly parks.
IV. DATA AND ANALYSIS Following visual inspection of our data, in this section we
measure the correlation and causality of thee predicting features while we further sanitize our data by excluding fraud users with fake reviews.
A. Fraud Detection We hypothesized that fraud users are those who gave only
negative reviews, and thus, seek to exclude them from the sample. From our analysis, we determined that the number of potential fraud users was insignificant with about 2.10 users posting 4.3 negative reviews respectively.
B. Correlation Analysis We used correlation results to measure the relationships
between our three features and the dependent variable. The equation is given below:
𝜌"# =∑ ("()"̅)(#()#,)-(./
0∑ ("()"̅)1 ∑ (#()#,)1-(./
-(./
(1)
TABLE III. FEATURES CORRELATION ON CRIME RATE
Variable 𝝆3𝒙𝒚
EFF 0.01633
DIST -0.0433
RATIO NEGREVIEWS -0.0089
Note: The table shows a measure of correlation between explainable variables and dependent variables.
The estimated correlation can be found in Table III. The results calculated from Equation (1) show that effective Star rating is positively correlated with average number of crimes at 0.01633, falsifying our initial hypothesis that hotels with higher effective star Rating should have lower crime rate. In addition, distance and ratio of negative reviews are negatively correlated with average number of crimes at -0.0433 and -0.0089 respectively. Distance is correlated with our expectation that hotels near crime hotspots should have more crimes. Moreover,
Fig. 2. Characteristics of each cluster.
Fig. 1. Geospatial visualistion of the four clusters in the boroughs.
Fig. 3. Crime Heatmap of London in 6-month timeframe

the ratio of negative reviews goes against our assumption that hotels with poor reviews should have more crimes. However, the correlations are very weak, so we need to continue searching for unobservable variables that might strongly affect crime rates.
C. Multiple Regration Analysis We run OLS Regression on the features and dependent
variable to understand more about how each feature impacts on crime rate. The preliminary results can be found in Table IV.
TABLE IV. REGRESSION ANALYSIS ON AVERAGE NUMBER OF CRIME
Measures Average Crime constant 2.6279* (0.001) EFF -0.0611 (0.732) DIST -1.4480 (0.151) RATIO NEGREVIEWS -2.261e-05 (0.745) R2 0.002
Note: OLS minimizes squared error between predicted and actual values. The number of obs. is 1196. *Significant at the level of 0.05
As seen on Table IV, the coefficients of the effective star rating on average number of crime rate is -0.0611 which suggests that an increase in 1 unit of effective star rating would decrease the average crime rate by 0.0611. The distance shows that the average number of crimes is strongly in contrast with distance and would decrease by 1.4480 every increasing in distance. This has the largest magnitude of all features. In addition, the ratio of negative reviews would also decrease the average crime number only by a small amount of -2.261e-05. R2 means that all the features can explain variations of average crime only 0.2%. However, there are no statistically significant between each features and crime rate at the level of 0.05 except for the constant. This could mean that there are other features that can better describe the average number of crimes.
V. CONCLUSION AND FUTURE WORK The paper explores the intuition that crime impacts
negatively on local communities and businesses, and this can be recorded through customers’ online reviews. Using two widely explored datasets with hotel reviews and recorded crime events from London, we presented a methodology that can help us derive statistical relationships. Preliminary results contradict our initial intuition, and the weak statistical evidence call for a more refined approach. The main weakness of our approach is that the two datasets reflect different timelines. The crime data capture a very small-time frame while the review data cover a much larger time span. Therefore, the sentiment polarity expressed through the reviews might be affected by other silent processes like crime displacement, urban reconstructing or gentrification. Because neighborhoods change over time, the accuracy of our approach can be improved by analyzing smaller time slices. Furthermore, future work can examine how various inclusion/exclusion filters in the reviews dataset might affect the
overall results. People who are visiting London frequently might became more resilient to crime events and are therefore less likely to report negative experiences. Finally, our approach is agnostic towards demographic characteristics (population density) and crime types, and therefore fails to capture correlations with key crime types (like violent crime) that have a greater impact on the public perception of crime.
ACKNOWLEDGMENT This work is (partially) funded by the European Commission
grant PRINCE (815362).
REFERENCES [1] Liang Ge, Junling Liu, Aoli Zhou, Hang Li, Crime Rate Inference Using
Tensor Decomposition, 2018 IEEE SmartWorld, Ubiquitous Intelligence & Computing, Advanced & Trusted Computing, Scalable Computing & Communications, Cloud & Big Data Computing, Internet of People and Smart City Innovation, Guangzhou, China.
[2] Wang X., Gerber M.S., Brown D.E. (2012) Automatic Crime Prediction Using Events Extracted from Twitter Posts. In: Yang S.J., Greenberg A.M., Endsley M. (eds) Social Computing, Behavioral - Cultural Mod- eling and Prediction. SBP 2012. Lecture Notes in Computer Science, vol 7227. Springer, Berlin, Heidelberg.
[3] Andrey Bogomolov, Bruno Lepri, Jacopo Staiano, Nuria Oliver, Fabio Pianesi, Alex Pentland, Once Upon a Crime: Towards Crime Prediction from Demographics and Mobile Data, Proceedings of the 16th Interna- tional Conference on Multimodal Interaction, November 12-16, 2014, Istanbul, Turkey.
[4] Manning, Christopher D., Mihai Surdeanu, John Bauer, Jenny Finkel, Steven J. Bethard, and David McClosky. 2014. The Stanford CoreNLP Natural Language Processing Toolkit In Proceedings of the 52nd Annual Meeting of the Association for Computational Linguistics: System Demonstrations, pp. 55-60.
[5] https://geopy.readthedocs.io [6] R. Heartfield and G. Loukas, "Evaluating the reliability of users as human
sensors of social media security threats," 2016 International Conference On Cyber Situational Awareness, Data Analytics And Assessment (CyberSA), London, 2016, pp. 1-7.
[7] Hu T, Zhu X, Duan L, Guo W (2018) Urban crime prediction based on spatio-temporal Bayesian model. PLOS ONE 13(10): e0206215.
[8] Xi Y. Leung, Yang Yang & Elliot A. Dubin (2018) What are guests scared of? Crime-related hotel experiences and fear of crime, Journal of Travel & Tourism Marketing, 35:8, 1071-1086.
[9] Gerben J.N. Bruinsma and Shane D. Johnson, The Oxford Handbook of Environmental Criminology, 2018.
[10] Soto, C., & Summers, L. (2018). Macro-brothels as crime attractors: Impact of closure, displacement, and diffusion of benefits. European Journal of Criminology.
[11] https://github.com/Lynten/stanford-corenlp [12] Román Marchant, Sebastian Haan, Garner Clancey, Sally Cripps:
Applying machine learning to criminology: semi-parametric spatial-demographic Bayesian regression. Security Informatics 7(1): 1 (2018)
[13] https://data.police.uk/data/ [14] https://developers.google.com/maps/documentation/geocoding/start [15] https://data.london.gov.uk/dataset/statistical-gis-boundary-files-london