on the visualization of honeypot data through projection
TRANSCRIPT

Proceedings of the 10th International Conference on Computational and Mathematical Methods in Science and Engineering, CMMSE2010 Almeria, Spain, 27-30 June 2010
On the Visualization of Honeypot Data through Projection Techniques
Álvaro Alonso1, Santiago Porras1, Iñaki Garitano2, Ignacio Arenaza2, Roberto Uribeetxeberria2, Urko Zurutuza2, Álvaro Herrero1 and Emilio Corchado3
1 Department of Civil Engineering, University of Burgos, Burgos (Spain)
2 Electronics and Computing Department, Mondragon University, Arrasate-Mondragon (Spain)
3 Departamento de Informática y Automática, Universidad de Salamanca, Salamanca (Spain)
emails: [email protected], [email protected],
[email protected], [email protected], [email protected],
[email protected], [email protected], [email protected]
Abstract
A crucial aspect in network monitoring for security purposes is the visual inspection of traffic patterns, which chiefly provides the network manager with a synthetic and intuitive representation of the current situation. In keeping with this idea, neural projection techniques can adaptively map high-dimensional data into a low-dimensional space, for the user-friendly visualization of data collected by different security tools. Different projection methods for the visual inspection of honeypot data are applied in this study, which may be seen as a complementary network security tool that sheds light on internal data structures through visual inspection. Empirical verification of the proposed projection methods was performed in an experimental domain where 1-month data sets were captured and stored for analysis. Experiments showed that whereas an Intrusion Detection System may only identify a low percentage of the malicious traffic, a deeper understanding of attack patterns could easily be gained by means of visual inspections.

On the Visualization of Honeypot Data through Projection Techniques
Keywords: Projection Models, Artificial Neural Networks, Unsupervised Learning, Network & Computer Security, Intrusion Detection, Honeypots.
1. Introduction A network attack or intrusion will inevitably violate one of the three computer security principles -availability, integrity and confidentiality- by exploiting certain vulnerabilities such as Denial of Service, Modification and Destruction [1]. One of the most harmful issues of attacks and intrusions, which increases the difficulty of protecting computer systems, is precisely the ever-changing nature of attack technologies and strategies. For that reason alone, among others, Intrusion Detection Systems (IDSs) have become a very necessary asset in addition to the computer security infrastructure of most organizations. In the context of computer networks, an IDS can roughly be defined as a tool designed to detect suspicious patterns that may be related to a network or system attack. Intrusion Detection (ID) is therefore a field that focuses on the identification of attempted or ongoing attacks on a computer system (Host IDS - HIDS) or network (Network IDS - NIDS). Visual inspection of traffic patterns is an alternative and crucial aspect in network monitoring [2]. Visualization is a critical issue in the computer network defence environment, which chiefly serves to generate a synthetic and intuitive representation of the current situation for the network manager; as a result, several research initiatives have recently applied information visualization to this challenging task [3] [4] [5] [6]. Visualization techniques typically aim to make the available statistics supplied by traffic-monitoring systems more understandable in an interactive way. They therefore focus on traffic data as well as on network topology. Regardless of their specific characteristics, these methods all map high-dimensional feature data into a low-dimensional space for presentation purposes. The baseline of the research presented in this study is that Artificial Neural Networks (ANNs), in general, and unsupervised connectionist models [7, 8], in particular, can prove quite adequate for the purpose of network data visualization through dimensionality reduction. As a result, unsupervised projection models are applied in the present research for the visualization and subsequent analysis of Honeypot data. The remaining five sections of this study are structured as follows: section 2 contains a brief description of Intrusion Detection (mainly visualization-based). Section 3 presents the approach proposed for ID and the neural projection techniques applied in this work. Some experimental results are presented and described in section 4; the conclusions of this study are discussed in section 5, as well as future work.

On the Visualization of Honeypot Data through Projection Techniques
2. Intrusion Detection and Honeynets The accurate detection in real-time of computer and network system intrusions has always been an interesting and intriguing problem for system administrators and information security researchers. It may be attributed on the whole to the dynamic nature of systems and networks, the creativity of attackers, the wide range of computer hardware and operating systems and so on. Such complexity arises when dealing with distributed network-based systems and insecure networks such as the Internet. A honeypot has no authorised function or productive value within the corporate network other than to be explored, attacked or compromised [9]. Thus, a honeypot should not receive any traffic at all. Any connection attempt with a honeypot is then an attack or attempt to compromise the device or services that it is offering- is by default illegitimate traffic. From the security point of view, there is a great deal that may be learnt from a honeypot about a hacker’s tools and methods in order to improve the protection of information systems. One of the most extended classifications of honeypots takes into account their level of interaction. Low interaction honeypots offer limited interaction with attackers and the most common ones only simulate services and operating systems. High interaction honeypots follow a different strategy: instead of using simulated services and operating systems, real systems and applications are used, usually running in virtual machines. Somewhere between the two are medium interaction honeypots, which also emulate vulnerable services, but leave the operating system to manage the connections with their network protocol stack. Recently, a new type of honeypot has been proposed as a response to the behavioural change observed in the attackers. Instead of waiting for the attackers to reach traditional honeypots, client side honeypots, also known as honeyclients, scan communication channels looking for malware. In a honeynet, all the traffic received by the sensors is suspicious by default. Thus every packet should be considered as an attack or at least as a piece of a multi-step attack. Numerous studies propose the use of honeypots to detect automatic large scale attacks; honeyd [10] and nepenthes [11] among others. The first Internet traffic monitors known as Network Telescopes, Black Holes or Internet Sinks were presented by Moore et al. [12].
3. A Visualization-based Approach This work proposes the application of projection models for the visualization of Honeypot data. Visualisation techniques have been applied to massive datasets, such as those generated by honeynets, for many years. These techniques are considered a viable approach to information seeking, as humans are able to recognize different features and to detect anomalies by inspecting graphs [13]. The underlying operational assumption of the proposed approach is mainly grounded in the ability to render the high-dimensional traffic data in a consistent

On the Visualization of Honeypot Data through Projection Techniques
yet low-dimensional representation. So, security visualisation tools have to map high-dimensional feature data into a low-dimensional space for presentation. One of the main assumptions of the research presented in this paper is that neural projection models will prove themselves to be satisfactory for the purpose of security data visualisation through dimensionality reduction. This problem of identifying patterns that exist across dimensional boundaries in high dimensional datasets is a challenging task. Such patterns may become visible if changes are made to the spatial coordinates. However, an a priori decision as to which parameters will reveal most patterns requires prior knowledge of unknown patterns. Projection methods project high-dimensional data points onto a lower dimensional space in order to identify "interesting" directions in terms of any specific index or projection. Having identified the most interesting projections, the data are then projected onto a lower dimensional subspace plotted in two or three dimensions, which makes it possible to examine the structure with the naked eye. Projection methods can be smart compression tools that map raw, high-dimensional data onto two or three dimensional spaces for subsequent graphical display. By doing so, the structure that is identified through a multivariable dataset may be visually analysed with greater ease. Visualisation tools can therefore support security tasks in the following way:
• Visualisation tools may be understood intuitively (even by inexperienced staff) and require less configuration time than more conventional tools.
• Providing an intuitive visualisation of data allows inexperienced security staff to learn more about standard network behaviour, which is a key issue in ID [14]. The monitoring task can be then assigned to less experienced security staff.
• As stated in [3], "visualizations that depict patterns in massive amounts of data, and methods for interacting with those visualizations can help analysts prepare for unforeseen events". Hence, such tools can also be used in security training.
• They can work in unison with some other security tools in a complementary way.
As with other machine learning paradigms, an interesting facet of ANN learning is not just that the input patterns may be precisely learned/classified/identified, but that this learning can be generalised. Whereas learning takes place within a set of training patterns, an important property of the learning process is that the network can generalise its results on a set of test patterns that were not previously learnt. The identification of unknown patterns fits the 0-day attack [15] detection. Due to the aforementioned reasons, the present study approaches the analysis of honeynet data from a visualization standpoint. That is, some neural projection techniques are applied for the visualization of such data. The different projection models applied in this study are described in the following sections.

On the Visualization of Honeypot Data through Projection Techniques
3.1 Principal Component Analysis Principal Component Analysis (PCA) is a statistical model, introduced in [16] and independently in [17], that describes the variation in a set of multivariate data in terms of a set of uncorrelated variables each, of which is a linear combination of the original variables. Its goal is to derive new variables, in decreasing order of importance, that are linear combinations of the original variables and are uncorrelated with each other. From a geometrical point of view, this goal mainly consists of a rotation of the axes of the original coordinate system to a new set of orthogonal axes that are ordered in terms of the amount of variance of the original data they account for. The optimal projection given by PCA from an -dimensional to an N M -dimensional space is the subspace spanned by the M eigenvectors with the largest eigenvalues. According to [18], it is possible to describe PCA as a mapping of vectors in an
-dimensional input space
dxN ( )Nxx ,...,1 onto vectors in an dy M -dimensional output space ( , where )M,...,yy1 NM ≤ . may be represented as a linear combination of a set of orthonormal vectors :
xN iW
iN
i iWy∑ ==
1x (1)
Vectors satisfy the orthonormality relation: iW
ijjt
i WW δ= (2)
where ijδ is the Kronecker delta. Making use of equation (1), the coefficients may be given by iy
xTii Wy = (3)
which can be regarded as a simple rotation of the co-ordinate system from the original values to a new set of co-ordinates given by the values. If only one subset of the basis vectors, , is retained so that only
x yNM < iW M coefficients
are used, and having replaced the remaining coefficients by constants , then each x vector may be approximated by the following expression:
iy
ib
∑∑+==
+=N
Miii
M
iii WbWy
11
~x (4)
Consider the whole dataset of D vectors, where dx Dd ,...,1= . PCA can be performed by means of ANNs or connectionist models such as [19, 20, 21, 22, 23]. It should be noted that even if we are able to characterize the data with a few variables, it does not follow that an interpretation will ensue.

On the Visualization of Honeypot Data through Projection Techniques
3.2 Cooperative Maximum Likelihood Hebbian Learning The Cooperative Maximum Likelihood Hebbian Learning (CMLHL) model [24] extends the Maximum Likelihood Hebbian Learning (MLHL) [25] model, which is based on Exploratory Projection Pursuit (EPP) [26]. The statistical method of EPP was designed for solving the complex problem of identifying structure in high dimensional data by projecting it onto a lower dimensional subspace in which its structure is searched for by eye. To that end, an “index” must be defined to measure the varying degrees of interest associated with each projection. Subsequently, the data is transformed by maximizing the index and the associated interest. From a statistical point of view the most interesting directions are those that are as non-Gaussian as possible.
The MLHL model is based on the Negative Feedback Network and, as the AABP model; it associates an input vector, x∈ℜD, with an output vector, y∈ℜQ. In this case, the output of the network (y) is computed as:
ixWy1j
jiji ∀=∑=
N
, (5)
where, ijW is the weight linking input j to output i .
Once the output of the network has been calculated, the activation ( ) is fed back through the same weights and subtracted from the input:
je
∑=
∀−=M
iiijjj jyWxe
1, (6)
Finally, the learning rule determines the way in which the weights are updated:
( ) 1||.. −=Δ pjjiij eesignyW η (7)
where, η is the learning rate and p is a parameter related to the energy function. The main difference between the basic MLHL model and its Cooperative
version is the introduction of lateral connections. After the Feed forward step (Eq. 5) and before the Feed back step (Eq. 6), lateral connections between the output neurons are applied as follows:
( ) ( )[ ]+−+=+ Aybτ(t)yty ii 1 (8)
where, τ is the “strength” of the lateral connections, b is the bias parameter and A is a symmetric matrix used to modify the response to the data. Its effect is based on the relation between the distances among the output neurons.
4. Experiments and Results The Euskalert project [26] has deployed a network of honeypots in the Basque Country (northern Spain) where eight companies and institutions have installed

On the Visualization of Honeypot Data through Projection Techniques
one of the project’s sensors behind the firewalls of their corporate networks. The honeypot sensor transmits all the traffic received to a database via a secure communication channel. These partners can consult information relative to their sensor (after a login process) as well as general statistics in the project’s website. Once the system is fully established, the information available can be used to analyse attacks suffered by the honeynet at network and application level. Euskalert is a distributed honeypot network based on a Honeynet GenIII architecture [26]. This honeypot system receives 4000 packets a day on average. All the traffic is analyzed by the Snort IDS, and an alert is launched whenever the packet matches a known attack signature. For this experiment, we have analysed the logs coming from Euskalert and Snort gathered during February 2010. Fig. 1 shows the traffic volume in terms of number of packets received for that period of time.
Fig. 1. Temporal distribution of the traffic volume in terms of number of packets captured by Euskalert in February, 2010. The February 2010 dataset contains a total of 3798 packets, including TCP, UDP and ICMP traffic received by the distributed honeypot sensors. The characterization of the traffic in the dataset is shown in Table 1. The table shows which alerts have been triggered in that period of time and their percentage. Those signatures starting with “Wormledge” are automatically generated and not present in the default signature database. From this dataset, it may be said that a misuse detection-based IDS such as Snort is only capable of identifying about 10.38% of bad-intentioned traffic. Furthermore, it was demonstrated that only 2% of the unsolicited traffic was identified by the IDS when automatically generated signatures were included from a previous work [27]. Thus, a deeper analysis of the data is needed in order to discover the internal structure of the remaining 90% of the traffic. Explaining the behaviour of the unknown traffic is a difficult task that must be performed to better protect computer networks and systems.
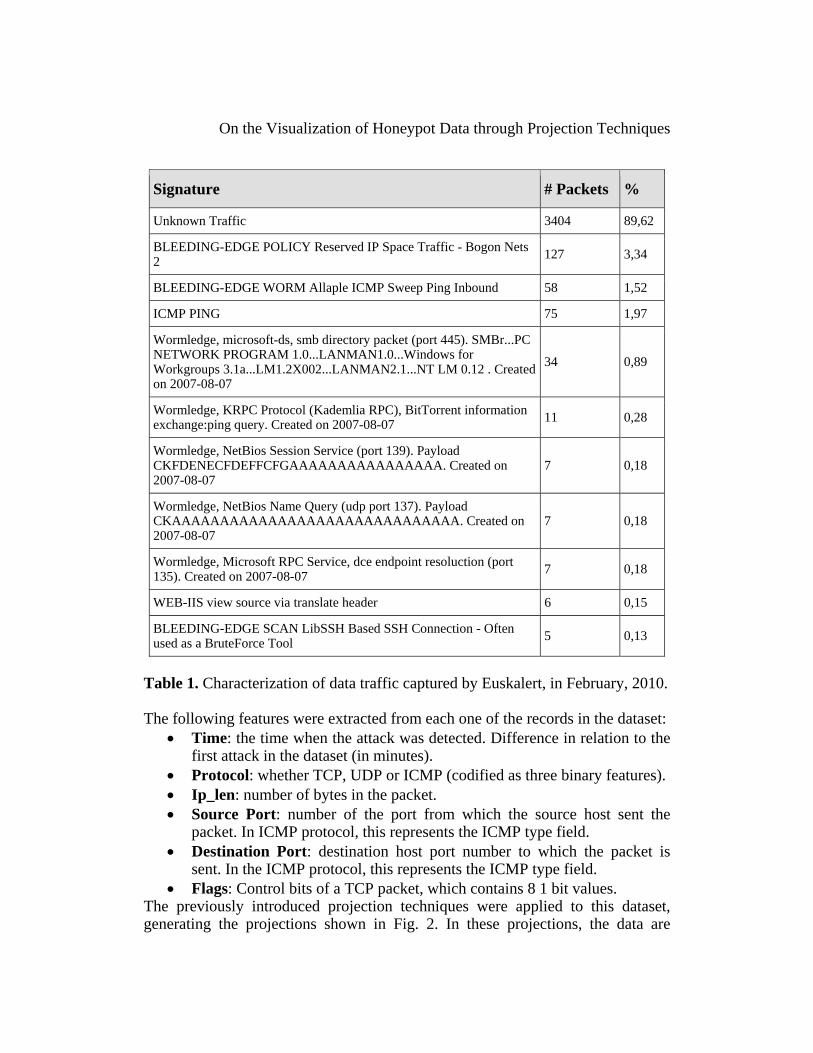
On the Visualization of Honeypot Data through Projection Techniques
Signature # Packets %
Unknown Traffic 3404 89,62
BLEEDING-EDGE POLICY Reserved IP Space Traffic - Bogon Nets 2 127 3,34
BLEEDING-EDGE WORM Allaple ICMP Sweep Ping Inbound 58 1,52
ICMP PING 75 1,97
Wormledge, microsoft-ds, smb directory packet (port 445). SMBr...PC NETWORK PROGRAM 1.0...LANMAN1.0...Windows for Workgroups 3.1a...LM1.2X002...LANMAN2.1...NT LM 0.12 . Created on 2007-08-07
34 0,89
Wormledge, KRPC Protocol (Kademlia RPC), BitTorrent information exchange:ping query. Created on 2007-08-07 11 0,28
Wormledge, NetBios Session Service (port 139). Payload CKFDENECFDEFFCFGAAAAAAAAAAAAAAAA. Created on 2007-08-07
7 0,18
Wormledge, NetBios Name Query (udp port 137). Payload CKAAAAAAAAAAAAAAAAAAAAAAAAAAAAAA. Created on 2007-08-07
7 0,18
Wormledge, Microsoft RPC Service, dce endpoint resoluction (port 135). Created on 2007-08-07 7 0,18
WEB-IIS view source via translate header 6 0,15
BLEEDING-EDGE SCAN LibSSH Based SSH Connection - Often used as a BruteForce Tool 5 0,13
Table 1. Characterization of data traffic captured by Euskalert, in February, 2010. The following features were extracted from each one of the records in the dataset:
• Time: the time when the attack was detected. Difference in relation to the first attack in the dataset (in minutes).
• Protocol: whether TCP, UDP or ICMP (codified as three binary features). • Ip_len: number of bytes in the packet. • Source Port: number of the port from which the source host sent the
packet. In ICMP protocol, this represents the ICMP type field. • Destination Port: destination host port number to which the packet is
sent. In the ICMP protocol, this represents the ICMP type field. • Flags: Control bits of a TCP packet, which contains 8 1 bit values.
The previously introduced projection techniques were applied to this dataset, generating the projections shown in Fig. 2. In these projections, the data are

On the Visualization of Honeypot Data through Projection Techniques
depicted with different colors and shapes, taking into account the destination port; from 3 to 10371: red circles, from 10371 to 20739: black crosses, from 20739 to 31107: green pluses, from 31107 to 41475: magenta stars, from 41475 to 51843: yellow squares, and from 51843 to 62205: cyan diamonds.
a) PCA projection b) MLHL projection
c) CMLHL projection
Fig. 2. Projections of data traffic captured by Euskalert, in February, 2010.
5. Conclusions and Future Work From the projections in Fig. 2 we can conclude that CMLHL provides a more sparse representation that the other two methods. This enables the intuitive visualization of the honeynet, where the general structure of these data can be seen. After getting a general idea of the dataset structure, an in-deep analysis was

On the Visualization of Honeypot Data through Projection Techniques
carried out to comprehensively analysed each one of the points in the groups identified by CMLHL. As a result, the following conclusions can be stated for each one of the destination ports in the analysed dataset:
- 8: ICMP ping, used for probing the Internet, looking for victim hosts. - 22: SSH. It seems to be a traffic flow with many packets coming from one
source to one of the honeypot. They correspond to connection attempts by attackers or infected machines.
- 80: HTTP. Attackers try different vulnerabilities against web applications. - 135: DCE endpoint resolution, used by Microsoft for Remote Procedure
Call protocol. It has always been and still is one of the most exploited services by virus and worms.
- 139: NETBIOS Session Service. Plenty of attacks to this Microsoft Windows service can be found.
- 443: HTTP protocol over TLS SSL connection attempts. - 445: SMB directly over IP. As most of the traffic in the biggest group
identified by CMLHL is aimed at this destination port, we can conclude that this is a widely exploited service.
- 1433: Microsoft-SQL-Server, used by the old SQL Slammer worm. - 1521: Oracle TNS Listener. It seems that attackers try to connect to the
honeypot via Oracle service. - 2967: Symantec System Center. Vulnerabilities have been found on
Symantec service, and it is being expiated in the wild. - 3128: Proxy Server // Reverse WWW Tunnel Backdoor, where the
MyDoom worm operates. - 3389: MS Terminal Services, used for Remote Desktop. - 4444: This port is a common return port for the rpc dcom.c buffer
overflow vulnerability and for the msblast rpc worm. - 4899: Remote Administrator default port. There is a known remote
exploitable vulnerability in radmin server versions 2.0 and 2.1 that allows code execution.
- 5061: SIP-TLS. Used for VoIP communications. - 5900: Virtual Network Computer or VNC, used also as a remote desktop
solution. - Port 8080: HTTP Alternate, used as an HTTP proxy. - Port 19765: Used in Kademlia (Bittorrent protocol).
Future work will combine the honeypot data with the output of a signature-based IDS, such as Snort, in the same visualization. This will validate the proposed approach as a complementary tool that can be combined with some other security tools or IDSs.
Acknowledgments This research has been partially supported through the Regional Government of Castilla y León under Project BU006A08, the Department of Research, Education and Universities of the Basque Government; and the Spanish Ministry of Science

On the Visualization of Honeypot Data through Projection Techniques
and Innovation (MICINN) under projects CIT-020000-2008-2 and CIT-020000-2009-12. The authors would also like to thank the vehicle interior manufacturer, Grupo Antolin Ingenieria S.A., within the framework of the MAGNO2008 – 1028.- CENIT Project also funded by the MICINN.
References [1] Myerson, J.M., Identifying Enterprise Network Vulnerabilities.
International Journal of Network Management 12-3 (2002) 135-144. [2] Becker, R.A., Eick, S.G., Wilks, A.R., Visualizing Network Data. IEEE
Transactions on Visualization and Computer Graphics 1-1 (1995) 16-28. [3] D'Amico, A.D., Goodall, J.R., Tesone, D.R., Kopylec, J.K., Visual
Discovery in Computer Network Defense. IEEE Computer Graphics and Applications 27-5 (2007) 20-27.
[4] Goodall, J.R., Lutters, W.G., Rheingans, P., Komlodi, A., Focusing on Context in Network Traffic Analysis. IEEE Computer Graphics and Applications 26-2 (2006) 72-80.
[5] Itoh, T., Takakura, H., Sawada, A., Koyamada, K., Hierarchical Visualization of Network Intrusion Detection Data. IEEE Computer Graphics and Applications 26-2 (2006) 40-47.
[6] Livnat, Y., Agutter, J., Moon, S., Erbacher, R.F., Foresti, S., A Visualization Paradigm for Network Intrusion Detection. Proceedings of the Sixth Annual IEEE SMC Information Assurance Workshop, 2005. IAW '05 - (2005) 92-99.
[7] Herrero, Á., Corchado, E., Gastaldo, P., Zunino, R., Neural Projection Techniques for the Visual Inspection of Network Traffic. Neurocomputing 72-16-18 (2009) 3649-3658.
[8] Herrero, Á., Corchado, E., Pellicer, M.A., Abraham, A., MOVIH-IDS: A Mobile-Visualization Hybrid Intrusion Detection System. Neurocomputing 72-13-15 (2009) 2775-2784.
[9] Charles, K.A., Decoy Systems: A New Player in Network Security and Computer Incident Response. International Journal of Digital Evidence 2-3 (2004)
[10] Provos, N., A Virtual Honeypot Framework. Proceedings of the 13th USENIX Security Symposium 132 - (2004)
[11] Baecher, P., Koetter, M., Holz, T., Dornseif, M., Freiling, F., The Nepenthes Platform: An Efficient Approach to Collect Malware. Proceedings of the 9th International Symposium on Recent Advances in Intrusion Detection (RAID 2006). LNCS 4219 -. Springer Berlin / Heidelberg (2006) 165-184.
[12] Moore, D., Shannon, C., Brown, D.J., Voelker, G.M., Savage, S., Inferring Internet Denial-of-service Activity. ACM Transactions on Computer Systems 24-2 (2006) 115-139.
[13] Ahlberg, C., Shneiderman, B., Visual Information Seeking: Tight Coupling of Dynamic Query Filters with Starfield Displays. In: Readings

On the Visualization of Honeypot Data through Projection Techniques
in Information Visualization: using Vision to Think, pp. 244-250. Morgan Kaufmann Publishers Inc. (1999).
[14] Goodall, J.R., Lutters, W.G., Rheingans, P., Komlodi, A., Preserving the Big Picture: Visual Network Traffic Analysis with TNV. Proceedings of the IEEE Workshop on Visualization for Computer Security (VizSEC 05) -. IEEE Computer Society (2005) 47-54.
[15] Laskov, P., Dussel, P., Schafer, C., Rieck, K., Learning Intrusion Detection: Supervised or Unsupervised? Proceedings of the 13th International Conference on Image Analysis and Processing (ICIAP 2005). LNCS 3617 -. Springer, Heidelberg (2005) 50-57.
[16] Pearson, K., On Lines and Planes of Closest Fit to Systems of Points in Space. Philosophical Magazine 2-6 (1901) 559-572.
[17] Hotelling, H., Analysis of a Complex of Statistical Variables into Principal Components. Journal of Education Psychology 24- (1933) 417-444.
[18] Bishop, C.M., Neural Networks for Pattern Recognition. Oxford University Press, 1996.
[19] Oja, E., Neural Networks, Principal Components, and Subspaces. International Journal of Neural Systems 1- (1989) 61-68.
[20] Oja, E., Principal Components, Minor Components, and Linear Neural Networks. Neural Networks 5-6 (1992) 927-935.
[21] Oja, E., A Simplified Neuron Model as a Principal Component Analyzer. Journal of Mathematical Biology 15-3 (1982) 267-273.
[22] Sanger, D., Contribution Analysis: a Technique for Assigning Responsibilities to Hidden Units in Connectionist Networks. Connection Science 1-2 (1989) 115-138.
[23] Fyfe, C., A Neural Network for PCA and Beyond. Neural Processing Letters 6-1-2 (1997) 33-41.
[24] Corchado, E., Fyfe, C., Connectionist Techniques for the Identification and Suppression of Interfering Underlying Factors. International Journal of Pattern Recognition and Artificial Intelligence 17-8 (2003) 1447-1466.
[25] Fyfe, C., Corchado, E., Maximum Likelihood Hebbian Rules. Proceedings of the 10th European Symposium on Artificial Neural Networks (ESANN 2002) - (2002) 143-148.
[26] Friedman, J.H., Tukey, J.W., A Projection Pursuit Algorithm for Exploratory Data-Analysis. IEEE Transactions on Computers 23-9 (1974) 881-890.
[27] Zurutuza, U., Uribeetxeberria, R., Zamboni, D., A Data Mining Approach for Analysis of Worm Activity through Automatic Signature Generation. Proceedings of the 1st ACM Workshop on AISec -. ACM (2008) 61-70.