on the robustness of the fama and french multifactor model ... of...
TRANSCRIPT
International Journal of Business and Economics, 2004, Vol. 3, No. 2, 155-176
On the Robustness of the Fama and French Multifactor Model: Evidence from France, Germany, and the United Kingdom
Mirela Malin
Department of Accounting, Finance and Economics, Griffith University, Australia
Madhu Veeraraghavan* Department of Accounting and Finance, The University of Auckland Business
School, New Zealand
Abstract
In this paper we investigate the robustness of the Fama-French multifactor model for equities listed in three European markets. We find evidence of a small firm effect in France and Germany and a big firm effect in the United Kingdom. Also, we do not find any evidence of a value effect for the markets investigated in this paper. Instead, we document a growth effect. Finally, we reject the argument that seasonal effects can explain the multifactor model results. Key words: CAPM; small firm effect; value premia; seasonal effects; multifactor models JEL classification: G120; G150
1. Introduction
Asset pricing theory attempts to link together the concept of expected prices or values that should be received from investment in an asset with the riskiness associated with that return as measured by the uncertainty caused by the potential range of possible returns (Cochrane, 2001). The way individuals and institutional investors act upon a set of estimates in determining the best investment decisions facing different probabilities can determine how aggregate investors behave and how prices are set. By constructing general equilibrium models the relevant measure of risk can be uncovered and the relationship between expected return and risk for any asset can be determined (Elton and Gruber, 1995). Campbell (2000) suggests that the main issues in asset pricing theory are the measurement of expected return and the calculation of risk that is embedded in the return. While academic
Received September 3, 2003, revised August 26, 2004, accepted November 5, 2004. ∗Correspondence to: Department of Accounting and Finance, The University of Auckland, Private Bag 92019, Auckland, New Zealand. E-mail: [email protected]. We are grateful to Chwen-Chi Liu and Jong-Shin Wei for helpful comments and suggestions.
International Journal of Business and Economics 156
researchers agree that the frequency and magnitude of the variation represents the risk measure, some have different views as to why stocks have this variation in their returns.
For almost forty years, the typical way to model the risk/return relationship and to evaluate risk has been to apply the Capital Asset Pricing Model (CAPM). Developed by Sharpe (1964) and Lintner (1965), the model explains, at least in part, the differences in riskiness between assets. Miller (1999) states that CAPM not only expressed new and powerful insights into the nature of risk but also through its empirical investigation contributed to the development of finance and to major innovations in the field of econometrics. The CAPM is an ex-ante equilibrium model based on expectations and a string of assumptions. The CAPM is based on an assumed efficient market in which there are many investors, each having the same information and expectations with respect to securities. They are also risk averse, preferring higher returns and lower risk.
Following the publication of CAPM, there were many empirical studies that tested whether the model adequately describes the way stock market prices behave in practice. Deviations from the model’s predictions continued to show up implying that investors can earn abnormal returns in excess of those predicted. Weaknesses in CAPM’s predictions were documented during the 1980s, when researchers started to look at other factors other than the beta of a stock, which is the systematic risk of CAPM, that influenced stock prices. Withstanding more than thirty years of intense econometric investigation, there was an agreement among academics that a single factor was insufficient to describe the cross-section of expected returns (Miller, 1999).
Firm size (Banz, 1981), earnings yield (Basu, 1983), leverage (Bhandari, 1988) and the firm’s book-to-market-equity (BE/ME) ratio (Chan, Hamao, and Lakonishok, 1991) were found to provide a better explanation than beta alone for the cross-section of average stock returns. In their landmark paper Fama and French (1992) show that stock risks are multidimensional. That is, they state that one dimension is proxied by size and the other by book-to-market equity. In subsequent studies, Fama and French (1993) analyse the common variation in returns by including government and corporate bonds in the time series regression, and in Fama and French (1995) the behaviour of stock prices is investigated to determine whether they relate to earnings performance.
Fama and French (1996) provide a multifactor explanation and state that their model successfully explains the anomalies not captured by CAPM. Fama and French (1996) report that an overall market factor and factors related to firm size and book-to-market equity are of interest to investors. Fama and French (1998) provide international evidence by observing that value stocks (high book-to-market equity) outperform growth stocks (low book-to-market equity) in 12 of 13 major markets during the 1975-1995 period. Fama and French (1998) document an international size effect based on the evidence that small stocks outperform large stocks in 11 out of 16 markets. This evidence suggests that the cross-section of expected stock returns is not sufficiently explained by their betas.
Mirela Malin and Madhu Veeraraghavan 157
The explanation of Fama and French (1993) that small and high book-to-market equity firms generate high returns as compensation for higher systematic risk has ignited a flurry of responses from academic researchers. Some financial economists do not share this view and are largely unconvinced about the robustness of the Fama and French results. For instance, Kothari, Shanken, and Sloan (1995), argue that the results are influenced by the survivorship bias hypothesis. The survivorship bias problem revolves around the inclusion of only the surviving firms in tests of CAPM. Brailsford and Heaney (1998) suggest that this problem can be overcome if the sample used for analysis includes all existing companies or at least a sample drawn form both surviving and failed companies.
Black (1993) and MacKinlay (1995) argue that the results are simply a result of data snooping while Lakonishok, Shleifer, and Vishny (1994) and Haugen (1995) suggest that the distress premium is irrational. Note that Kothari, Shanken, and Sloan (1995) suggest that there is a linear relationship between the cross-section of expected stock returns and beta. They also observed that the relationship between BE/ME and returns is much weaker than projected by Fama and French (1992). Kothari, Shanken, and Sloan (1995) state that when annual returns are employed in the estimation of beta, there is substantial compensation for beta risk over the 1941-1990 period.
Kothari, Shanken, and Sloan (1995) also report that the data obtained from COMPUSTAT is affected by a selection bias and provides indirect evidence. Using an alternative data source, S&P 500 from 1947 to 1987, Kothari, Shanken, and Sloan (1995) find that the book-to-market equity effect is weakly related to average returns. Hence, Kothari, Shanken, and Sloan (1995) suggest that the results of Fama and French (1993) are influenced by survivorship bias. A second area of controversy relates to the findings of Daniel and Titman (1997), who observe that the return premia on small capitalization and value stocks does not arise because of the co-movement of these stocks with pervasive factors. Daniel and Titman (1997) argue that it is characteristics rather than the covariance structure of returns that appear to explain the cross-section variation in stock returns. They call the alternative hypothesis the characteristic based model. Daniel and Titman (1997) suggest that expected returns of assets are directly related to their characteristics such as behavioral biases or liquidity that have nothing in common with the covariance structure of returns.
It is important to note that Daniel and Titman (1997) reject the Fama and French (1993) multifactor model in favor of the characteristic based model that is almost ad hoc. In short, Fama and French (1993) suggest that a firm’s size and book-to-market equity ratio are proxies for the firm’s loading on priced risk factors while Daniel and Titman (1997) observe that there is no return premium associated with the three factors identified by Fama and French (1993) and hence high returns related to these portfolios cannot be viewed as compensation for systematic risk. Daniel and Titman (1997) raise two fundamental issues: whether there really are pervasive factors directly associated with size and BE/ME, and whether there are risk premia associated with these factors.

International Journal of Business and Economics 158
Daniel and Titman (1997) construct portfolios of stocks sorted on size and book-to-market equity ratio paying special attention to the seasonality effect on these returns. Daniel and Titman (1997) adopt the same procedure and separate the returns of the size and BE/ME portfolios in January and non-January months. Daniel and Titman (1997) observe that the results when separated for seasonality, indicate, that the size effect is exclusively a January phenomenon and the BE/ME effect occurs largely in January for bigger firms where they generate a return premium of 3 percent in January and 3 percent for the non-January months. In essence, Daniel and Titman (1997) argue that it is characteristics rather than the factor loadings that determine expected returns.
The discipline of asset pricing, already prone to debate (e.g., CAPM vs. APT and the development of multifactor models), faces yet a new debate in the sense that an alternative view emerges in the spirit of Daniel and Titman (1997). Davis, Fama, and French (2000) make a valiant attempt to put an end to the debate of factor vs. characteristic based model by observing that the value premium in the US is robust and their three-factor model explains the value premium better than the characteristic based model. In a challenge to both, Berk (2000) observes that by sorting into many different groups, the power of a correct asset pricing model can be destroyed. More importantly, Berk questions studies that sort data into groups on variables, known a priori to be correlated with equity returns. Berk (2000) observes that by doing this, the explanatory power of a correctly specified asset pricing model is reduced to zero.
Jagannathan, Kubota, and Takehara (1998) find that both factor loadings and characteristics determine future returns for a Japanese sample. However, in an attempt to provide additional empirical evidence on the robustness of the characteristic based model in markets other than the US, Daniel, Titman, and Wei (2001) replicate Daniel and Titman (1997) for another Japanese sample. They reject the Fama and French three-factor model in favor of the characteristic based model. It is important to note that providing out of sample evidence on Daniel and Titman (1997) is difficult because the tests require a cross-section of stocks that is large enough to permit a researcher to construct diversified portfolios with variation in factor loadings and in characteristics. Therefore, Japanese markets are the best alternative to the US in the context of providing out of sample evidence.
The ongoing debate on the issue of whether cross-section of stock returns can be better explained by a factor or characteristic based model clearly suggests that much more work remains to be done on understanding the role of these models in asset pricing. In an important paper, Pastor and Stambaugh (2000) investigate the portfolio choices of an investor seeking a mean-variance efficient portfolio by comparing different asset pricing models. Pastor and Stambaugh (2000) compare the Fama and French (1993) and Daniel and Titman (1997) models to each other and also to the Sharpe-Lintner CAPM.
Fama and French (1993) and Daniel and Titman (1997) differ in an important aspect: Fama and French (1993) suggest that the factors identified (overall market factor, size and book-to-market equity effect) are k factors of risk and have a linear
Mirela Malin and Madhu Veeraraghavan 159
relationship with excess returns, while Daniel and Titman (1997) suggest that these factors reflect mispricing and are not factors of risk. Pastor and Stambaugh (2000) state that there is virtually no difference between the Fama and French model and Daniel and Titman’s characteristic based model as both models lead to similar portfolio choices within the investment universe constructed to exploit differences between the risk based model of Fama and French and characteristic based model of Daniel and Titman (1997). In sum, there is no difference between the factor-based model of Fama and French and the characteristic based model of Daniel and Titman (1997) as expected returns are associated with characteristics in both models. The difference is that Fama and French (1993) argue that the characteristics (firm size and book-to-market equity ratio effect) are associated with risk exposures and have no relationship with mispricing as claimed by Daniel and Titman (1997).
In light of the above evidence this paper extends the methodology of Fama and French (1993, 1996) to selected European markets. The motivation comes from the fact that the bulk of existing research relates to US portfolios and there is little evidence available on the robustness of the Fama and French multifactor model approach in the selected international markets. This paper also responds to the survivorship bias hypothesis of Kothari, Shanken, and Sloan (1995) and the data-snooping hypothesis of Black (1993) and MacKinlay (1995). Thus, in this paper we investigate the relationship between expected stock returns, overall market factor, firm size, and book-to-market equity ratio.
Barber and Lyon (1997, p. 875) observe that the most obvious means of evaluating the data-snooping hypothesis is to test the robustness of the results documented by Fama and French (1992) using different time periods, different countries, or a holdout sample. In this paper we test the robustness of the Fama and French multifactor model using different countries and different time periods. This paper is also motivated by the observation of Campbell, Lo, and MacKinlay (1997) that the usefulness of multifactor models will not be fully known until sufficient new data become available to provide a true out-of-sample check on their performance. Once again, we provide out of sample evidence by investigating the robustness of the Fama and French multifactor model in French, German, and UK markets.
Malkiel (1999) shares this view by suggesting that if the best single risk estimate were to be chosen the traditional beta is unlikely to be everyone’s first choice and that there is intense debate concerning risk measurement and much more empirical testing is necessary. This paper also tests the seasonal effects in the selected international markets, as empirical evidence suggests that small firms have larger risk adjusted returns in January than in other months. Our objective is to provide both researchers and investors with a greater breadth and depth of understanding of the anomalies discovered in the area of asset pricing techniques. This paper is timely and important in the sense that it furthers the debate in the area of risk measurement techniques. Malkiel (1999, p. 238) aptly summarizes the issue of risk measurement by stating that “... there is still much debate within the academic community on risk measurement and much more empirical testing needs to be done. Undoubtedly, there will yet be many improvements in the techniques of
International Journal of Business and Economics 160
risk analysis and the quantitative analysis of risk measurement is far from dead. Future risk measures will be more sophisticated—not less so.” In a similar vein, Bishop et al. (2001, p. 192) state “The Fama and French model needs more time and further empirical verification before it can be accepted as a credible theory-based model to replace the CAPM.” Thus, in this paper we extend the methodology of Fama and French (1993) to selected international markets.
The remainder of the paper is organized as follows. Section 2 presents the data and the methodology adopted in this paper. Section 3 presents the findings, and Section 4 concludes the paper.
2. Data and Methods
2.1 The Model
Monthly stock returns (Return Index, Datastream datatype RI) and accounting data (market value, Datastream datatype MV, and book value of shareholder’s equity, Datastream datatype Equity capital and reserves) are obtained from Datastream Advance 3.5 maintained by Primark International. The return index is available for individual equities and shows a theoretical growth in value of a share holding over a specified period assuming that the dividends are reinvested. Market value is defined as share price multiplied by the number of ordinary shares in issue. The book value of shareholders equity is defined as the equity share capital and reserves of the company. In this paper we include both financial and non-financial firms as opposed to Fama and French (1992) who only include non-financial firms in their sample. We follow the mimicking portfolio approach of Fama and French (1993, 1996) and form portfolios on firm size and book-to-market equity.
We investigate the relationship between the expected return of a certain portfolio and the overall market factor, firm size, and book-to-market equity by employing the following model:
( )pt ft pt p mt ft p t p t ptR R a b R R s SMB h HML ε− = + − + + + (1)
Each month, the returns of each of the six portfolios are regressed against the three factors to determine whether there are excess returns above the risk free rate. Here Rpt is the average monthly return of a certain portfolio (S/L, S/M, S/H, B/L, B/M, and B/H) and Rft is the risk-free rate observed at the end of each month. We use the France Benchmark Bond 10-year yield, Germany Benchmark Bond 10-year yield, and the 1-month interbank rate as risk free rates for France, Germany, and the UK respectively.
We define the six intersection portfolios as follows. The S/L portfolio consists of firms that are both small in size and low in book-to-market equity, the S/M portfolio consists of firms that are both small in size and medium in book-to-market equity, and the S/H portfolio consists of firms that are both small in size and high in

Mirela Malin and Madhu Veeraraghavan 161
book-to-market equity. Similarly, the B/L portfolio consists of firms that are both big in size and low in book-to-market equity, the B/M portfolio consists of firms that are big in size and medium in book-to-market equity, and the B/H portfolio consists of firms that are big in size and high in book-to-market equity. The three zero investment portfolios that proxy as risk factors are: the market factor (Rmt−Rft) long the market portfolio (Rmt) and short the risk free asset (Rft); the size factor (SMB) long small capitalization stocks and short large capitalization stocks; and, the book-to-market factor (HML) long high book-to-market equity stocks and short low book-to-market equity stocks. The factor loadings (bp, sp, and hp) are the slopes in the time-series regression, while apt is the intercept of the regression line and εpt the error term.
2.2 Portfolio Construction Procedures
Year t represents the fiscal year for each company in the sample, and for France and Germany that date is the 31st of December while for the UK it is the 31st of March. At the end of year t stocks are assigned to two portfolios of size (Small or Big) based on whether their December Market Equity (ME), defined as closing price times number of shares outstanding, is above or below the median ME. The same stocks are allocated in an independent sort to three book-to-market equity portfolios (Low, Medium, or High) based on the breakpoints for the bottom 33.33 percent and top 66.67 percent. We then construct six size/book-to-market equity portfolios formed at the intersection of the two sizes and three book-to-market equity portfolios. The six portfolios formed are S/L, S/M, S/H, B/L, B/M, and B/H.
The explanatory variables RM, SMB, and HML are defined as follows: RM is the market return on all stocks in the six portfolios, SMB (Small minus Big) is the difference each month between the average of the returns of the three small stock portfolios (S/L, S/M, and S/H) and the average of the returns of the three big portfolios (B/L, B/M, and B/H), and HML (High minus Low) is the difference between the average of the returns of the two high book-to-market equity portfolios (S/H and B/H) and the average of the returns on the two low book-to-market equity portfolios (S/L and B/L).
3. Empirical Results
3.1 Tests of the Multiple Risk Factor Model
3.1.1 France
Table 1 presents the number of companies in each portfolio for the sample period. It shows that on average, the three small stock portfolios have the lowest number of firms compared to the three big stock portfolios; more precisely, S/L and S/M have an average of 21 firms each and S/H has an average of 34 firms. The B/M portfolio has the largest number stocks with an average of 77 firms, while B/L and B/H have an average of 71 and 62 firms respectively. The mean monthly returns
International Journal of Business and Economics 162
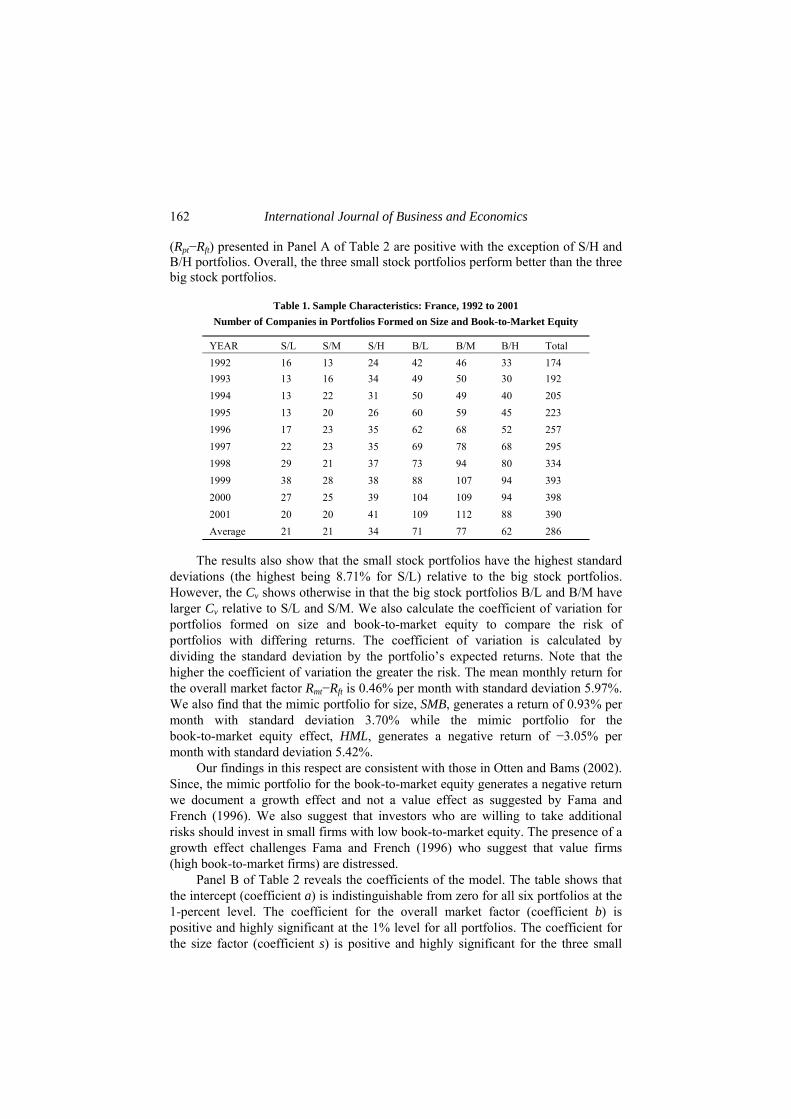
(Rpt−Rft) presented in Panel A of Table 2 are positive with the exception of S/H and B/H portfolios. Overall, the three small stock portfolios perform better than the three big stock portfolios.
Table 1. Sample Characteristics: France, 1992 to 2001 Number of Companies in Portfolios Formed on Size and Book-to-Market Equity
YEAR S/L S/M S/H B/L B/M B/H Total 1992 16 13 24 42 46 33 174 1993 13 16 34 49 50 30 192 1994 13 22 31 50 49 40 205 1995 13 20 26 60 59 45 223 1996 17 23 35 62 68 52 257 1997 22 23 35 69 78 68 295 1998 29 21 37 73 94 80 334 1999 38 28 38 88 107 94 393 2000 27 25 39 104 109 94 398 2001 20 20 41 109 112 88 390 Average 21 21 34 71 77 62 286
The results also show that the small stock portfolios have the highest standard deviations (the highest being 8.71% for S/L) relative to the big stock portfolios. However, the Cv shows otherwise in that the big stock portfolios B/L and B/M have larger Cv relative to S/L and S/M. We also calculate the coefficient of variation for portfolios formed on size and book-to-market equity to compare the risk of portfolios with differing returns. The coefficient of variation is calculated by dividing the standard deviation by the portfolio’s expected returns. Note that the higher the coefficient of variation the greater the risk. The mean monthly return for the overall market factor Rmt−Rft is 0.46% per month with standard deviation 5.97%. We also find that the mimic portfolio for size, SMB, generates a return of 0.93% per month with standard deviation 3.70% while the mimic portfolio for the book-to-market equity effect, HML, generates a negative return of −3.05% per month with standard deviation 5.42%.
Our findings in this respect are consistent with those in Otten and Bams (2002). Since, the mimic portfolio for the book-to-market equity generates a negative return we document a growth effect and not a value effect as suggested by Fama and French (1996). We also suggest that investors who are willing to take additional risks should invest in small firms with low book-to-market equity. The presence of a growth effect challenges Fama and French (1996) who suggest that value firms (high book-to-market firms) are distressed.
Panel B of Table 2 reveals the coefficients of the model. The table shows that the intercept (coefficient a) is indistinguishable from zero for all six portfolios at the 1-percent level. The coefficient for the overall market factor (coefficient b) is positive and highly significant at the 1% level for all portfolios. The coefficient for the size factor (coefficient s) is positive and highly significant for the three small

Mirela Malin and Madhu Veeraraghavan 163
stocks portfolios; it is negative for B/L and positive for B/M and B/H, although not statistically significant. These findings are consistent with Fama and French (1996), who show that small firms load positively on SMB while big firms load negatively on SMB. The book-to-market factor (coefficient h) shows that high book-to-market portfolios (value stocks) load positively on the HML factor while the low and medium portfolios show negative or diminishing positive slopes.
Table 2. Summary Statistics and Multifactor Regressions for Portfolios Formed on Size and Book-to-Market Ratio: France
Book-to-Market Equity Portfolios
Size Low Medium High Low Medium High
Panel A: Summary Statistics Means Standard Deviations (CV)
Small 3.82 1.30 -0.25 8.71 (2.28) 6.25 (4.81) 4.39 (-17.56) Big 2.03 0.49 -0.23 6.68 (3.29) 4.82 (9.83) 4.37 (-19.00)
Panel B: Regression Coefficients Rpt – Rft = ap + bp(Rmt − Rft) + spSMBt + hpHMLt + εpt
Low Medium High Low Medium High
a t(a)Small 0.001 −0.001 0.001 0.373 −0.459 0.331 Big 0.000 0.001 −0.000 −0.209 0.613 −0.174
b t(b)Small 0.685 0.709 0.650 11.442 9.845 11.417 Big 0.629 0.751 0.663 10.205 15.196 12.349
s t(s)Small 1.308 1.198 0.857 12.987 9.885 8.941 Big −0.166 0.243 0.286 −1.567 2.923 3.160
h t(h)Small −0.706 −0.012 0.403 −10.390 −0.154 6.232 Big −0.645 0.082 0.246 −9.215 1.477 4.032
R2 s(e)Small 0.87 0.64 0.54 3.13 3.77 2.98 Big 0.77 0.71 0.59 3.22 2.59 2.81
DW Small 2.03 1.92 1.93 Big 1.76 1.95 2.05
Our findings are again consistent with those of Fama and French (1996) and others who observe that high book-to-market firms load positively on the HML factor and low book-to-market firms load negatively on the HML factor. We also find that the coefficient increases monotonically for all six portfolios. The adjusted R2 ranges from 0.54 to 0.87 with an average of 0.69 for the six portfolios, indicating that the independent variables help explain 69% of the variation in the dependent variable. As far as diagnostics are concerned we do not find any evidence of
International Journal of Business and Economics 164
autocorrelation or multicollinearity entering our regression model. We also employed the Augmented Dickey-Fuller (ADF) unit root test to test for nonstationarity for all three markets investigated in this paper. We compare the computed value of the ADF test for each portfolio with the critical values at 1, 5, and 10% levels and do not find any evidence of nonstationarity as the computed test statistic for each portfolio is greater than the critical Dickey-Fuller values at all three levels. Thus, we conclude that the time-series is stationary.
3.1.2 Germany
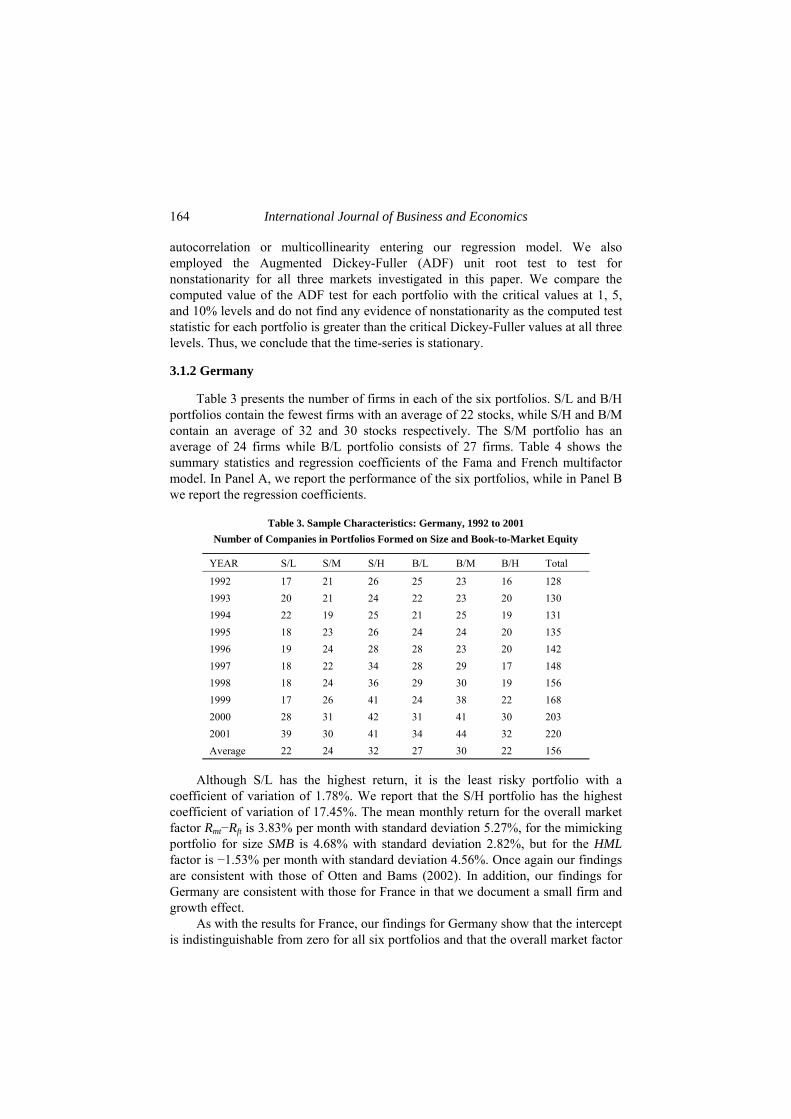
Table 3 presents the number of firms in each of the six portfolios. S/L and B/H portfolios contain the fewest firms with an average of 22 stocks, while S/H and B/M contain an average of 32 and 30 stocks respectively. The S/M portfolio has an average of 24 firms while B/L portfolio consists of 27 firms. Table 4 shows the summary statistics and regression coefficients of the Fama and French multifactor model. In Panel A, we report the performance of the six portfolios, while in Panel B we report the regression coefficients.
Table 3. Sample Characteristics: Germany, 1992 to 2001 Number of Companies in Portfolios Formed on Size and Book-to-Market Equity
YEAR S/L S/M S/H B/L B/M B/H Total
1992 17 21 26 25 23 16 128 1993 20 21 24 22 23 20 130 1994 22 19 25 21 25 19 131 1995 18 23 26 24 24 20 135 1996 19 24 28 28 23 20 142 1997 18 22 34 28 29 17 148 1998 18 24 36 29 30 19 156 1999 17 26 41 24 38 22 168 2000 28 31 42 31 41 30 203 2001 39 30 41 34 44 32 220 Average 22 24 32 27 30 22 156
Although S/L has the highest return, it is the least risky portfolio with a coefficient of variation of 1.78%. We report that the S/H portfolio has the highest coefficient of variation of 17.45%. The mean monthly return for the overall market factor Rmt−Rft is 3.83% per month with standard deviation 5.27%, for the mimicking portfolio for size SMB is 4.68% with standard deviation 2.82%, but for the HML factor is −1.53% per month with standard deviation 4.56%. Once again our findings are consistent with those of Otten and Bams (2002). In addition, our findings for Germany are consistent with those for France in that we document a small firm and growth effect.
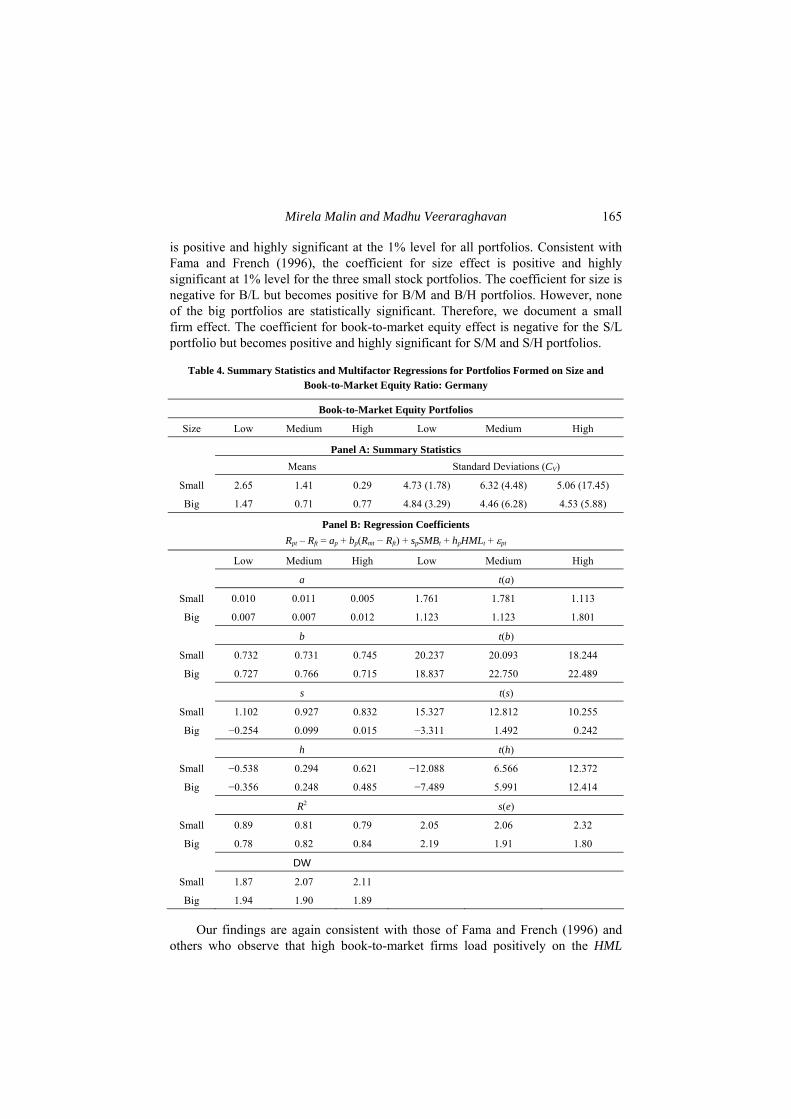
As with the results for France, our findings for Germany show that the intercept is indistinguishable from zero for all six portfolios and that the overall market factor
Mirela Malin and Madhu Veeraraghavan 165
is positive and highly significant at the 1% level for all portfolios. Consistent with Fama and French (1996), the coefficient for size effect is positive and highly significant at 1% level for the three small stock portfolios. The coefficient for size is negative for B/L but becomes positive for B/M and B/H portfolios. However, none of the big portfolios are statistically significant. Therefore, we document a small firm effect. The coefficient for book-to-market equity effect is negative for the S/L portfolio but becomes positive and highly significant for S/M and S/H portfolios.
Table 4. Summary Statistics and Multifactor Regressions for Portfolios Formed on Size and Book-to-Market Equity Ratio: Germany
Book-to-Market Equity Portfolios
Size Low Medium High Low Medium High
Panel A: Summary Statistics Means Standard Deviations (CV)
Small 2.65 1.41 0.29 4.73 (1.78) 6.32 (4.48) 5.06 (17.45)
Big 1.47 0.71 0.77 4.84 (3.29) 4.46 (6.28) 4.53 (5.88)
Panel B: Regression Coefficients Rpt – Rft = ap + bp(Rmt − Rft) + spSMBt + hpHMLt + εpt
Low Medium High Low Medium High
a t(a)
Small 0.010 0.011 0.005 1.761 1.781 1.113
Big 0.007 0.007 0.012 1.123 1.123 1.801
b t(b)
Small 0.732 0.731 0.745 20.237 20.093 18.244
Big 0.727 0.766 0.715 18.837 22.750 22.489
s t(s)
Small 1.102 0.927 0.832 15.327 12.812 10.255
Big −0.254 0.099 0.015 −3.311 1.492 0.242
h t(h)
Small −0.538 0.294 0.621 −12.088 6.566 12.372
Big −0.356 0.248 0.485 −7.489 5.991 12.414
R2 s(e)
Small 0.89 0.81 0.79 2.05 2.06 2.32
Big 0.78 0.82 0.84 2.19 1.91 1.80
DW
Small 1.87 2.07 2.11
Big 1.94 1.90 1.89
Our findings are again consistent with those of Fama and French (1996) and others who observe that high book-to-market firms load positively on the HML

International Journal of Business and Economics 166
factor and low book-to-market firms load negatively on HML factor. We find that the coefficient increases monotonically for all six portfolios. The adjusted R2 ranges from 0.78 to 0.89 with an average of 0.82, indicating that the independent variables help explain 82% of the variation in the dependent variable. Tests of autocorrelation reveal no evidence of diagnostic problems in the data. We also do not find any evidence of multicollinearity as the tolerance, variance inflation factor, and condition index are well within the specified limits.
3.1.3 United Kingdom
Table 5 shows the sample characteristics for the United Kingdom. The highest number of firms is in the S/H portfolio with an average of 222 firms followed by the B/L portfolio with an average of 208 stocks. The S/M portfolio has an average of 133 firms and the B/M portfolio has an average of 192 firms. The S/L and B/H portfolios have an average of 79 and 93 firms respectively. Our findings reveal that the mean monthly return for the overall market portfolio factor Rmt−Rft is 0.27% per month with standard deviation 4.14%. However, returns for the two mimic portfolios for size and book-to-market equity are −0.20% per month with standard deviation 3.25% and –3.56% per month with standard deviation 5.71%. Our findings in this respect are consistent with Otten and Bams (2002). Since the returns for the two mimic portfolios are negative, we document a big firm and growth effect.
Table 5. Sample Characteristics: United Kingdom, 1991 to 2001 Number of Companies in Portfolios Formed on Size and Book-to-Market Equity
YEAR S/L S/M S/H B/L B/M B/H Total 1991 50 100 153 159 125 67 654 1992 46 90 173 164 141 53 667 1993 57 83 164 145 152 64 665 1994 73 89 160 147 158 79 706 1995 54 104 180 183 162 80 763 1996 57 114 194 198 181 92 836 1997 81 130 234 220 211 97 973 1998 103 159 258 235 223 114 1092 1999 106 179 279 240 234 121 1159 2000 85 194 288 276 240 133 1216 2001 128 224 363 322 281 128 1446 Average 76 133 222 208 192 93 925
As with France and Germany our findings for the United Kingdom show that the intercept is indistinguishable from zero for all six portfolios and that the market factor is positive and highly significant for all six portfolios. The coefficient s is highly positive and significant for the three small stock portfolios and negative for B/L but becomes positive for B/M and B/H, although they are not statistically significant. Once again, the findings are consistent with Fama and French (1996)
Mirela Malin and Madhu Veeraraghavan 167
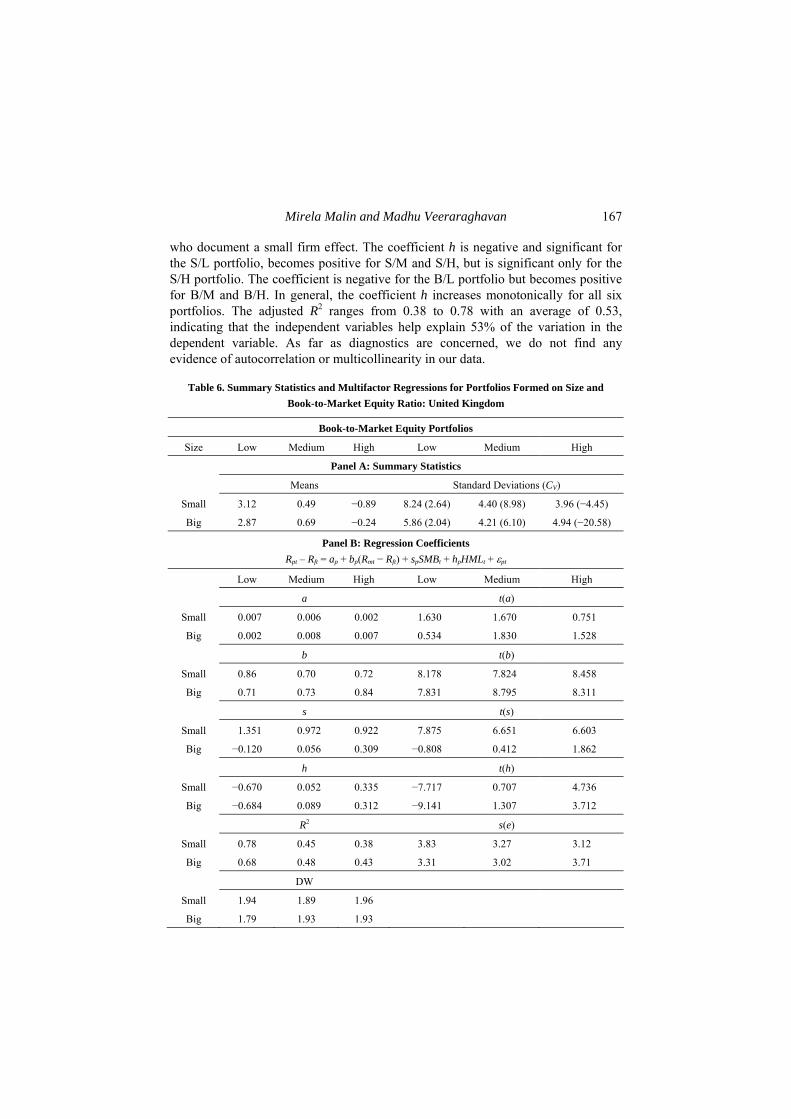
who document a small firm effect. The coefficient h is negative and significant for the S/L portfolio, becomes positive for S/M and S/H, but is significant only for the S/H portfolio. The coefficient is negative for the B/L portfolio but becomes positive for B/M and B/H. In general, the coefficient h increases monotonically for all six portfolios. The adjusted R2 ranges from 0.38 to 0.78 with an average of 0.53, indicating that the independent variables help explain 53% of the variation in the dependent variable. As far as diagnostics are concerned, we do not find any evidence of autocorrelation or multicollinearity in our data.
Table 6. Summary Statistics and Multifactor Regressions for Portfolios Formed on Size and Book-to-Market Equity Ratio: United Kingdom
Book-to-Market Equity Portfolios
Size Low Medium High Low Medium High
Panel A: Summary Statistics
Means Standard Deviations (CV)
Small 3.12 0.49 −0.89 8.24 (2.64) 4.40 (8.98) 3.96 (−4.45)
Big 2.87 0.69 −0.24 5.86 (2.04) 4.21 (6.10) 4.94 (−20.58)
Panel B: Regression Coefficients Rpt – Rft = ap + bp(Rmt − Rft) + spSMBt + hpHMLt + εpt
Low Medium High Low Medium High
a t(a)
Small 0.007 0.006 0.002 1.630 1.670 0.751
Big 0.002 0.008 0.007 0.534 1.830 1.528
b t(b)
Small 0.86 0.70 0.72 8.178 7.824 8.458
Big 0.71 0.73 0.84 7.831 8.795 8.311
s t(s)
Small 1.351 0.972 0.922 7.875 6.651 6.603
Big −0.120 0.056 0.309 −0.808 0.412 1.862
h t(h)
Small −0.670 0.052 0.335 −7.717 0.707 4.736
Big −0.684 0.089 0.312 −9.141 1.307 3.712
R2 s(e)
Small 0.78 0.45 0.38 3.83 3.27 3.12
Big 0.68 0.48 0.43 3.31 3.02 3.71
DW
Small 1.94 1.89 1.96
Big 1.79 1.93 1.93
International Journal of Business and Economics 168
3.2 Seasonal Effects
3.2.1 France
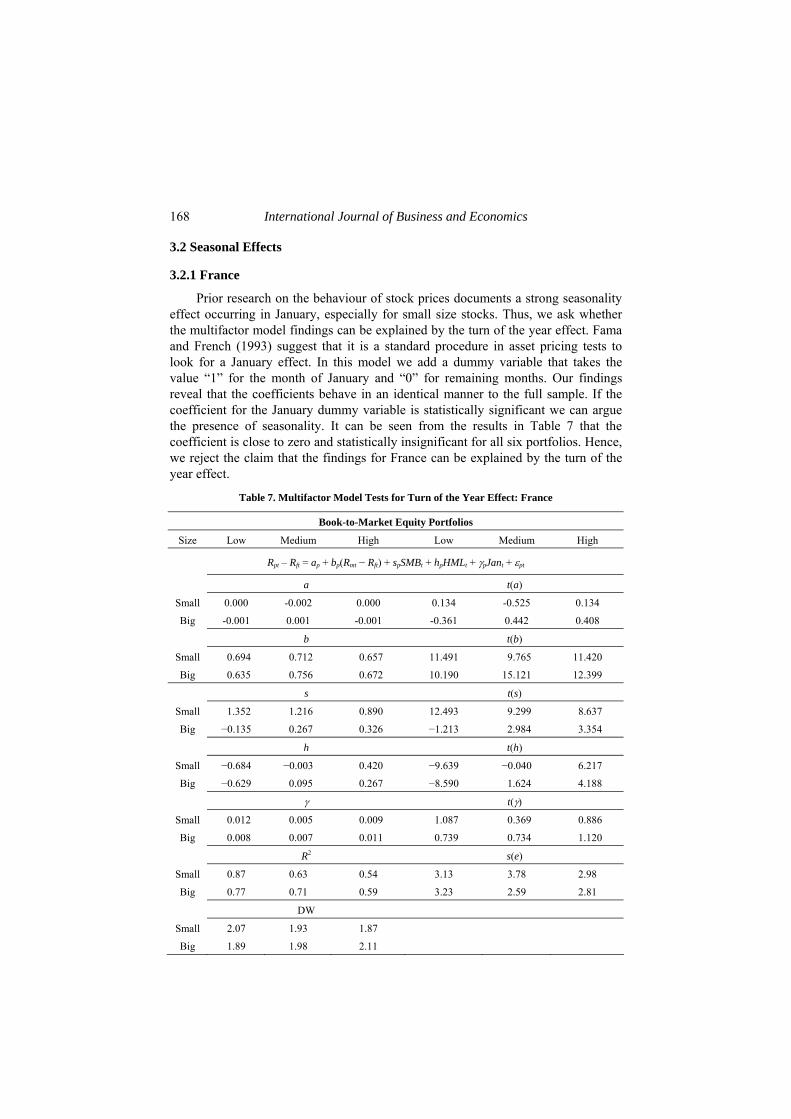
Prior research on the behaviour of stock prices documents a strong seasonality effect occurring in January, especially for small size stocks. Thus, we ask whether the multifactor model findings can be explained by the turn of the year effect. Fama and French (1993) suggest that it is a standard procedure in asset pricing tests to look for a January effect. In this model we add a dummy variable that takes the value “1” for the month of January and “0” for remaining months. Our findings reveal that the coefficients behave in an identical manner to the full sample. If the coefficient for the January dummy variable is statistically significant we can argue the presence of seasonality. It can be seen from the results in Table 7 that the coefficient is close to zero and statistically insignificant for all six portfolios. Hence, we reject the claim that the findings for France can be explained by the turn of the year effect.
Table 7. Multifactor Model Tests for Turn of the Year Effect: France
Book-to-Market Equity Portfolios
Size Low Medium High Low Medium High
Rpt – Rft = ap + bp(Rmt − Rft) + spSMBt + hpHMLt + γpJant + εpt
a t(a)
Small 0.000 -0.002 0.000 0.134 -0.525 0.134
Big -0.001 0.001 -0.001 -0.361 0.442 0.408
b t(b)
Small 0.694 0.712 0.657 11.491 9.765 11.420
Big 0.635 0.756 0.672 10.190 15.121 12.399
s t(s)
Small 1.352 1.216 0.890 12.493 9.299 8.637
Big −0.135 0.267 0.326 −1.213 2.984 3.354
h t(h)
Small −0.684 −0.003 0.420 −9.639 −0.040 6.217
Big −0.629 0.095 0.267 −8.590 1.624 4.188
γ t(γ)
Small 0.012 0.005 0.009 1.087 0.369 0.886
Big 0.008 0.007 0.011 0.739 0.734 1.120
R2 s(e)
Small 0.87 0.63 0.54 3.13 3.78 2.98
Big 0.77 0.71 0.59 3.23 2.59 2.81
DW
Small 2.07 1.93 1.87
Big 1.89 1.98 2.11
Mirela Malin and Madhu Veeraraghavan 169
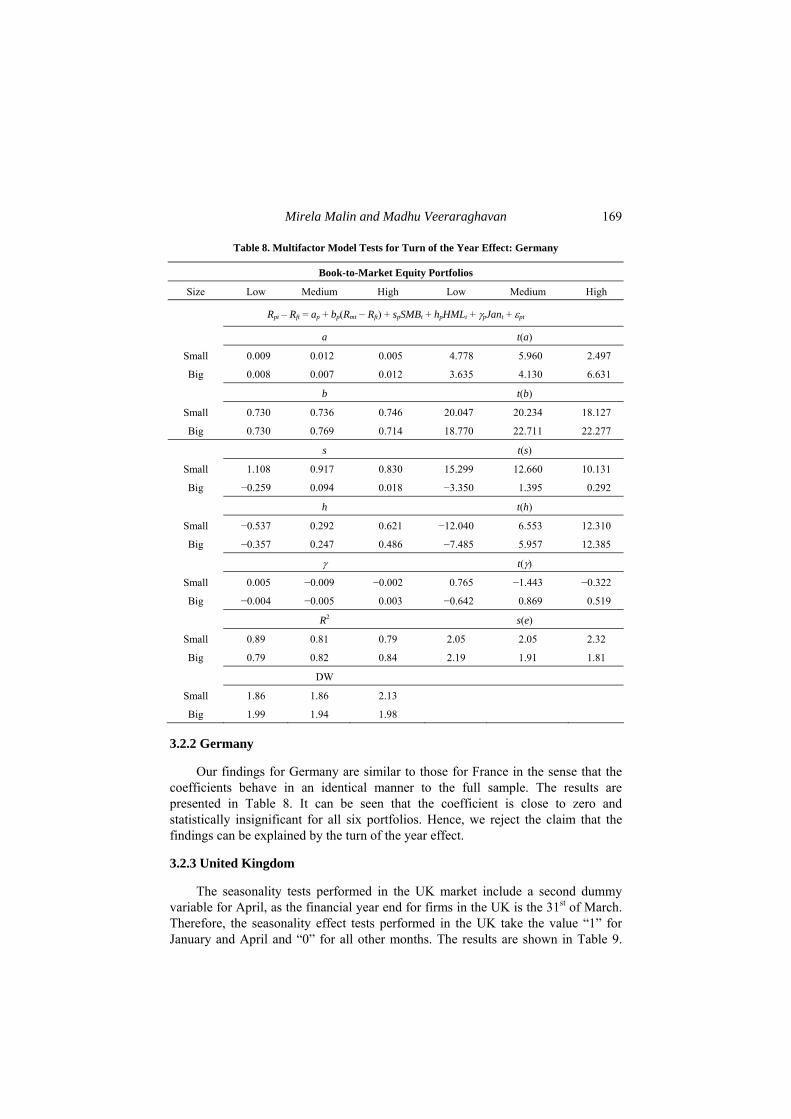
Table 8. Multifactor Model Tests for Turn of the Year Effect: Germany
Book-to-Market Equity Portfolios
Size Low Medium High Low Medium High
Rpt – Rft = ap + bp(Rmt − Rft) + spSMBt + hpHMLt + γpJant + εpt
a t(a)
Small 0.009 0.012 0.005 4.778 5.960 2.497
Big 0.008 0.007 0.012 3.635 4.130 6.631
b t(b)
Small 0.730 0.736 0.746 20.047 20.234 18.127
Big 0.730 0.769 0.714 18.770 22.711 22.277
s t(s)
Small 1.108 0.917 0.830 15.299 12.660 10.131
Big −0.259 0.094 0.018 −3.350 1.395 0.292
h t(h)
Small −0.537 0.292 0.621 −12.040 6.553 12.310
Big −0.357 0.247 0.486 −7.485 5.957 12.385
γ t(γ)
Small 0.005 −0.009 −0.002 0.765 −1.443 −0.322
Big −0.004 −0.005 0.003 −0.642 0.869 0.519
R2 s(e)
Small 0.89 0.81 0.79 2.05 2.05 2.32
Big 0.79 0.82 0.84 2.19 1.91 1.81
DW
Small 1.86 1.86 2.13
Big 1.99 1.94 1.98
3.2.2 Germany
Our findings for Germany are similar to those for France in the sense that the coefficients behave in an identical manner to the full sample. The results are presented in Table 8. It can be seen that the coefficient is close to zero and statistically insignificant for all six portfolios. Hence, we reject the claim that the findings can be explained by the turn of the year effect.
3.2.3 United Kingdom
The seasonality tests performed in the UK market include a second dummy variable for April, as the financial year end for firms in the UK is the 31st of March. Therefore, the seasonality effect tests performed in the UK take the value “1” for January and April and “0” for all other months. The results are shown in Table 9.
International Journal of Business and Economics 170
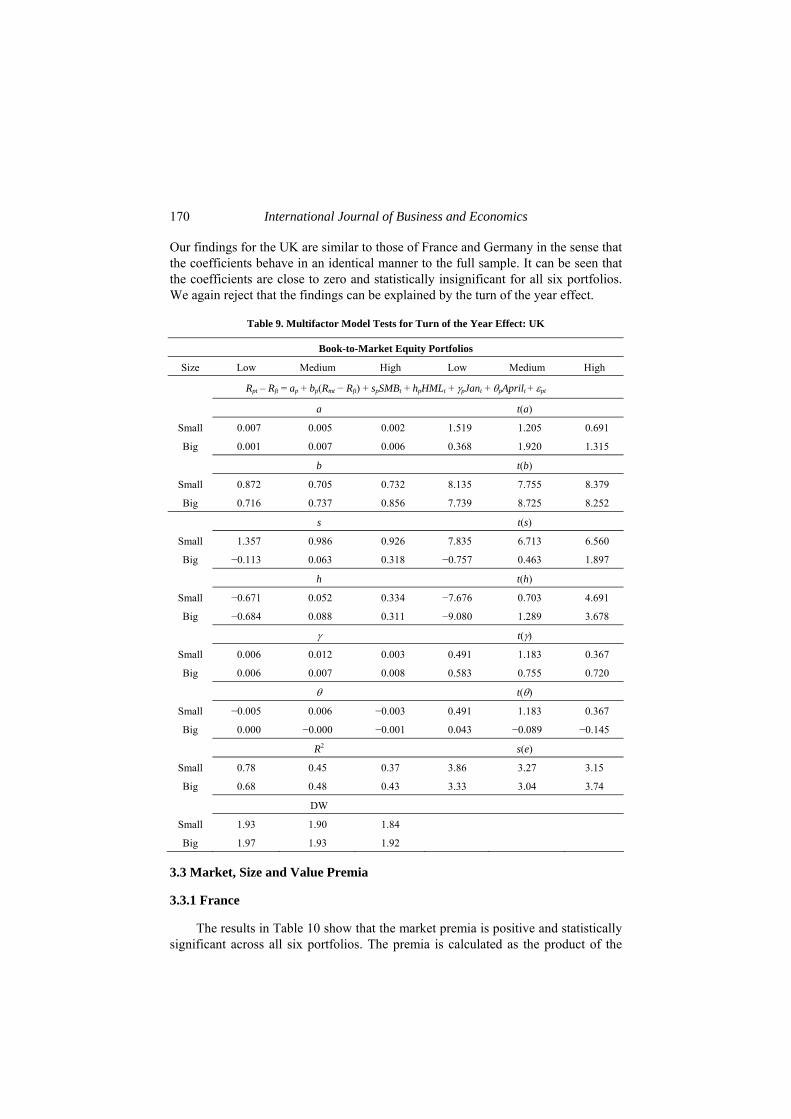
Our findings for the UK are similar to those of France and Germany in the sense that the coefficients behave in an identical manner to the full sample. It can be seen that the coefficients are close to zero and statistically insignificant for all six portfolios. We again reject that the findings can be explained by the turn of the year effect.
Table 9. Multifactor Model Tests for Turn of the Year Effect: UK
Book-to-Market Equity Portfolios
Size Low Medium High Low Medium High
Rpt – Rft = ap + bp(Rmt − Rft) + spSMBt + hpHMLt + γpJant + θpAprilt + εpt
a t(a)
Small 0.007 0.005 0.002 1.519 1.205 0.691
Big 0.001 0.007 0.006 0.368 1.920 1.315
b t(b)
Small 0.872 0.705 0.732 8.135 7.755 8.379
Big 0.716 0.737 0.856 7.739 8.725 8.252
s t(s)
Small 1.357 0.986 0.926 7.835 6.713 6.560
Big −0.113 0.063 0.318 −0.757 0.463 1.897
h t(h)
Small −0.671 0.052 0.334 −7.676 0.703 4.691
Big −0.684 0.088 0.311 −9.080 1.289 3.678
γ t(γ)
Small 0.006 0.012 0.003 0.491 1.183 0.367
Big 0.006 0.007 0.008 0.583 0.755 0.720
θ t(θ)
Small −0.005 0.006 −0.003 0.491 1.183 0.367
Big 0.000 −0.000 −0.001 0.043 −0.089 −0.145
R2 s(e)
Small 0.78 0.45 0.37 3.86 3.27 3.15
Big 0.68 0.48 0.43 3.33 3.04 3.74
DW
Small 1.93 1.90 1.84
Big 1.97 1.93 1.92
3.3 Market, Size and Value Premia
3.3.1 France
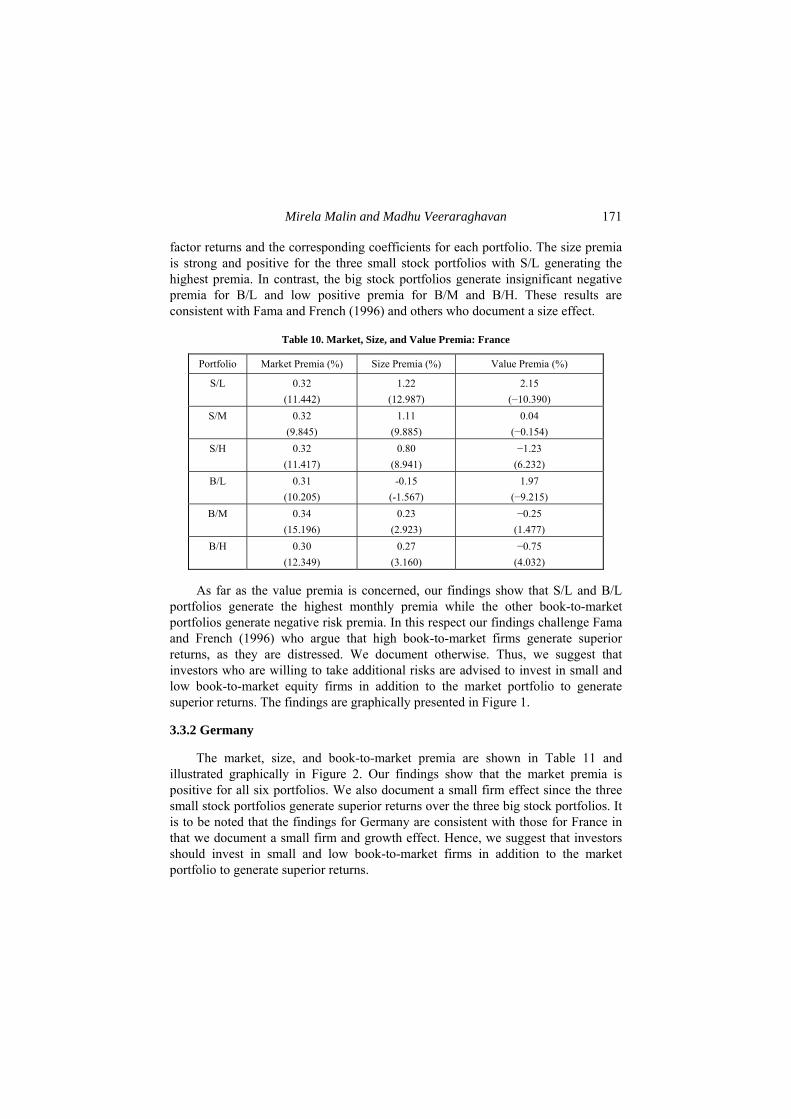
The results in Table 10 show that the market premia is positive and statistically significant across all six portfolios. The premia is calculated as the product of the
Mirela Malin and Madhu Veeraraghavan 171
factor returns and the corresponding coefficients for each portfolio. The size premia is strong and positive for the three small stock portfolios with S/L generating the highest premia. In contrast, the big stock portfolios generate insignificant negative premia for B/L and low positive premia for B/M and B/H. These results are consistent with Fama and French (1996) and others who document a size effect.
Table 10. Market, Size, and Value Premia: France
Portfolio Market Premia (%) Size Premia (%) Value Premia (%)
S/L 0.32 (11.442)
1.22 (12.987)
2.15 (−10.390)
S/M 0.32 (9.845)
1.11 (9.885)
0.04 (−0.154)
S/H 0.32 (11.417)
0.80 (8.941)
−1.23 (6.232)
B/L 0.31 (10.205)
-0.15 (-1.567)
1.97 (−9.215)
B/M 0.34 (15.196)
0.23 (2.923)
−0.25 (1.477)
B/H 0.30 (12.349)
0.27 (3.160)
−0.75 (4.032)
As far as the value premia is concerned, our findings show that S/L and B/L portfolios generate the highest monthly premia while the other book-to-market portfolios generate negative risk premia. In this respect our findings challenge Fama and French (1996) who argue that high book-to-market firms generate superior returns, as they are distressed. We document otherwise. Thus, we suggest that investors who are willing to take additional risks are advised to invest in small and low book-to-market equity firms in addition to the market portfolio to generate superior returns. The findings are graphically presented in Figure 1.
3.3.2 Germany
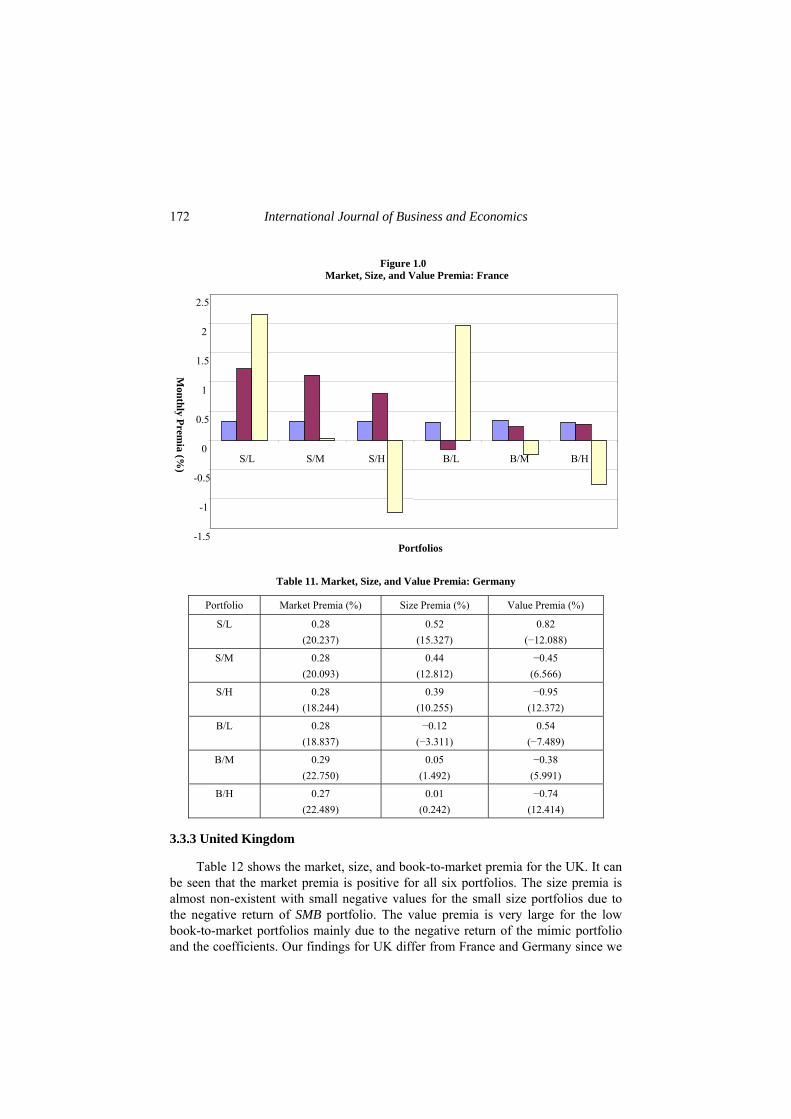
The market, size, and book-to-market premia are shown in Table 11 and illustrated graphically in Figure 2. Our findings show that the market premia is positive for all six portfolios. We also document a small firm effect since the three small stock portfolios generate superior returns over the three big stock portfolios. It is to be noted that the findings for Germany are consistent with those for France in that we document a small firm and growth effect. Hence, we suggest that investors should invest in small and low book-to-market firms in addition to the market portfolio to generate superior returns.
International Journal of Business and Economics 172
Table 11. Market, Size, and Value Premia: Germany
Portfolio Market Premia (%) Size Premia (%) Value Premia (%)
S/L 0.28 (20.237)
0.52 (15.327)
0.82 (−12.088)
S/M 0.28 (20.093)
0.44 (12.812)
−0.45 (6.566)
S/H 0.28 (18.244)
0.39 (10.255)
−0.95 (12.372)
B/L 0.28 (18.837)
−0.12 (−3.311)
0.54 (−7.489)
B/M 0.29 (22.750)
0.05 (1.492)
−0.38 (5.991)
B/H 0.27 (22.489)
0.01 (0.242)
−0.74 (12.414)
3.3.3 United Kingdom
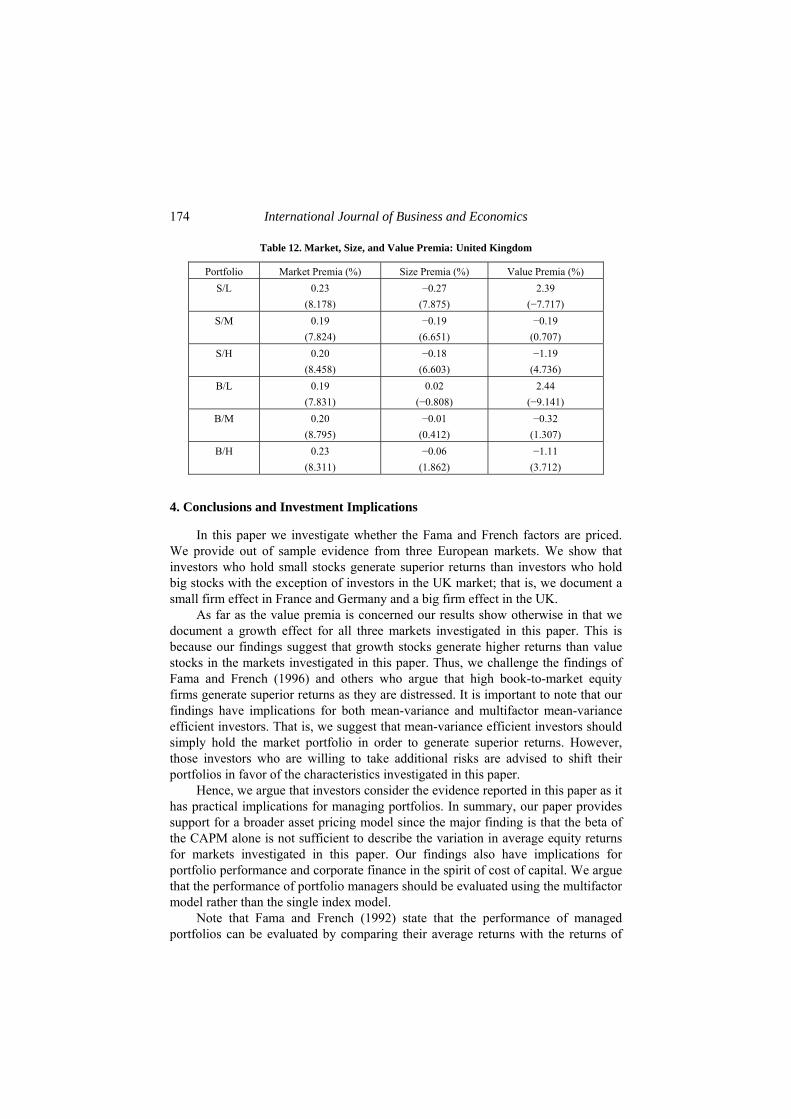
Table 12 shows the market, size, and book-to-market premia for the UK. It can be seen that the market premia is positive for all six portfolios. The size premia is almost non-existent with small negative values for the small size portfolios due to the negative return of SMB portfolio. The value premia is very large for the low book-to-market portfolios mainly due to the negative return of the mimic portfolio and the coefficients. Our findings for UK differ from France and Germany since we
Market, Size, and Value Premia: France
-1.5
-1
-0.5
0
0.5
1
1.5
2
2.5
S/L S/M S/H B/L B/M B/H
Portfolios
Figure 1.0
Monthly Prem
ia (%)
Mirela Malin and Madhu Veeraraghavan 173
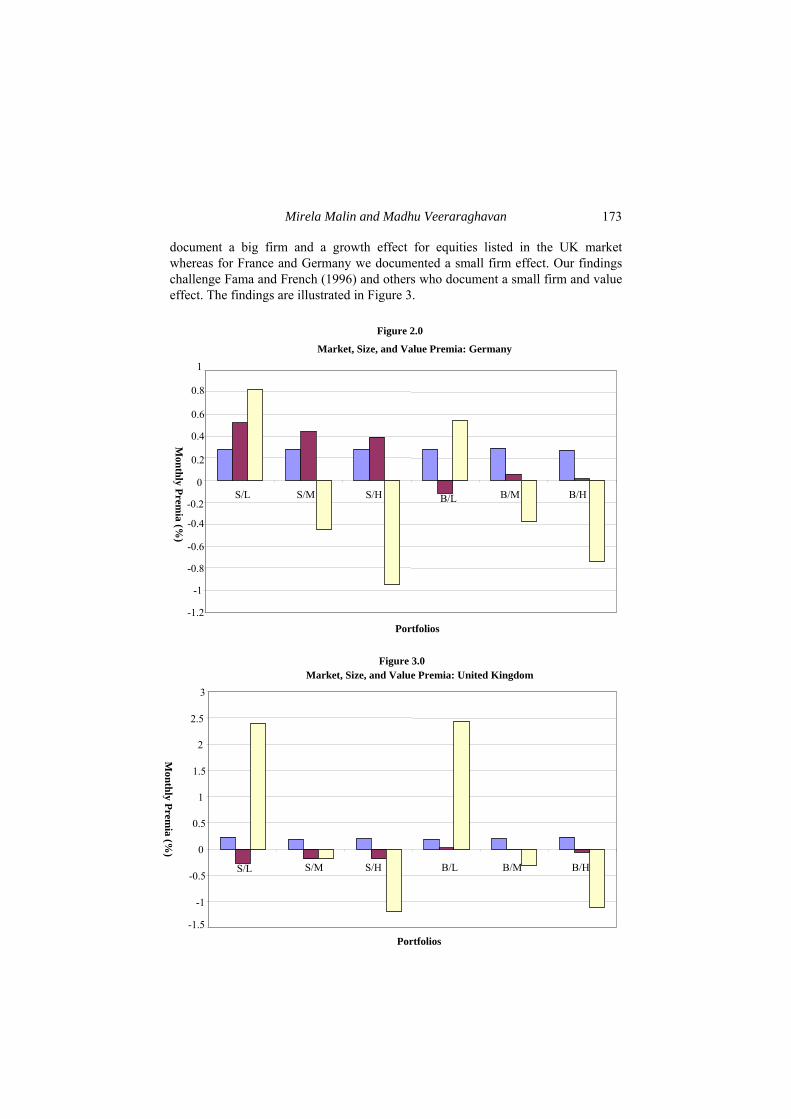
document a big firm and a growth effect for equities listed in the UK market whereas for France and Germany we documented a small firm effect. Our findings challenge Fama and French (1996) and others who document a small firm and value effect. The findings are illustrated in Figure 3.
Figure 2.0
Market, Size, and Value Premia: Germany
-1.2
-1
-0.8
-0.6
-0.4
-0.2
0
0.2
0.4
0.6
0.8
1
S/L S/M S/H B/L B/M B/H
Portfolios M
onthly Premia (%
)
Figure 3.0 Market, Size, and Value Premia: United Kingdom
-1.5
-1
-0.5
0
0.5
1
1.5
2
2.5
3
S/L S/M S/H B/L B/M B/H
Portfolios
Monthly Prem
ia (%)
International Journal of Business and Economics 174
Table 12. Market, Size, and Value Premia: United Kingdom
Portfolio Market Premia (%) Size Premia (%) Value Premia (%) S/L 0.23
(8.178) −0.27
(7.875) 2.39
(−7.717) S/M 0.19
(7.824) −0.19
(6.651) −0.19
(0.707) S/H 0.20
(8.458) −0.18
(6.603) −1.19
(4.736) B/L 0.19
(7.831) 0.02
(−0.808) 2.44
(−9.141) B/M 0.20
(8.795) −0.01
(0.412) −0.32
(1.307) B/H 0.23
(8.311) −0.06
(1.862) −1.11
(3.712)
4. Conclusions and Investment Implications
In this paper we investigate whether the Fama and French factors are priced. We provide out of sample evidence from three European markets. We show that investors who hold small stocks generate superior returns than investors who hold big stocks with the exception of investors in the UK market; that is, we document a small firm effect in France and Germany and a big firm effect in the UK.
As far as the value premia is concerned our results show otherwise in that we document a growth effect for all three markets investigated in this paper. This is because our findings suggest that growth stocks generate higher returns than value stocks in the markets investigated in this paper. Thus, we challenge the findings of Fama and French (1996) and others who argue that high book-to-market equity firms generate superior returns as they are distressed. It is important to note that our findings have implications for both mean-variance and multifactor mean-variance efficient investors. That is, we suggest that mean-variance efficient investors should simply hold the market portfolio in order to generate superior returns. However, those investors who are willing to take additional risks are advised to shift their portfolios in favor of the characteristics investigated in this paper.
Hence, we argue that investors consider the evidence reported in this paper as it has practical implications for managing portfolios. In summary, our paper provides support for a broader asset pricing model since the major finding is that the beta of the CAPM alone is not sufficient to describe the variation in average equity returns for markets investigated in this paper. Our findings also have implications for portfolio performance and corporate finance in the spirit of cost of capital. We argue that the performance of portfolio managers should be evaluated using the multifactor model rather than the single index model.
Note that Fama and French (1992) state that the performance of managed portfolios can be evaluated by comparing their average returns with the returns of
Mirela Malin and Madhu Veeraraghavan 175
benchmark portfolios with similar firm size and book-to-market equity characteristics. In a similar vein, Elton and Gruber (1995) show that managers hold a wide range of assets (for example, small stocks, bonds, etc.) in addition to large stocks. They state that the other assets, which are not contained in the benchmark index, may perform differently than the benchmark. Thus, they advance the argument that a multifactor conception should be employed for performance evaluation.
As far as corporate finance is concerned we concur with Bishop et al. (2001) who note that small firms present a serious challenge to the application of the CAPM. They state that the betas and the cost of capital might be underestimated for small firms. Given this argument, the next obvious step is to link the size and book-to-market equity effects to economic fundamentals in the spirit of Liew and Vassalou (2000). This is left for future work.
Reference
Banz, R. W., (1981), “The Relationship between Return and Market Value of Common Stocks,” Journal of Financial Economics, 9, 3-18.
Barber, B. M. and J. D. Lyon, (1997), “Firm Size, Book-to-Market Ratio, and Security Returns: A Holdout Sample of Financial Firms,” Journal of Finance, 52, 875-883.
Basu, S., (1983), “The Relationship between Earnings Yield, Market Value, and Return for NYSE Common Stocks,” Journal of Financial Economics, 12, 129-156.
Berk, J. B., (2000), “Sorting Out Sorts,” Journal of Finance, 55, 407-427. Bhandari, L. C., (1988), “Debt/Equity Ratio and Expected Common Stock Returns:
Empirical Evidence,” Journal of Finance, 43, 507-528. Bishop, S. R., H. R. Crapp, R. W. Faff, and G. J. Twite, (2001), Corporate Finance,
Prentice Hall Publishers. Black, F., (1993), “Beta and Return,” Journal of Portfolio Management, 20, 8-18. Brailsford, T. J. and R. Heaney, (1998), “Investments: Concepts and Applications in
Australia,” Harcourt Brace & Co, pp. 449-520. Campbell, J. Y., (2000), “Asset Pricing at the Millennium,” Journal of Finance, 55,
1515-1567. Campbell, J. Y., A. W. Lo, and C. A. MacKinlay, (1997), The Econometrics of
Financial Markets, Princeton: Princeton University Press. Chan, L. K.C., Y. Hamao, and J. Lakonishok, (1991), “Fundamentals and Stock
Returns in Japan,” Journal of Finance, 46, 1739-1764. Cochrane, J. H., (2001), Asset Pricing, Princeton: Princeton University Press. Daniel, K. and S. Titman, (1997), “Evidence on the Characteristics of Cross
Sectional Variation in Stock Returns,” Journal of Finance, 52, 1-33. Daniel, K., S. Titman, and K. C. John Wei, (2001), “Explaining the Cross-Section of
Stock Returns in Japan: Factors or Characteristics?” Journal of Finance, 56, 743-766.

International Journal of Business and Economics 176
Davis, J. L., E. F. Fama, and K. R. French, (2000), “Characteristics, Covariances, and Average Returns: 1929-1997,” Journal of Finance, 55, 389-406.
Elton, E. J. and M. J. Gruber, (1995), Modern Portfolio Theory and Investment Analysis, John Wiley and Sons, Inc.
Fama, E. F. and K. R. French, (1992), “The Cross-Section of Expected Stock Returns,” Journal of Finance, 47, 427-466.
Fama, E. F. and K. R. French, (1993), “Common Risk Factors in the Returns of Stocks and Bonds,” Journal of Financial Economics, 33, 3-56.
Fama, E. F. and K. R. French, (1995), “Size and Book to Market Factors in Earnings and Returns,” Journal of Finance, 50, 131-155
Fama, E. F. and K. R. French, (1996), “Multifactor Explanation of Asset Pricing Anomalies,” Journal of Finance, 51, 55-84.
Fama, E. F. and K. R. French, (1998), “Value versus Growth: The International Evidence,” Journal of Finance, 53, 1975-1999.
Haugen, R. A., (1995), The New Finance: The Case Against Efficient Markets, Englewood Cliffs: Prentice Hall.
Jagannathan, R., K. Kubota, and H. Takehara, (1998), “Relationship between Labor Income Risk and Average Return: Empirical Evidence from the Japanese Stock Market,” Journal of Business, 71, 319-348.
Kothari, S. P., J. Shanken, and R. G. Sloan, (1995), “Another Look at the Cross-Section of Expected Stock Returns,” Journal of Finance, 50, 185-224.
Lakonishok, J., A. Shleifer, and R. W. Vishny, (1994), “Contrarian Investment, Extrapolation, and Risk,” Journal of Finance, 49, 1541-1578.
Liew, J. and M. Vassalou, (2000), “Can Book to Market, Size and Momentum Be Risk Factors That Predict Economic Growth?” Journal of Financial Economics, 57, 221-245.
Lintner, J., (1965), “The Valuation of Risk Assets and the Selection of Risky Investments in Stock Portfolios and Capital Budgets,” Review of Economics and Statistics, 47, 13-37.
MacKinlay, A. C., (1995), “Multifactor Models Do Not Explain Deviation from the CAPM,” Journal of Financial Economics, 38, 3-28.
Malkiel, B. G., (1999), A Random Walk Down Wall Street, New York: W.W. Norton and Company.
Miller, M. H., (1999), “The History of Finance,” Journal of Portfolio Management, 25, 95-101.
Otten, R. and D. Bams, (2002), “European Mutual Fund Performance,” European Financial Management, 8, 75-101.
Pastor, L. and R. F. Stambaugh, (2000), “Comparing Asset Pricing Models: An Investment Perspective,” Journal of Financial Economics, 56, 335-381.
Sharpe, W. F., (1964), “Capital Asset Prices: A Theory of Market Equilibrium under Uncertainty,” Journal of Finance, 19, 425-442.